

Classification of Microscopic Hyperspectral Images of Blood Cells Based on Lightweight Convolutional Neural Network
College of Information Science and Engineering, Hohai University, Nanjing 211100, China
Electronics 2024, 13(8), 1578; https://doi.org/10.3390/electronics13081578
Submission received: 25 March 2024
/
Revised: 14 April 2024
/
Accepted: 18 April 2024
/
Published: 20 April 2024
(This article belongs to the Special Issue Deep Learning Technology for Biomedical Signals and Images Applications)
Abstract
:Hyperspectral imaging has emerged as a novel imaging modality in the medical field, offering the ability to acquire images of biological tissues while simultaneously providing biochemical insights for in-depth tissue analysis. This approach facilitates early disease diagnosis, presenting advantages over traditional medical imaging techniques. Addressing challenges such as the computational burden of existing convolutional neural networks (CNNs) and imbalances in sample data, this paper introduces a lightweight GhostMRNet for the classification of microscopic hyperspectral images of human blood cells. The proposed model employs Ghost Modules to replace conventional convolutional layers and a cascading approach with small convolutional kernels for multiscale feature extraction, aiming to enhance feature extraction capabilities while reducing computational complexity. Additionally, an SE (Squeeze-and-Excitation) module is introduced to selectively allocate weights to features in each channel, emphasizing informative features and efficiently achieving spatial–spectral feature extraction in microscopic hyperspectral imaging. We evaluated the performance of the proposed GhostMRNet and compared it with other state-of-the-art models using two real medical hyperspectral image datasets. The experimental results demonstrate that GhostMRNet exhibits a superior performance, with an overall accuracy (OA), average accuracy (AA), and Kappa coefficient reaching 99.965%, 99.565%, and 0.9925, respectively. In conclusion, the proposed GhostMRNet achieves a superior classification performance at a smaller computational cost, thereby providing a novel approach for blood cell detection.
1. Introduction
Blood analysis is commonly employed as a routine medical diagnostic method, playing a crucial role in the early detection and treatment of numerous diseases. Generally, variations in the content of blood cells and various components in the plasma, as well as morphological changes in blood cells, can provide valuable information when the internal environment of the body undergoes alterations. This aids healthcare professionals in assessing the patient’s condition [1]. Traditional blood cell analysis involves the manual counting and recording of the number of red blood cells, white blood cells, and platelets in blood smears prepared through dilution under a microscope. However, the human eye cannot perform in-depth analyses or differentiate the chemical properties of cells. Prolonged microscopic observation is prone to observer fatigue, increasing the likelihood of misdiagnosis. The advent of blood analysis instruments has partially replaced manual work, allowing for accurate and rapid cell count statistics. Nevertheless, current instruments are not flawless in blood analysis, with errors occurring relatively frequently. Therefore, to ensure the accuracy and reliability of diagnostic results, re-examination is necessary. Moreover, certain pathological cells, such as abnormal lymphocytes, remain undetectable to blood analyzers. The detection of such pathological information is critical and indispensable for the early diagnosis of some diseases [2].
The emergence of hyperspectral imaging technology conveniently addresses the technological gap in the medical field. Derived from multispectral imaging technology, hyperspectral imaging integrates imaging and spectral techniques to capture two-dimensional geometric spatial and one-dimensional spectral information of the target, characterized by a “unified spectrum” feature [3]. Microscopic hyperspectral imaging applies hyperspectral imaging technology to the microscopic domain, combining the characteristics of optical imaging and spectral analysis [4]. It continuously captures images of tissue or cell samples using narrow and contiguous spectral channels covering the visible, infrared, ultraviolet, and other spectral ranges. The rich spectrum contains diagnostic spectral features. The fine differences in the spectral curves can be utilized to discern subtle characteristics of tissue or cell physiology, morphology, and biochemical composition. This technique has advantages in the precise discrimination and early diagnosis of diseases. Furthermore, the computer processing of hyperspectral microscopic image information ensures rapid and high-precision analysis, eliminating the constraints of manual conditions. This guarantees that experimental results are not influenced by subjective factors, maintaining a uniform and reliable discrimination standard.
Microscopic hyperspectral imaging technology has been applied in various aspects of the medical field [5,6], including detecting tumors in the human body [7,8,9], distinguishing normal tissues from cancerous tissues [10,11,12], and facilitating the cytological diagnosis of cancer cells [13,14,15], as well as assisting in the diagnosis and characterization of the central nervous system [16,17,18]. These studies have demonstrated that tissues with similar biochemical compositions are more likely to exhibit similar spectral features. Specific spectral profiles inherent in different cells and tissues, akin to fingerprints, contain subtle differences. Therefore, they can be utilized for the characterization and differentiation of objects, particularly those objects that are challenging to distinguish using traditional microscopic imaging methods.
In the current research landscape of hyperspectral microscopic image classification, the predominant approach adopted by researchers involves the utilization of deep learning techniques for image classification. Long Jonathan and his team [19], recognizing the distinctive features of pathological images, introduced the Fully Convolutional Network (FCN). This network imposes no restrictions on the input size of images, enabling the generation of results identical in size to the input images. Consequently, this innovation elevated image segmentation to the pixel level. Building upon the FCN, the team led by Ranneberger Olaf [20] proposed U-Net, which incorporates up-sampling and down-sampling techniques. Joshua Samuel Raj and colleagues [21] introduced the Opposition-based Crow Search (OSC) algorithm, adept at extracting optimal features from preprocessed images. This algorithm significantly enhances the accuracy, specificity, and sensitivity of medical image diagnostics. Niranjan Balachandar and team [22] improved the detection accuracy of diabetic retinopathy and the classification of chest X-ray images by optimizing parameters such as local training iteration counts, cyclic learning rates, and cyclic weighted losses in the Cyclical Weight Transfer (CWT) framework. In the research applying deep learning and image processing techniques to the classification of human blood cells, scholars have also endeavored to explore and achieve promising results in classification studies based on sparse representation [23] and convolutional neural networks [24].
Although significant progress has been made in the classification of blood cell microscopic hyperspectral images, certain technical deficiencies and challenges still persist. Primarily, the samples within the blood cell dataset exhibit a highly uneven distribution across different categories, posing a challenge for existing CNN architectures to effectively address this issue. Additionally, hyperspectral images typically entail high-dimensional spectral information, leading to elevated data processing and computational costs. Consequently, lightweight network architectures have become crucial for mitigating these challenges. In response to these issues, this paper proposes a lightweight GhostMRNet tailored for the classification of blood cell microscopic hyperspectral images. The primary contributions of this study are delineated as follows:
- (1)
- A lightweight GhostMRNet model is proposed in this study. The model was tested on a real dataset of blood cell microscopic hyperspectral images, achieving an overall classification accuracy, average classification accuracy, and Kappa coefficient of 99.965%, 99.565%, and 0.9925%, respectively. These results substantiate the effectiveness of our proposed approach, underscoring its research value and practical significance in assisting medical professionals in disease diagnosis.
- (2)
- To simultaneously achieve a lightweight design and enhance network feature extraction capability, the GhoMR block was introduced. A Ghost Module replaces conventional convolutional layers, effectively reducing the network’s computational complexity. Multiscale feature extraction is realized through the cascading of convolutional kernels, enhancing network feature extraction capabilities. Additionally, to further augment the feature representation capability and reduce redundant information, the SE module was incorporated to allocate weights to features in each channel, facilitating the fusion of inter-channel features.
- (3)
- To address the issue of imbalanced sample classes, focal loss is employed. By adjusting the weights of the loss function, focal loss focuses on challenging-to-classify samples, contributing to a balanced emphasis on different categories. This enhances the classification accuracy, particularly for rare categories, and mitigates the impact of class imbalance on model training.
2. Related Work
2.1. Ghost Module
The literature [25] posits that redundant feature maps in CNNs exhibit superior classification performances. Consequently, the Ghost Module was introduced as a mechanism to enhance classification efficacy by replacing conventional convolutions with computationally less intensive “inexpensive” linear operations, as depicted in Figure 1. The Ghost Module comprises two steps: in the first step, a limited number of convolutional kernels are employed for standard convolutional operations, generating a subset of feature maps. Subsequently, in the second step, linear operations are applied to the feature maps obtained in the first step, ensuring the generation of additional feature maps while maintaining the same number of channels.
Let the input feature map data be denoted as , with an n-dimensional input as and convolutional output as . In the conventional convolutional process, the computational cost is .
Regarding the linear operations of the Ghost Module, there is one identity mapping and linear operations; with the average kernel size of each linear operation being , the theoretical speedup ratio of replacing the ordinary convolution with the Ghost Module can be expressed as follows:
From the above calculations, it is evident that under the same operation, the Ghost Module reduces computational cost by a factor of compared to ordinary convolution. Overall, the Ghost Module has a light weight through the replacement of a larger convolutional kernel with multiple smaller ones through the strategies of replication and grouping. These reductions in the number of parameters and computational complexity are achieved while preserving network performance. Consequently, the Ghost Module proves to be an effective tool for enhancing network performance in resource-constrained environments.
2.2. SE Block
SENet [26] is a representative channel-wise attention model. Essentially, it leverages contextual feature maps to learn weight distributions, subsequently applying the learned weights to the original feature maps through weighted summation. This process aims to extract information deemed more crucial for the target task.
The principle of the SE block is depicted in Figure 2, comprising three steps: squeeze, excitation, and feature recalibration. The SE block initiates by compressing the feature map with dimensions through global average pooling, reducing it to . This process captures the global context of each channel. Subsequently, a fully connected layer predicts the importance of each channel, yielding weights corresponding to the significance of different channels. Finally, these weights are applied to the corresponding channels of the input feature map, resulting in a feature map with distinct channel-wise weights.
3. Proposed Method
3.1. GhostMRNet
Due to the limited number of samples in the microscopic hyperspectral blood cell data used in this study and the categorization of annotated samples into only two classes, red blood cells and white blood cells, the adoption of excessively deep or complex network structures may have led to overfitting issues. Therefore, based on the principle of simplicity, this paper proposes a lightweight GhostMRNet model for the classification of microscopic hyperspectral blood cell images.
The overall architecture of the network is illustrated in Figure 3. Initially, noise reduction and dimensionality reduction in the hyperspectral images are achieved through median filtering and principal component analysis (PCA). The preprocessed hyperspectral images are then partitioned into image blocks as inputs to the network. Feature extraction is performed initially using a standard 3 × 3 convolutional layer. Subsequently, two GhoMR blocks are employed to extract features at different scales. The GhoMR block employs the Ghost Module instead of conventional convolutions, reducing the number of parameters and computational complexity while maintaining network performance. Multiscale feature extraction is achieved through the cascading of convolutional kernels. Furthermore, an SE block is utilized to recalibrate the weights of features in each channel, learning the correlation between features in different channels and facilitating feature fusion. The introduction of residual connections helps prevent overfitting during deep feature extraction, thereby enhancing classification efficiency and accuracy. The final step involves outputting image prediction results through fully connected layers. To address the issue of imbalanced sample classes, focal loss is employed to balance the model’s focus on different categories and improve the classification accuracy.
3.2. GhoMR
The spectral information in hyperspectral images is rich, and effectively extracting image features while maintaining a lightweight structure poses a challenge. The GhoMR block proposed in this paper employs the Ghost Module instead of conventional convolutional layers, effectively reducing network computational complexity. To achieve multiscale feature extraction, a method involving the cascading of small convolutional kernels is employed instead of large ones, enhancing network nonlinearity while reducing computational load. The Ghost Module utilizes “inexpensive” linear operations to generate similar feature maps, yet the contributions of different feature maps vary. Hence, the SE block was introduced to allocate weights to the features in each channel, selectively emphasizing informative features and suppressing irrelevant channel features.
The overall architecture of the GhoMR block is illustrated in Figure 4. In assuming that the model’s input is , the feature extraction of the GhoMR block is divided into the following three steps:
- (1)
- The extraction of feature is performed using a Ghost Module with a 1 × 1 kernel:
- (2)
- The Spit operation is employed to partition the N feature maps of into four subsets, denoted by , where . Each subset, excluding , is required to undergo processing through a 3 × 3 Ghost Module. The output, , of the preceding Ghost Module undergoes hierarchical fusion through summation with the elements of the current subset, , resulting in the generation of the feature set :where represents summing by elements.
- (3)
- Ultimately, the output mappings , , , and are concatenated along their depth, creating a unified feature block encompassing all information. This consolidated feature block undergoes feature recalibration through a 1 × 1 Ghost Module and an SE block. Subsequently, it is fused with the input through a residual link to generate the final output . This operation is denoted as follows:where represents concatenation, and denotes element-wise summation.
3.3. Focal Loss
Table 1 presents the proportions of two types of blood cell samples. In considering the issue of imbalanced positive and negative classes of red and white blood cells in hyperspectral images, the loss function employed is an improvement upon the Cross-Entropy Loss, known as the focal loss [27]. The formula for the focal loss is given by
Here, denotes the sample labels of the true samples, while represents the predicted sample labels; is used to address the imbalance between positive and negative samples, and is employed to handle the imbalance of easy and difficult samples. Based on debugging experience, was set to 0.6, and was set to 1.
4. Experiments and Discussion
4.1. Dataset Preprocessing
The human blood cell dataset utilized in this study was collected using a microscopic hyperspectral imaging system consisting of a microscope and a silicon charge-coupled device. Blood smears used for dataset collection were provided by the Department of Hematology, Ruijin Hospital, Shanghai Jiaotong University School of Medicine, and stained with Giemsa biological dye. Datasets 1-3 and 2-2 originated from distinct patients, and cellular categorization was performed under the supervision of expert medical professionals. As illustrated in Figure 5, the original size of the 1-3 human blood cell dataset is 974 × 799 × 33, and that of the 1-2 human blood cell dataset is 462 × 451 × 33. On the left, there are single-band dataset images, and on the right, there are data labels. In the label data images, black represents the background, red denotes red blood cells, and white signifies white blood cells. Since background data contribute insignificantly to the classification of red and white blood cells, this study excluded the background during classification, focusing solely on the classification of red and white blood cells. Due to the blurriness of the original images, preprocessing involved the initial application of median filtering and normalization. Subsequently, PCA was employed to reduce the dimensionality of the hyperspectral images.
4.2. Experiment Setting
The GhostMRNet proposed in this paper was implemented using the Python language and the PyTorch deep learning framework. All experiments were conducted on a computer with a 64-bit Windows 10 operating system, 16 GB of RAM, and an NVIDIA GeForce GTX 1660 Ti 6GB GPU Nvidia Corporation, Santa Clara, CA, USA. To mitigate biases introduced by diverse training samples, this paper provides the average results and standard deviation of 10 experiments conducted under identical conditions in self-experimentation, ablation experiments, parameter configuration experiments, and comparative experiments with other models.
To accurately reflect the classification performance of the designed model, stochastic gradient descent was employed as the optimization algorithm with a learning rate set to 0.001, a batch size set to 256, and 50 epochs. In terms of training sample selection, 10% of the training samples were randomly chosen, and the remaining 90% were designated as the test set. To assess the classification accuracy comprehensively, metrics such as the overall accuracy (OA), average accuracy (AA), precision, recall, F1-score, and Kappa coefficient were utilized for the quantitative evaluation of the classification performance.
4.3. Classification Results of GhostMRNet
The GhostMRNet was applied for classification on two hyperspectral images, and the classification results are illustrated in Figure 6 and presented in Table 2. In Figure 6, (a) represents the annotated image generated based on medical experts’ annotations, where black signifies excluded background, red denotes red blood cells, and white signifies white blood cells. Subsequently, (b) displays the classification predictions from GhostMRNet. It is evident that, overall, the predictions from this method exhibit a high degree of alignment with the ground truth labels.
From Table 2, it can be observed that there is minimal difference in the comprehensive evaluation metrics across different images, with an average OA of 99.965% and an average AA of 99.565%. This indicates that the GhostMRNet model exhibits a consistent and excellent classification performance for both cell types, demonstrating its robustness in addressing sample imbalance issues. The average Kappa coefficient of 0.9925 further signifies a high level of consistency between the predicted and true categories, emphasizing the model’s accuracy in classification.
4.4. Experimental Parameters
In the classification of human blood cells based on microscopic hyperspectral imaging, the classification performance is primarily influenced by three factors: window size, the number of principal components, and the proportion of training samples. This subsection will evaluate the impact of different parameter settings on the blood cell classification results through a comparative analysis.
4.4.1. Effect of Window Size
To investigate the impact of window size on the classification results, while keeping other parameters constant, window sizes of 5 × 5, 7 × 7, 9 × 9, and 11 × 11 were employed. The classification results are depicted in Figure 7.
From the experimental results, it is evident that an increase in window size has a positive impact on the classification of human blood cells in two distinct microscopic hyperspectral images. However, when the window size exceeds 9 × 9, the improvement in classification results becomes marginal, accompanied by a substantial increase in computational overhead. Therefore, in this study, the window size was determined to be 9 × 9.
4.4.2. Effect of the Number of Principal Components
To investigate the impact of the dimensionality of reduced data on the classification results, while keeping other parameters constant, the dimensionality of the reduced data was set to 5, 10, 15, and 20, employing PCA. The classification results are illustrated in Figure 8.
From the experimental results, it is observed that the classification performance of the 2-2 blood cell dataset improves with an increase in the PCA dimensionality. For the 1-3 human blood cell dataset, the PCA dimensionality and classification performance exhibit a positive correlation from dimensions 5 to 10. However, when the PCA dimensionality exceeds 10, the classification performance begins to decline. Extremely low dimensions may lead to reductions in the spectral characteristics reflected in the images, while excessively high dimensions may introduce more redundant information, incurring higher computational costs. Moreover, beyond a data dimensionality of 10, there is a limited improvement in the accuracy and Kappa coefficient values. Therefore, reducing the dimensionality to around 10 is a more cost-effective choice.
4.4.3. Effect of Training Ratio
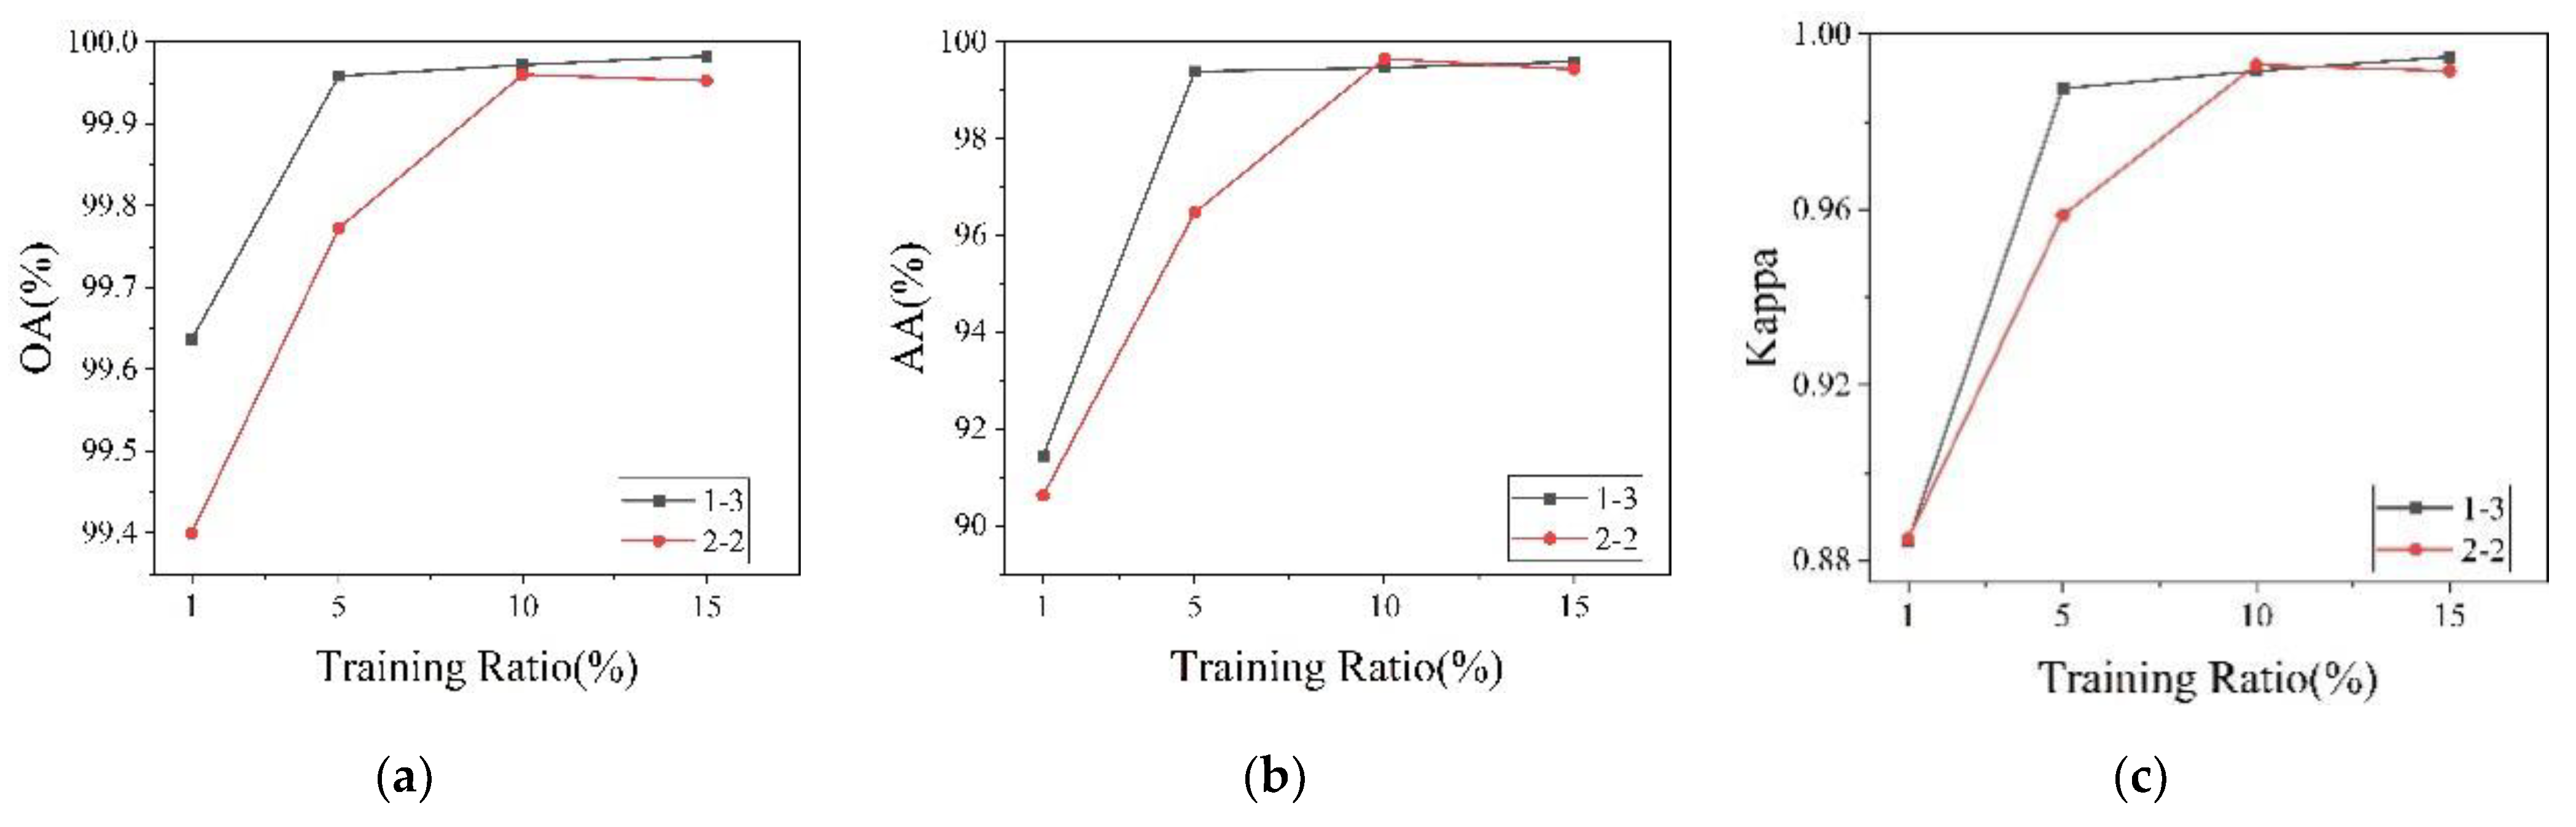
The small-sample problem is a prevalent issue in existing hyperspectral image (HSI) classification methods. To assess the classification performance of GhostMRNet under small training sets, we varied the training set proportions to 5%, 10%, 15%, and 20%. The classification results are depicted in Figure 9.
From the experimental results, it is evident that the proposed classification method maintains good accuracy even in scenarios with small training sets. A substantial improvement in classification performance is observed when the training set proportion increases from 5% to 10%. However, beyond a training set proportion of 10%, the enhancement in classification performance becomes less noticeable. Therefore, considering considerations related to GPU computing power and experimental time, a training set proportion of around 10% was deemed a suitable choice.
4.5. Ablation Experiments
To validate the effectiveness of the proposed GhoMR module, as well as the Ghost Module and SE blocks within the GhoMR module, this study conducted ablation experiments. Experiment 1 replaces the Ghost Module in GhoMRNet with a regular convolutional layer, Experiment 2 removes the SE block from the GhoMR module, and Experiment 4 substitutes the multiscale feature extraction part of the GhoMR module with regular convolutional layers. The experiments utilized the same data set partitioning method and hyperparameter settings, with the network input being preprocessed microscopic hyperspectral image blocks. The results are presented in Table 3 and Table 4.
From Table 3 and Table 4, it can be observed that after incorporating the Ghost Module, the network parameters were reduced by 24%, yet the classification performance did not decrease significantly. This suggests that the Ghost Module can significantly reduce the network parameters without compromising classification performance. After the introduction of multiscale feature extraction in GhoMR, the AAs for 1-3 and 2-2 increased by 0.64% and 0.54%, respectively, and the Kappa coefficients increased by 0.007 and 0.004, indicating that the multiscale structure in the GhoMR effectively enhances feature extraction capabilities, thereby improving the classification performance for minority samples. However, upon the removal of the SE block from the GhoMR module, particularly evident in dataset 2-2, a significant decline in the model performance occurred. This observation indicates that the SE block effectively enhances crucial feature channels extracted through multiscale feature extraction, suppressing redundant features, and thereby enhancing the network’s feature extraction capability.
4.6. Comparison Results of Different Methods
To further evaluate the classification performance of the proposed model on microscopic hyperspectral images, this subsection compares it with those of GhostNet [25], ResNet34 [28], a CNN-based classification model [24], and a SVM.
In the CNN-based classification model [24], there were eight weighted layers, including the input layer, two convolutional layers, two max-pooling layers, two fully connected layers, and a final output layer. The parameters for each layer were set as follows: in the second layer, the number of convolutional filters was 16, and the filter size was 3 × 3; in the third layer, the pooling layer filter size was 3 × 3; in the fourth layer, the number of convolutional filters was 32, and the filter size was 3 × 3; in the fifth layer, the pooling layer filter size was 3 × 3; and the numbers of neurons in the sixth and seventh layers were 256 and 2, respectively. The same preprocessing and experimental parameter settings as in the baseline experiment were applied to each model. The experimental results are shown in Table 5 and Table 6, and Figure 10 and Figure 11 depict the classification results of different algorithms on microscopic hyperspectral images, where green in (f) represents the prediction of white blood cells.
From the figures, it can be observed that GhostMRNet and ResNet34 exhibit superior classification performances, while GhostNet and the CNN-based classification model [24] struggled to identify white blood cells. The SVM model shows a poorer classification performance, especially in the case of dataset 1-3, where it failed to effectively classify red and white blood cells.
Table 5 and Table 6 indicate that, under the same focal loss framework, when faced with highly imbalanced class distributions, GhostNet and the CNN-based classification model [24] both struggle to perform well, particularly in recognizing white blood cells. On the other hand, the SVM suffered from severe overfitting and could not correctly distinguish between red and white blood cells. In contrast, GhostMRNet, which accurately classified red and white blood cells, outperformed ResNet34 in all evaluation metrics. This demonstrates that the proposed GhostMRNet, utilizing multiscale feature extraction, effectively captures the features of a small amount of data, achieving excellent performances in the classification of imbalanced human blood cell datasets.
5. Discussion
Blood detection is crucial for the early detection and treatment of many diseases. Although existing blood analyzers can accurately and rapidly perform cell counts, they still fall short of perfecting blood analysis. Microscopic hyperspectral imaging provides spatial and spectral information to assist in blood detection. In this study, we propose a lightweight end-to-end network that utilizes multiscale feature extraction and SE modules to extract the spatial and channel features of microscopic hyperspectral images, while employing Ghost Modules to reduce network parameters, effectively achieving blood cell classification. We conducted extensive experiments to evaluate the effectiveness of our model. Compared to other well-known networks, the proposed network achieves better performances. The experimental results demonstrate the helpfulness of GhoMR’s design and the introduction of SE modules.
Despite our model outperforming others, there are still limitations. During data preprocessing, we employed PCA for dimensionality reduction to reduce spectral redundancy and computational load. PCA is an effective dimensionality reduction method, but its linear transformation disrupts the original spatial geometry of medical hyperspectral images, which may have undesirable effects on the dimensionality reduction. Therefore, incorporating blood cell biochemical properties into band selection for medical hyperspectral images would be a better dimensionality reduction approach.
6. Conclusions
This study primarily addresses the human blood cell classification issue based on microscopic hyperspectral imaging. A lightweight GhostMRNet model was proposed for the classification of microscopic hyperspectral images of blood cells. The GhoMR block uses Ghost Modules instead of conventional convolutional layers and employs a cascading approach with small convolutional kernels to achieve multiscale feature extraction, aiming to enhance network feature extraction capabilities while reducing computational complexity. Additionally, the SE block was introduced to allocate weights to features in each channel, selectively emphasizing informative features while suppressing less crucial channel features. The GhoMR block effectively extracts spatial and spectral features from microscopic hyperspectral images, yielding an improved classification performance with lower computational costs.
Several comparative experiments were conducted in this study. Firstly, by comparing models with and without the GhoMR block, as well as GhoMR blocks without multiscale feature extraction, the effectiveness of the GhoMR block in reducing network parameters while enhancing the classification performance was demonstrated. Secondly, through comparisons with other deep learning and machine learning methods, the results indicate that GhostMRNet exhibits a superior classification performance in blood cell hyperspectral image tasks, with lower computational costs, demonstrating robustness.
It is worth noting that the experiments in this study were conducted solely on two microscopic hyperspectral images of blood cells from the same time period. Future research could further develop experiments using blood cell hyperspectral datasets from different time periods to comprehensively assess the model’s performance and enhance its practical application value in medical diagnosis.
Funding
This research was supported by the National Undergraduate Training Program for Innovation and Entrepreneurship under Grant 202310294055Z.
Data Availability Statement
The dataset was produced by the Shanghai Key Laboratory of Multidimensional Information Processing, East China Normal University, and the collected blood smears in the dataset were provided by the Department of Hematology, Ruijing Hospital, Shanghai Jiaotong University School of Medicine.
Conflicts of Interest
The author declares no conflicts of interest.
References
- Saleem, S.; Amin, J.; Sharif, M.; Mallah, G.A.; Kadry, S.; Gandomi, A.H. Leukemia segmentation and classification: A comprehensive survey. Comput. Biol. Med. 2022, 150, 106028. [Google Scholar] [CrossRef] [PubMed]
- Luo, S.; Shi, Y.; Chin, L.K.; Hutchinson, P.E.; Zhang, Y.; Chierchia, G.; Talbot, H.; Jiang, X.; Bourouina, T.; Liu, A.Q. Machine-Learning-Assisted Intelligent Imaging Flow Cytometry: A Review. Adv. Intell. Syst. 2021, 3, 2100073. [Google Scholar] [CrossRef]
- Fauvel, M.; Tarabalka, Y.; Benediktsson, J.A.; Chanussot, J.; Tilton, J.C. Advances in Spectral-Spatial Classification of Hyperspectral Images. Proc. IEEE 2013, 101, 652–675. [Google Scholar] [CrossRef]
- Landgrebe, D. Hyperspectral image data analysis. IEEE Signal Process. Mag. 2002, 19, 17–28. [Google Scholar] [CrossRef]
- Calin, M.A.; Parasca, S.V.; Savastr, D.; Manea, D. Hyperspectral imaging in the medical field: Present and future. Appl. Spectrosc. Rev. 2014, 49, 435–447. [Google Scholar] [CrossRef]
- Lu, G.; Fei, B. Medical hyperspectral imaging: A review. J. Biomed. Opt. 2014, 19, 10901. [Google Scholar] [CrossRef] [PubMed]
- Panasyuk, S.V.; Yang, S.; Faller, D.V.; Ngo, D.; Lew, A.R.; Freeman, J.E.; Rogers, A.E. Medical hyperspectral imaging to facilitate residual tumor identification during surgery. Cancer Biol. Ther. 2007, 6, 439–446. [Google Scholar] [CrossRef] [PubMed]
- Peyret, R.; Bouridane, R.; Khelifi, F.; Tahir, M.A.; Al-Maadeed, S. Automatic classification of colorectal and prostatic histologic tumor images using multiscale multispectral local binary pattern texture features and stacked generalization. Neurocomputing 2018, 275, 83–93. [Google Scholar] [CrossRef]
- Nakaya, D.; Tomiyama, Y.; Satori, S.; Saegusa, M.; Yoshida, T.; Yokoi, A.; Kano, M. Development of high-performance pathological diagnosis software using a hyperspectral camera. In Proceedings of the 2018 IEEE-EMBS Conference on Biomedical Engineering and Sciences (IECBES), Sarawak, Malaysia, 3–6 December 2018; pp. 217–220. [Google Scholar]
- Martin, M.E.; Wabuyele, M.B.; Chen, K.; Kasili, P.; Panjehpour, M.; Phan, M.; Overholt, B.; Cunningham, G.; Wilson, D.; DeNovo, R.C.; et al. Development of an advanced hyperspectral imaging (HSI) system with applications for cancer detection. Ann. Biomed. Eng. 2006, 34, 1061–1068. [Google Scholar] [CrossRef]
- Khouj, Y.; Dawson, J.; Coad, J.; Vona-Davis, L. Hyperspectral imaging and K-means classification for histologic evaluation of ductal carcinoma in situ. Front. Oncol. 2018, 8, 17. [Google Scholar] [CrossRef]
- Irshad, H.; Gouaillard, A.; Roux, L.; Racoceanu, D. Multispectral band selection and spatial characterization: Application to mitosis detection in breast cancer histopathology. Comput. Med. Imaging Graph. 2014, 38, 390–402. [Google Scholar] [CrossRef] [PubMed]
- Bautista, P.A.; Hashimoto, N.; Yagi, Y. Color standardization in whole slide imaging using a color calibration slide. J. Pathol. Inform. 2014, 5, 4. [Google Scholar] [CrossRef] [PubMed]
- Liu, X.; Zhou, M.; Qiu, S.; Sun, L.; Liu, H.; Li, Q.; Wang, Y. Adaptive and automatic red blood cell counting method based on microscopic hyperspectral imaging technology. J. Opt. 2017, 19, 124014. [Google Scholar] [CrossRef]
- Duan, Y.; Wang, J.; Hu, M.; Zhou, M.; Li, Q.; Sun, L.; Qiu, S.; Wang, Y. Leukocyte classification based on spatial and spectral features of microscopic hyperspectral images. Opt. Laser Technol. 2019, 112, 530–538. [Google Scholar] [CrossRef]
- Li, Q.; Xu, D.; He, X.; Wang, Y.; Chen, Z.; Liu, H.; Xu, Q.; Guo, F. AOTF based molecular hyperspectral imaging system and its applications on nerve morphometry. Appl. Opt. 2013, 52, 3891–3901. [Google Scholar] [CrossRef] [PubMed]
- More, S.S.; Vince, R. Hyperspectral imaging signatures detect amyloidopathy in Alzheimer’s mouse retina well before onset of cognitive decline. ACS Chem. Neurosci. 2015, 6, 306–315. [Google Scholar] [CrossRef] [PubMed]
- Li, Q.; Xue, Y.; Zhang, J.; Xiao, G. Microscopic hyperspectral imaging studies of normal and diabetic retina of rats. Sci. China Ser. C Life Sci. 2008, 51, 789–794. [Google Scholar] [CrossRef] [PubMed]
- Shelhamer, E.; Long, J.; Darrell, T. Fully convolutional networks for semantic segmentation. In Proceedings of the IEEE Conference on Computer Vision and Pattern Recognition, Boston, MA, USA, 7–12 June 2015; Volume 39, pp. 640–651. [Google Scholar]
- Ronneberger, O.; Fischer, P.; Brox, T. U-Net: Convolutional Networks for Biomedical Image Segmentation; Springer International Publishing: Cham, Swizerland, 2015; pp. 234–241. [Google Scholar]
- Raj, R.J.S.; Shobana, S.J.; Pustokhina, I.V.; Pustokhin, D.A.; Gupta, D.; Shankar, K. Optimal Feature Selection-Based Medical Image Classification Using Deep Learning Model in Internet of Medical Things. IEEE Access 2020, 8, 58006–58017. [Google Scholar] [CrossRef]
- Balachandar, N.; Chang, K.; Kalpathy-Cramer, J.; Rubin, D.L. Accounting for data variability in multi-institutional distributed deep learning for medical imaging. J. Am. Med. Inform. Assoc. JAMIA 2020, 27, 700–708. [Google Scholar] [CrossRef] [PubMed]
- Chang, L.; Li, W.; Li, Q. Guided filter-based medical hyperspectral image restoration and cell classification. J. Med. Imaging Health Inform. 2018, 8, 825–834. [Google Scholar] [CrossRef]
- Li, X.; Li, W.; Xu, X.; Hu, W. Cell classification using convolutional neural networks in medical hyperspectral imagery. In Proceedings of the 2017 2nd International Conference on Image, Vision and Computing (ICIVC), Chengdu, China, 2–4 June 2017; pp. 501–504. [Google Scholar] [CrossRef]
- Han, K.; Wang, Y.; Tian, Q.; Guo, J.; Xu, C.; Xu, C. GhostNet: More Features From Cheap Operations. In Proceedings of the 2020 IEEE/CVF Conference on Computer Vision and Pattern Recognition (CVPR), Seattle, WA, USA, 13–19 June 2020; pp. 1577–1586. [Google Scholar] [CrossRef]
- Hu, J.; Shen, L.; Albanie, S.; Sun, G.; Wu, E. Squeeze-and-Excitation Networks. IEEE Trans. Pattern Anal. Mach. Intell. 2020, 42, 2011–2023. [Google Scholar] [CrossRef] [PubMed]
- Lin, T.Y.; Goyal, P.; Girshick, R.; He, K.; Dollár, P. Focal Loss for Dense Object Detection. In Proceedings of the 2017 IEEE International Conference on Computer Vision (ICCV), Venice, Italy, 22–29 October 2017; pp. 2999–3007. [Google Scholar] [CrossRef]
- He, K.; Zhang, X.; Ren, S.; Sun, J. Deep Residual Learning for Image Recognition. In Proceedings of the 2016 IEEE Conference on Computer Vision and Pattern Recognition (CVPR), Las Vegas, NV, USA, 27–30 June 2016; pp. 770–778. [Google Scholar] [CrossRef]
Figure 1.
Structure of Ghost Module.

Figure 2.
Structure of SE block.

Figure 3.
Structure of GhostMRNet.

Figure 4.
Structure of GhoMR.

Figure 5.
Single-band images and ground truth labels of blood cell hyperspectral images (images on the left are single-band images, and those on the right are the ground truth labels). (a) Single-band image and ground truth label of blood cell 1-3; (b) single-band image and ground truth label of blood cell 2-2.

Figure 6.
Classification result of GhostMRNet ((a,b) represent the label map and classification results for blood cells 1-3, while (c,d) represent the label map and classification results for blood cells 2-2).
Figure 6.
Classification result of GhostMRNet ((a,b) represent the label map and classification results for blood cells 1-3, while (c,d) represent the label map and classification results for blood cells 2-2).

Figure 7.
Classification results of different window sizes. (a) OA; (b) AA; (c) Kappa.

Figure 8.
Classification results of different numbers of principle components. (a) OA; (b) AA; (c) Kappa.
Figure 8.
Classification results of different numbers of principle components. (a) OA; (b) AA; (c) Kappa.

Figure 9.
Classification results of different training ratios. (a) OA; (b) AA; (c) Kappa.

Figure 10.
Classification results of blood cell 1-3 ((a) ground truth label; (b) GhostMRNet, OA = 99.97%; (c) GhostNet, OA = 99.71%; (d) ResNet, OA = 99.96%: (e) CNN, OA = 99.89%; (f) SVM, OA = 98.39%).
Figure 10.
Classification results of blood cell 1-3 ((a) ground truth label; (b) GhostMRNet, OA = 99.97%; (c) GhostNet, OA = 99.71%; (d) ResNet, OA = 99.96%: (e) CNN, OA = 99.89%; (f) SVM, OA = 98.39%).

Figure 11.
Classification results of blood cell 2-2 ((a) ground truth label; (b) GhostMRNet, OA = 99.96%; (c) GhostNet, OA = 99.01%; (d) ResNet, OA = 99.93%; (e) CNN, OA = 99.52%; (f) SVM, OA = 97.81%).
Figure 11.
Classification results of blood cell 2-2 ((a) ground truth label; (b) GhostMRNet, OA = 99.96%; (c) GhostNet, OA = 99.01%; (d) ResNet, OA = 99.93%; (e) CNN, OA = 99.52%; (f) SVM, OA = 97.81%).


Table 1.
The proportions of red and white blood cell samples.
| Bloodcell1-3 | Bloodcell2-2 | |||
|---|---|---|---|---|
| Class | Quantity | Proportion | Quantity | Proportion |
| Red cells | 519,378 | 66.74% | 147,482 | 70.78% |
| White cells | 9010 | 1.16% | 4446 | 2.13% |
| Background | 249,838 | 32.10% | 56,434 | 27.09% |
| Total | 778,226 | 208,362 | ||
Table 2.
Classification results of GhostMRNet.
| Dataset | Class | Precision (%) | Recall (%) | F1-Score (%) | OA (%) | AA (%) | Kappa (%) |
|---|---|---|---|---|---|---|---|
| 1-3 | RBC | 99.98 | 99.99 | 99.98 | 99.97 ± 0.0078 | 99.47 ± 0.0195 | 99.23 ± 0.0237 |
| WBC | 99.41 ± 0.0008 | 98.15 ± 0.0056 | 99.18 ± 0.0031 | ||||
| 2-2 | RBC | 99.98 | 99.98 | 99.98 | 99.96 ± 0.0064 | 99.66 ± 0.1392 | 99.31 ± 0.1161 |
| WBC | 99.30 ± 0.0007 | 99.30 ± 0.0027 | 99.32 ± 0.0011 |
Noted: The standard deviation is retained to four decimal places.
Table 3.
Classification results of ablation experiments on dataset 1-3.
| Model | Ghost Module | SE Block | GhoMR | OA (%) | AA (%) | Kappa (%) | Parameters |
|---|---|---|---|---|---|---|---|
| 1 | √ | √ | 99.98 ± 0.0542 | 99.78 ± 0.0018 | 99.44 ± 0.1494 | 14,906 | |
| 2 | √ | √ | 99.71 ± 0.0349 | 93.62 ± 1.4775 | 91.09 ± 1.2009 | 10,812 | |
| 3 | √ | √ | √ | 99.97 ± 0.0078 | 99.47 ± 0.0195 | 99.23 ± 0.0237 | 11,324 |
| 4 | 99.95 ± 0.0049 | 98.83 ± 0.1598 | 98.48 ± 0.1494 | 8634 |
Table 4.
Classification results of ablation experiments on dataset 2-2.
| Model | Ghost Module | SE Block | GhoMR | OA (%) | AA (%) | Kappa (%) | Parameters |
|---|---|---|---|---|---|---|---|
| 1 | √ | √ | 99.96 ± 0.0050 | 99.78 ± 0.0310 | 99.28 ± 0.0876 | 14,906 | |
| 2 | √ | √ | 99.01 ± 0.1862 | 86.77 ± 4.9514 | 80.50 ± 5.2525 | 10,812 | |
| 3 | √ | √ | √ | 99.96 ± 0.0064 | 99.66 ± 0.1392 | 99.31 ± 0.1161 | 11,324 |
| 4 | 99.94 ± 0.0041 | 99.12 ± 0.0696 | 98.72 ± 0.0726 | 8634 |
Table 5.
Classification results of different models on dataset 1-3.
| Model | Class | Precision (%) | Recall (%) | F1-Score (%) | OA (%) | AA% | Kappa |
|---|---|---|---|---|---|---|---|
| GhostMRNet | RBC | 99.98 | 99.99 | 99.98 | 99.97 ± 0.0078 | 99.47 ± 0.0195 | 99.23 ± 0.0237 |
| WBC | 99.41 ± 0.0008 | 98.15 ± 0.0056 | 99.18 ± 0.0031 | ||||
| GhostNet | RBC | 99.78 ± 0.0005 | 99.93 ± 0.0003 | 99.86 ± 0.0001 | 99.71 ± 0.0349 | 93.62 ± 14,775 | 91.09 ± 1.2009 |
| WBC | 95.66 ± 0.0194 | 87.31 ± 0.0298 | 91.24 ± 0.0118 | ||||
| ResNet | RBC | 99.98 | 99.99 | 99.98 | 99.96 ± 0.0040 | 99.29 ± 0.1084 | 98.94 ± 0.1208 |
| WBC | 99.33 ± 0.0004 | 98.61 ± 0.0021 | 98.97 ± 0.0011 | ||||
| CNN | RBC | 99.93 | 99.965 | 99.95 | 99.89 ± 0.0124 | 97.86 ± 0.3294 | 96.76 ± 0.3828 |
| WBC | 97.91 ± 0.0028 | 95.76 ± 0.0021 | 96.82 ± 0.0037 | ||||
| SVM | RBC | 99.91 ± 0.0034 | 99.96 ± 0.0007 | 99.94 ± 0.0020 | 98.39 ± 0.3443 | 62.58 ± 2.2792 | 24.67 ± 1.6997 |
| WBC | 61.35 ± 0.0562 | 16.22 ± 0.2912 | 25.83 ± 0.2835 |
Noted: Bold font indicates the optimal results, and the standard deviation is retained to four decimal places.
Table 6.
Classification results of different models on dataset 2-2.
| Model | Class | Precision (%) | Recall (%) | F1-Score (%) | OA (%) | AA% | Kappa |
|---|---|---|---|---|---|---|---|
| GhostMRNet | RBC | 99.98 | 99.98 | 99.98 | 99.96 ± 0.0064 | 99.66 ± 0.1392 | 99.31 ± 0.1161 |
| WBC | 99.30 ± 0.0007 | 99.30 ± 0.0027 | 99.32 ± 0.0011 | ||||
| GhostNet | RBC | 99.22 ± 0.0029 | 99.77 ± 0.0012 | 99.49 ± 0.0009 | 99.01 ± 0.1862 | 86.77 ± 4.9514 | 80.50 ± 5.2525 |
| WBC | 91.34 ± 0.0363 | 73.76 ± 0.1001 | 80.99 ± 0.0517 | ||||
| ResNet | RBC | 99.96 | 99.97 | 99.96 | 99.93 ± 0.0063 | 99.29 ± 0.0681 | 98.72 ± 0.1097 |
| WBC | 98.90 ± 0.0027 | 98.63 ± 0.0014 | 98.76 ± 0.0011 | ||||
| CNN | RBC | 99.62 ± 0.0003 | 99.89 ± 0.0002 | 99.75 ± 0.0002 | 99.52 ± 0.0473 | 93.52 ± 0.5507 | 91.11 ± 0.8877 |
| WBC | 95.99 ± 0.0083 | 87.15 ± 0.0108 | 91.35 ± 0.0086 | ||||
| SVM | RBC | 98.42 ± 0.0041 | 99.93 ± 0.0005 | 99.91 ± 0.0019 | 97.81 ± 0.6341 | 76.54 ± 4.7007 | 52.66 ± 4.7061 |
| WBC | 70.02 ± 0.1129 | 43.85 ± 0.1531 | 54.06 ± 0.1424 |
Noted: Bold font indicates the optimal results, and the standard deviation is retained to four decimal places.
Disclaimer/Publisher’s Note: The statements, opinions and data contained in all publications are solely those of the individual author(s) and contributor(s) and not of MDPI and/or the editor(s). MDPI and/or the editor(s) disclaim responsibility for any injury to people or property resulting from any ideas, methods, instructions or products referred to in the content. |
© 2024 by the author. Licensee MDPI, Basel, Switzerland. This article is an open access article distributed under the terms and conditions of the Creative Commons Attribution (CC BY) license (https://creativecommons.org/licenses/by/4.0/).
Share and Cite
MDPI and ACS Style
Fang, J. Classification of Microscopic Hyperspectral Images of Blood Cells Based on Lightweight Convolutional Neural Network. Electronics 2024, 13, 1578. https://doi.org/10.3390/electronics13081578
AMA Style
Fang J. Classification of Microscopic Hyperspectral Images of Blood Cells Based on Lightweight Convolutional Neural Network. Electronics. 2024; 13(8):1578. https://doi.org/10.3390/electronics13081578
Chicago/Turabian StyleFang, Jinghui. 2024. "Classification of Microscopic Hyperspectral Images of Blood Cells Based on Lightweight Convolutional Neural Network" Electronics 13, no. 8: 1578. https://doi.org/10.3390/electronics13081578
Note that from the first issue of 2016, this journal uses article numbers instead of page numbers. See further details here.