
Revealing IoT Cryptographic Settings through Electromagnetic Side-Channel Analysis

1
Forensics and Security Research Group, School of Computer Science, University College Dublin, D04 V1W8M Dublin, Ireland
2
School of Computing, University of Colombo, Colombo 00700, Sri Lanka
*
Author to whom correspondence should be addressed.
Electronics 2024, 13(8), 1579; https://doi.org/10.3390/electronics13081579
Submission received: 15 March 2024
/
Revised: 4 April 2024
/
Accepted: 10 April 2024
/
Published: 20 April 2024
(This article belongs to the Special Issue Digital Security and Privacy Protection: Trends and Applications)
Abstract
:The advancement of cryptographic systems presents both opportunities and challenges in the realm of digital forensics. In an era where the security of digital information is crucial, the ability to non-invasively detect and analyze cryptographic configurations has become significant. As cryptographic algorithms become more robust with longer key lengths, they provide higher levels of security. However, non-invasive side channels, specifically through electromagnetic (EM) emanations, can expose confidential cryptographic details, thus presenting a novel solution to the pressing forensic challenge. This research delves into the capabilities of EM side-channel analysis (EM-SCA), specifically focusing on detecting both cryptographic key lengths and the algorithms employed utilizing a machine-learning-based approach, which can be instrumental for digital forensic experts during their investigations. Through meticulous data processing and analysis, the Support Vector Machine (SVM) model, among others, demonstrated a notable accuracy of 94.55% in distinguishing between AES and ECC cryptographic operations. This capability significantly enhances digital forensic methodologies, offering a novel avenue for noninvasively uncovering encrypted data’s cryptographic settings. By identifying key lengths and algorithms without invasive procedures, this research contributes substantially to the advancement of forensic investigations in encrypted environments.
1. Introduction
Digital forensics plays a critical role in today’s legal investigations. Specifically, it focuses on extracting and analyzing digital data to be used as evidence in investigations. With the increase in Internet of Things (IoT) devices, the field of digital forensics faces new challenges. These devices, equipped with various sensors and ways to connect, are now a part of daily life. Consequently, they often store information that can play a critical role as evidence in investigations, such as cryptography-related events, firmware versions, firmware modifications, and device behavioral states [1]. However, standard digital forensic methods often struggle to retrieve this information, especially when the data inside these devices are encrypted.
One of the primary obstacles facing lawful digital forensic investigation is the inability to investigate encrypted data [2,3]. Although cryptographic methods enhance security, they concurrently hinder forensic investigations, under warrant, that need to access these data. Techniques such as differential electromagnetic analysis (DEMA) and correlation electromagnetic analysis (CEMA) are well-established cryptographic key retrieval methods that leverage electromagnetic side-channel analysis (EM-SCA). EM-SCA, at its core, examines the electromagnetic (EM) signals emitted by electronic devices during their operation. Intriguingly, the pattern of these signals can change according to the exact internal operation of the device, potentially revealing confidential details, such as cryptographic keys [4]. EM-SCA is distinctive because it non-intrusively observes a device, leaving the internal operations of the device intact. This makes it a plausible tool for extracting keys from a vast array of devices, especially IoT devices.
However, the application of DEMA and CEMA effectively requires prior understanding of the cryptographic settings at play, such as the exact algorithm and its key length. Detecting both the algorithm and its key length is a significant indicator of any successful cryptographic breaking endeavor in digital forensic contexts. While some may argue that forensic investigators could straightforwardly consult the device manufacturer’s manual, documentation, or source code to identify the operating procedures for cryptography, one cannot overlook potential modifications. Firmware in devices could undergo alterations by regular end-users or even by malicious entities, thereby adding layers of complexity to the investigator’s key retrieval mission. In such scenarios, having an assured method to verify the algorithm and its key length is significant. This research explores a new approach using EM-SCA to address the challenge of extracting cryptographic keys from IoT devices, with an Arduino Nano serving as a representative of IoT hardware.
To understand the underlying principles of EM-SCA, it is essential to explore the characteristics of EM radiation. EM radiation is strongly tied to human existence and generated by various electrical systems, including mobile phones, the IoT, wearable devices, communication base stations, electronic devices, and other EM technology [5]. It is a form of energy that is produced when electricity is transmitted through a conductive material. Using this characteristic of EM radiation, this research focuses on analyzing unintentional EM radiation of IoT hardware platforms to reveal their internal cryptographic settings. With software-defined radio (SDR) tools, such as HackRF One, these EM signals can be captured and studied as the target device operates. By analyzing these signals, it is possible to learn about the device’s activities, especially when performing cryptographic tasks.
The primary objective of this work is to demonstrate the potential of EM-SCA in the field of digital forensics, highlighting its capability to identify key length and cryptographic algorithms from such representative devices. This exploration further addresses the sophisticated interaction between digital forensics and cryptographic vulnerabilities, underscoring the significant techniques that enhance forensic capabilities and expose cryptographically secure evidence.
Consider a scenario of an IP camera, commonly employed in surveillance and frequently encountered in crime scenes. Such devices continuously capture, record, and encrypt data, posing unique challenges in cryptographic analysis and key recovery. Understanding the encryption algorithm and key length in devices like IP cameras is a crucial preliminary step in forensic investigations, laying the foundation for subsequent decryption and data retrieval efforts. In forensic investigations of such a device, it is necessary to have methods to quickly detect the cryptographic algorithm and its key length involved in the device through non-invasive means. The presented approach in this work can play a major role in the initial step towards cryptographic key recovery.
In addressing the challenges posed by encrypted data in IoT devices, this research introduces a novel methodology utilizing EM-SCA to discern cryptographic key lengths and the algorithms employed in IoT devices, with the Arduino Nano serving as a representative model. By leveraging a data processing pipeline alongside advanced machine learning techniques, specifically Support Vector Machine (SVM) and Logistic Regression, this study not only fills a critical gap in digital forensics but also significantly enhances the detection and analysis of cryptographic operations. This approach marks a substantial advancement towards non-invasively uncovering cryptographic settings, laying the groundwork for future efforts in cryptographic key retrieval. The implications of this work extend into the realm of digital forensics, offering a more robust and sophisticated methodology for forensic investigations and potentially revolutionizing how encrypted evidence is approached and analyzed.
Following this introduction, the paper is structured as follows: Section 2 reviews the background and the existing literature on EM-SCA and its role in digital forensics. Section 3 details the methodology employed in this study, including the experimental setup, data collection, and machine learning techniques used. Section 4 discusses the findings of the research, emphasizing the detection capabilities of EM-SCA in identifying cryptographic details of IoT devices. Section 5 explores the broader implications of these findings for digital forensic investigations and suggests directions for future research. Finally, Section 6 concludes the paper, summarizing this study’s contributions and its potential impact on the field of digital forensics.
2. Background
EM phenomena, an inherent property of electronic devices, have become an area of increasing investigation in the realm of cybersecurity. While EM noise has long been recognized for its potential to interfere with the operation of electronic devices, its ability to inadvertently leak critical information about device operations has turned it into a double-edged sword [6]. The operation of other electronic devices in the same environment can be hampered by the emission of EM noise, which is often encountered in electrical device-busy environments. The presence of EM noise can negatively affect the functionality of electronic components in the environment due to the electrical and magnetic fields of these components interfering with each other. The performance and security of electrical systems can be impacted by two types of electromagnetic interference (EMI): unintentional and intentional. Unintentional EMI refers to the emissions from electrical equipment as a by-product of regular operation, while intentional EMI refers to deliberate emissions with the intention of disrupting equipment.
In 1996, Kocher [7] defined various types of SCAs that attackers can use to access cryptographic devices. SCAs gather data on a system’s internal operational activity without using the system’s standard interfaces. SCAs are a subset of implementation attacks that exploit vulnerabilities in a device’s physical implementation rather than attacking the mathematical strength of a cryptographic algorithm. In order to discover internal computations, SCAs use external representations including the processing time, power consumption, and EM emissions [8,9,10,11]. SCAs are often passive, which allows the attacker to use them without drawing attention to themselves or physically arming the system of interest.
Sayakkara et al. [12] explored the use of EM-SCA to detect cryptographic activity in IoT devices by focusing on the EM emissions produced by a Raspberry Pi. This study aimed to automatically detect the data encryption operations performed by the device using AES-128, AES-256, and 3DES cryptographic algorithms. The results showed that a neural network classifier could discriminate between these encryption techniques with 80% accuracy, demonstrating the potential of EM-SCA as a tool for detecting cryptographic operations and suggesting its application to detect encryption algorithms on less capable hardware devices.
Recent advancements in EM-SCA have furthered its application in cryptographic analysis. In 2018, [13] showcased the retrieval of an AES cryptographic circuit’s secret key using a deep-learning-based side-channel attack, correlating EM emissions with power noise and highlighting vulnerabilities in the AES sub-byte (S-box) layer. Kumar et al. [14] developed a simulation setup for differential electromagnetic analysis of cryptographic modules, employing industry-standard CAD tools for efficient transistor-level simulations, focusing on EM radiation from power/ground interconnects. Iyer and Yilmaz [15] introduced an F-statistic analysis to accelerate EM-SCA attacks, notably in optimizing probe configurations for key retrieval from FPGA implementations of AES-128. Similarly, Won and Bhasin [9] used a high-sensitivity EM sensor along with a correlation power analysis to successfully retrieve the AES-128 key, demonstrating the capability of EM-SCA in sophisticated encryption scenarios. These studies collectively advance the understanding of EM-SCA in cryptographic analysis, predominantly focusing on key retrieval.
In the fields of SCA and cryptography, preprocessing is a vital stage in increasing attack effectiveness, since it is frequently utilized to boost attack success [16,17]. The sample size of the EM-SCA can be continuously expanded to increase the success rate, but this may result in a lengthy cracking time, limiting the viability of the EM-SCA. To illustrate, the 128-bit AES algorithm, which must be processed 16 times for each byte’s sub-keys, is one example of an algorithm that must process data once for each byte’s sub-keys in order to be cracked [18,19].
EM traces may not correctly encompass the cryptographic operation within its perimeter and have varying lengths for various reasons. Sayakkara et al. [12] identified two reasons why labeled EM trace data are unsuitable for direct use in machine-learning-based classification: the intrinsic variation in the amount of time needed to complete each cryptographic computation and the delays in data collection software to initiate and terminate EM sampling. However, by converting EM traces into the frequency domain using the fast Fourier transformation (FFT) [20,21], the discrepancies in lengths can be minimized.
The process of data gathering and processing is challenging due to the large file sizes of EM trace data and the need for real-time analysis. Software-defined radio (SDR) devices capture EM data and can differentiate signals in the frequency domain by capturing a large bandwidth around the target frequency. However, their high sampling rates result in large file sizes for EM trace data. To address this issue, Sayakkara et al. [12] suggest down-sampling the data while maintaining the maximum possible bandwidth, which does not negatively impact the performance. The authors highlight the need for real-time analysis in live forensic analysis, where data preprocessing and classification must be performed within a tight time frame to keep up with the real-time I-Q data stream.
Zhou and Standaert [22] propose a fast EM-SCA approach that drastically cuts the time needed for an EM bypass attack by using the FFT to remove noise from the original acquired data. The revised approach allows for a maximum sample size of 256, reducing the number of data processing operations by adopting plaintext for encryption. The improved approach is 50 times faster than conventional methods. In another study conducted by Han et al. [23], a sliding window function extracts EM signals from programmable logic controllers (PLCs). This method computes each segment’s power spectral density, offering stable frequency patterns resistant to noise. Varying the window size affects accuracy: smaller windows capture finer details with a reduced frequency resolution, while larger ones offer better frequency clarity but might miss minor transitions.
Sayakkara et al. [12] extended the approach of Zhou and Standaert [22] using a bucketing approach, achieving over 90% accuracy in classifying between different software activities of IoT devices with a very detailed granularity. On the other hand, Sayakkara et al. [1] unveiled the EMvidence framework, automating data extraction and enhancing classification, especially in analyzing ECC cryptographic operations. Collectively, Sayakkara et al. [1]’s studies illuminate the advancements in analyzing IoT device emanations. Together, studies in [1,12,22] highlight the synergy of window functions and bucketing in analyzing IoT device emanations. These advancements in harnessing EM emanations for identifying IoT device operations reveal the potential vulnerabilities and exposure points, especially when it comes to detecting the key lengths of cryptographic algorithms, e.g., AES and ECC.
Recent advancements within the domain of EM-SCA are highlighted by Iyer et al. [24], who focused on the hierarchical classification of instructions based on near-field electromagnetic measurements. Although this approach primarily addresses the disassembly of executed instructions, it showcases the evolving sophistication in feature selection and classification techniques, laying a methodological foundation that parallels the objectives of the current research. The precision in analyzing EM signals for high-accuracy instruction disassembly illustrates the broader potential of EM-SCA methodologies, even beyond the domain of cryptographic insights. Such methodological advancements reflect the significance of the current study’s aim to precisely identify cryptographic key lengths and algorithms, underscoring the importance of sophisticated signal analysis in the ever-expanding field of digital forensics and cryptography.
The studies mentioned above have significantly advanced the field of EM-SCA, predominantly focusing on the detection of cryptographic activities and differentiating between software operations. However, a gap remains in specifically identifying cryptographic key lengths alongside the cryptographic algorithms within IoT devices [25]. This research aims to bridge that gap by introducing a focused methodology for the concurrent detection of both cryptographic key lengths and algorithms using EM-SCA. This novel approach represents a methodological innovation, marking the first systematic attempt to address these aspects together in the domain of digital forensics. It is precisely this gap—the lack of targeted analysis for both key lengths and algorithms—that this study seeks to fill, providing crucial insights particularly valuable in forensic scenarios where understanding both parameters is essential for a comprehensive EM-SCA.
While existing research, as showcased by Won and Bhasin [9], Sayakkara et al. [12], Yu and Chen [13], and others, has laid a solid foundation in the application of EM-SCAs for cryptographic analysis, these studies have not simultaneously addressed the detection of cryptographic key lengths and algorithms within a single framework. Table 1 summarizes these differences, underscoring the unique position of the current study within the broader research landscape.
3. Methodology for EM Emission Analysis from Cryptographic Devices
This section outlines the methodology and techniques employed to capture and evaluate EM emissions from a microcontroller, specifically Arduino Nano, when executing cryptographic algorithms. The intricate process seeks to establish whether these unintentional emissions can betray information about the cryptographic operations taking place.
The overarching framework is predicated on three pivotal stages: Data Acquisition, Data Preprocessing, and Machine Learning Analysis—explained in detail in Section 3.2, Section 3.4, Section 3.5. The modular construct not only serves as a tool for organization, but also provides a robust foundation for future augmentations and modifications.
3.1. Dataset Overview
The collected dataset represents the EM signals detected during the implementation of cryptographic operations, i.e., AES and ECC. These signals reside in the cfile format and can be retrieved via pathways, e.g., AES128.16mhz.cfile. Every dataset undergoes a uniform series of preprocessing protocols including windowing, FFTs, bucketing, and normalization. Following these processes, the AES dataset assumes dimensions of 767,577 ×100, and the ECC dataset assumes dimensions of 767,740 × 100. This near equivalence in size underscores the balanced class distribution within the dataset, a crucial factor for unbiased machine learning model training and validation. In the final integration phase, these two datasets are merged, resulting in a comprehensive dataset with dimensions spanning 1,535,317 × 100. The comprehensive nature and balanced class representation of this dataset provide a solid foundation for the subsequent machine learning analysis, facilitating the development of robust and generalizable classification models.
3.2. Data Acquisition Module
This covers the whole range of tools and procedures used to record raw EM data. It relates to the instruments, the environmental conditions, the software interfaces, and the exact specifications of the devices in question.
The data acquisition process in this research conveys the foundational steps of collecting and analyzing EM emissions from an Arduino Nano executing cryptographic operations. This process requires a thorough setup that integrates both hardware and software components, ensuring accurate capture of emissions. This section provides an in-depth overview of the hardware configuration, software infrastructure, and environmental considerations that are critical to the establishment of a robust data acquisition module.
3.2.1. Hardware Configuration
At the core of this research is the HackRF One, a software-defined radio (SDR) chosen for its precision, bandwidth capabilities, and adaptability. It is indispensable for capturing high-quality EM emissions. The HackRF One and the Arduino Nano are USB-connected to the same computer. While the Arduino Nano ran various cryptographic algorithms, including AES128, AES192, AES256, ECC160, ECC192, and ECC256, the HackRF One captured the associated EM emissions in real time. Each emission capture, both for AES and ECC, was set for a duration of 10 s, resulting in an average file size of approximately 466,776 kb. The HackRF One’s operational parameters are meticulously set: a sample rate of 20 million samples per second and a central frequency of 16 MHz. This frequency was particularly chosen as the primary channel of interest, reflecting significant EM emissions from the Arduino Nano during cryptographic operations.
3.2.2. Software Infrastructure
For programming the Arduino Nano, the Arduino IDE is utilized. The cryptographic tasks embedded in the Arduino Nano made use of specific libraries sourced from GitHub. The AES tasks are achieved using the AES library by Davy [26], and ECC tasks are executed with the micro-ecc library from Ken [27].
In the study, AES encryption is implemented using single block functions, e.g., aes128_enc_single and aes128_dec_single, from the AESLib library. These functions process a single block of data independently, aligning with the electronic codebook (ECB) mode of operation. While ECB mode offers simplicity and effectiveness for controlled experimental setups, it is important to recognize that unlike the cipher block chaining (CBC) mode, the ECB mode does not involve chaining of blocks, which may have implications for security in practical cryptographic contexts.
The ECC implementation in this research employed curves such as secp160r1, secp192r1, and secp256r1 from the micro-ecc library, with a particular focus on key generation and signature verification processes. The choice of curves was based on considerations of computational efficiency and security requirements, reflecting standard practices in digital forensics and IoT device security.
It is noteworthy that the AESLib library supports both single block and CBC mode operations; however, the specific implementation for this study did not utilize bitslicing techniques or elaborate on countermeasures against SCA.
Similarly, the micro-ecc library’s known resistance to side-channel attacks adds a layer of inherent security to the ECC component of the study. However, the specific nature and implementation of these countermeasures within the library are not extensively detailed in this research. The focus is on employing standard ECC functions relevant to the study’s objectives and compatible with the cryptographic protocols prevalent in the intended application scenarios.
Both the AES and ECC algorithms are programmed to continuously execute their respective encryption and decryption operations in a loop for a duration of 10 s. This configuration ensured a steady stream of EM emissions for analysis and is crucial for the consistent capture of the data characteristics of each cryptographic process (see Algorithm 1). This methodological choice, while beneficial for controlled data collection, represents a specific operational mode that may differ from the varied cryptographic activities in real-world IoT device usage.
| Algorithm 1: General structure of Arduino programs for AES and ECC operations |
 |
Regarding the data collection setup, the HackRF One was used in conjunction with the Arduino Nano to capture electromagnetic emissions during cryptographic operations. The Arduino Nano, executing the cryptographic algorithms, was placed in proximity to the HackRF One. The HackRF One, a software-defined radio, served as a sensitive receiver to detect and record the EM emissions generated by the Arduino Nano during its operation. The setup did not require a direct electrical connection between the HackRF One and the Arduino Nano, as the HackRF One was capable of capturing the EM emissions wirelessly.
Data collection was managed through the hackrf_transfer utility, a command-line tool operating in a Linux virtual environment provided by Oracle. The specific command for data acquisition is hackrf_transfer -s 20e6 -f 16e6 -r name-data.cfile, ensuring consistent and accurate capture of the EM emissions.
Figure 1 provides a visual representation of the data flow and analytical procedures. From the host computer, two pathways emerge: an offline pathway for capturing EM traces, which undergo Fourier transformations, channel identification, and subsequent EM-SCA, and a real-time data pathway that directly engages in EM-SCA, utilizing insights from the identified 16 MHz channel. This dual-pathway approach facilitates a balance between comprehensive offline analysis and the agility required for real-time monitoring.
3.2.3. Environmental Considerations
EM emissions can be influenced by the surrounding electronic devices, architectural barriers, and fluctuations in power sources. Ensuring a consistent environment for data capture from the HackRF One and Arduino Nano therefore is paramount. To mitigate potential interference, a custom Faraday cage was constructed. Starting with a plain box, both its exterior and interior walls were meticulously lined with aluminum foil, creating a shielded environment. Specifically, Rawal et al. [29] highlight the effectiveness of aluminum foil in providing an electrically conductive surface for EMI shielding and electrostatic dissipation in spacecraft structures. This design choice significantly reduced external EM interference. With the device under test and the electric field probe both placed securely inside this shielded box, this ensured that the recorded emissions predominantly originated from the Arduino Nano’s cryptographic operations.
3.3. Data Preprocessing Module
Once raw data are captured, they are infrequently in a format amenable to immediate analysis. Preprocessing refines this raw information into a structured and standardized form that can be processed and analyzed efficiently.
The data preprocessing module is crucial in refining and preparing raw in-phase and quadrature (IQ) data, which are representations of complex signals, for subsequent analysis. This stage covers various steps, ranging from segmenting the continuous data stream and reducing its dimensionality to normalizing and labeling the processed data. The data are transformed into a structured format suitable for machine learning applications through techniques such as the sliding window and overlap mechanism and bucketing and dimensionality reduction, as well as data normalization, aggregation, and labeling. The subsequent subsections delve into the specifics of each of these processes.
3.3.1. Sliding Window and Overlap Mechanism
The iq class, developed specifically for this project, offers streamlined handling of IQ data with functionalities such as reading data, extracting segments, and determining the data time duration. Memory mapping ensures efficient dataset management without memory overload. Segmenting the massive streams of raw data is a task of significant importance. The sliding window technique serves this purpose, offering a systematic approach to segmenting data into consistent and manageable chunks. Each window captures a snippet of data, and the subsequent window is overlapped by 80%, ensuring continuity and comprehensive capture of potential patterns. The rationale for such an overlap is grounded in the need to prevent data loss or missing out on transient yet significant events that might be pivotal in the later analysis stages. In other words, the overlap ensures continuity and captures patterns that might emerge at the boundaries of these windows. In relation to the recorded traces, the cryptographic algorithms’ continuous operation for 10 s without pauses resulted in a consistent emission of EM signals. The sliding window size is strategically chosen to capture significant portions of the cryptographic operation’s waveform. The sliding window approach is utilized to segment the continuous data stream into smaller frames or windows. To realize this, windows are crafted with a size of 1000 samples, with an 80% overlap between consecutive windows. Specifically, a window size of 1000 samples, with an 80% overlap, is determined to provide an optimal balance between capturing the entirety of the operational waveform and ensuring efficient data processing. This window size corresponds to a segment of the cryptographic operation, providing a representative snapshot of the EM emissions for analysis. Subsequently, the FFT is employed to convert these windows from the time domain into the frequency domain. Figure 2 provides a visual representation of the application of the sliding window and FFT on the dataset, essentially depicting how the FFT of the data looks after segmenting them using the sliding window approach.
3.3.2. Bucketing and Dimensionality Reduction
Given the vast data points within each window, the bucketing method significantly simplifies the data landscape. By categorizing and averaging data within defined ranges or “buckets”, the data complexity is substantially reduced. This method prepares the data for machine learning applications, reduces computational overhead and lowers the possibility of overfitting. The choice of bucket size, number of buckets, and data aggregation technique within each bucket is informed by preliminary data analyses and the data’s unique attributes. In the current setup, the FFT data undergo segmentation into 100 buckets, with each bucket’s representative value being its maximum. The experiment conducted in the entire length of the FFT window is divided by the number of buckets to determine each bucket’s size. This dimensionality reduction strategy is significant, especially when handling large datasets or complicated signal frameworks. It ensures that subsequent analyses are efficient and streamlined. Figure 3 demonstrates the bucketing method on the FFT data, providing insight into how dimensionality reduction techniques simplify datasets for more efficient analysis.
3.3.3. Data Normalization, Aggregation and Labeling
Upon obtaining the data windows, normalization of the data is imperative to maintain a consistent scale across all feature values. The normalization technique employed scales the data by dividing them by the maximum absolute value, thereby constraining the amplitude range between −1 and 1. Following normalization, the processed data from AES and ECC algorithms are aggregated. The aggregated data arrays, e.g., all_data_aes and all_data_ecc, combine the processed data respective to each cryptographic algorithm.
An integral component of the data preparation for machine learning tasks is labeling, which facilitates the association of data with their corresponding cryptographic algorithm. Contrary to labeling each data segment based on its sequential position in the processed list, this study adopts a categorical labeling approach. Specifically, in the AES dataset, all segments derived from AES128, AES192 and AES256 operations are labeled with distinct identifiers corresponding to each AES variant. A similar approach is adopted for the ECC dataset, where segments are labeled according to the specific ECC curve utilized, such as ECC160, ECC192 or ECC256.
This labeling strategy is not only consistent within each group of segments representing a specific cryptographic operation but also aligns with the classification tasks of the study, which categorize data into distinct classes based on the cryptographic algorithms and configurations. Therefore, the labels serve to distinguish between various types of cryptographic activities, aiding the machine learning models in learning and differentiating EM emission characteristics associated with each cryptographic algorithm.
3.4. Feature Selection and Dimensionality Analysis
Upon the completion of data preprocessing and transformation, the dataset exhibited well-defined dimensions. For the AES cryptographic operations, the dataset contained 767,577 samples, each having 100 distinct features. Similarly, the ECC operations yielded a dataset comprising 767,740 samples with the same feature count. Combining both AES and ECC datasets resulted in a comprehensive dataset encompassing 1,535,317 samples and 100 features.
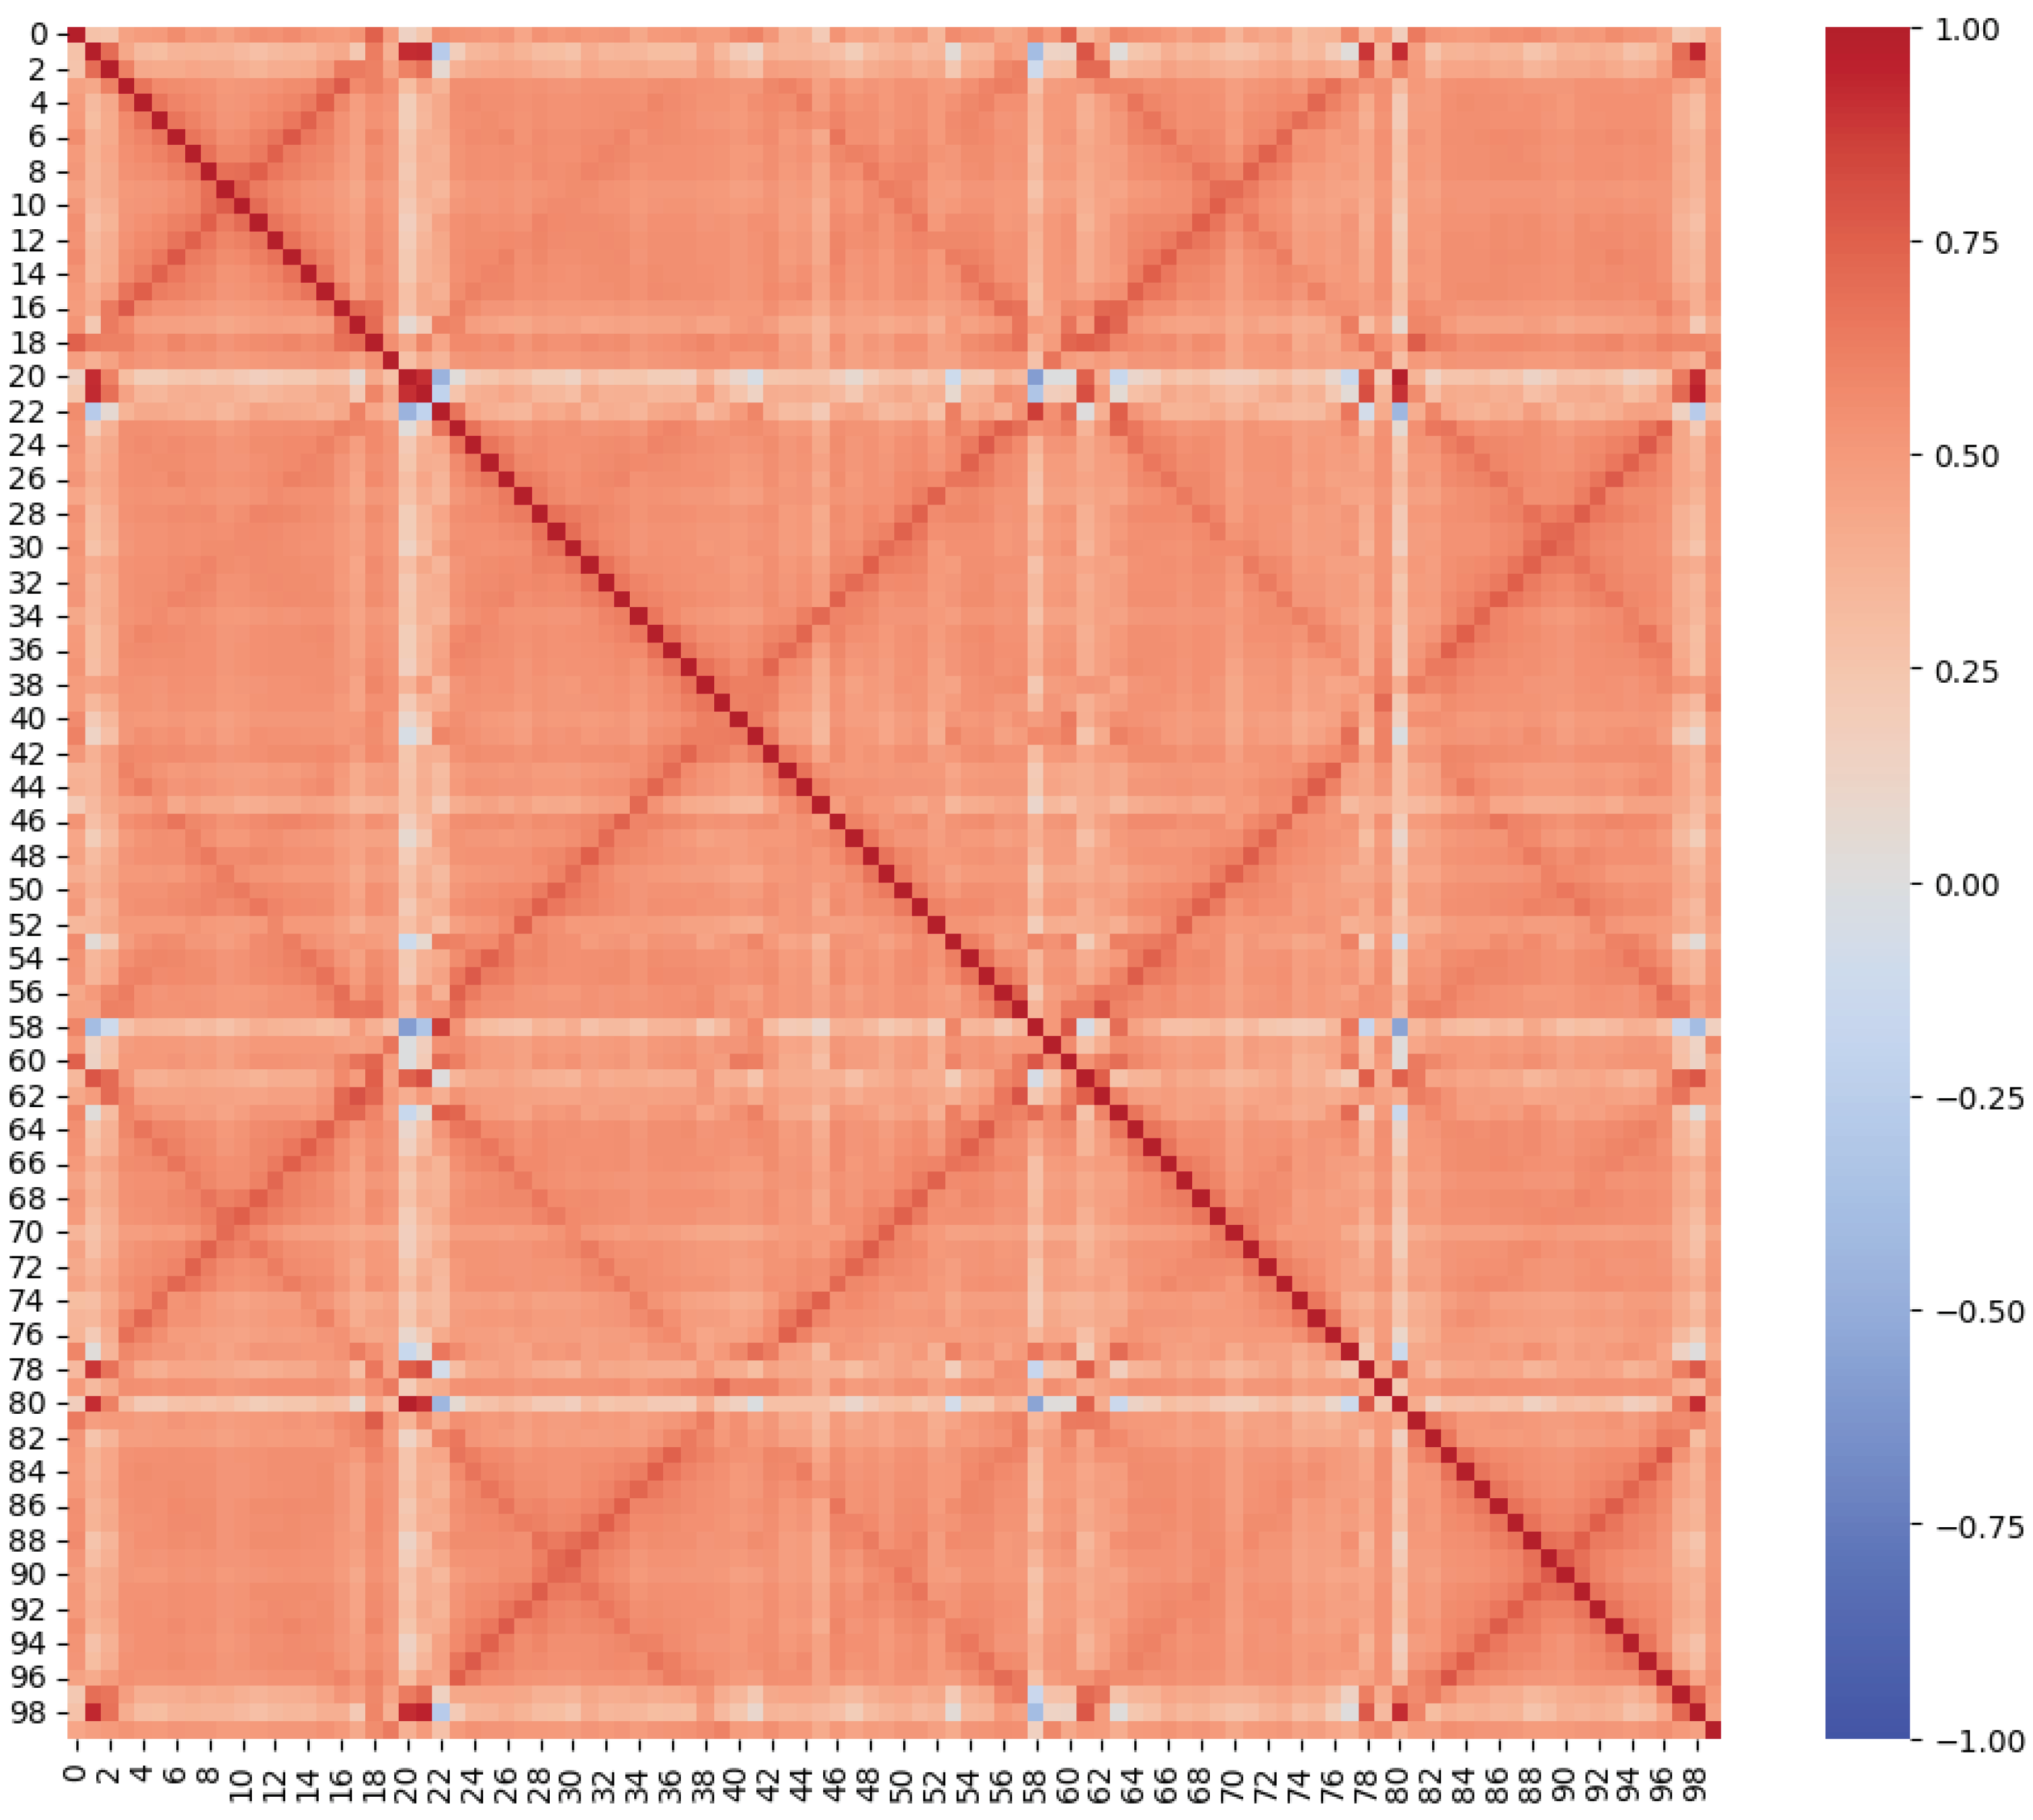
Each of these features represents the amplitude value of a specific frequency bucket, which is derived from the FFT of the EM emissions. Given the high dimensionality, it is essential to inspect the data for redundancies and correlate features that might introduce overlap, thereby possibly affecting the efficiency and performance of machine learning models.
A correlation-based feature analysis is employed for this purpose. A correlation matrix is generated to visualize inter-feature dependencies. This matrix is illustrated in Figure 4. Features exhibiting a correlation coefficient exceeding 0.85 with another feature are deemed redundant. Such a high correlation suggests that one feature can be predictive of the other, rendering one of them redundant for this analysis. As a result of this correlation analysis, six features are identified as extraneous and are subsequently removed from the dataset. This reduced the feature count from an initial 100 to 94. After this feature selection process, the data retained their diversity in representing the EM emissions but were optimized to ensure better performance and accessibility of the subsequent machine learning tasks.
3.5. Machine Learning Pipeline and Evaluation
An extensive and structured pipeline is developed in an effort to evaluate the effectiveness of the selected machine learning models. Data preparation is essential to ensure the efficacy of any machine learning model. To this end, the dataset is separated into training and test subsets using the train_test_split function. This particular function ensured a stratified split, thereby maintaining the proportion of samples for each class. To further bolster the performance of the models, the dataset underwent a standardization process using the StandardScaler from the scikit-learn library. In the conducted experiments, an 80% training and 20% test split ratio is employed.
Recognizing that the model performance might oscillate based on the specific subset of data it is trained upon, a robust 5-fold cross-validation is incorporated using the StratifiedKFold method. This strategic approach splits the training data into five distinct subsets. The model undergoes training five times, each instance using a different subset as its validation set.
To delve deep into the details of model performance, a variety of metrics, including precision, accuracy, and the F1 score, are employed. These metrics, essential indicators of model performance, are extracted using a set of functions available in scikit-learn’s metrics module. Accuracy is chosen as a primary indicator of the overall correctness of the model, representing the proportion of true results (both true positives and true negatives) among the total number of cases examined. Precision is deemed crucial for measuring the reliability of the model’s positive predictions, ensuring that the identified cryptographic classes are truly correct and minimize false-positive rates, which is essential in the forensic context where false leads can be costly. The F1 score, a harmonic mean of precision and recall, is included as a balanced metric that considers both the precision and the recall of the classification model. This is particularly important in scenarios where an even balance between the detection of true positives and the avoidance of false negatives is crucial, reflecting a more nuanced view of the model’s predictive power. The generation of a confusion matrix provided a more detailed understanding of the model’s potential limitations by highlighting the proportion of accurate and incorrect predictions.
The experimentation phase is highlighted with the deployment of a diverse array of classifiers, covering Logistic Regression, Random Forest, XGBoost, LightGBM, and Support Vector Machine (SVM). Each model, with its unique strengths, was meticulously selected to proffer a comprehensive overview of the dataset’s behavior under varying algorithms. As the experimentation unfolded, each model was rigorously evaluated against the test set, with the results effectively visualized through confusion matrices. The outlined machine learning pipeline and evaluative framework set the foundation for a comprehensive analysis of EM emissions from cryptographic operations, leveraging the power of advanced algorithms to delve into the refined patterns of IoT device security.
4. Results
This section unveils the findings derived from the comprehensive application of the machine learning pipeline to the EM side-channel data collected. Highlighting the effectiveness of various classification approaches, it presents a detailed analysis of model performances across different classification tasks, demonstrating the potential of EM-SCA in identifying cryptographic operations within IoT devices. The following subsections delve into the specifics of these findings, beginning with the six-class classification approach and followed by a more detailed three-class distinction for both AES and ECC. The sequence culminates in a binary classification, distinguishing between the overarching AES and ECC cryptographic families.
4.1. Six-Class Classification Approach
The initial experiment undertakes the intricate task of interpreting EM emissions from the Arduino Nano during specific cryptographic operations. The focus rests squarely on six cryptographic algorithms: AES128, AES192, and AES256 and ECC160, ECC 192, and ECC 256. Each of these is categorized as a distinct class, enabling a foundational understanding of the emission patterns intrinsic to them.
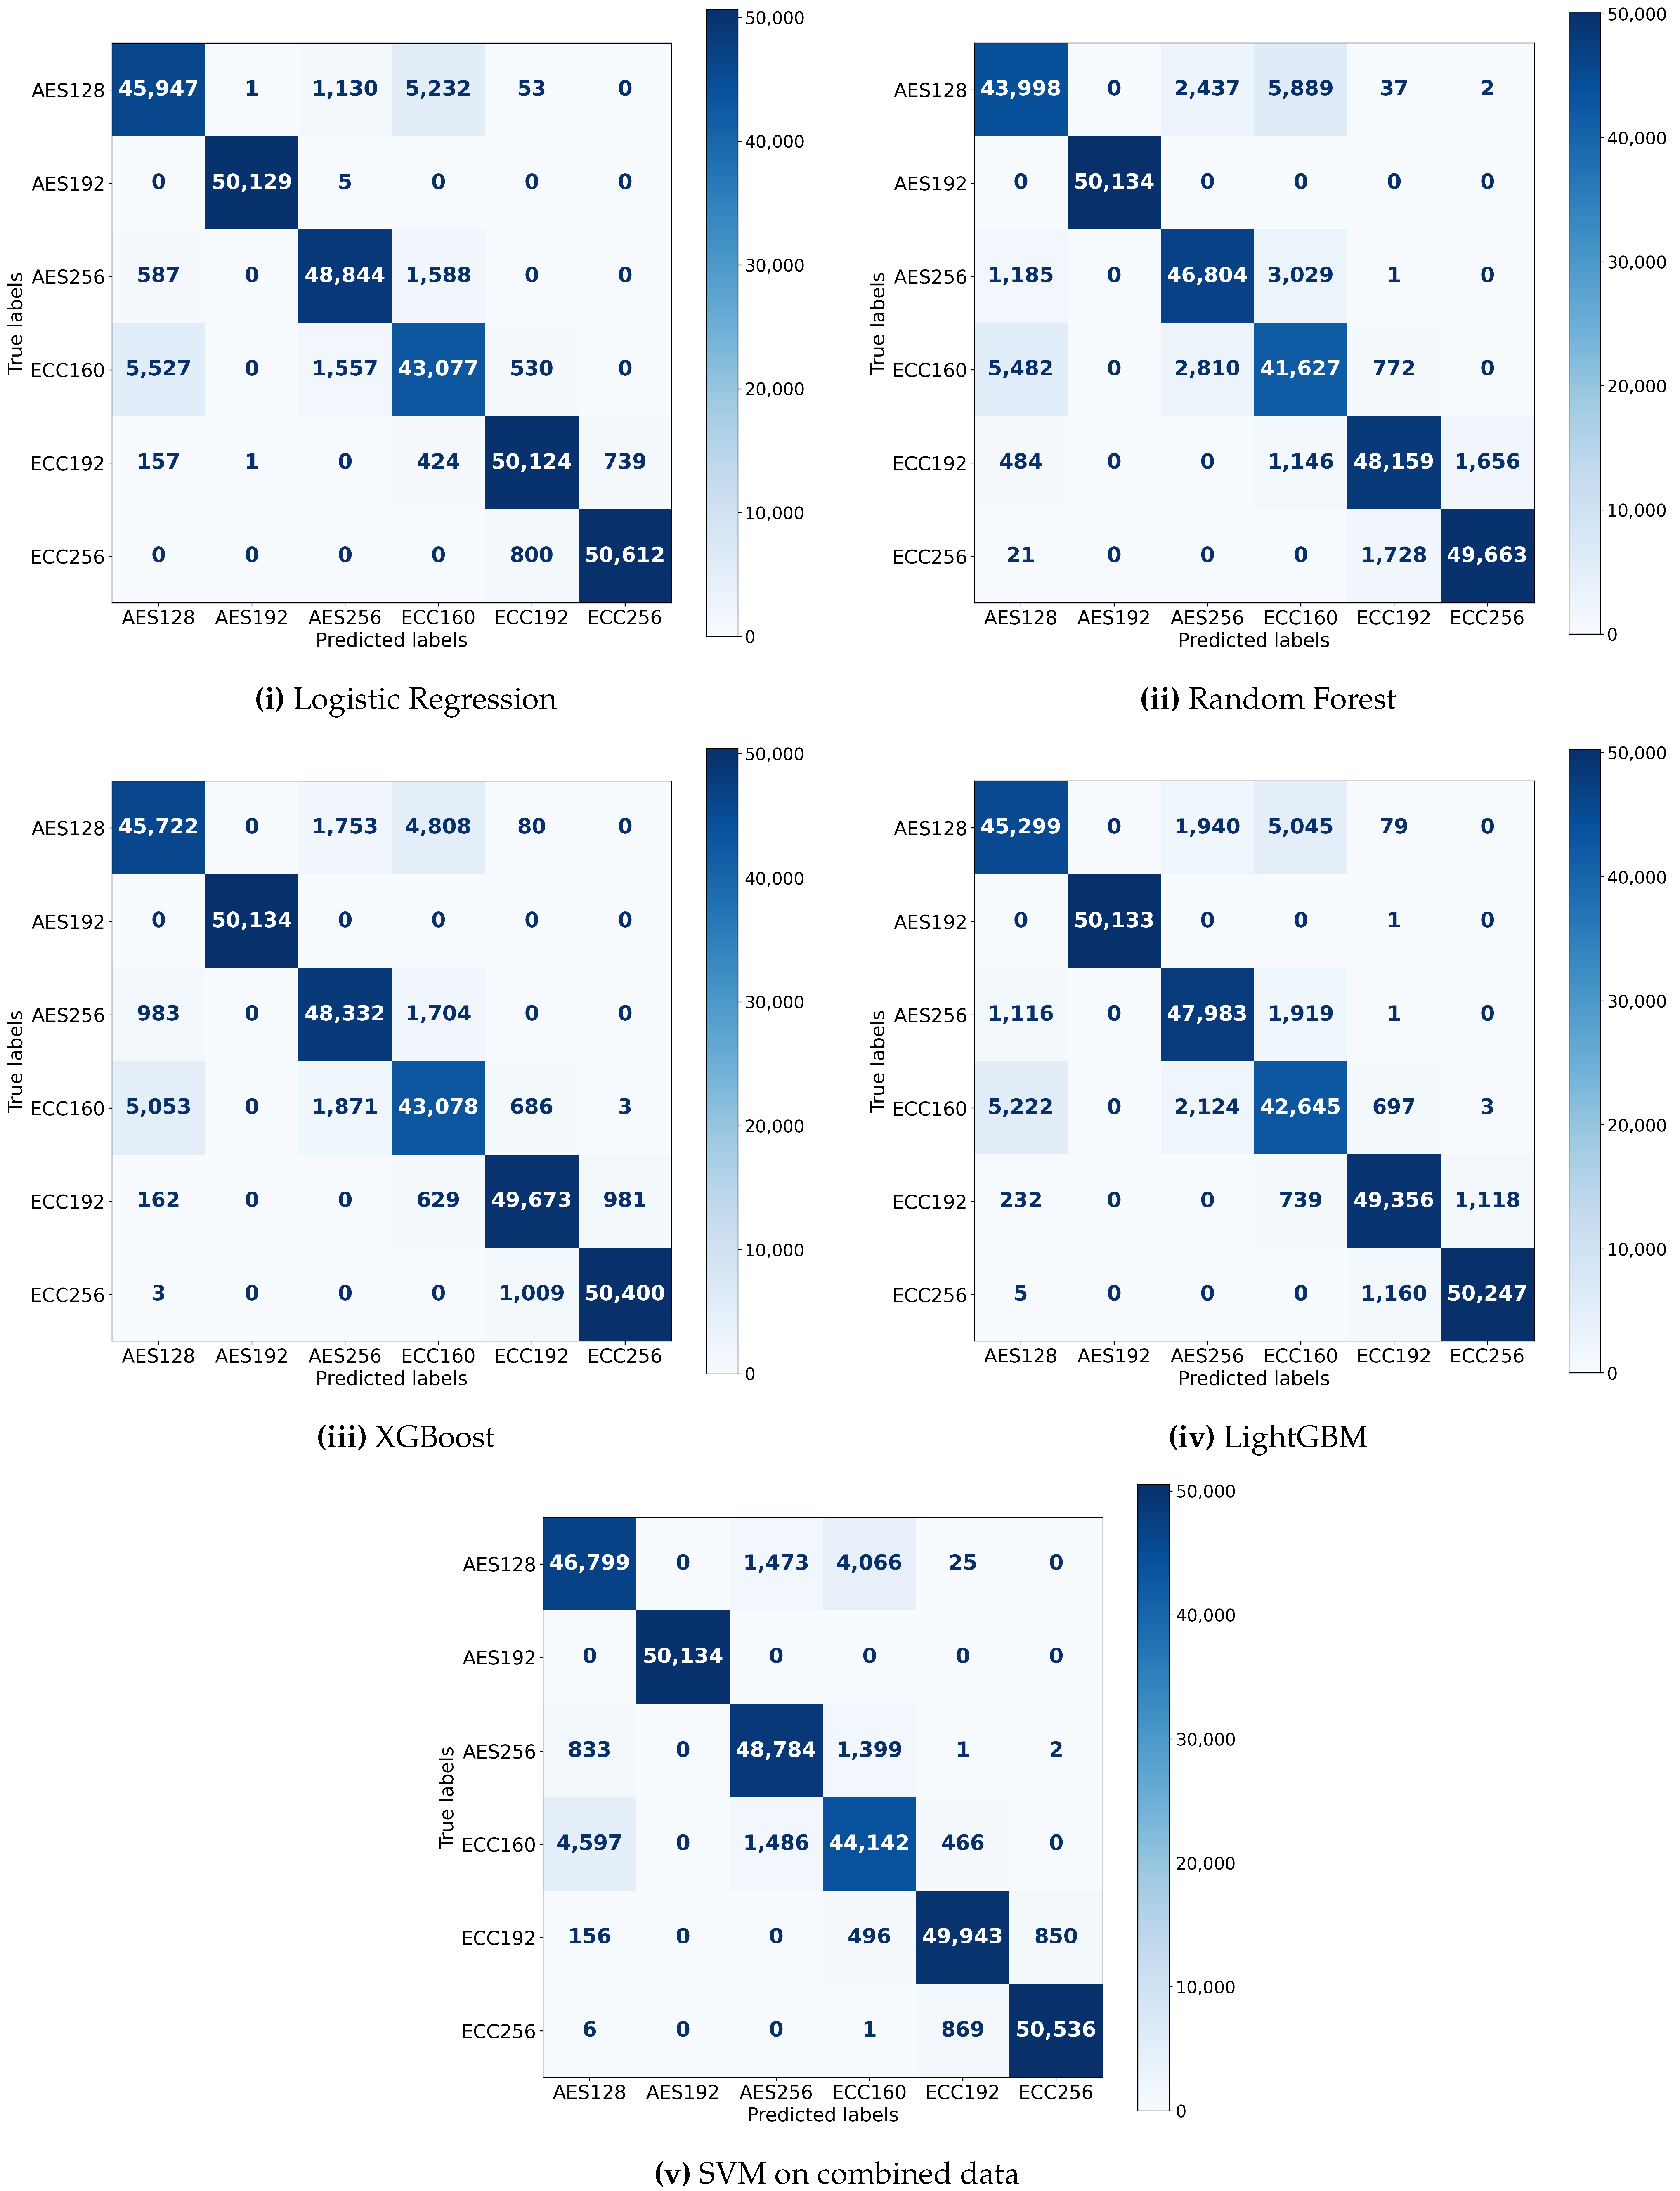
The use of five well-known machine learning models—Logistic Regression, XGBoost, Random Forest, LightGBM, and SVM—is a key component of this research. The models are configured with specific parameters to optimize their performance for this task. Logistic Regression is implemented with a maximum iteration limit of 10,000. The Random Forest classifier is used with its default settings. For the XGBoost classifier, label encoding is disabled, and log loss is set as the evaluation metric. LightGBM is employed in its standard configuration. Each model’s effectiveness is illustrated in Figure 5 by its unique confusion matrix following thorough training on a single dataset. Such a tool enabled a thorough comparison of the models in addition to summarizing the categorization results.
A pattern of note, depicted in Figure 5, emerging across the models is the recurrent difficulty in teasing apart the AES128 from the ECC160 classes. Specifically, confusion matrix values in the range of 0 to 50,000 indicate a considerable number of instances where emissions from AES128 are misclassified as ECC160 and vice versa. This considerable overlap in model predictions, while not statistically assessed for significance, suggests that the EM emission patterns for AES128 and ECC160 share similar characteristics that the models consistently misinterpret. This observation is of practical importance as it highlights the need for further refinement in feature engineering or model selection to clearly distinguish between these two classes of EM emissions.
Table 2 presents a systematic comparison of the performance metrics associated with each model. Emphasis is placed on pivotal metrics such as test set accuracy, test set precision, and test set F1 score. Among the models evaluated, the SVM model stood out. Despite the inherent challenges associated with this form of classification, SVM achieved a solid test set accuracy of 94.55%. Its precision and F1 score metrics further attest to its adeptness in managing such a sophisticated classification challenge.
4.2. Dissecting AES and ECC: A Three-Class Classification
Once the initial experiment has established the fundamental ideas, the experiment switches to a further exploration. This step aims to identify the fine distinctions between the AES and ECC cryptography classes by categorization of each variant’s modifications. To embark on this exploration, the merged datasets of AES and ECC are separated back into their original structures. Before feeding these datasets into the machine learning models, the previously applied preprocessing steps and feature selection methods are reapplied to ensure consistency and to retain the optimized feature set. The previously chosen five machine learning models are then re-employed, training each model separately on the AES and ECC datasets.
The Logistic Regression model is again parameterized with a maximum iteration limit of 10,000 to ensure convergence. The Random Forest and LightGBM classifiers are utilized with their default parameters, considering their prior effectiveness. XGBoost is configured with the label encoding disabled and log loss as the evaluation metric, maintaining the setup from the previous experiment. SVM, crucial for its high-dimensional-feature-handling capability, is employed with its default kernel. Significant measures, such as test set accuracy, precision, and F1 score are taken into consideration to evaluate model effectiveness.
Detailed performance metrics of each model for both AES and ECC datasets are tabulated in Table 3. To provide a visual insight into the most successful model’s classification ability, Figure 6 displays the confusion matrices of the Logistic Regression model—the model that recorded the highest accuracies for both AES and ECC classifications. This visual representation serves to validate the tabulated performance metrics and offers an immediate glimpse into the class-wise predictions. Remarkably, Logistic Regression emerged as the most proficient model for both AES and ECC classifications, recording accuracies of 98.47% and 98.76%, respectively. Table 3 underscores the model’s ability to distinguish these cryptographic operations’ unique EM signatures.
Comparing this experiment with the earlier six-class classification, some marked differences are apparent. In the six-class categorization, SVM stood out, excelling in differentiating among the various classes. One could attribute this to SVM’s inherent strength in dealing with higher-dimensional spaces, especially when there are boundaries that distinctly separate classes. However, when the classification task became more specific, focusing on the characteristics within the AES and ECC classes, Logistic Regression proved superior. This can be rationalized by understanding the nature of these cryptographic classes. The differences within the variants of AES and ECC might be more linearly separable, making it a favorable scenario for Logistic Regression. Logistic Regression, as a linear model, excels when there is a linear relationship between the input features and the log odds of the output. In this case, the EM signatures within the AES and ECC cryptographic classes could exhibit such linear patterns, which Logistic Regression could efficiently capture.
4.3. The Binary Face-Off: AES versus ECC
The final experiment in the series simplified the classification task into a binary format. The main goal is to differentiate between the two major cryptographic categories: AES and ECC. Instead of considering the many different subtypes within each category, this experiment treated all subtypes of AES as one group and all subtypes of ECC as another group. This approach developed a more precise and direct comparison between AES and ECC.
To begin this experiment, all subtypes under AES and ECC are grouped into their respective overarching categories. This approach made the differences between the two main groups more pronounced. The previously selected machine learning models are adapted for this binary classification, with each being fine-tuned as follows:
- Logistic Regression:Deployed with a maximum iteration limit of 10,000 and the solver set to handle multi-class classification inherently via the ‘ovr’ (one-vs-rest) approach, which is the default strategy in scikit-learn for binary tasks.
- SVM: Utilized with its default kernel and internally adapted to multi-class classification using the one-vs-one strategy, which constructs one classifier per pair of classes.
- Random Forest: This model naturally accommodates multi-class classification without any additional mechanism required.
- XGBoost and LightGBM: Both models inherently support multi-class classification and are configured with their respective multi-class objective functions.
The effectiveness of the models is assessed using the same metrics, i.e., the test set accuracy and precision, the F1 score, and the confusion matrix. Table 4 provides a detailed overview of the performance metrics for each model in this binary classification task.
To offer a clearer visual insight into the classification patterns of the models, Figure 7 showcases the confusion matrices of the outperforming representative models, chosen based on their performance. In this refined setup, the SVM model distinguished itself, registering a test set accuracy of 95.97%. This strong performance of the SVM in the binary classification contrasts with its results in earlier experiments. One possible explanation is that the SVM, which uses decision boundaries to classify data, performs exceptionally well when there are only two main groups to differentiate. This can be different in multi-class situations, where the differences between groups can be less precise. There are apparent differences in the most prominent models when comparing this binary experiment to past multi-class examinations. SVM excelled in the six-class experiment, whereas Logistic Regression outperformed AES and ECC in the three-class comparison.
5. Discussion
An in-depth examination of the EM emissions produced by cryptographic operations on the Arduino Nano is carried out on the research described in Section 4, revealing significant patterns, particularly from a digital forensic standpoint. The studies reveal how various cryptographic algorithms differ, and they additionally reveal the possibility for forensic implementation in the real world. The detailed nature of the experimental results, the implications for digital forensic investigations, the inherent limitations of the current method, and the proposed research roadmap are all covered in this section, which goes deeper into these findings.
5.1. Observations and Implications
Analyzing EM emissions from cryptographic operations on the Arduino Nano offers essential insights into cryptographic algorithms’ behavior and the efficacy of different machine learning models in classifying them. This research unveils distinct variations in model performance based on the classification complexity, challenges resulting from overlapping EM emission patterns, and the shifting dominance of certain models across different classification experiments. These findings underscore the sophisticated nature of EM emissions in cryptographic processes and the importance of strategic model selection. The subsequent subsections provide a more granulated exploration of these observations.
5.1.1. Machine Learning Model Selection
Six-Class Classification: In the multifaceted six-class classification, the SVM model notably outperformed the others, with a success rate of 94.55%. Although Logistic Regression followed closely at 94.03%, SVM’s proficiency in dealing with higher-dimensional spaces appeared to provide it with an edge. It effectively distinguished between the six cryptographic algorithms, even when some of them demonstrated similar patterns. This indicates that for tasks involving several closely related classes, the SVM model could be a preferred choice.
Three-Class Classification: Remarkably, when the details within the AES and ECC categories are closely examined, Logistic Regression became the standout model with an impressive accuracy of 98.47% on AES data and 98.76% on ECC data. This might suggest that within these general categories, the differences can be separated by a straight line. Logistic Regression, which fundamentally uses a linear approach, works exceptionally well in such situations. Therefore, when identifying small differences within large categories, Logistic Regression can be absolutely effective.
Binary Classification: In the direct comparison between AES and ECC, the SVM model’s performance is particularly commendable with a performance of 95.97% compared to the 95.35% achieved by XGBoost. When faced with a binary classification task that required distinguishing between these two cryptographic categories, SVM effectively distinguished between the datasets. This suggests that SVM is capable of handling challenges where data groups are more distinctly defined. Such an observation underscores the model’s adaptability and proficiency, emphasizing its relevance in varied cryptographic classification challenges.
5.1.2. Challenges of EM Emission Patterns
Overlapping Traits: The observed overlaps, notably between AES128 and ECC160 in the six-class experiment, suggest that not all cryptographic operations have distinctly unique emission patterns. Such overlaps could pose challenges in real-world scenarios where precise differentiation is crucial. It indicates the need for further research to delve deeper into these overlaps, potentially uncovering hidden patterns or requiring refined feature engineering techniques.
5.1.3. Comparative Analysis of Classification Approaches
Adaptability in Model Selection: This study’s approach demonstrates adaptability in selecting machine learning models suitable for varied classification challenges, with SVM and Logistic Regression showing notable effectiveness in different scenarios. This adaptability underscores the importance of selecting the appropriate model based on the specific nature of cryptographic emission patterns and the classification task at hand. The results also suggest that a tailored approach, such as the three-class classification for distinguishing within broader categories, can yield highly accurate outcomes, reinforcing the value of methodological flexibility in enhancing forensic analysis.
Moreover, while binary classification improved the clarity of distinctions between primary cryptographic mechanisms, the three-class classification, especially with Logistic Regression, achieved the highest accuracy in the experiments. It is evident that when drawing specific distinctions within broader cryptographic categories, a three-class approach could offer better outcomes.
5.2. Analyzing EM Emission Patterns in Relation to AES Key Lengths and Rounds
The correlation between the key length of AES and the corresponding number of rounds executed is a critical factor in determining distinct EM emission patterns. Specifically, as the key length varies between 128, 192, and 256 bits, the number of AES rounds—10, 12, or 14, respectively—alters accordingly. This alteration in the number of rounds significantly impacts the timing and characteristics of the cryptographic operations, potentially creating distinguishable patterns in the EM emissions associated with different key lengths.
The subtlety of these distinctions in EM emissions, relative to the key length, necessitates an evaluation of whether they require sophisticated analysis or could be discerned through visual inspection by a knowledgeable investigator. The study presented does not solely focus on the apparent timing differences, but investigates the more nuanced EM emissions that are not readily discernible through mere visual inspection. This comprehensive approach is justified, particularly in forensic scenarios, where EM environments are often complex or noisy. Timing differences, while potentially noticeable, may not consistently yield conclusive or easily interpretable data, underscoring the need for more advanced analytical methods to accurately interpret EM emission patterns associated with varying AES key lengths.
5.3. Digital Forensic Perspective
The implications of discerning EM emissions from cryptographic operations extend beyond mere academic interest. From the lens of digital forensic investigations, these findings can fundamentally improve the toolkit of forensic experts in the following areas. Cryptographic Operations Detection: A crucial concern in digital forensic investigations is the identification of encrypted content. The methodologies detailed in this research equip investigators with the ability to determine if a seized device is currently processing cryptographic operations. Such knowledge serves as an initial checkpoint, hinting at the probable existence of encrypted data, and enabling investigators to strategize their approach more effectively.
Essential Length Determination: Delving into the findings from the six-class, three-class, and binary classifier experiments, a remarkable revelation emerges: the potential to pinpoint key lengths. Differentiating between AES and ECC variants is not merely an academic exercise; in the hands of forensic professionals, this differentiation translates to valuable insights. Experts gain foresight into the cryptographic mechanism’s complexity by deducing key lengths and their corresponding algorithms, facilitating more precise decryption strategies. Accelerated Investigation Process: The complexity of digital forensic investigations is often compounded by the vast amounts of data investigators cope with. By leveraging a suitable machine learning model tailored to the classification task at hand, investigators can accelerate their data processing endeavors. Rapid classification not only accelerates investigations but also provides forensic experts with more timely and enforceable insights.
Profiling and Cross-Device Application: In a forensic context, profiling cryptographic operations is essential to establishing a baseline for comparison with suspect devices. Typically, an equivalent device or a similar model would be used for initial profiling and training of the machine learning models. This process would involve capturing EM emissions from the reference device under controlled conditions to create a comprehensive training dataset. However, a challenge arises in the direct application of this method to different devices in a forensic scenario. Variations in hardware and software configurations between devices can lead to differences in EM emission patterns. Therefore, it is crucial to investigate and address the model’s capability to generalize across different devices.
In the realm of digital forensics, the importance of understanding cryptographic elements, such as the key length and encryption algorithms, becomes evident in scenarios involving devices like IP cameras frequently encountered in crime scenes. These devices, which are integral in continuous surveillance, capture, record, and encrypt data consistently. In the forensic examination of such devices, particularly when retrieved from a crime scene, the preliminary step often involves deciphering the cryptographic scheme employed. This is crucial before delving into the more complex process of key recovery.
For instance, in the case of an IP camera, forensic investigators first need to identify the encryption algorithm and key length used. This initial step is vital for multiple reasons. It helps in understanding the security measures implemented on the device, narrows down the possible methods for key recovery, and helps to estimate the effort and resources required for a successful decryption. In addition, this knowledge can guide investigators in selecting the appropriate tools and techniques for further analysis. The identification of key characteristics thus serves as a foundational aspect of digital forensic investigations, enabling a more targeted and efficient approach to retrieving encrypted evidence.
Beyond the example of IP cameras, the methods developed in this research hold significant potential in a variety of forensic situations. For instance, in cases involving mobile devices or wearable technology, where encrypted data plays a crucial role in investigations, understanding the encryption algorithm and key length can be instrumental. In such scenarios, the preliminary identification of these cryptographic elements can aid in narrowing down the device’s operational parameters, guiding the forensic process in a more focused direction. This becomes particularly important in complex systems where multiple encryption schemes may be employed, and traditional key recovery methods may be impractical or time-consuming. By equipping forensic experts with the ability to quickly ascertain these cryptographic details, this research contributes to more efficient and effective forensic analyses across a spectrum of digital devices.
Furthermore, this approach can be instrumental in cases where the encryption key itself cannot be directly recovered, but knowledge of the algorithm and key length can provide indirect insights into the nature of the encrypted data and their potential origins [25]. Such capabilities are increasingly vital in the fast-evolving landscape of digital forensics, where adaptability and precision are key to addressing the sophisticated encryption methods used in modern digital devices.
5.4. Limitations and Future Directions
This research, while fundamental in understanding cryptographic operations on the Arduino Nano, raises important considerations for broader applicability and future enhancements. This study primarily focused on the specific EM emissions profile of the Arduino Nano. Although the results are insightful, their generalization across diverse devices remains an area of concern in the rapidly changing digital landscape. The importance of accounting for hardware variability cannot be overstated, especially when adapting these findings to real-world forensic contexts.
Furthermore, the six-class classification highlighted certain overlaps in EM traits. While these overlaps are of academic interest, they also carry observable risks in real-world classifications, potentially causing misidentifications. This underscores the need for in-depth future research to refine feature engineering techniques or employ advanced model architectures. This study’s reliance on machine learning introduces challenges tied to model fit and generalization. Although the models mapped known cryptographic operations effectively, their potential to adapt to novel or unseen operations requires validation. This could involve exposing these models to a range of new cryptographic operations to ensure they remain resilient to overfitting while maintaining their predictive strength.
Another noteworthy limitation of this study is the context in which the machine learning models were trained and evaluated. The models were developed by running the encryption algorithms (AES/ECC) exclusively on the Arduino Nano, without the concurrent operation of other applications. This approach, while beneficial for controlled analysis and initial understanding, does not fully encapsulate the multifaceted nature of real IoT environments where these devices often interact with various sensors and actuators. In practical scenarios, the electromagnetic signature of such devices would likely be different and more complex due to these interactions, potentially impacting the model’s accuracy and generalizability. Acknowledging this, it is important to note that the current study lays the groundwork for future research in this area. Future studies could aim to test and refine these models in more representative IoT settings, involving a full spectrum of device operations. This progression would offer a more comprehensive understanding of EM-SCA’s applicability in real-world digital forensic contexts. However, due to the scope of this initial study, such an extensive investigation is not feasible. The exploration of these models in more complex IoT scenarios remains an important avenue for future research, promising to enhance the practical applicability and robustness of the methodologies proposed.
An inherent limitation of this study arises from the experimental design, where AES and ECC algorithms are continuously run in a loop. This setup, while facilitating data collection and analysis, does not fully emulate the sporadic or diverse nature of cryptographic operations in practical IoT applications. Additionally, the classification model developed in this research did not include a class for periods devoid of cryptographic activity (‘no cryptography’). The inclusion of such a class would enhance the model’s capability to distinguish between cryptographic and non-cryptographic periods, thereby improving its applicability and relevance in forensic contexts.
To ensure the immediate real-world applicability and relevance of these findings, establishing collaborations with industry experts and practitioners in the domain of cryptography and digital forensics would be invaluable. Such partnerships could provide direct feedback from the field, ensuring that the research remains connected to pressing industry challenges and offers concrete, actionable insights.
In considering the evolution of this research, the development of an end-to-end system becomes a prominent direction. Such a system would autonomously preprocess an uploaded cfile file and determine the cryptographic key length, broadening the accessibility of the findings to a wider audience, including non-experts. For an optimal accuracy and broad applicability, the inclusion of a diverse range of cryptographic algorithms, i.e., RSA and DES, is essential. Additionally, diversifying the hardware base beyond the Arduino Nano and incorporating various microcontrollers can enhance the system’s versatility.
6. Conclusions
This study set out with the central aim of highlighting the capability of EM-SCA in digital forensics, emphasizing its potential to identify key lengths and cryptographic algorithms in devices. The Arduino Nano, chosen to represent typical IoT devices, is at the core of this exploration. An extensive analysis of the EM emissions generated by the Arduino Nano’s cryptographic operations is performed in pursuit of this objective. Through comprehensive evaluation, different emission patterns are discovered that are of significant interest in the field of digital forensics. The machine learning models deployed presented varying proficiency levels across diverse classification tasks. In the intricate six-class classification, the SVM model emerged dominant, registering an impressive accuracy of 94.55%, marginally surpassing Logistic Regression at 94.03%. It is not clear from these findings that SVM’s capability in handling high-dimensional spaces gives it a marked advantage, especially when discerning between multiple cryptographic algorithms that may bear resemblance. Shifting the focus to the three-class classification, Logistic Regression showed an outstanding performance, with an accuracy of 98.47% for AES data and 98.76% for ECC data. This attests to its capability to distinguish subtle variances within broad cryptographic categories. Furthermore, for binary classification tasks, especially between AES and ECC, SVM again displayed its prowess, achieving an accuracy of 95.97%, slightly ahead of the 95.35% of XGBoost.
However, alongside these promising results, challenges arose. The overlapping EM traits in certain classifications underscore the need for enhanced feature engineering techniques or refined model architectures. Furthermore, although the study provided an insightful analysis of the Arduino Nano, its generalization to a wide range of other devices has not been fully explored. In order to ensure that the findings are reliable and up to date, it is crucial to assess the feature engineering approach further, particularly when applying these insights to actual devices.
When the progression of this research is visualized, a strong argument can be made for an end-to-end system that could process data without difficulties and determine the lengths of cryptographic keys, e.g., a system that would make this study’s significant revelations accessible to anyone. It would be essential to test the framework on various microcontrollers and fill the dataset with various cryptographic approaches to assure its wide applicability and effectiveness.
Author Contributions
Conceptualization, A.S. and M.S.; Methodology, M.R.Z. and M.S.; Software, M.R.Z.; Validation, M.R.Z., A.S. and M.S.; Formal analysis, M.R.Z.; Investigation, M.R.Z.; Data curation, M.R.Z.; Writing—original draft, M.R.Z.; Writing—review & editing, A.S. and M.S.; Supervision, A.S. and M.S.; Project administration, A.S. and M.S.; Funding acquisition, M.S. All authors have read and agreed to the published version of the manuscript.
Funding
This research received no external funding.
Institutional Review Board Statement
Not applicable.
Informed Consent Statement
Not applicable.
Data Availability Statement
Available data is contained within the article.
Conflicts of Interest
The authors declare no conflict of interest.
References
- Sayakkara, A.; Le-Khac, N.A.; Scanlon, M. Facilitating Electromagnetic Side-Channel Analysis for IoT Investigation: Evaluating the EMvidence Framework. Forensic Sci. Int. Digit. Investig. 2020, 33, 301003. [Google Scholar] [CrossRef]
- Kanta, A.; Coray, S.; Coisel, I.; Scanlon, M. How viable is password cracking in digital forensic investigation? Analyzing the guessability of over 3.9 billion real-world accounts. Forensic Sci. Int. Digit. Investig. 2021, 37, 301186. [Google Scholar] [CrossRef]
- Scanlon, M.; Breitinger, F.; Hargreaves, C.; Hilgert, J.N.; Sheppard, J. ChatGPT for digital forensic investigation: The good, the bad, and the unknown. Forensic Sci. Int. Digit. Investig. 2023, 46, 301609. [Google Scholar] [CrossRef]
- Sayakkara, A.; Le-Khac, N.A.; Scanlon, M. A survey of electromagnetic side-channel attacks and discussion on their case-progressing potential for digital forensics. Digit. Investig. 2019, 29, 43–54. [Google Scholar] [CrossRef]
- Naren; Elhence, A.; Chamola, V.; Guizani, M. Notice of Retraction: Electromagnetic Radiation Due to Cellular, Wi-Fi and Bluetooth Technologies: How Safe Are We? IEEE Access 2020, 8, 42980–43000. [Google Scholar] [CrossRef]
- Poulin, F.; Amiot, L.P. Interference during the use of an Electromagnetic Tracking System under OR Conditions. J. Biomech. 2002, 35, 733–737. [Google Scholar] [CrossRef] [PubMed]
- Kocher, P.C. Timing Attacks on Implementations of Diffie-Hellman, RSA, DSS, and Other Systems. In Proceedings of the Advances in Cryptology — CRYPTO ’96, Santa Barbara, CA, USA, 18–22 August 1996; Springer: Berlin, Germany, 1996; pp. 104–113. [Google Scholar] [CrossRef]
- Kong, J.; Aciicmez, O.; Seifert, J.P.; Zhou, H. Hardware-software Integrated Approaches to Defend Against Software Cache-based Side Channel Attacks. In Proceedings of the 2009 IEEE 15th International Symposium on High Performance Computer Architecture, Raleigh, NC, USA, 14–18 February 2009; pp. 393–404. [Google Scholar] [CrossRef]
- Won, Y.S.; Bhasin, S. A Systematic Side-Channel Evaluation of Black Box AES in Secure MCU: Architecture Recovery and Retrieval of PUF Based Secret Key. In Proceedings of the 2021 IEEE International Symposium on Circuits and Systems (ISCAS), Austin, TX, USA, 22–28 May 2021; pp. 1–5. [Google Scholar] [CrossRef]
- Ueno, R.; Xagawa, K.; Tanaka, Y.; Ito, A.; Takahashi, J.; Homma, N. Curse of Re-encryption: A Generic Power/EM Analysis on Post-quantum Kems. In IACR Transactions on Cryptographic Hardware and Embedded Systems; Ruhr-University of Bochum: Bochum, Germany, 2022. [Google Scholar] [CrossRef]
- Lisovets, O.; Knichel, D.; Moos, T.; Moradi, A. Let’s take it Offline: Boosting Brute-force Attacks on iPhone’s User Authentication through SCA. IACR Trans. Cryptogr. Hardw. Embed. Syst. 2021, 3, 496–519. [Google Scholar] [CrossRef]
- Sayakkara, A.; Le-Khac, N.A.; Scanlon, M. Leveraging Electromagnetic Side-Channel Analysis for the Investigation of IoT Devices. Digit. Investig. 2019, 29, S94–S103. [Google Scholar] [CrossRef]
- Yu, W.; Chen, J. Deep Learning-assisted and Combined Attack: A Novel Side-channel Attack. Electron. Lett. 2018, 54, 1114–1116. [Google Scholar] [CrossRef]
- Kumar, A.; Scarborough, C.; Yilmaz, A.; Orshansky, M. Efficient Simulation of EM Side-channel Attack Resilience. In Proceedings of the 2017 IEEE/ACM International Conference on Computer-Aided Design (ICCAD), Irvine, CA, USA, 13–16 November 2017; pp. 123–130. [Google Scholar] [CrossRef]
- Iyer, V.V.; Yilmaz, A.E. Using the ANOVA F-Statistic to Rapidly Identify Near-Field Vulnerabilities of Cryptographic Modules. In Proceedings of the 2021 IEEE MTT-S International Microwave Symposium (IMS), Atlanta, GA, USA, 7–10 June 2021; pp. 112–115. [Google Scholar] [CrossRef]
- Abdellatif, K.M. Towards Efficient Alignment for Electromagnetic Side Channel Attacks. In Proceedings of the 2019 31st International Conference on Microelectronics (ICM), Cairo, Egypt, 15–18 December 2019; pp. 118–121. [Google Scholar] [CrossRef]
- Wang, R.; Wang, H.; Dubrova, E. Far Field EM Side-Channel Attack on AES Using Deep Learning. In Proceedings of the 4th ACM Workshop on Attacks and Solutions in Hardware Security, New York, NY, USA, 13 November 2020; pp. 35–44. [Google Scholar] [CrossRef]
- Iyer, V.V.; Wang, M.; Kulkarni, J.; Yilmaz, A.E. A Systematic Evaluation of EM and Power Side-Channel Analysis Attacks on AES Implementations. In Proceedings of the 2021 IEEE International Conference on Intelligence and Security Informatics (ISI), Virtual Event, 2–3 November 2021; pp. 1–6. [Google Scholar] [CrossRef]
- Vasselle, A.; Maurine, P.; Cozzi, M. Breaking Mobile Firmware Encryption through Near-Field Side-Channel Analysis. In Proceedings of the 3rd ACM Workshop on Attacks and Solutions in Hardware Security Workshop, New York, NY, USA, 15 November 2019; ASHES’19; pp. 23–32. [Google Scholar] [CrossRef]
- Smith, S.W. The Scientist and Engineer’s Guide to Digital Signal Processing; California Technical Pub: San Diego, CA, USA, 1997. [Google Scholar]
- Frieslaar, I.; Irwin, B. Developing an Electromagnetic Noise Generator to Protect a Raspberry PI from Side Channel Analysis. SAIEE Afr. Res. J. 2018, 109, 85–101. [Google Scholar] [CrossRef]
- Zhou, Y.; Standaert, F.X. Simplified Single-Trace Side-Channel Attacks on Elliptic Curve Scalar Multiplication using Fully Convolutional Networks. In Proceedings of the 40th WIC Symposium on Information Theory in the Benelux, Leuven, Belgium, 28–29 May 2019. [Google Scholar]
- Han, Y.; Etigowni, S.; Liu, H.; Zonouz, S.; Petropulu, A. Watch Me, but Don’t Touch Me! Contactless Control Flow Monitoring via Electromagnetic Emanations. In Proceedings of the 2017 ACM SIGSAC Conference on Computer and Communications Security, New York, NY, USA, 30 October–3 November 2017; pp. 1095–1108. [Google Scholar] [CrossRef]
- Iyer, V.V.; Thimmaiah, A.; Orshansky, M.; Gerstlauer, A.; Yilmaz, A.E. A Hierarchical Classification Method for High-accuracy Instruction Disassembly with Near-field EM Measurements. ACM Trans. Embed. Comput. Syst. 2024, 23, 1–21. [Google Scholar] [CrossRef]
- Zunaidi, M.R.; Sayakkara, A.; Scanlon, M. A Digital Forensic Methodology for Encryption Key Recovery from Black-Box IoT Devices. In Proceedings of the 2024 12th International Symposium on Digital Forensics and Security (ISDFS), San Antonio, TX, USA, 29–30 April 2024. [Google Scholar]
- Davy, L. AESLib, 2022. GitHub Repository. Available online: https://github.com/DavyLandman/AESLib (accessed on 9 April 2024).
- Ken, M. micro-ecc, 2022. GitHub Repository. Available online: https://github.com/kmackay/micro-ecc (accessed on 9 April 2024).
- Sayakkara, A.; Miralles-Pechuán, L.; Le-Khac, N.A.; Scanlon, M. Cutting Through the Emissions: Feature Selection from Electromagnetic Side-Channel Data for Activity Detection. Forensic Sci. Int. Digit. Investig. 2020, 32, 300927. [Google Scholar] [CrossRef]
- Rawal, S.; Brantley, J.; Karabudak, N. Development of Carbon Nanotube-based Composite for Spacecraft Components. In Proceedings of the 2013 6th International Conference on Recent Advances in Space Technologies (RAST), Istanbul, Turkey, 12–14 June 2013; pp. 13–19. [Google Scholar] [CrossRef]
Figure 1.
Electromagnetic data generation step (adapted from [28]).
Figure 1.
Electromagnetic data generation step (adapted from [28]).

Figure 2.
Original FFT of the first window for AES128.

Figure 3.
Bucketed and normalized FFT of the first window for AES128.

Figure 4.
Correlation-based feature analysis.

Figure 5.
Confusion matrices for Logistic Regression, Random Forest, and XGBoost on combined AES and ECC data.
Figure 5.
Confusion matrices for Logistic Regression, Random Forest, and XGBoost on combined AES and ECC data.

Figure 6.
Confusion matrices for Logistic Regression on AES and ECC classifications.

Figure 7.
Confusion matrix for SVM on binary classification.


Table 1.
Comparison of EM-SCA advancements and the novel contribution of the current study.
| Study/Approach | Focus | Contribution to EM-SCA | Limitation | Current Study’s Contribution |
|---|---|---|---|---|
| Yu and Chen [13] | AES cryptographic circuit analysis | Retrieved AES keys via deep-learning-based SCA, correlating EM and power noise | Focused on secret key retrieval, not on key length or algorithm detection | Identifies key lengths and algorithms in IoT devices |
| Sayakkara et al. [12] | EM-SCA in IoT devices | Used EM-SCA on a Raspberry Pi to detect encryption operations with neural networks | Focused on encryption operations, not specifically on key lengths or algorithms | Focuses on identifying key lengths and algorithms in IoT devices |
| Won and Bhasin [9] | EM sensor use in cryptographic key retrieval | Employed CPA with a high-sensitivity EM sensor for AES-128 key retrieval | Specific to AES-128 key retrieval, not generalizable to the key length or algorithm | Broadens EM-SCA’s scope to include key length and algorithm detection |
Table 2.
Performance metrics of machine learning models on combined data AES and ECC (best result for each metric in bold).
Table 2.
Performance metrics of machine learning models on combined data AES and ECC (best result for each metric in bold).
| Model | Accuracy | Precision | F1 Score |
|---|---|---|---|
| Logistic Regression | 0.9403 | 0.9402 | 0.9402 |
| Random Forest | 0.9135 | 0.9134 | 0.9132 |
| XGBoost | 0.9358 | 0.9356 | 0.9357 |
| LightGBM | 0.9303 | 0.9302 | 0.9302 |
| SVM | 0.9455 | 0.9454 | 0.9455 |
Table 3.
Performance metrics of models for AES and ECC data (best result for each metric in bold).
| Model | AES Data | ECC Data | ||||
|---|---|---|---|---|---|---|
| Accuracy | Precision | F1 Score | Accuracy | Precision | F1 Score | |
| Logistic Regression | 0.9847 | 0.9847 | 0.9847 | 0.9876 | 0.9876 | 0.9876 |
| SVM | 0.9807 | 0.9808 | 0.9807 | 0.9834 | 0.9834 | 0.9834 |
| Random Forest | 0.9674 | 0.9675 | 0.9674 | 0.9651 | 0.9651 | 0.9651 |
| XGBoost | 0.9788 | 0.9789 | 0.9788 | 0.9816 | 0.9816 | 0.9816 |
| LightGBM | 0.9757 | 0.9757 | 0.9757 | 0.9768 | 0.9768 | 0.9768 |
Table 4.
Performance metrics for each model in the binary classification task (the best result for each metric in bold).
Table 4.
Performance metrics for each model in the binary classification task (the best result for each metric in bold).
| Model | Accuracy | Precision | F1 Score |
|---|---|---|---|
| Logistic Regression | 0.9501 | 0.9502 | 0.9501 |
| Random Forest | 0.9427 | 0.9433 | 0.9427 |
| XGBoost | 0.9535 | 0.9536 | 0.9535 |
| LightGBM | 0.9473 | 0.9476 | 0.9473 |
| SVM | 0.9597 | 0.9598 | 0.9597 |
Disclaimer/Publisher’s Note: The statements, opinions and data contained in all publications are solely those of the individual author(s) and contributor(s) and not of MDPI and/or the editor(s). MDPI and/or the editor(s) disclaim responsibility for any injury to people or property resulting from any ideas, methods, instructions or products referred to in the content. |
© 2024 by the authors. Licensee MDPI, Basel, Switzerland. This article is an open access article distributed under the terms and conditions of the Creative Commons Attribution (CC BY) license (https://creativecommons.org/licenses/by/4.0/).
Share and Cite
MDPI and ACS Style
Zunaidi, M.R.; Sayakkara, A.; Scanlon, M. Revealing IoT Cryptographic Settings through Electromagnetic Side-Channel Analysis. Electronics 2024, 13, 1579. https://doi.org/10.3390/electronics13081579
AMA Style
Zunaidi MR, Sayakkara A, Scanlon M. Revealing IoT Cryptographic Settings through Electromagnetic Side-Channel Analysis. Electronics. 2024; 13(8):1579. https://doi.org/10.3390/electronics13081579
Chicago/Turabian StyleZunaidi, Muhammad Rusyaidi, Asanka Sayakkara, and Mark Scanlon. 2024. "Revealing IoT Cryptographic Settings through Electromagnetic Side-Channel Analysis" Electronics 13, no. 8: 1579. https://doi.org/10.3390/electronics13081579
Note that from the first issue of 2016, this journal uses article numbers instead of page numbers. See further details here.