
Enhancing Stock Market Forecasts with Double Deep Q-Network in Volatile Stock Market Environments

School of Science and Technology, International Hellenic University, 57001 Thessaloniki, Greece
*
Author to whom correspondence should be addressed.
Electronics 2024, 13(9), 1629; https://doi.org/10.3390/electronics13091629
Submission received: 1 April 2024
/
Revised: 19 April 2024
/
Accepted: 22 April 2024
/
Published: 24 April 2024
(This article belongs to the Special Issue Machine Learning Advances and Applications on Natural Language Processing (NLP))
Abstract
:Stock market prediction is a subject of great interest within the finance industry and beyond. In this context, our research investigates the use of reinforcement learning through implementing the double deep Q-network (DDQN) alongside technical indicators and sentiment analysis, utilizing data from Yahoo Finance and StockTwits to forecast NVIDIA’s short-term stock movements over the dynamic and volatile period from 2 January 2020, to 21 September 2023. By incorporating financial data, the model’s effectiveness is assessed in three stages: initial reliance on closing prices, the introduction of technical indicators, and the integration of sentiment analysis. Early findings showed a dominant buy tendency (63.8%) in a basic model. Subsequent phases used technical indicators for balanced decisions and sentiment analysis to refine strategies and moderate rewards. Comparative analysis underscores a progressive increase in profitability, with average profits ranging from 57.41 to 119.98 with full data integration and greater outcome variability. These results reveal the significant impact of combining diverse data sources on the model’s predictive accuracy and profitability, suggesting that integrating sentiment analysis alongside traditional financial metrics can significantly enhance the sophistication and effectiveness of algorithmic trading strategies in fluctuating market environments.
1. Introduction
The field of stock market forecasting has always been a subject of great interest within the finance industry. It has been the focus of extensive research and innovative practices, with various traditional methods utilized to predict market trends. These methods include technical analysis, which examines historical market data such as price and volume, and fundamental analysis, which assesses a stock’s intrinsic value. Additional techniques involve quantitative and econometric models, applying mathematical, statistical, and economic analyses to forecast market directions [1].
However, these traditional approaches face challenges in managing the vast and intricate datasets prevalent in today’s financial markets. Machine learning (ML) has led to the introduction of revolutionary methodologies in stock market prediction, leveraging advanced algorithms to analyze vast quantities of data beyond human capacity. These models identify intricate patterns and relationships by training on extensive historical datasets, mirroring the learning process of human traders but with superior processing power [2]. Notably, ML has been employed in the field of finance for algorithmic trading. This strategy employs computer algorithms to execute trades at optimal speeds and volumes based on predefined criteria derived from various data sources, including market indicators and news events. Algorithmic trading enhances trade execution, minimizes costs, and improves risk management, with algorithms capable of evolving in response to market dynamics, thereby continuously optimizing trading strategies [3].
In addition to conventional data sources, social media platforms have become a great source of insightful information for analyzing the stock market. Popular platforms such as Twitter, StockTwits, and Reddit offer forums for users to share their views, expectations, and analyses of stock and market trends, making user-generated content a powerful source of sentiment data. These data reflect the collective mood and outlook of individuals concerning specific stocks or the market at large. The integration of social media sentiment analysis into stock market prediction models is an expanding field of interest. Sentiment analysis applies natural language processing (NLP), text analysis, and computational linguistics to identify, quantify, and examine emotional states and subjective insights from text [4,5].
By evaluating sentiments from social media content, researchers and analysts can assess public sentiment toward certain stocks or the overall market. This approach is invaluable for predicting short-term market movements influenced by public sentiment. Merging traditional market data with social media sentiment analysis offers a comprehensive approach to stock market forecasting [6]. ML models that assimilate and scrutinize both types of data can achieve more precise and holistic market predictions, capturing not only historical market trends but also market participants’ prevailing sentiments and expectations [7].
The potential of ML to enhance stock market predictions is significant. These models can analyze vast amounts of data and technical indicators beyond human capabilities and excel at detecting intricate patterns that may elude human analysts. This proficiency promises to refine trading strategies and improve returns. However, it is crucial to acknowledge the inherent challenges and limitations given the susceptibility of the stock market to unpredictable factors [8]. With ongoing technological advancements and the increasing availability of data, the landscape of stock market prediction is poised for further innovation. The dynamic interplay between technology and finance is exemplified by the merger of ML and social media sentiment analysis, which offers advanced and effective trading strategies. As exploration and refinement of these methods continue, the future of stock market forecasting appears vibrant and promising [9,10].
This study aims to explore the potential of using reinforcement learning, specifically through the double deep Q-network (DDQN) [11], to predict stock market trends. The research focuses on NVIDIA, a company with a reputation for volatility and significant market presence. The main goal and contribution of this research is the methodological application of the DDQN to predict short-term stock movements into three sequential phases, focusing on the NVIDIA stock and providing valuable insight into the ML model’s efficiency, integrating diverse data sources, including traditional financial indicators and sentiment analysis, to enhance predictive accuracy and profitability. The study comprehensively analyzes how combining these data sources refines trading strategies and increases profitability, demonstrating a clear progression as model complexity increases. Furthermore, it focuses on the impact of sentiment analysis, using NLP to integrate market sentiments from social media. Ultimately, this study aims to lay the groundwork for a more nuanced understanding of how data integration impacts algorithmic trading efficacy in the dynamic stock market environment by demonstrating that layered data integration can optimize algorithmic trading strategies in dynamic market environments.
2. Related Work
Stock market forecasting has evolved significantly, moving from traditional theories to leveraging cutting-edge technologies and incorporating psychological insights. Foundational theories such as the efficient market hypothesis (EMH) [12] and random walk theory [13] initially framed the understanding of market dynamics, suggesting that stock prices fully reflect all available information and follow unpredictable paths. These concepts have been instrumental in shaping investment strategies and financial analyses. However, criticisms from the realm of behavioral finance have exposed gaps in these theories, emphasizing the need to consider the psychological aspects that influence market movements and investor decisions. This has paved the way for a more nuanced understanding of market behaviors that incorporate both rational and irrational factors [14].
The field has since witnessed a shift toward integrating diverse forecasting methodologies, including fundamental and technical analysis, alongside advanced statistical and computational models [1]. The application of ML techniques, such as support vector machines (SVMs) [15], long short-term memory (LSTM) networks [16,17], and deep reinforcement learning (DRL) [18,19], represents a significant step toward enhancing predictive accuracy and processing complex datasets. These technological advancements have led to the development of sophisticated algorithmic trading strategies that can more effectively navigate the complexities of financial markets. Additionally, sentiment analysis, fueled by the wide spread of social media, has introduced a novel dimension to forecasting by capturing the collective mood and opinions of market participants. This convergence of quantitative analysis and qualitative insights underscores the multifaceted nature of stock market forecasting, reflecting an ongoing journey of adaptation and innovation in the face of financial market intricacies [20].
2.1. Core Theories of Stock Market Forecasting
The EMH, in [21], states that stock prices reflect all available information, making modern investment strategies possible. It is categorized into three forms: the weak form, which negates the predictive value of historical prices; the semi-strong form, which states that all public information is already priced; and the strong form, which suggests that no investor can consistently outperform the market due to the immediate incorporation of all information into stock prices [22,23]. Despite its widespread influence on passive investment strategies, EMH is assessed by behavioral finance to overlook human biases that may delay information assimilation [24].
Random walk theory, developed in [25] and later promoted in [26], declares that stock prices follow an unpredictable path, indicating that traditional forecasting methods are ineffective. This theory argues that stock movements are independent and random, challenging the ability of actively managed funds to surpass passive index funds in performance. However, this theory was reinforced in [24] by illustrating the futility of attempting to outguess market trends. Moreover, the analysis in [27] for random walk theory underscores the importance of developing economic models that account for observable patterns in asset pricing without necessarily disputing market efficiency.
Compared to related work and studies focused on the evolution of stock market forecasting from foundational theories to incorporating diverse statistical and machine learning methodologies, our study centers on the practical application of the DDQN and its benefits. We investigate integrating a multi-layered data strategy, including technical indicators, financial data, and sentiment analysis, highlighting not only the enhancement of the predictive accuracy of our DDQN model for NVIDIA’s short-term stock movements, but also presenting the methodology which advances those results and significantly improves algorithmic trading strategies in a volatile market. Unlike broad theoretical explorations, our research provides a detailed analysis of how layering distinct data types incrementally benefits the predictive capabilities of DDQN, demonstrating its practical implications.
2.2. Stock Market Prediction Methodologies
Stock market forecasting combines fundamental and technical analysis, time series, and momentum investing strategies to predict market movements. Fundamental analysis evaluates a stock’s value through economic indicators, company performance, and market demand [23,28,29]. Influential research has highlighted the importance of using financial ratios and accounting data for valuation, advocating for sector-specific studies [30,31,32,33].
Technical analysis utilizes historical price data and indicators such as the simple moving average (SMA), exponential moving average (EMA), moving average convergence divergence (MACD), relative strength index (RSI), and on-balance volume (OBV) to forecast trends [34,35,36,37]. In [38], it was emphasized that market prices reflect all available information, trends can be identified and exploited, and historical patterns often repeat. Moreover, time series analysis predicts stock prices by analyzing past trends and employing models such as ARIMA to account for seasonality and trends [39]. Additionally, the EMH challenges the premise of prediction based on historical data by stating that prices already reflect all known information [21]. Additionally, momentum investing is based on the observation that stocks with strong past performance tend to continue outperforming stocks with weak past performance in the short term. Studies [40,41,42] support this trend but also note concerns regarding transaction costs and the sustainability of momentum strategies. Behavioral finance studies, such as [43], show the complex influence of market trends on investor behavior.
2.3. Advances in Stock Market Forecasting through Machine Learning
A study in [44] aimed at predicting daily fluctuations in the Korea Composite Stock Price Index (KOSPI) utilized technical indicators as predictive variables. The goal was to forecast daily index movements, categorizing outcomes into two types: a decrease (“0”) or an increase (“1”) relative to the current day’s index value. The study analyzed data from 2928 trading sessions between January 1989 and December 1998, with 20% reserved for testing and the rest reserved for model training. Data normalization ensured consistent scaling within [−1.0, 1.0] to balance the influence of different variables and improve prediction accuracy. The research evaluated support vector machines (SVMs) using polynomial and Gaussian radial basis kernels against back propagation neural networks (BPNs) and case-based reasoning (CBR), and revealed that the performance of SVMs is superior due to their reliance on the structural risk minimization principle, suggesting that SVMs are effective at predicting financial time series and stock indices. These findings underscore the potential of SVM in enhancing stock market forecasting methods, offering significant implications for academic and practical applications in finance.
Researchers [45] studied the effectiveness of ML techniques, specifically the back propagation technique (BPN) and support vector machine (SVM) technique, in forecasting futures prices in the Indian stock market. Using real index futures data from the National Stock Exchange of India, this study compared these methods using statistical metrics such as the normalized mean squared error (NMSE), mean absolute error (MAE), and directional symmetry (DS) to evaluate the prediction accuracy. The results indicated SVM’s superior performance over BPN in forecasting accuracy for futures prices, highlighting SVM’s potential in financial forecasting within the Indian market context.
Furthermore, the application of long short-term memory (LSTM) models for stock market trend prediction has gained prominence due to their ability to capture complex temporal patterns in financial data. A study in [46] developed a classification model using LSTM networks aimed at predicting short-term price movements of Brazilian stocks, showcasing its efficacy in real-time trading with the model being retrained daily. This model, which integrates past pricing data and technical indicators, demonstrated significant predictive accuracy over baseline methods, underscoring the utility of LSTM in enhancing stock market prediction strategies. In another study [17], LSTM networks were applied to predict stock returns in the Chinese market, demonstrating a significant improvement in prediction accuracy from 14.3% to 27.2% over random predictions. The research utilized 900,000 training sequences of 30-day spans with 10 learning features and 3-day return rate labels and tested them on an additional 311,361 sequences, highlighting the potential of LSTM for financial forecasting within the volatile Chinese stock market.
The emergence of deep reinforcement learning (DRL), particularly deep Q-networks (DQNs), has influenced stock market prediction. DQN integrates reinforcement learning with deep neural networks to navigate the financial market’s inherent uncertainty and volatility, making informed sequential decisions based on historical data [47]. Previous research [48] introduced a DQN-based algorithmic trading (AT) system designed for single-stock trading with daily actions—”hold”, “long”, or “short”—and a reward system encouraging trend-compliant actions. By incorporating trading charges, the model outperformed the decision tree and buy-and-hold strategies across various metrics, including the accumulated return and Sharpe ratio, indicating that the DQN is effective at enhancing trading strategies and reducing portfolio volatility. This work presented the potential of the DQN in algorithmic trading, particularly in handling single-stock investments for improved financial performance. In managing the complexities of financial markets, the robustness and stability provided by methods used in fractional-order uncertain BAM neural networks [49] prove beneficial for ensuring reliable predictive performance under volatile conditions. Similarly, applying deep neural networks for probabilistic state estimation demonstrates their ability to surpass traditional methods, enabling real-time, uncertainty-aware decision making in dynamic environments [50].
2.4. The Role of Sentiment Analysis in Stock Market Forecasting
Researchers in [51] highlight the innovative use of time-specific data divisions to analyze investor sentiment through tweets and news articles, focusing on the more predictive value of sentiments expressed during stock market hours than natural day cycles, applying their methodology to companies’ stocks like Amazon, Netflix, Apple, and Microsoft, and showcasing that sentiment analysis during opening hours can better forecast next-day stock trends. Another study in [52] expands this concept by developing a user-facing application that dynamically assembles stock-related news to predict stock prices in real time using deep learning models. Additionally, in [53], a more general exploration of sentiment analysis on Twitter showcases its potential to estimate public sentiment towards specific stocks or sectors. They conclude that the effectiveness of such tools depends mainly on data quality and the precision of sentiment analysis algorithms.
Researchers in [54] present a sophisticated approach using neutrosophic logic to refine sentiment analysis processes by effectively handling uncertain and indeterminate data within social media content. Their methodology is based on feeding into a long short-term memory network, which uses the results from the sentiment analysis combined with historical stock data to predict market movements more accurately than previously compared models. Moreover, in [55], researchers integrated sentiment analysis with graph neural networks for stock predictions, highlighting the synergy between graph neural networks’ structural data representation capabilities and sentiment interpretation. They explored various graph structures, like stock and investor networks, and how those can incorporate sentiment data extracted from news articles, social media feeds, and financial reports.
The rise of social media has transformed societal interaction, enabling a digital landscape where “online individualism” continues to increase, enhancing dialog and collective action. This digital era emphasizes the importance of sentiment analysis, which aims to automate the extraction of subjective information—opinions, feelings, and attitudes—from natural language texts [56,57,58,59]. In financial contexts, sentiment reflects market participants’ collective optimism or pessimism, significantly influencing asset prices. Discrepancies between trading prices and inherent values often highlight the impact of sentiment, incorporating emotional responses and other exogenous factors into pricing mechanisms. This is central to behavioral finance, which investigates the effect of biases on financial decisions, and technical analysis, where price movements are seen as combinations of factual and emotional responses. Analysts and researchers have focused on identifying price levels that indicate emotional extremes, predicting potential corrections and market backsliding to mean values [60]. This approach underscores the critical role of sentiment in financial markets, offering insights into price deviations and correction predictions.
A study in [61] analyzed the impact of Twitter sentiment on stock market trends, specifically examining Microsoft ($MSFT). They collected 2.5 million tweets over a year, filtering them with Microsoft-related keywords. Preprocessing procedures, which included tokenization, stop word removal, and special character elimination, were used to prepare the tweets for analysis. Tweets were annotated for sentiment, and ML models classified the emotions of the remaining dataset. The logistic regression and LibSVM models achieved accuracies of 69.01% and 71.82%, respectively, demonstrating a significant correlation between Twitter sentiment and stock market movements, with model performance improving as the data volume increased. Researchers in [62] further investigated Twitter’s influence on stock markets during the COVID-19 pandemic, comparing its effect to that during the H1N1 pandemic. Their findings indicated that a lexicon-based method combined with correlation analysis could uncover subtle relationships between Twitter sentiment and financial indices, with the SenticNet lexicon proving particularly effective. This study confirmed social media’s increasingly pivotal role in forecasting stock market trends.
3. Data
This research’s methodology is based on the systematic collection of necessary data from three distinct sources chosen for their unique contributions to the research. This section details the selection criteria for these datasets and the preparation steps for analytical readiness, aiming for transparency in the data acquisition and modeling process.
3.1. Data Collection
This research specifically focuses on NVIDIA stocks, spanning from 2 January 2020 to 21 September 2023, a period denoted by significant volatility and changes in NVIDIA’s market valuation, thus making it an ideal period for investigating the dynamics of stock behavior and the efficacy of the DDQN integrating diverse data sources. The data were sourced from StockTwits, Yahoo Finance, and the yfinance Python library, with each source’s contribution detailed in subsequent sections.
3.1.1. StockTwits
The StockTwits platform [5,7], which is consistent with the platform’s user engagement patterns, was utilized for the sentiment analysis component of the study. Posts related to NVIDIA tagged as $NVDA were collected. StockTwits is a unique social media platform designed specifically for investors and traders. It was launched in 2008 and has grown into a vibrant community where participants share insights, strategies, and real-time market trends. Unlike traditional social media platforms, StockTwits is focused on the financial market, offering an environment for discussing stocks, bonds, cryptocurrencies, and other investment vehicles. The study gathered a range of attributes for each post on the StockTwits platform to ensure a comprehensive analysis. These attributes include:
- ID: A unique identifier for each post.
- Body: The main content or message of the post.
- Created_at: The original timestamp at which the post was created.
- User.home_country: The user’s home country.
- User.followers: The number of followers the user has on StockTwits.
- Likes.total: The total number of likes the post received.
- Entities.sentiment.basic: A basic sentiment analysis of the post, if available, categorizing it as bullish or bearish.
3.1.2. Technical Indicator Overview
Technical indicators are crucial for traders worldwide, assisting in making informed decisions. This study focuses on five widely recognized and effective indicators sourced from the yfinance Python library, chosen for their analytical relevance:
- SMA Fast;
- RSI;
- SStoch RSI;
- MACD;
- Volume weighted average price (VWAP).
SMA Fast is utilized for its responsiveness to recent price movements and for identifying short-term trends [63]. RSI, a momentum oscillator [64] ranging from 0 to 100, is employed for spot overbought or oversold conditions, with values above 70 indicating overbought situations and values below 30 indicating oversold situations. Stoch RSI offers a more sensitive measure for detecting these conditions [65]. MACD, a trend-following momentum indicator, identifies buy or sell signals through the relationship between two moving averages of stock prices [66]. Finally, VWAP [67] provides a day-trading benchmark, reflecting the average price a security trades at, weighted by volume, which is useful for institutional investors managing large trades.
3.1.3. Historical and Financial Data
Yahoo Finance [68], a well-known financial news and data platform, offers extensive financial resources such as real-time stock quotes, market data, portfolio management tools, and comprehensive news coverage. Its design facilitates easy monitoring of personal investments and market analysis, supplemented by interactive charts, historical stock data, and live earnings call webcasts.
For this study, historical data on NVIDIA stocks were retrieved from Yahoo Finance. The data encompasses key metrics such as closing, opening, high, and low prices, trading volume, and adjusted prices for the study period, with a focus on trading days only. Particular attention was given to analyzing the closing prices of NVIDIA stocks.
3.2. Data Wrangling
In our study, we used data wrangling techniques to enhance ML and sentiment analysis efficacy, utilizing the advanced RoBERTa model [69] for analyzing social media sentiments on StockTwits. This progression from conventional models to RoBERTa, notable for its adeptness with informal social media language, enables more accurate sentiment analysis, revealing a generally positive sentiment toward NVIDIA stocks. This finding is consistent with user engagement trends on the platform and NVIDIA’s market performance, illustrating the tendency of users to actively participate in discussions when they presented positive sentiments toward a stock.
Furthermore, our analysis incorporates essential technical indicators such as SMA, RSI, Stoch RSI, MACD, and VWAP, which were chosen for their ability to provide a detailed understanding of market behavior and assist in trading decisions. Coupled with Yahoo Finance data, which focus on active trading days and omit nontrading days for dataset consistency, our approach provides a robust foundation for reinforcement learning model development. This compact, focused strategy for data preparation and analysis sets the groundwork for leveraging reinforcement learning and sentiment analysis in financial market predictions, ensuring relevance and coherence with real-world trading activities.
3.2.1. Sentiment Analysis Methodology
In sentiment analysis, various models, such as VADER [70] and TextBlob [71], assess text sentiment polarity, categorizing it as positive, negative, or neutral. This study, however, utilizes the more recent and advanced RoBERTa model, an evolution of the BERT architecture, marking significant progress in the field. RoBERTa, which was introduced in “RoBERTa: A Robustly Optimized BERT Pretraining Approach” [69], is the basis for numerous specialized models for distinct text analysis tasks.
The chosen model for this analysis is the “Twitter-roBERTa-base for Sentiment Analysis”, detailed in “TWEETEVAL: Unified Benchmark and Comparative Evaluation for Tweet Classification” [72]. This model, fine-tuned on approximately 58 million tweets via the TweetEval benchmark, is especially effective for sentiment analysis of concise, often informal social media texts, like those found on StockTwits. Its selection was strategic, considering the dataset’s resemblance to Twitter’s content, enabling precise sentiment analysis of StockTwits posts.
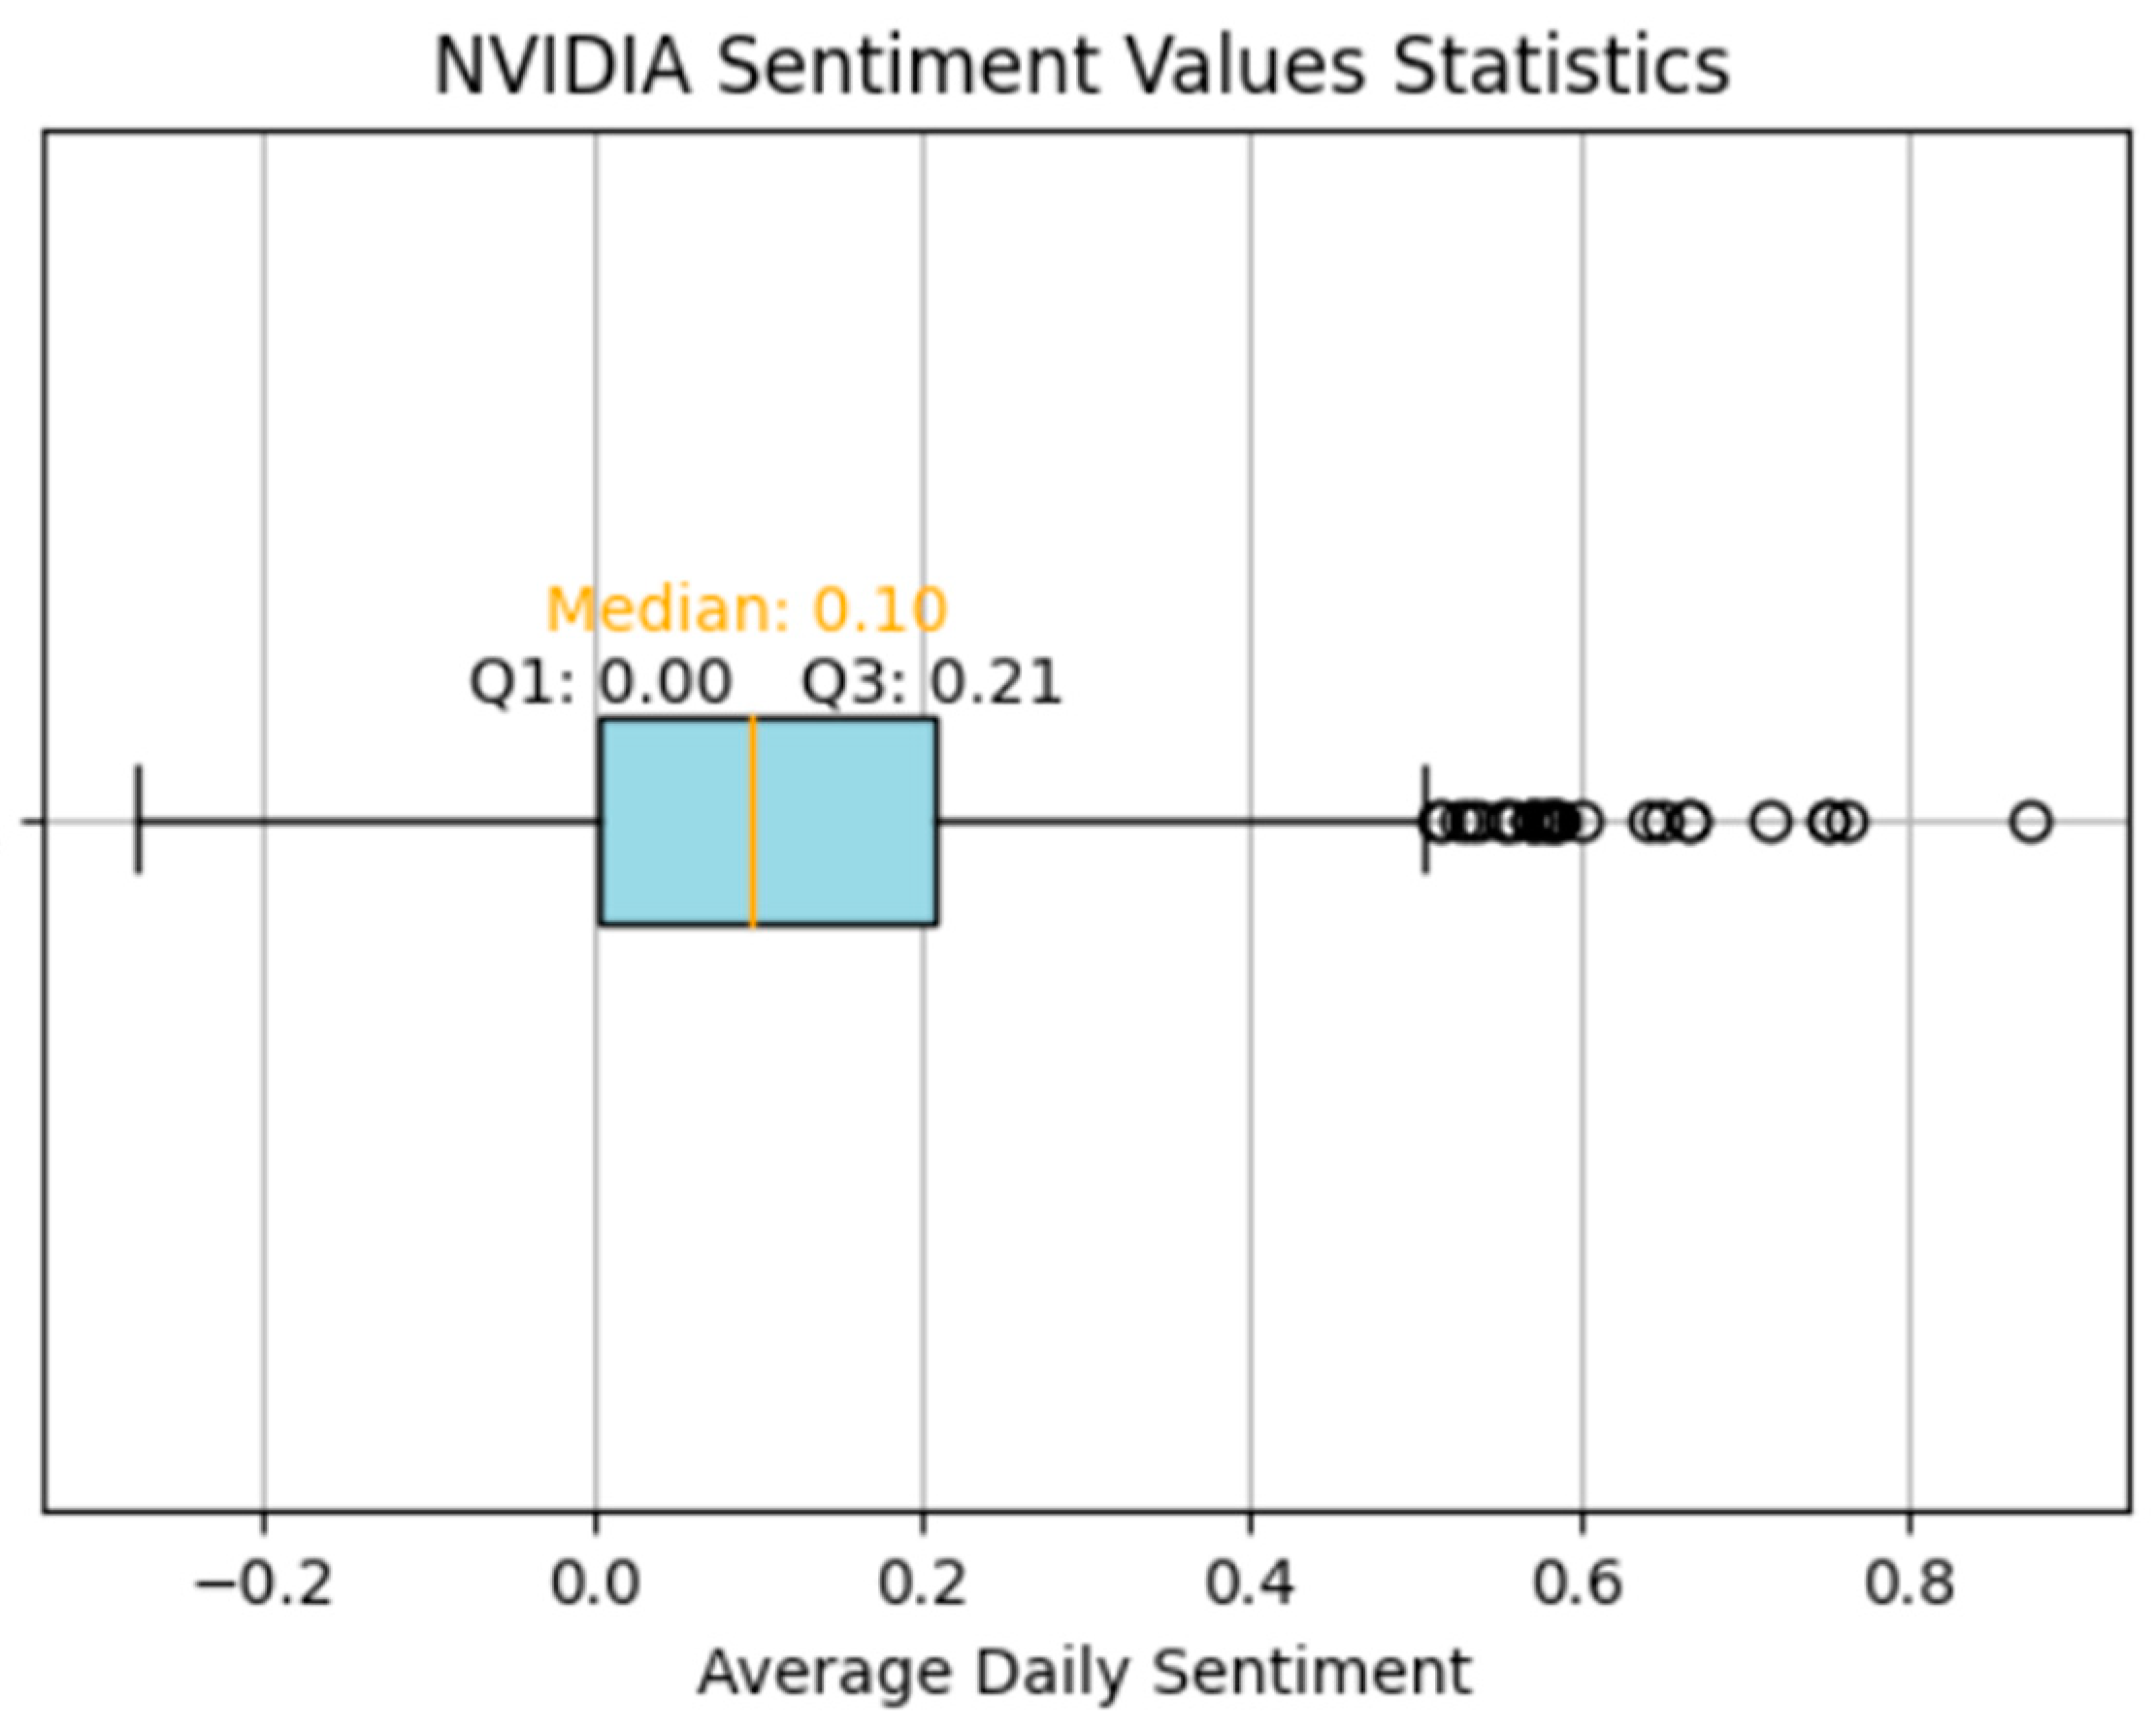
Figure 1 indicates a generally positive sentiment toward NVIDIA stocks, demonstrated by a sentiment scale ranging from −1 (negative) to +1 (positive), with a median sentiment value of 0.10, indicating a modestly positive average sentiment. The lower quartile (Q1) shows that 25% of sentiments are neutral or less, while the upper quartile (Q3) at 0.21 confirms a positive sentiment trend. The absence of negative outliers and a cluster of positive outliers highlight days with notably positive sentiment. This trend aligns with NVIDIA’s significant stock price growth in recent years, capturing user interest.
In summary, the analysis shows that the NVIDIA stock has a mildly positive sentiment on StockTwits. Users expressing positive sentiment toward a stock tend to be more active, leading to an increased presence of positive sentiment in posts. This reflects the natural tendency of optimists to share their views and follow related stock pages, suggesting that sentiment analysis on such platforms tends to lean positive, fueled by the enthusiasm of supportive users.
3.2.2. Technical Indicators
This study incorporates key technical indicators calculated using specified parameters, focusing on SMA, RSI, Stoch RSI, moving MACD, and VWAP.
SMA [63] is calculated over a 14-day period using closing stock prices, a method chosen for balancing recent price trends and volatility smoothing. The closing price, the last trade price during regular trading hours, offers a reliable market sentiment indicator.
RSI [64], a momentum oscillator, assesses the speed and change of stock price movements within a 14-day window to identify overbought or oversold conditions, with values over 70 indicating potential pullbacks and values below 30 indicating price rebounds. It underscores market strengths or weaknesses.
Stoch RSI [65], which enhances RSI’s sensitivity, applies stochastic calculations to RSI values to detect earlier market sentiment changes. Values above 0.8 suggest overbought conditions, and values below 0.2 indicate oversold states, aiding in identifying market trends.
MACD [66], a trend-following momentum indicator, illustrates the relationship between two EMAs, specifically the 12-period and 26-period EMAs. The MACD line is derived by subtracting the 26-period EMA from the 12-period EMA, with a nine-day EMA of MACD serving as a signal line for buying or selling cues.
VWAP [67] provides the average price a security has traded throughout the day, combining price and volume data. It offers a benchmark for evaluating trade efficiency, with purchases below VWAP and sales above it considered favorable.
Each indicator offers unique insights into market behavior, contributing to the development of a comprehensive technical analysis framework for informed trading decisions.
3.2.3. Yahoo Finance
The Yahoo Finance dataset captures daily trading activities, excluding weekends and holidays, to focus exclusively on active market days. This study primarily analyzes closing prices, confronting challenges associated with missing data on nontrading days.
Two prevalent methods address this issue: linear interpolation and the complete omission of nontrading days. This research removed nontrading data from the analysis to ensure a consistent and uninterrupted dataset for modeling, as further explored in a subsequent section on reinforcement model structuring. Similarly, this exclusion principle applies to sentiment analysis of StockTwits posts, where nontrading days are ignored to prevent their influence on sentiment metrics. This strategy maintains the relevance and consistency of the sentiment analysis with actual trading periods.
4. Modeling
In the Modeling section of our study, we focus on developing and implementing an advanced stock market trading agent, leveraging the DDQN methodology to address and mitigate the overestimation biases commonly found in DQN models. This refinement allows for a more precise assessment of action values by separating the processes of action selection and evaluation. The agent is programmed with the capability to perform “BUY” and “SELL” actions based on predictive analyses of daily market changes, supported by a meticulously designed reward system that aligns with the fundamental trading principle of buying low and selling high. By integrating a policy network for decision making and a target network to enhance training stability, along with employing experience replay for a varied and efficient learning experience, our model simulates a realistic trading environment requiring nuanced daily market evaluations.
This section further explores the created reinforcement learning environment that frames the agent’s operational context, detailing the structure of the action space and the formulation of the reward function to encapsulate a realistic trading scenario. By creating multiple DDQN environments, each incorporating varying levels of market data complexity, our study aims to assess the impact of different data types—ranging from closing prices and technical indicators to market sentiment—on the agent’s ability to forecast short-term stock movements. This comprehensive approach highlights the versatility of DDQN in adapting to complex market conditions and emphasizes the potential of reinforcement learning to transform financial market strategies, demonstrating the way for future advancements in algorithmic trading.
4.1. Agent
This study introduces a stock market trading agent for daily operations. It utilizes the DDQN technique to overcome the overestimation bias prevalent in DQN models. By decoupling action selection from evaluation, DDQN ensures more accurate value assessments [73].
The agent employs “BUY” and “SELL” actions in response to daily market dynamics. BUY actions are predicated on expected stock value increases, while SELL actions anticipate decreases, aiming to capitalize on or mitigate market fluctuations. The reward system is drafted to promote sound trading decisions, with “BUY” rewards based on subsequent price increases and “SELL” rewards based on decreases, signifying the principle of buying low and selling high. Figure 2 presents the schema of the Q-network process.
DDQN’s framework includes a policy network for decision making and a target network for stability during training, with the latter’s parameters periodically refreshed to minimize volatility. A key learning mechanism is experience replay, which stores and randomly samples experiences to enhance training inputs and improve learning efficiency. The emphasis on daily trading aligns the agent’s operation with real-world trading environments, requiring daily market assessments to inform actions [74]. This DDQN-based approach aims to simulate effective trading strategies, highlighting the potential of advanced reinforcement learning in stock trading applications.
4.2. Environment in Reinforcement Learning
In reinforcement learning (RL), the environment is a crucial element that outlines the context for agent operations, defining external conditions and parameters for decision making. Specifically, within the DDQN, the environment is instrumental in directing the agent’s learning and decision-making processes. It encompasses the state space, action space, and reward system, presenting the agent with states and evaluating its actions through rewards or penalties, consequently facilitating learning and adaptation to environmental dynamics.
This study explores three DDQN environments, each adding complexity through additional market data:
- Closing Price Environment: This environment focuses on daily stock closing prices, serving as a foundational framework for understanding basic market fluctuations.
- Technical Indicators with Closing Price Environment: Enhances the closing price data with technical indicators (SMA, MACD, RSI, Stoch RSI, VWAP), offering a multifaceted market perspective that includes trend, momentum, and volume analysis.
- Technical Indicators, Sentiment, and Closing Price Environment: Integrates closing price, technical indicators, and market sentiment (from StockTwits) for comprehensive stock market analysis, encouraging the agent to consider quantitative and qualitative data in decision making.
Normalization across these environments utilizes RobustScaler [75], which is notably suitable for financial data prone to volatility and outliers. This scaler ensures data integrity and consistent model training, and its stability to outliers and trend accommodation maintains data point relevance during normalization.
This environmental setup presents agents with escalating market complexities, from basic price trends to combined technical and sentiment analysis. Employing RobustScaler ensures uniform input scaling, promoting unbiased learning. This progressive environmental design prepares the DDQN agent for diverse trading scenarios, reflecting the complexity of real-world stock trading.
4.3. Action Space
In this reinforcement learning experiment, the action space [76] is critically designed to enable the agent’s decision making with two fundamental actions: “BUY” (0) and “SELL” (1). This binary structure serves the experiment’s goal of evaluating the agent’s ability to predict daily stock price movements, either upward or downward, thereby assessing its capability for making profitable trading decisions.
4.4. Reward Function
The reward function [77] in our study is designed to be direct and impactful, focusing on the financial consequences of the agent’s actions using real financial figures without normalization. This approach ensures that the rewards genuinely reflect the outcomes of trading decisions, thereby motivating the agent to develop effective trading strategies. The reward mechanism operates as follows:
- SELL action: The reward is calculated based on the difference between the selling day’s closing price and the following day’s closing price. A positive reward indicates a profitable sell (price dropped the next day), and a negative reward suggests a loss (price increased the next day).
- BUY action: The reward is the difference between the next day’s closing price and the current day’s closing price, with a positive reward indicating a gain (price increased the next day) and a negative reward indicating a loss (price decreased the next day).
This method of calculating rewards based on actual price movements provides a realistic measure of trading success and offers the agent clear feedback on its decisions.
This study focuses on analyzing the impact of different data types on agents’ predictive abilities rather than simulating a comprehensive trading scenario. By simplifying the reward structure and limiting the action space to buying and selling, this study aims to directly evaluate how closing prices, technical indicators, and sentiment analysis influence short-term stock predictions.
This simplified approach examines the contribution of each data layer to the agent’s decision-making process, avoiding the complexity of more intricate trading simulations that could weaken the clarity of these insights. This methodology underlines the potential of reinforcement learning in financial market applications, demonstrating its capacity for profit generation, and deepening our understanding of market dynamics.
4.5. Advanced Techniques in DDQN Model Optimization
This section presents the intricate mechanisms and strategic methodologies underpinning our DDQN model, aimed at refining the decision-making processes in stock market trading. Central to our model’s learning and adaptation capabilities is the experience replay memory technique, a cornerstone in DRL that significantly enhances algorithmic performance by mitigating the correlation among sequential learning samples. This technique, supplemented by a capacity of 100,000 steps, ensures a rich repository of experiences for the agent, facilitating a sophisticated learning process across varied market scenarios.
Additionally, we implement a step-decaying learning rate and a decaying epsilon-greedy strategy, which are crucial for balancing the exploration of new strategies against exploiting known profitable actions. The step-decaying learning rate methodically reduces the learning rate to fine-tune the model’s adjustments for precision. At the same time, the decaying epsilon-greedy strategy systematically lowers epsilon and shifts focus from exploration to exploitation as the agent acquires additional information. These methodologies optimize the training process and ensure a well-rounded and adaptive learning experience, highlighting the sophisticated design and execution of our DDQN model.
4.5.1. Experience Replay Memory in Deep Q-Networks
Experience replay memory is a key strategy in DQNs and is essential for enhancing learning stability and efficiency in DRL. Researchers in [78] used this method, involving the storage and reutilization of past transitions (state, action, reward, next state) for learning. This approach mitigates the correlation among sequential learning samples, which is a challenge in deep RL, particularly with high-dimensional inputs such as Atari game frames.
The utility of experience replay stems from its capacity to ensure a diversified and uncorrelated selection of experiences for training batches, thereby improving algorithmic performance and learning robustness. It randomizes the learning updates by drawing samples from a replay buffer, granting even rare but crucial experiences repeated opportunities to impact the learning outcome and aid in retaining knowledge over time [79].
For our study, experience replay memory was essential, given the limited size of the dataset. With a capacity of 100,000 steps, it provided a comprehensive repository of encountered experiences, enabling the agent to leverage and learn from various situations. This extensive memory allowed for the revisiting of past transitions, contributing to a well-informed and refined learning process by utilizing every piece of data within the dataset for informed decision making.
4.5.2. Step-Decaying Learning Rate
In the DDQN framework, the implementation of a step-decaying learning rate [80] serves to strategically refine the learning process. This technique, in contrast to a static learning rate, systematically lowers the learning rate at predetermined periods, facilitating several advantages:
- Efficient convergence: Starting with a higher learning rate to achieve quick convergence to a viable solution, the rate to fine-tune the adjustments gradually decreases, culminating in a more refined and precise model.
- Adaptability: Adjusts the learning pace according to the agent’s progression, employing larger steps for swift initial learning and smaller steps for meticulous model refinement in later stages.
- Prevention of oscillations: A reduced learning rate in advanced training phases shortens fluctuations near the optimal solution, enhancing the model’s precision and stability.
This approach effectively balances exploration and exploitation by modulating the learning velocity in sync with the agent’s incremental task comprehension.
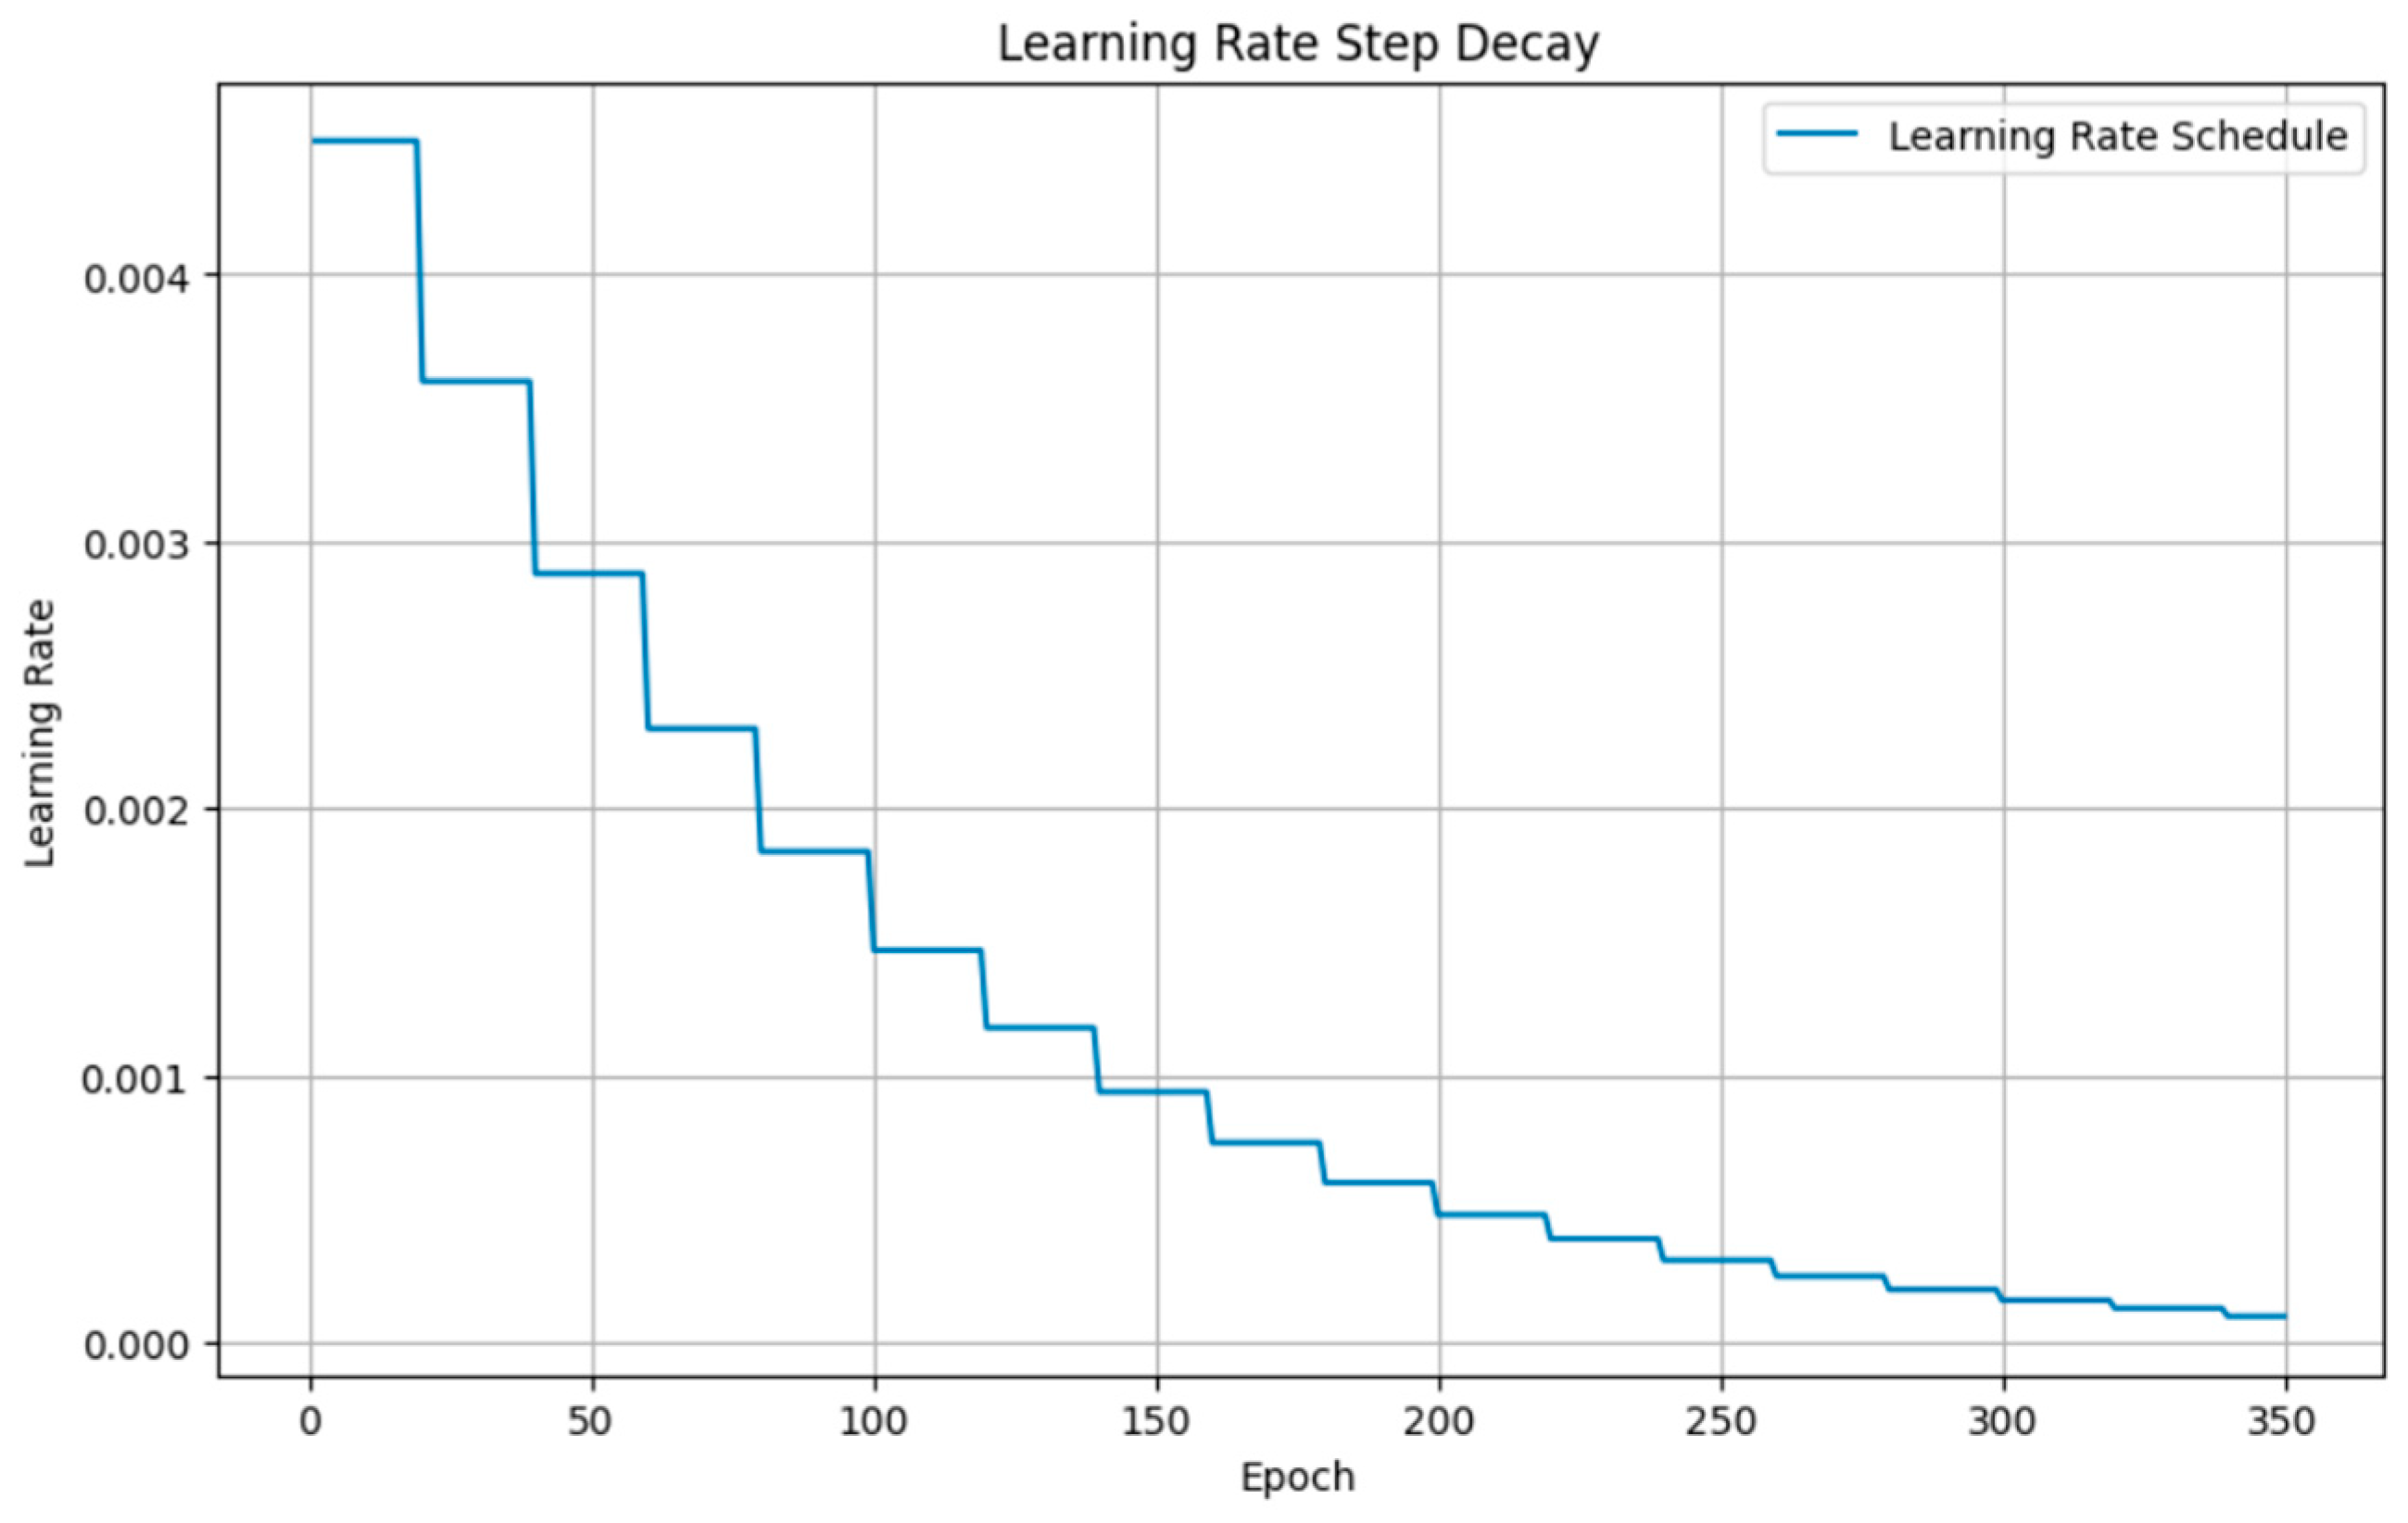
The step-decay procedure is illustrated in Figure 3 for a model starting with an initial learning rate of 0.0045. A decay factor of 0.8, applied at fixed intervals—every 20 epochs—characterizes this method. The learning rate is kept constant within each interval before being reduced multiplicatively by the decay factor. This creates a staircase effect on the learning rate across 300 epochs, optimizing the training process and allowing the model to adjust smoothly to the evolving learning rate for an efficient and effective learning experience. Additionally, this controlled approach assists in reducing the risk of exceeding the minimum of the loss function, which can be particularly useful in the later stages of training when finer adjustments are essential for stabilizing the model.
4.5.3. Decaying the Epsilon-Greedy Strategy
The epsilon-greedy strategy, which is pivotal in the realm of DQNs for reinforcement learning, is formulated to strike an optimal balance between the exploration of new actions and the exploitation of familiar ones [81]. It operates on a mechanism where the agent, based on a predefined probability epsilon (ε), either randomly selects an action or commits to the most advantageous known action with a probability of 1 − ε. Starting with a higher ε promotes exploration, facilitating the acquisition of varied environmental insights. Over time, ε decreases to enhance the focus on exploiting accumulated knowledge for optimal decision making. This methodology enables the agent’s learning by ensuring a balanced approach to discovering new strategies and applying learned experiences.
In our DDQN model, the decaying epsilon-greedy approach is essential for modulating the exploration–exploitation trade-off. Initially, set high, epsilon propels the agent toward exploration, enabling a broad sampling of actions for environmental learning. As the agent becomes more knowledgeable, epsilon decays, gradually orienting the strategy toward exploiting learned behaviors.
The key advantages of this strategy include the following:
- Balanced exploration and exploitation: This prevents the agent from being overly cautious or excessively daring, ensuring a well-rounded learning experience by integrating discoveries with existing knowledge.
- Adaptive learning: The strategy’s decaying nature allows the agent’s exploration-exploitation balance to adjust over time, which is tailored to the pace of learning, ensuring a smooth transition from exploration to exploitation.
- Enhanced decision making: With the reduction in epsilon, the agent increasingly relies on its learned Q-values for making decisions, resulting in more accurate and optimal choices reflecting its cumulative experiences.
Therefore, the decaying epsilon-greedy strategy is fundamental to the DDQN model, facilitating effective navigation between exploring novel strategies and leveraging known rewards, which significantly contributes to a sophisticated and efficient learning process.
Our research examined the epsilon decay strategy across 350 epochs, which is integral to balancing exploration and exploitation in reinforcement learning. Initially, at 1.0, epsilon indicates the likelihood of the model taking a random action to promote exploration. Throughout the training, we applied a decay rate of 0.991 per epoch, reducing epsilon to a floor of 0.05. This methodical reduction in epsilon facilitates a smooth transition from an exploration-dominant approach to one that favors exploitation, progressively favoring informed decisions over random actions. The observed epsilon trend depicted a consistent exponential decrease, illustrating the effectiveness of this strategy in adjusting the model’s learning focus over time.
5. Results
This section evaluates the performance of a DDQN agent within the stock market prediction context by examining its behavior through diverse training stages and environmental conditions. We focus on the agent’s performance during the training and testing phases across three distinct and complex environmental settings.
The initial environment is based on the stock’s closing price, providing a basic understanding of market trends. The second setting incorporates technical indicators to enrich the model’s inputs, which is crucial for analyzing market patterns and predicting future price shifts. These indicators offer insights into market momentum, trends, and volatility, providing the agent with a more detailed awareness of market dynamics. The last set includes sentiment analysis, introducing a component that captures the sentiment and subjective dimensions of the market. This addition aims to mirror the impact of public sentiment, as reflected on social media, on stock prices.
Throughout the training phase, the agent’s goal is to refine its strategy for optimal performance based on the state representations of each environment. This phase is essential for the agent to enhance its prediction and market strategy skills. Performance is measured by the total profits achieved by the agent in each episode.
During the DDQN model training phase, 890 active trading days were utilized, excluding weekends, public holidays, and market closure days, starting on 2 January 2020, with an opening stock price of USD 59.97, and ending on 17 July 2023, with a closing price of USD 464.60. This period encompasses various market conditions, from volatility triggered by global events in 2020 to recovery and growth in the following years, providing a rich dataset that likely improved the training robustness and enabled the DDQN model to adjust to different trading environments.
5.1. Experiment Setup
In this research, we conducted a series of experiments to evaluate the efficacy of DDQN within three uniquely defined environmental states. Each state was subjected to three distinct tests, employing predetermined random seeds to ensure consistency and reproducibility of the results. The strategic application of these seeds across all tests was critical for maintaining the integrity and comparability of our findings.
In ML and, more specifically, reinforcement learning, random seeds serve as the foundation for generating reproducible sequences of random numbers. These sequences are essential to numerous aspects of the learning process, including but not limited to the initial setting of network weights, the selection of actions, and the sampling from experience replay buffers. The value of a random seed lies in its ability to generate a consistent sequence of “random” numbers across different runs, provided that the seed value is unchanged.
A uniform set of random seeds across various experiments guarantees that each trial is conducted under the same initial conditions and random processes. This uniformity was crucial for accurately comparing the performance of the DDQN agent across different environmental states, as it minimizes the impact of random variations in the learning process.
Furthermore, the fixed random seed methodology directly links the observed performance differences to the modifications in environmental states, eliminating random variability as a confounding factor. This practice significantly strengthens the trustworthiness of our experimental conclusions.
Reinforcement learning frameworks, such as the DDQN, are prone to overfitting, particularly in intricate scenarios such as predicting stock market movements. Overfitting describes a scenario where a model excessively learns from the training data to the detriment of its performance on unseen data by capturing noise and anomalies as if they were significant patterns. This issue is a prominent concern in reinforcement learning due to the critical balance required between the exploration of new strategies and the exploitation of known rewards.
To reduce the risk of overfitting in our study, we meticulously calibrated the number of training episodes. This planning aimed to provide the agent with satisfactory learning opportunities while safeguarding against the potential for overfitting to the training data patterns. By adopting this approach, we aimed to cultivate a strategy within the agent that is both generalizable and resilient rather than overly tailored to the specific instances presented during training.
5.2. Training Phase
During the training phase of this study, the DDQN model was evaluated across three sequential experiments, each designed to progressively integrate layers of information and assess their impact on the model’s ability to predict stock market movements. Starting with a basic environment that utilized only NVIDIA’s closing stock prices, this phase set a foundational benchmark for the model’s performance, highlighting the limitations of relying on a singular data point for decision making. As the study advanced, the environment was enriched first with technical indicators, offering a broader perspective on market dynamics, and then with sentiment analysis from the StockTwits platform, incorporating qualitative insights into market sentiment. This enhancement allowed for a detailed examination of how varying types and complexities of data influence the model’s trading strategies and effectiveness.
The findings of these experiments revealed a clear trajectory toward improved profitability and strategic sophistication within the DDQN model’s operations. Experiment 1 demonstrated the inherent limitations of a closing price-based model, prompting a move toward a more nuanced approach in Experiment 2 with the introduction of technical indicators. This shift yielded a more balanced distribution of buy and sell actions, paving the way for Experiment 3’s integration of sentiment analysis, which further refined the trading strategies by incorporating public opinion and market sentiment. Through this phased approach, the research showcased the progressive enhancement of the model’s predictive accuracy and profitability and underscored the necessity of embracing a multifaceted data integration strategy. The insights gleaned from this training phase, which will be presented in the following subsections, emphasize the significance of combining diverse data sources, including both quantitative and qualitative information, to bolster the sophistication and effectiveness of algorithmic trading strategies in navigating the complexities of the stock market.
5.2.1. Closing Price Environment (Experiment 1)
The initial experiment within our investigation sets the stage with the most basic configuration, focusing exclusively on the stock’s closing price. This environment, the simplest of the three evaluated, bases its entire premise on this singular data point, offering a foundational yet narrow perspective for the trading agent’s decision-making process.
This simplified approach has several limitations. While the closing price reflects the stock’s final trading position each day, it does not provide a comprehensive view of the market’s broader movements. Consequently, the agent is bereft of critical information that could facilitate a more rounded understanding of market behaviors and trends.
Figure 4 illustrates the agent’s buy and sell actions in the final episode. A dominance of buy actions is noted, indicating an expectation of higher returns from buying rather than selling. The absence of deeper market insights, such as those from technical indicators on market momentum or comprehensive trends, significantly restricts the agent’s ability to distinguish and respond to market developments. Given the agent’s limited operational scope, any perceived short-term trends based solely on closing prices are vulnerable to sudden and inexplicable changes.
Figure 5 reveals the variability in total profits across episodes, highlighting the agent’s struggle to stabilize its trading strategy. This fluctuation suggests that without a broader array of market data, the agent struggles to form a consistent approach to trading, hindered by the sparse information available in this elementary environment.
Thus, while this initial setting provides an introductory platform for the agent’s engagement with the stock market, its basic nature significantly constrains the agent’s capacity to develop a sophisticated market analysis. The findings underscore the need for a more enriched environmental setup, incorporating a wider spectrum of market data, to empower the agent with the knowledge necessary for executing informed and strategic trading decisions.
5.2.2. Enhanced Environment with Technical Indicators (Experiment 2)
In this phase of our study, the environment for the DDQN model incorporates technical indicators, providing a richer dataset for the agent’s decision-making processes. This augmentation significantly influences the agent’s trading behavior, as evidenced in Figure 6, where the agent executed a balanced mix of 483 buy and 406 sell actions. This contrasts with the previous experiment’s dominance of buy actions, illustrating how technical indicators have equipped the agent with a deeper understanding of market dynamics, facilitating a finer strategy in trading decisions. This development underscores the pivotal role of comprehensive data in refining trading strategies and enhancing market analysis.
The training progress in this enriched environment shows less volatility across episodes than that observed in the initial experiment, suggesting a more stable and comprehensible environment for the agent. This stability indicates that the introduction of technical indicators provides sufficient information for the agent to discern optimal actions early in the training process, indicating the effectiveness of these indicators in improving performance.
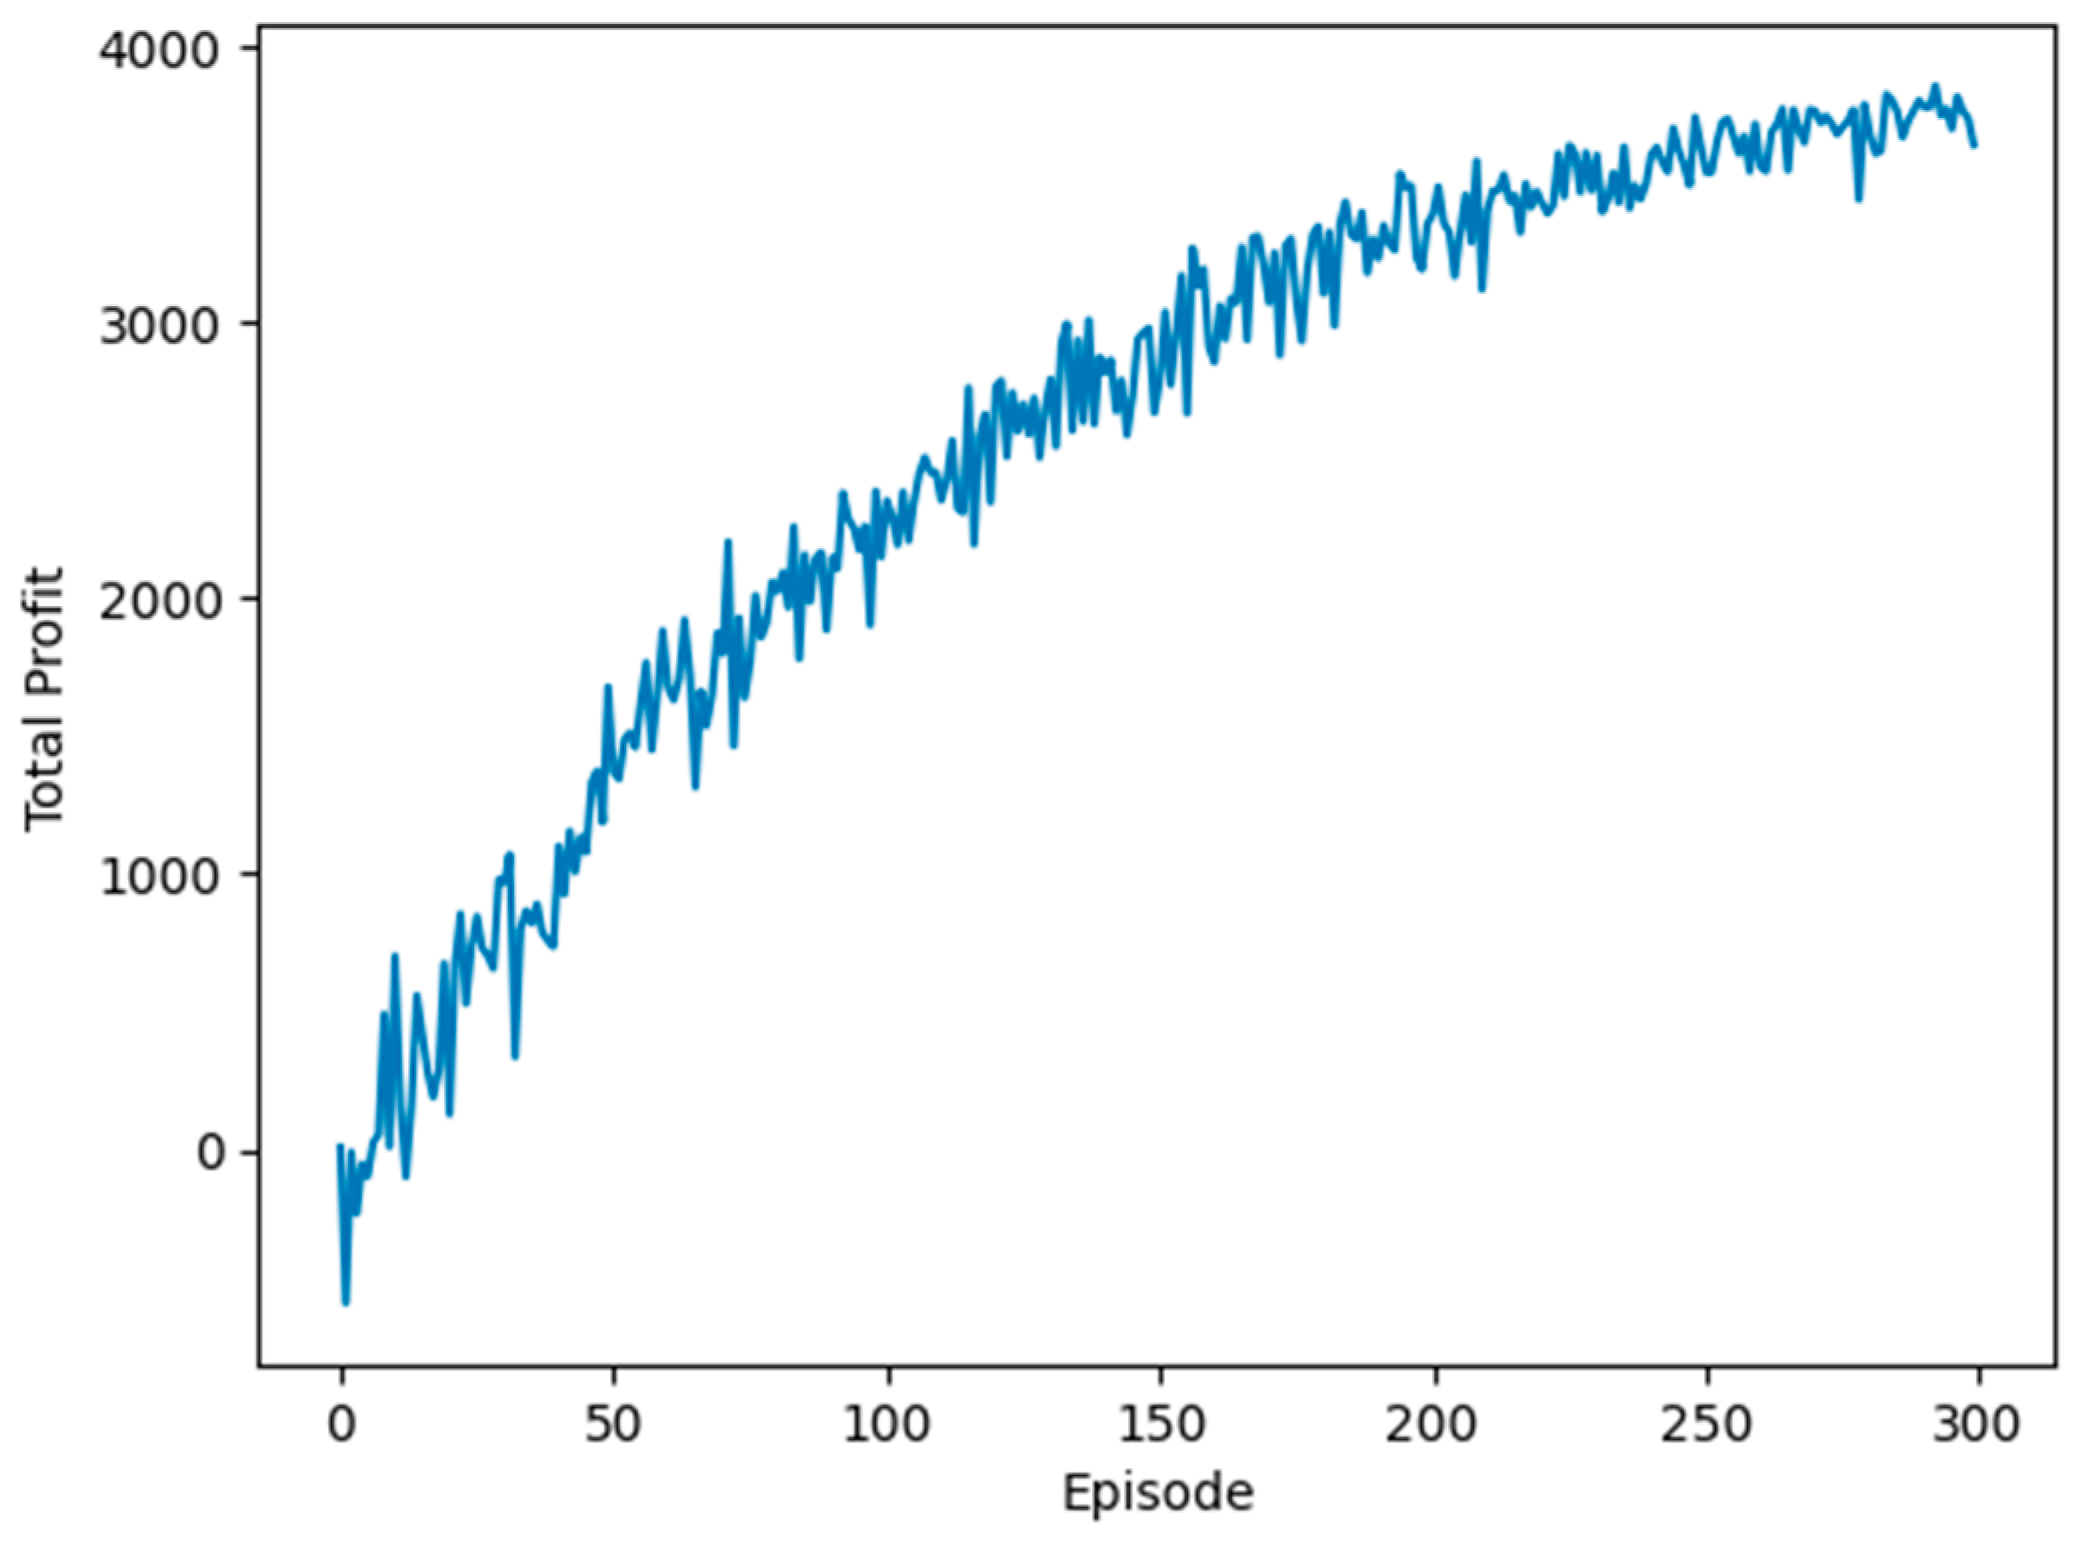
In Figure 7, the trajectory of total profits during training episodes demonstrates a marked improvement in the agent’s ability to identify optimal trading actions, with profits peaking at approximately USD 3500 before reaching a plateau. This enhanced performance relative to the initial experiment highlights the value of integrating technical indicators into the trading environment, enabling the agent to achieve better-informed trading decisions and, consequently, more consistent profits.
5.2.3. Comprehensive Environment with Closing Prices, Technical Indicators, and Sentiment Analysis (Experiment 3)
In this concluding experiment of the training phase, the environment encompasses closing prices, technical indicators, and market sentiment analysis, providing a comprehensive market overview. This multifaceted approach merges quantitative data (such as closing prices and technical indicators) with qualitative insights (derived from sentiment analysis), challenging the agent to navigate through empirical evidence and sentiment-driven market trends in its decision-making process.
In Figure 8, we observe the agent’s trading decisions. The number of “buy” actions, totaling 475, slightly surpassed the number of “sell” actions, which accounted for 414. This distribution reflects the agent’s strategic balance in action selection, informed by a broad spectrum of market data.
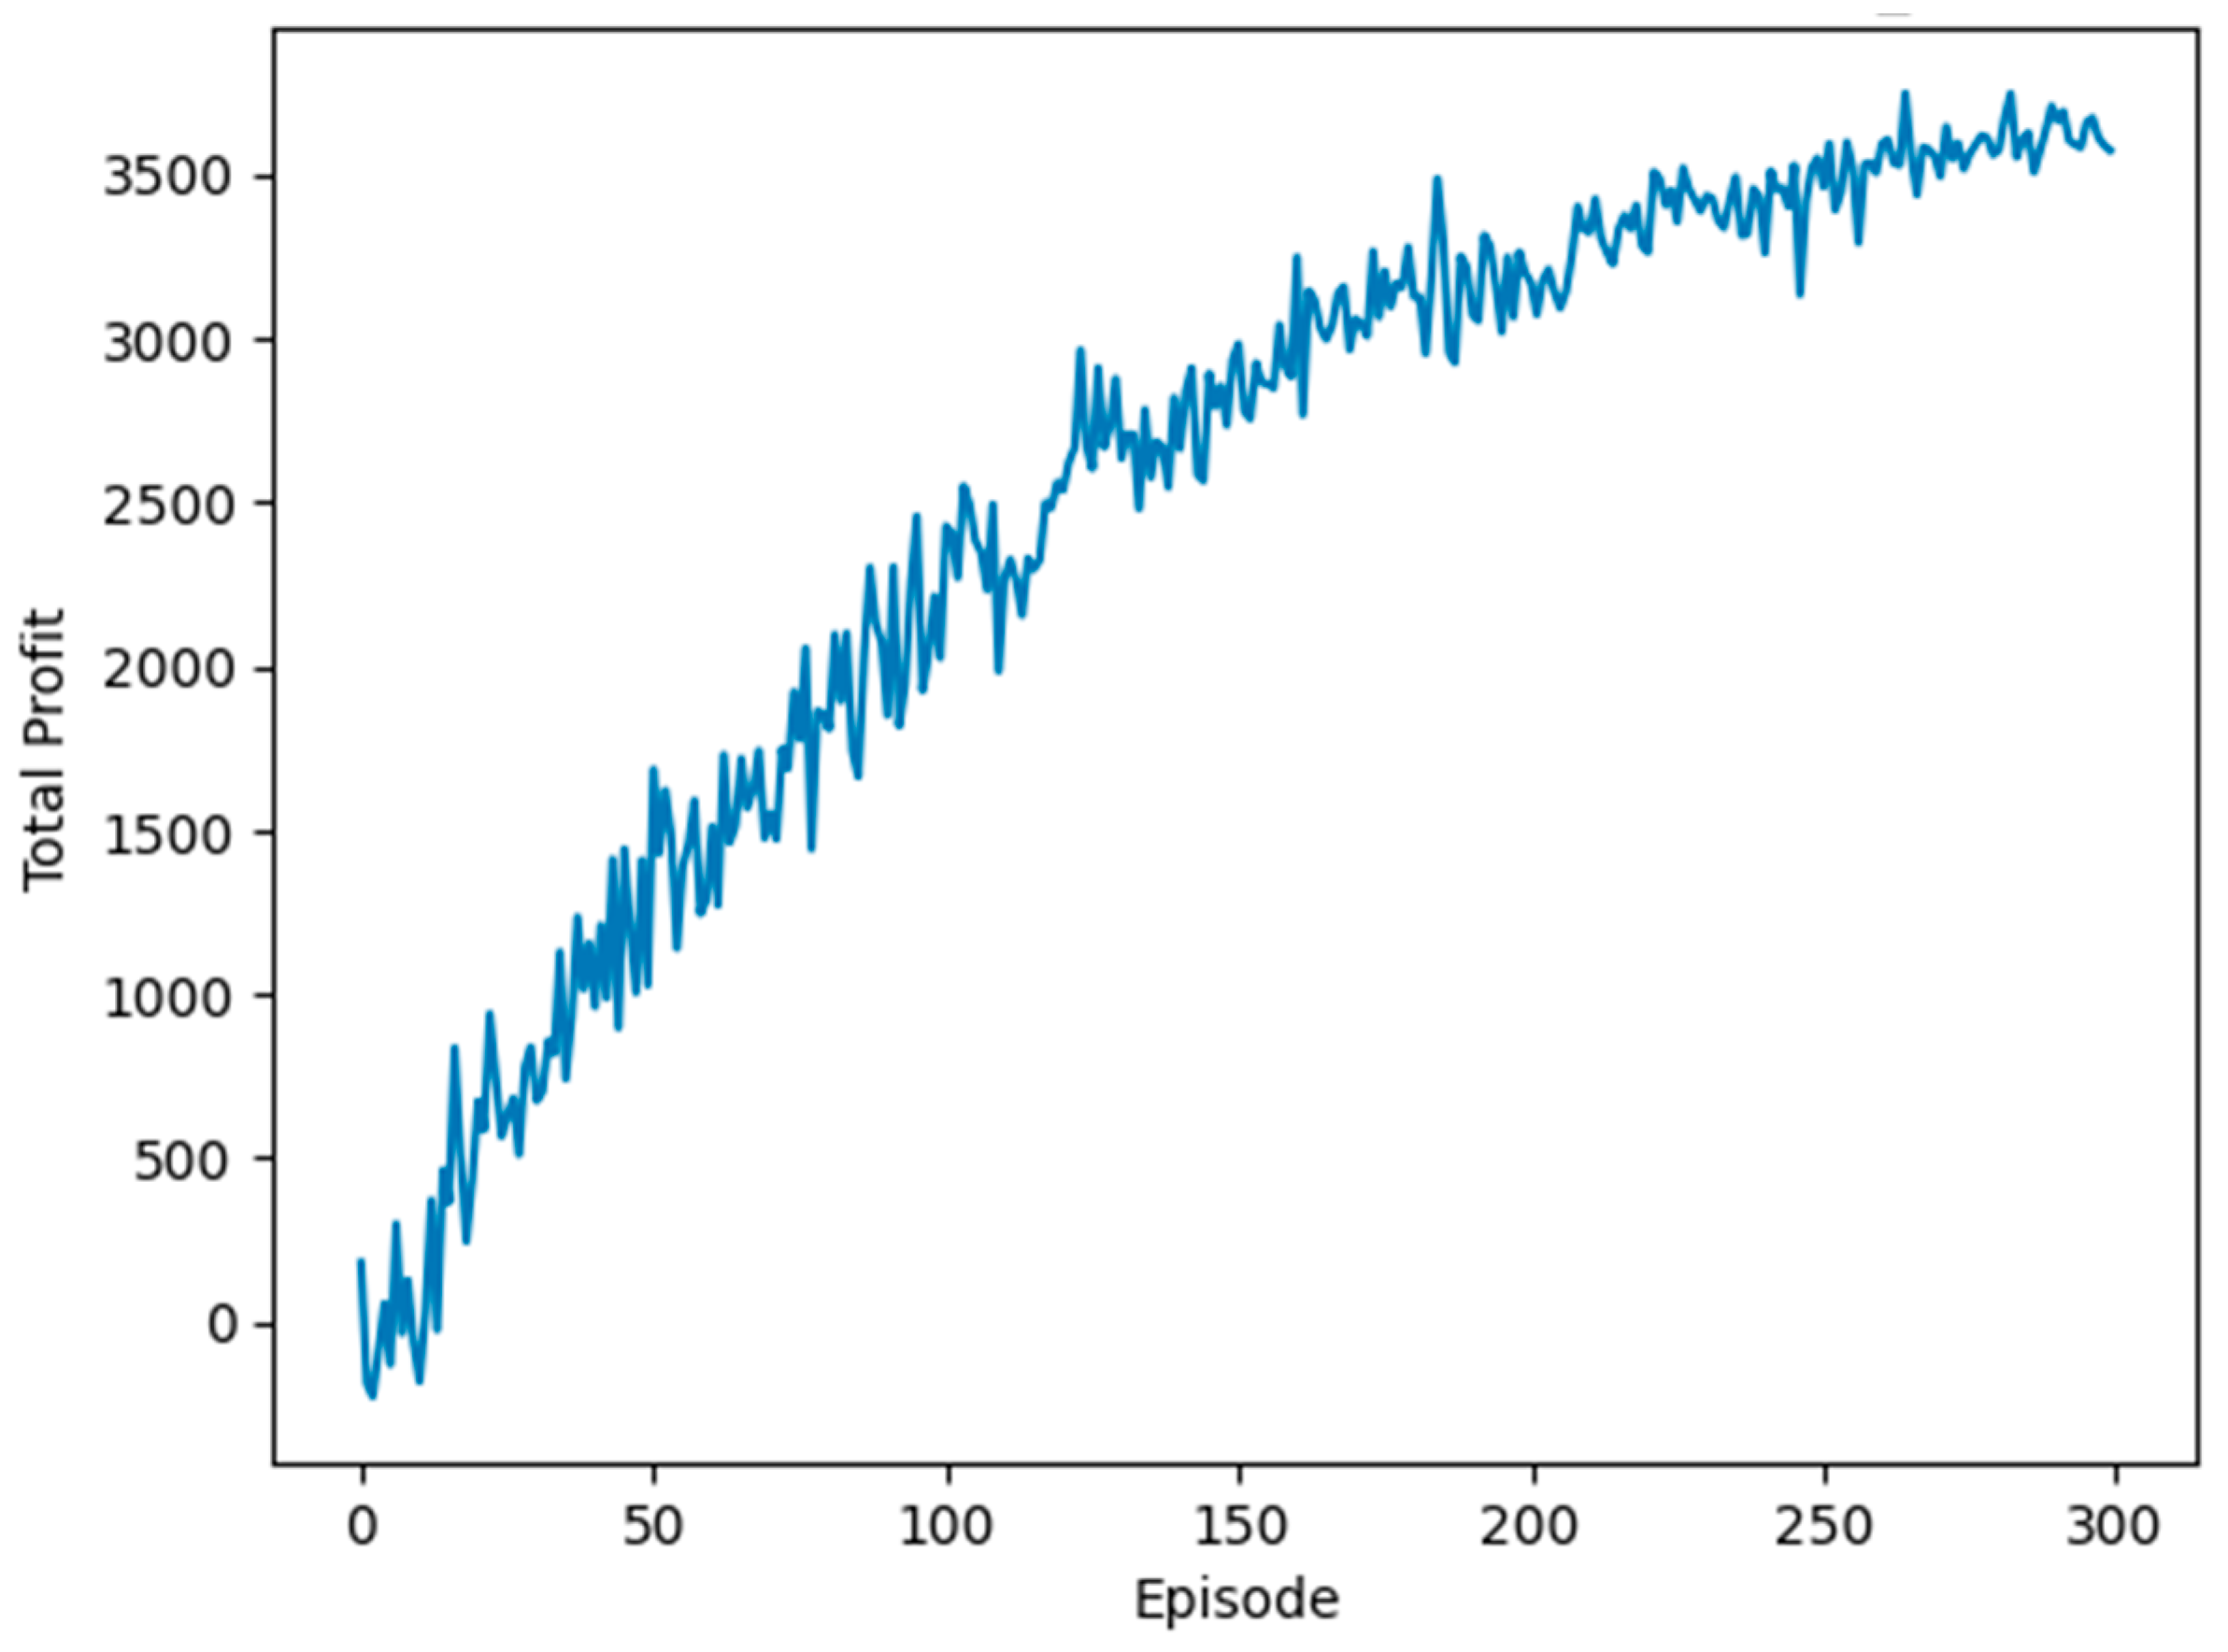
Figure 9 illustrates the cumulative profit trajectory over 300 training episodes within the DDQN model. The graph shows an ascending profit curve, demonstrating the DDQN agent’s effective learning process. This ascending trend suggests the agent’s increasing adeptness at securing profitable transactions within the given market simulation. Toward the training’s conclusion, cumulative profits exceed USD 3500, indicating an optimal performance level achieved by the agent.
The execution of 300 episodes proved satisfactory for the agent to refine and optimize its policy. Notably, the profit graph does not plateau, suggesting the potential for further improvements in agent performance with additional training episodes. However, this scenario also raises concerns about overfitting. The final episodes show profits reaching USD 4000, signifying the agent’s expedited learning and application of optimal actions within the enriched environment.
This experiment’s stable profit trajectory, without significant fluctuations or downturns, signifies a consistent and effective learning process. In the context of reinforcement learning, especially within volatile financial markets such as stock trading, such stability is crucial. This implies the agent’s ability to learn, adapt, and proficiently apply this knowledge effectively. The steady increase in total profits further indicates that the training reward function is aptly designed to align with the goal of profit maximization.
5.3. Evaluation Phase
The evaluation phase is essential, as it assesses the model’s proficiency in applying its acquired strategies to unseen datasets, a critical attribute for a resilient trading algorithm. Following the training of the DDQN agent within three distinct environments, each reflecting distinct market dynamics or asset behaviors, a real test of its utility coverage was conducted during the evaluation phase.
Spanning 47 trading days, the evaluation phase is designed to cover a timeframe not previously encountered by the agent in its training, offering a thorough examination of the agent’s adaptability across varying market conditions. This duration is selected to provide an insightful analysis of the agent’s capability through multiple market situations, from short-term volatilities to more extended market trends, confirming the effectiveness of the DDQN model in real-world trading settings. Currently, the agent’s performance serves as a reliable measure of its practical value and adaptability in dynamic trading environments, where estimating accordingly to new information is crucial.
In financial time series analysis, an innovative normalization technique known as adaptive/dynamic normalization [82,83] has emerged, particularly aimed at tackling the challenges of nonstationary data. Traditional normalization methods, such as min–max scaling and z score normalization, often do not efficiently address the variable nature of financial time series characterized by frequent shifts in scale and distribution.
The dynamic window-based normalization method [84] bypasses these issues by adjusting normalization parameters in alignment with the latest available data, ensuring that test data are normalized contextually appropriately. This approach is especially relevant for financial time series forecasting, where it is vital to incorporate recent market trends and volatilities into the normalization process.
This methodology selects a recent “window” of data points from the training set, with the window’s size reflecting the data’s volatility and frequency—typically the past few weeks or months—for daily stock prices. Normalization parameters, such as the mean and standard deviation, are derived from this window and applied to the test data. For our study, we considered the most recent 30 days of data for this purpose. A significant benefit of this approach is its sensitivity to recent market conditions, enabling a more realistic and flexible data processing framework. This is particularly beneficial in fast-changing environments such as the stock market.
Nevertheless, this technique also presents challenges, including the selection of window size and normalization metrics, which can affect model performance. Moreover, if the window size is too small, there is a risk of overfitting to short-term trends, potentially overlooking longer-term market behaviors. The following sections will present and discuss the results, highlighting these considerations.
5.3.1. Validation in a Closing Price Environment (Experiment 1)
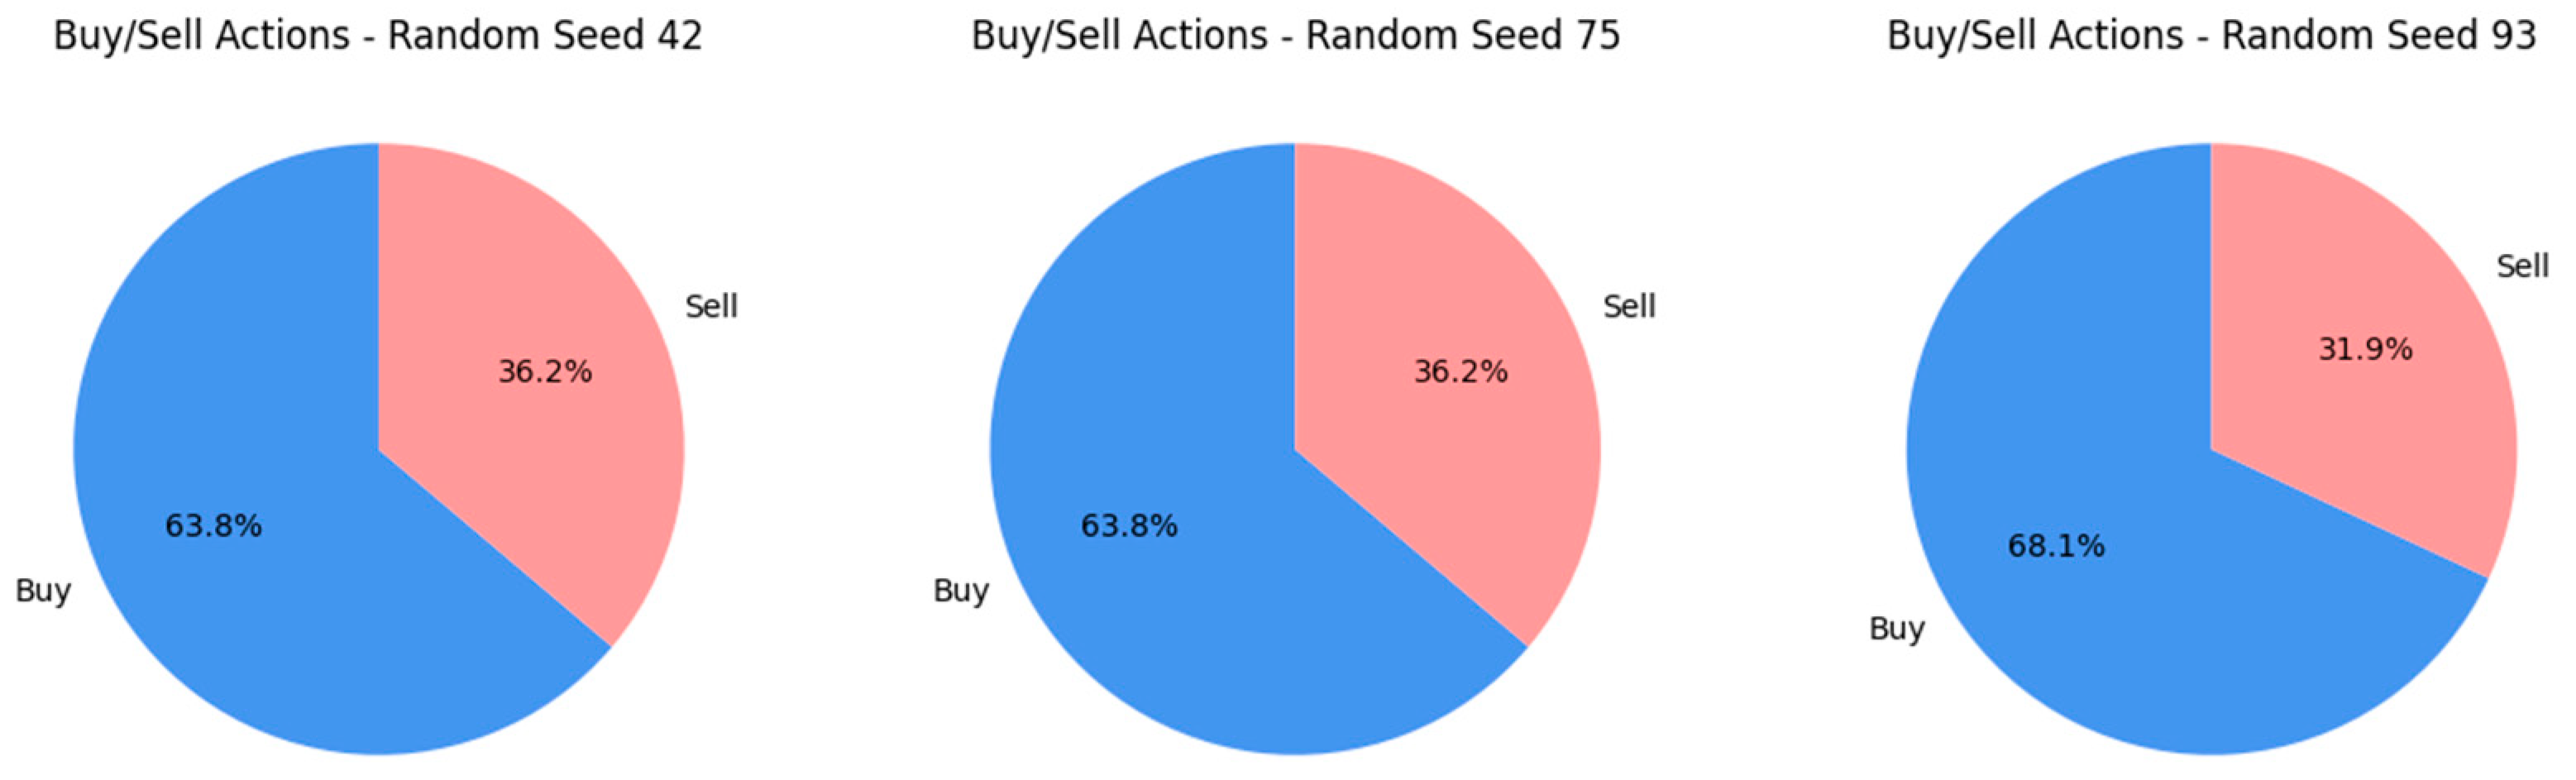
Figure 10 shows the results from Experiment 1, where the agent was tested under three distinct random seeds—42, 75, and 93—introducing variability to its training conditions to evaluate the stability of its trading strategy. For seeds 42 and 75, the agent’s trading actions (buys and sells) distribution remained notably uniform, with buys constituting 63.8% and sells constituting 36.2%. The introduction of seed 93 led to an altered distribution, with buys increasing to 68.1% and sells decreasing to 31.9%. This shift indicates that the agent’s strategy has a certain level of robustness but remains sensitive to the influence of initial conditions determined by the random seed. The buying action preference may suggest an inherent learning bias or reflect the market conditions encountered during the experiment. The prominent difference with seed 93 underlines the importance of randomness in training to strengthen the strategy’s adaptability to diverse market environments.
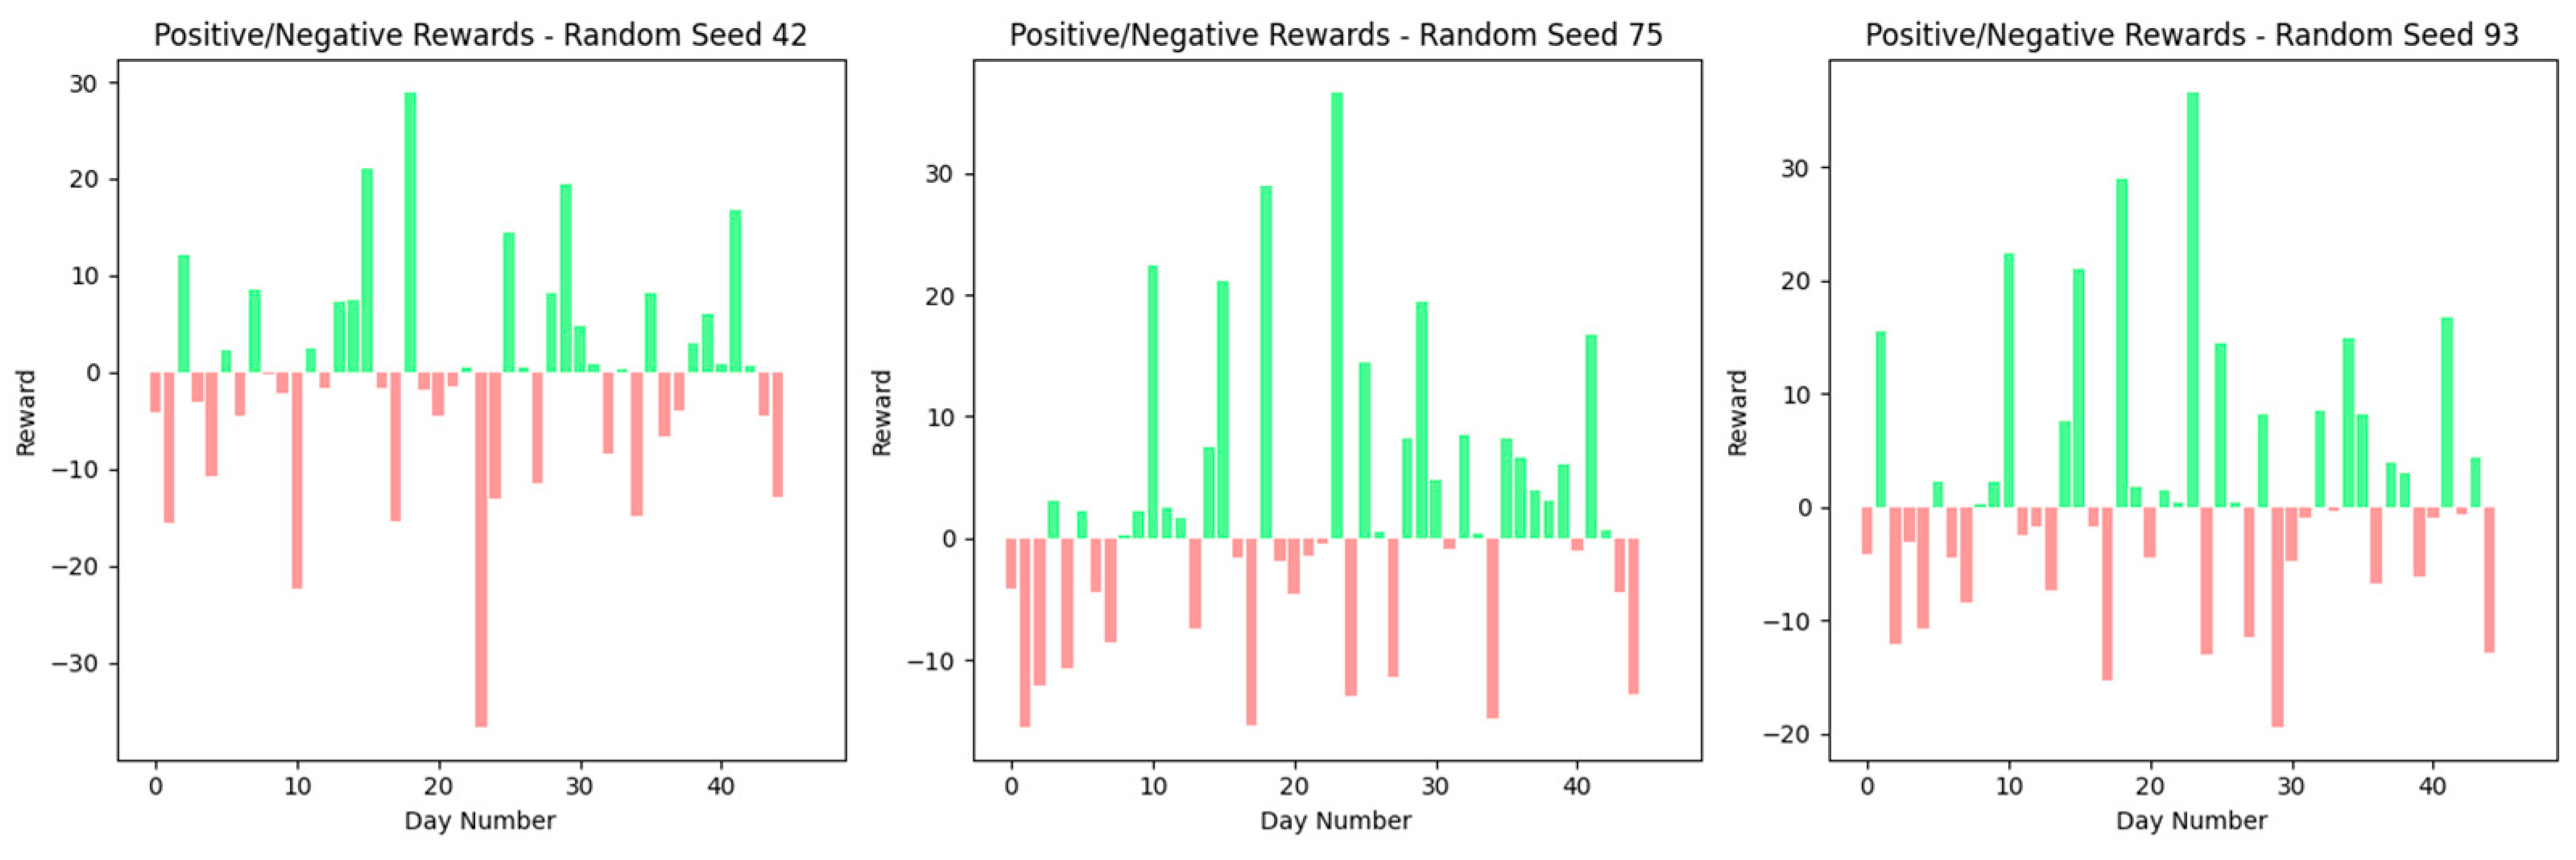
Figure 11 presents the dynamics of positive and negative rewards by the agent for each test day, aligned with the training phase’s random seeds. The outcomes illustrate minimal variation in the seed reward patterns, signifying a consistent mechanism for the agent’s actions irrespective of the seeds’ initial conditions. The rewards exhibit similar fluctuations across all seeds, denoting the stability of the agent’s learning and decision-making framework against the randomness introduced at the training’s outset.
The agent can navigate and identify advantageous actions despite the environment’s simplicity, focused exclusively on the stock’s closing price. The reward distribution represents the agent’s proficient decision-making capabilities, consistently securing positive and negative rewards across various seeds and days. This consistent performance underscores the agent’s aptitude for recognizing and leveraging profitable ventures within a limited informational framework. This signifies the efficacy of the underlying learning algorithm in distilling valuable insights from a constrained dataset, indicating the model’s utility in practical settings well.
5.3.2. Validation of the Closing Price with the Technical Indicator Environment (Experiment 2)
Figure 12 presents the division of buy and sell decisions made by the agent in Experiment 2, where technical indicators are integrated alongside closing price data within the trading framework. For Seed 42, buy actions accounted for 68.1%, and sell actions accounted for 31.9%. Seed 75 demonstrated a more equitable distribution, with 59.6% of the participants exhibiting buy actions and 40.4% exhibiting sell actions. Moreover, 93 seeds exhibited 63.8% of buy actions and 36.2% of sell actions.
The analysis depicted in Figure 13 shows the daily rewards, both positive and negative, leveraging similar random seeds. This experiment’s findings, compared to those of Experiment 1, which solely relied on closing price information for the agent’s decisions, illustrated a significant evolution in trading behavior. Including technical indicators has prompted the agent to adopt a more evenly distributed trading approach, particularly with Seed 75. The agent’s previous predilection for buying actions seen in Experiment 1 decreased, indicating a moderate bias in Experiment 2.
Moreover, the reward patterns in Experiment 2 show a reduction in extreme losses, indicating that the extended data from technical indicators enabled more informed and profitable trading decisions. This addition has expanded the agent’s capability beyond tracking short-term price movements, enabling it to discern and act on wider market indicators.
The integration of technical indicators has enriched the agent’s informational environment, facilitating more sophisticated navigational and decision-making capabilities within the trading scenario, evident in both the action distribution and the daily reward pattern, where the agent exhibits an enhanced ability to secure rewards and execute balanced trading decisions. Such improvements suggest a more in-depth understanding of the market and a strengthened trading strategy, which can be attributed to the inclusion of complex input data.
5.3.3. Validation of the Closing Price with Technical Indicators and the Sentiment Environment (Experiment 3)
In Experiment 3, the trading environment is enriched with sentiment analysis from the StockTwits platform, introducing an additional layer to the already utilized closing prices and technical indicators from Experiment 2. This inclusion aims to provide a holistic view of market dynamics by combining quantitative data with qualitative sentiment insights.
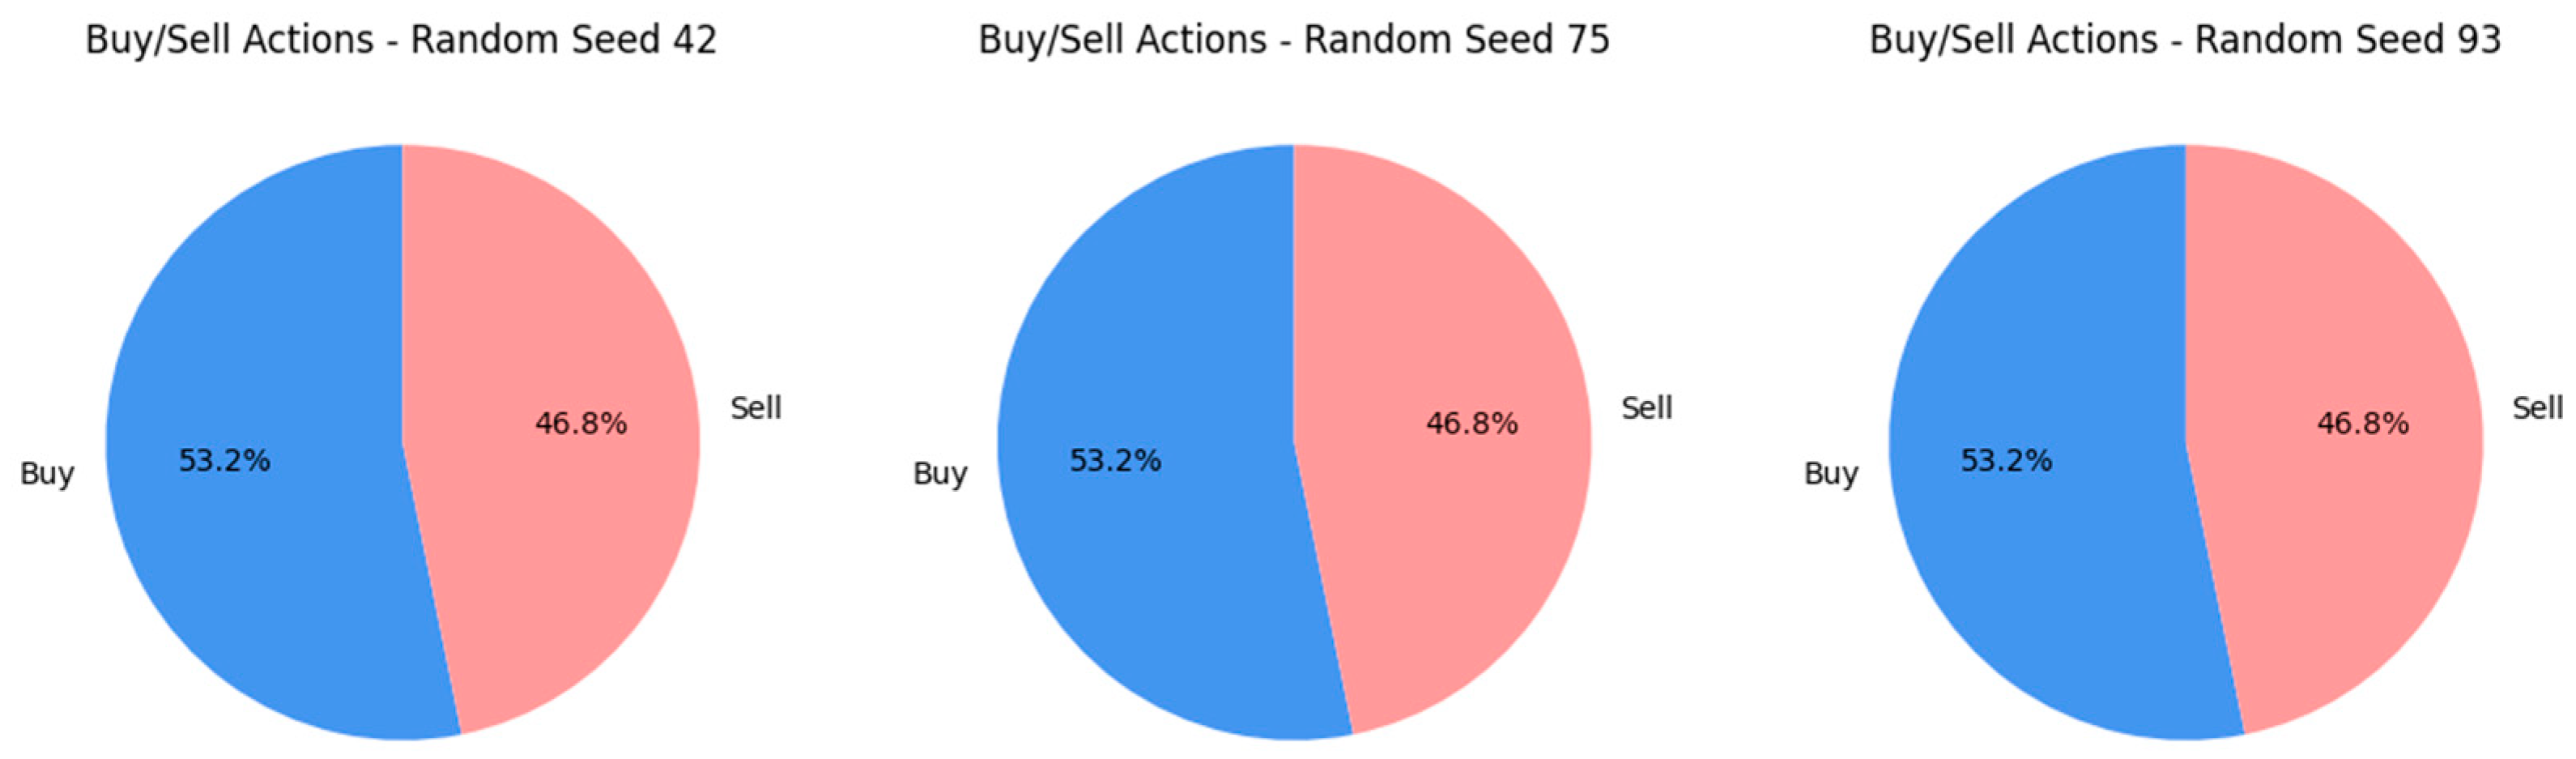
Figure 14 displays the distribution of buy and sell actions by the trading agent, showcasing a nearly even split: 53.2% of buys and 46.8% of sells. This balanced action distribution is consistently observed across all three evaluated random seeds—42, 75, and 93. This indicates that including sentiment data might have allowed the agent to adopt a more unbiased stance in its trading decisions, moving away from the pronounced buy or sell bias observed in earlier experiments.
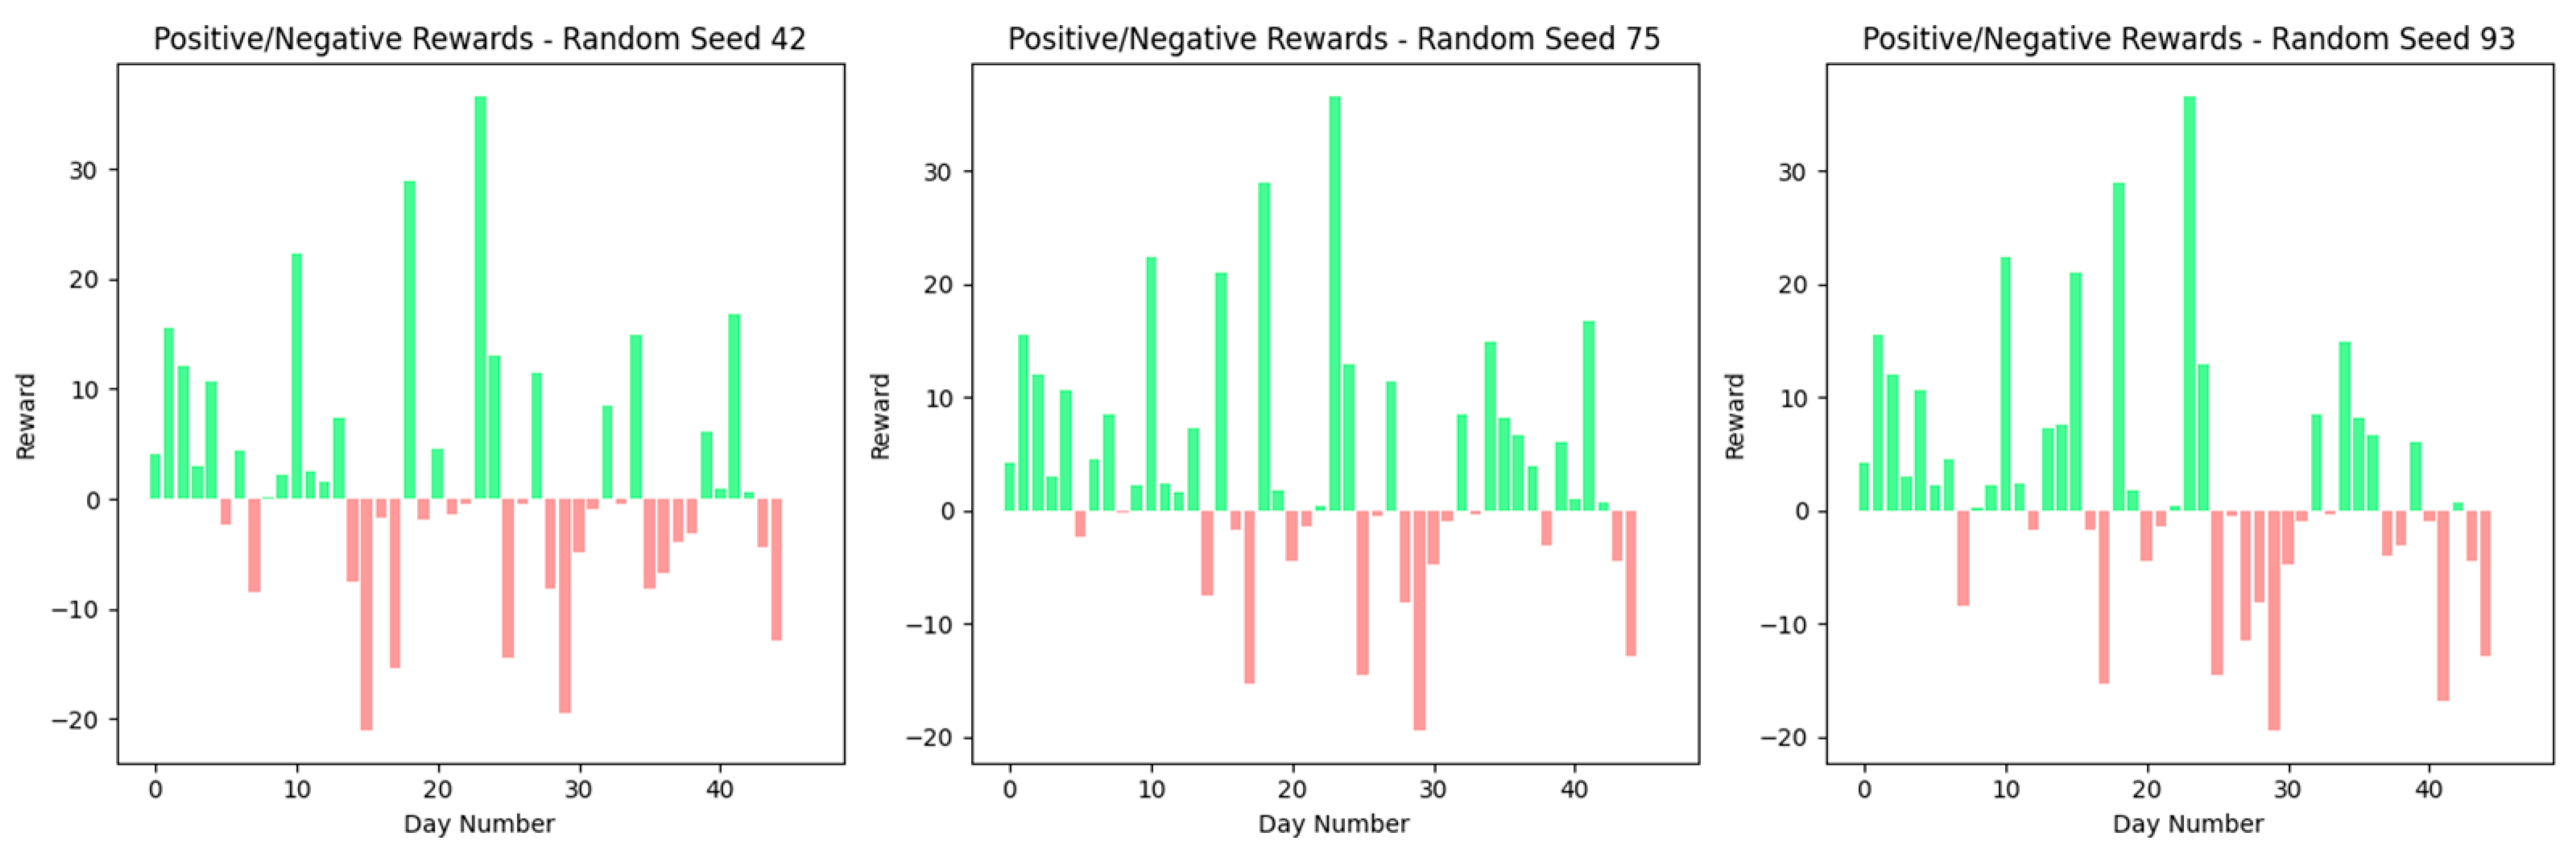
Figure 15 compares the daily rewards, both positive and negative, across the random seeds. Differing from Experiment 2, the integration of sentiment analysis has refined the agent’s reward dynamics, potentially tempering the extremities of gains or losses and offering a deeper comprehension of the market factors influencing trading choices.
By analyzing the findings from Experiment 2, it is evident that sentiment analysis contributes significantly to the agent’s trading strategy. While Experiment 2 marked a progression in the agent’s capability to balance buy and sell actions beyond the fundamental model, Experiment 3 showcases a further refined trading method, as reflected by the equitable distribution of actions. Additionally, the patterns of rewards imply that sentiment integration provides the agent with an added layer of market insight, enriching its decision-making process and leading to steadier performance under various market scenarios.
Nonetheless, Experiment 3’s increased complexity also brings about a degree of variability among the outcomes derived from the three distinct random seeds. Despite achieving higher overall profits compared to Experiment 2, the daily actions exhibited variability across seeds, suggesting the introduction of fluctuations within this enriched environment.
6. Discussion
The ascending trajectory in average profits and outcome variability from Experiments 1 through 3 indicates a progressive increase in the complexity of the training environment. This escalation likely provided the DDQN model with a more diverse array of data points and scenarios, enhancing its ability to make informed and profitable decisions in real-world trading situations. Figure 16 compares outcomes from three distinct experiments utilizing the DDQN model to forecast stock market movements. The outcomes from each experiment are illustrated through a range of results (minimum to maximum) depicted by blue boxes, with the mean outcome of each experiment marked by a red line.
Experiment 1’s average profit is 57.41, with outcomes showing limited variability. This consistency points to uniform performance across the board, although the average profit is lower than that in the latest experiments. The minimal variability highlights the simplistic nature of this initial experiment, which focused solely on the day’s closing price.
Experiment 2 records an enhanced average profit of 80.82 along with a wider spread of outcomes, presenting exposure to a more complex trading environment (comprising closing prices + technical indicators). Despite the enlarged outcome range, consistency remains across the three random seeds used.
Experiment 3 shows a notable increase, with an average profit of 119.98, which significantly increased from the initial experiments. This experiment also exhibited the most considerable spread in outcomes, indicating a highly dynamic environment enriched with closing prices, technical indicators, and sentiment analysis. This wide range suggests that while the model achieved higher performance peaks, it also faced substantial troughs, reflecting the environment’s increased complexity and the exogenous factors affecting stock market predictions.
The trend of growing average profits based on the trajectory of experiments suggests that the DDQN model is continually refining its predictive process and decision-making strategies. The expansion in both average outcomes and their ranges indicates an improved capability of the model to navigate the stock market, leveraging a richer dataset for its trading decisions. Nevertheless, the extensive variability observed in Experiment 3 also highlights a greater degree of performance unpredictability. This suggests that while the DDQN model has the capacity for high returns, it is also exposed to significant losses, reflecting the dual edge of engaging with a more complex and variable trading environment.
It is worth mentioning that while the model developed for NVIDIA stock demonstrated effectiveness in a volatile market, its application to other datasets requires careful consideration. The DDQN presented performance is tailored to the specific dynamics of NVIDIA stock and could potentially limit its transferability to stocks with different characteristics. For experiments with broader applicability, the model could be retrained or fine-tuned with new data to accommodate dissimilar market conditions or sector-specific factors. Additionally, robustness checks by back-testing on diverse datasets could benefit from assessing their generalizability. Lastly, adjustments and validations are essential to confirm the model’s effectiveness across varying market scenarios for reproducibility in other stock dynamics.
7. Conclusions
This research focuses on developing and optimizing a DDQN model to examine the impact of progressively adding layers of information on its stock market prediction capabilities, specifically focusing on volatile and significant NVIDIA stocks. Initiated with a basic setup that only considered the stock’s closing prices, this research established a performance baseline for the DDQN model without complex market variables, allowing for a step-by-step evaluation of additional information layers (technical indicators and sentiment analysis). Then, we expanded the model’s environment by incorporating technical indicators to enhance market insight and assess their influence on forecasting accuracy. A vital factor of the investigation was integrating sentiment analysis to quantify the influence of public opinion on stock performance, utilizing social media commentary from the StockTwits platform to estimate investor sentiment toward NVIDIA stocks.
The DDQN model’s performance was comprehensively evaluated across each stage, aiming to compare the environment’s complexity with its trading efficacy. The initial experiment, which relied only on closing prices, involved setting the groundwork. Furthermore, in the second experiment with technical indicators, a significant improvement in the model’s decision making was observed, denoted by a more balanced distribution of buy and sell actions and an increase in cumulative profits. This progression was finalized in the third experiment, where sentiment analysis introduced a more profound layer of market understanding, subsequently enhancing profitability. However, this increase in profitability was accompanied by heightened complexity in the model environment. Every additional layer of information not only broadened the model’s analytical and predictive scope, but also introduced more variability in outcomes. This complexity, resulting in a wider range of potential outcomes, suggests that while added information can boost profits, it necessitates a thorough consideration of the environment’s intricacies and the resilience of the underlying trading strategies.
The exploration of the DDQN model in forecasting NVIDIA’s stock movements over a volatile period has yielded significant insights into the benefits of layered data integration in algorithmic trading strategies. From a simple model based on closing prices to gradually incorporating technical indicators and sentiment analysis, the study’s approach has demonstrated a clear trajectory of strategic evolution and improved profitability. The initial model’s tendency towards buy actions underscored the need for a more comprehensive approach to decision making within the trading algorithm. The integration of technical indicators marked the first step toward achieving this, leading to a more balanced distribution of trading actions and an initial increase in profitability. The subsequent incorporation of sentiment analysis, capturing market participants’ collective mood and outlook, further refined the model’s trading strategies.
Comparative analysis across the three stages revealed increased profitability, demonstrating the significant impact of combining sentiment analysis with traditional financial metrics. From an average profit of 57.41 in the simplest model setup to 119.98 with full data integration, the findings underscore the potential for sophisticated data synthesis to enhance predictive accuracy and trading performance. This incremental improvement, however, came with increased variability in outcomes, suggesting a more complex environment for the model to navigate. The research concludes that while adding data sources can substantially boost the model’s profitability, it also necessitates a deeper understanding of the underlying complexities and a careful consideration of the robustness of the trading strategies. The insights gained from this study establish the value of integrating sentiment analysis alongside traditional financial metrics, increasing the sophistication and effectiveness of algorithmic trading strategies in the face of fluctuating market conditions.
Finally, by addressing off-market days such as weekends and holidays, which were excluded from the dataset for continuity, this approach might overlook critical events that could significantly affect stock sentiment and prices. Future research could explore methods such as linear interpolation [85] to effectively bridge this data gap, potentially allowing for a more refined stock performance analysis. Moreover, the sentiment analysis methodology, based on average daily social media sentiment, could be used in future studies to include weighted sentiment scores that reflect the influence of individual posts, enhancing the depth of market sentiment analysis.
Investigating hyperparameter optimization and architectural enhancements presents opportunities for further refinement of stock market predictions with the DDQN model. With no standardized approach for tuning reinforcement learning models to financial tasks, future research could explore adjustments in neural network architecture and other model components to discover more subtle market patterns. In conclusion, exploring advanced time series forecasting techniques beyond sliding window normalization [86], such as “differencing”, could be an alternative approach for handling financial data, potentially leading to more accurate and robust forecasting models in future studies.
Author Contributions
Conceptualization: G.P. and D.G.; methodology: G.P. and D.G.; software: G.P. and D.G.; validation: C.T., G.P. and D.G.; formal analysis: G.P. and D.G.; investigation: G.P. and D.G.; resources: C.T., G.P. and D.G.; data curation: G.P. and D.G.; writing—original draft preparation: G.P. and D.G.; writing—review and editing: C.T., G.P. and D.G.; visualization: G.P. and D.G.; supervision: C.T.; project administration: C.T. and G.P. All authors have read and agreed to the published version of the manuscript.
Funding
This research received no external funding.
Data Availability Statement
The data presented in this study are openly available in GitHub at https://github.com/gpapageorgiouedu/Enhancing-Stock-Market-Forecasts-with-Double-Deep-Q-Network-in-Volatile-Stock-Market-Environments.
Conflicts of Interest
The authors declare no potential conflicts of interest with respect to the research, authorship, and/or publication of this article. This manuscript is according to the guidelines and complies with the Ethical Standards.
References
- Taylor, M.P.; Allen, H. The Use of Technical Analysis in the Foreign Exchange Market. J. Int. Money Financ. 1992, 11, 304–314. [Google Scholar] [CrossRef]
- Strader, T.J.; Rozycki, J.J.; Root, T.H.; Huang, Y.-H.J. Machine Learning Stock Market Prediction Studies: Review and Research Directions. J. Int. Technol. Inf. Manag. 2020, 28, 63–83. [Google Scholar] [CrossRef]
- Khan, W.; Ghazanfar, M.A.; Azam, M.A.; Karami, A.; Alyoubi, K.H.; Alfakeeh, A.S. Stock Market Prediction Using Machine Learning Classifiers and Social Media, News. J. Ambient. Intell. Humaniz. Comput. 2022, 13, 3433–3456. [Google Scholar] [CrossRef]
- Koukaras, P.; Nousi, C.; Tjortjis, C. Stock Market Prediction Using Microblogging Sentiment Analysis and Machine Learning. Telecom 2022, 3, 358–378. [Google Scholar] [CrossRef]
- Batra, R.; Daudpota, S.M. Integrating StockTwits with Sentiment Analysis for Better Prediction of Stock Price Movement. In Proceedings of the 2018 International Conference on Computing, Mathematics and Engineering Technologies (iCoMET), Sukkur, Pakistan, 3–4 March 2018; pp. 1–5. [Google Scholar]
- Qiu, Y.; Song, Z.; Chen, Z. Short-Term Stock Trends Prediction Based on Sentiment Analysis and Machine Learning. Soft Comput. 2022, 26, 2209–2224. [Google Scholar] [CrossRef]
- Nousi, C.; Tjortjis, C. A Methodology for Stock Movement Prediction Using Sentiment Analysis on Twitter and StockTwits Data. In Proceedings of the 2021 6th South-East Europe Design Automation, Computer Engineering, Computer Networks and Social Media Conference (SEEDA-CECNSM), Preveza, Greece, 24–26 September 2021; pp. 1–7. [Google Scholar]
- Islam, S.; Ab Ghani, N.; Ahmed, M. A Review on Recent Advances in Deep Learning for Sentiment Analysis: Performances, Challenges and Limitations. Compusoft 2020, 9, 3775–3783. [Google Scholar]
- Kumbure, M.M.; Lohrmann, C.; Luukka, P.; Porras, J. Machine Learning Techniques and Data for Stock Market Forecasting: A Literature Review. Expert Syst. Appl. 2022, 197, 116659. [Google Scholar] [CrossRef]
- Chalkias, I.; Tzafilkou, K.; Karapiperis, D.; Tjortjis, C. Learning Analytics on YouTube Educational Videos: Exploring Sentiment Analysis Methods and Topic Clustering. Electronics 2023, 12, 3949. [Google Scholar] [CrossRef]
- Hasselt, H. Double Q-Learning. In Proceedings of the Advances in Neural Information Processing Systems; Lafferty, J., Williams, C., Shawe-Taylor, J., Zemel, R., Culotta, A., Eds.; Curran Associates, Inc.: Glasgow, UK, 2010; Volume 23. [Google Scholar]
- Yen, G.; Lee, C. Efficient Market Hypothesis (EMH): Past, Present and Future. Rev. Pac. Basin Financ. Mark. Policies 2008, 11, 305–329. [Google Scholar] [CrossRef]
- Van Horne, J.C.; Parker, G.G.C. The Random-Walk Theory: An Empirical Test. Financ. Anal. J. 1967, 23, 87–92. [Google Scholar] [CrossRef]
- Bakar, S.; Yi, A.N.C. The Impact of Psychological Factors on Investors’ Decision Making in Malaysian Stock Market: A Case of Klang Valley and Pahang. Procedia Econ. Financ. 2016, 35, 319–328. [Google Scholar] [CrossRef]
- Huang, W.; Nakamori, Y.; Wang, S.-Y. Forecasting Stock Market Movement Direction with Support Vector Machine. Comput. Oper. Res. 2005, 32, 2513–2522. [Google Scholar] [CrossRef]
- Yadav, A.; Jha, C.K.; Sharan, A. Optimizing LSTM for Time Series Prediction in Indian Stock Market. Procedia Comput. Sci. 2020, 167, 2091–2100. [Google Scholar] [CrossRef]
- Chen, K.; Zhou, Y.; Dai, F. A LSTM-Based Method for Stock Returns Prediction: A Case Study of China Stock Market. In Proceedings of the 2015 IEEE International Conference on Big Data (Big Data), Santa Clara, CA, USA, 29 October–1 November 2015; pp. 2823–2824. [Google Scholar]
- Awad, A.L.; Elkaffas, S.M.; Fakhr, M.W. Stock Market Prediction Using Deep Reinforcement Learning. Appl. Syst. Innov. 2023, 6, 106. [Google Scholar] [CrossRef]
- Kabbani, T.; Duman, E. Deep Reinforcement Learning Approach for Trading Automation in the Stock Market. IEEE Access 2022, 10, 93564–93574. [Google Scholar] [CrossRef]
- Lima, M.L.; Nascimento, T.P.; Labidi, S.; Timbó, N.S.; Batista, M.V.L.; Neto, G.N.; Costa, E.A.M.; Sousa, S.R.S. Using Sentiment Analysis for Stock Exchange Prediction. Int. J. Artif. Intell. Appl. 2016, 7, 59–67. [Google Scholar]
- Fama, E.F. Efficient Capital Markets A Review of Theory and Empirical Work. In Selected Papers of Eugene F. Fama; Cochrane, J.H., Moskowitz, T.J., Eds.; University of Chicago Press: Chicago, IL, USA, 2017; pp. 76–121. ISBN 9780226426983. [Google Scholar]
- Roberts, H. Statistical versus Clinical Prediction of the Stock Market. 1967; 252, unpublished manuscript. [Google Scholar]
- Wafi, A.S.; Hassan, H.; Mabrouk, A. Fundamental Analysis Models in Financial Markets—Review Study. Procedia Econ. Financ. 2015, 30, 939–947. [Google Scholar] [CrossRef]
- Malkiel, B.G. The Efficient Market Hypothesis and Its Critics. J. Econ. Perspect. 2003, 17, 59–82. [Google Scholar] [CrossRef]
- Bachelier, L. Théorie de La Spéculation. In Annales Scientifiques de l’École Normale Supérieure; Gauthier-Villars: Paris, France, 1900; Volume 17, pp. 21–86. [Google Scholar]
- Fama, E.F. The Behavior of Stock-Market Prices. J. Bus. 1965, 38, 34–105. [Google Scholar] [CrossRef]
- Lo, A.W.; MacKinlay, A.C. A Non-Random Walk Down Wall Street; Princeton University Press: Princeton, NJ, USA, 2011; ISBN 9781400829095. [Google Scholar]
- Fontanills, G.A.; Gentile, T. The Stock Market Course; John Wiley & Sons: Hoboken, NJ, USA, 2002; Volume 117. [Google Scholar]
- Thomsett, M.C. Getting Started in Fundamental Analysis; John Wiley & Sons: Hoboken, NJ, USA, 2006. [Google Scholar]
- Bauman, M.P. A Review of Fundamental Analysis Research in Accounting. J. Account. Lit. 1996, 15, 1. [Google Scholar]
- Lev, B.; Ohlson, J.A. Market-Based Empirical Research in Accounting: A Review, Interpretation, and Extension. J. Account. Res. 1982, 20, 249. [Google Scholar] [CrossRef]
- Lev, B. On the Usefulness of Earnings and Earnings Research: Lessons and Directions from Two Decades of Empirical Research. J. Account. Res. 1989, 27, 153. [Google Scholar] [CrossRef]
- Bernard, V.L. Accounting-Based Valuation Methods, Determinants of Market-to-Book Ratios, and Implications for Financial Statement Analysis; Working Paper; University of Michigan: Ann Arbor, MI, USA, 1994. [Google Scholar]
- Sureshkumar, K.K.; Elango, N.M. An Efficient Approach to Forecast Indian Stock Market Price and Their Performance Analysis. Int. J. Comput. Appl. 2011, 34, 44–49. [Google Scholar]
- Anbalagan, T.; Maheswari, S.U. Classification and Prediction of Stock Market Index Based on Fuzzy Metagraph. Procedia Comput. Sci. 2015, 47, 214–221. [Google Scholar] [CrossRef]
- Dash, R.; Dash, P.K.; Bisoi, R. A Self Adaptive Differential Harmony Search Based Optimized Extreme Learning Machine for Financial Time Series Prediction. Swarm Evol. Comput. 2014, 19, 25–42. [Google Scholar] [CrossRef]
- Bisoi, R.; Dash, P.K. A Hybrid Evolutionary Dynamic Neural Network for Stock Market Trend Analysis and Prediction Using Unscented Kalman Filter. Appl. Soft. Comput. 2014, 19, 41–56. [Google Scholar] [CrossRef]
- Murphy, J.J. Technical Analysis of the Financial Markets: A Comprehensive Guide to Trading Methods and Applications; Penguin: London, UK, 1999. [Google Scholar]
- Box, G.E.P.; Jenkins, G.M.; Reinsel, G.C.; Ljung, G.M. Time Series Analysis: Forecasting and Control; John Wiley & Sons: Hoboken, NJ, USA, 2015. [Google Scholar]
- Jegadeesh, N.; Titman, S. Returns to Buying Winners and Selling Losers: Implications for Stock Market Efficiency. J. Financ. 1993, 48, 65–91. [Google Scholar] [CrossRef]
- Moskowitz, T.J.; Grinblatt, M. Do Industries Explain Momentum? J. Financ. 1999, 54, 1249–1290. [Google Scholar] [CrossRef]
- Chan, L.K.C.; Jegadeesh, N.; Lakonishok, J. Momentum Strategies. J. Financ. 1996, 51, 1681–1713. [Google Scholar] [CrossRef]
- Andreassen, P.B.; Kraus, S.J. Judgmental Extrapolation and the Salience of Change. J. Forecast. 1990, 9, 347–372. [Google Scholar] [CrossRef]
- Kim, K. Financial Time Series Forecasting Using Support Vector Machines. Neurocomputing 2003, 55, 307–319. [Google Scholar] [CrossRef]
- Das, S.P.; Padhy, S. Support Vector Machines for Prediction of Futures Prices in Indian Stock Market. Int. J. Comput. Appl. 2012, 41, 22–26. [Google Scholar]
- Nelson, D.M.Q.; Pereira, A.C.M.; de Oliveira, R.A. Stock Market’s Price Movement Prediction with LSTM Neural Networks. In Proceedings of the 2017 International Joint Conference on Neural Networks (IJCNN), Anchorage, AK, USA, 14–19 May 2017; pp. 1419–1426. [Google Scholar]
- Kalva, S.; Satuluri, N. Stock Market Investment Strategy Using Deep-Q-Learning Network. In International Conference on Multi-disciplinary Trends in Artificial Intelligence; Springer Nature: Cham, Switzerland, 2023; pp. 484–495. [Google Scholar]
- Chakole, J.; Kurhekar, M. Trend Following Deep Q-Learning Strategy for Stock Trading. Expert Syst. 2020, 37, e12514. [Google Scholar] [CrossRef]
- Chinnamuniyandi, M.; Chandran, S.; Xu, C. Fractional Order Uncertain BAM Neural Networks with Mixed Time Delays: An Existence and Quasi-Uniform Stability Analysis. J. Intell. Fuzzy Syst. 2024, 46, 4291–4313. [Google Scholar] [CrossRef]
- Yi, G.; Zhuang, X.; Li, Y. Probabilistic State Estimation in District Heating Grids Using Deep Neural Network. Sustain. Energy Grids Netw. 2024, 38, 101353. [Google Scholar] [CrossRef]
- Xiao, Q.; Ihnaini, B. Stock Trend Prediction Using Sentiment Analysis. PeerJ Comput. Sci. 2023, 9, e1293. [Google Scholar] [CrossRef]
- Praturi, S.S.G.; Ramakrishnan, A.; Deepthi, L.R. Stock Price Prediction Using Sentiment Analysis on Financial News. In International Conference on Data Science and Applications; Springer Nature: Singapore, 2024; pp. 551–567. [Google Scholar]
- Pandey, M.; Nayak, S.; Rautaray, S.S. An Analysis on Sentiment Analysis and Stock Market Price Prediction. In Proceedings of the 2023 2nd International Conference on Automation, Computing and Renewable Systems (ICACRS), Pudukkottai, India, 11–13 December 2023; pp. 367–370. [Google Scholar]
- Abdelfattah, B.A.; Darwish, S.M.; Elkaffas, S.M. Enhancing the Prediction of Stock Market Movement Using Neutrosophic-Logic-Based Sentiment Analysis. J. Theor. Appl. Electron. Commer. Res. 2024, 19, 116–134. [Google Scholar] [CrossRef]
- Das, N.; Sadhukhan, B.; Chatterjee, R.; Chakrabarti, S. Integrating Sentiment Analysis with Graph Neural Networks for Enhanced Stock Prediction: A Comprehensive Survey. Decis. Anal. J. 2024, 10, 100417. [Google Scholar] [CrossRef]
- Messner, W. Cultural and Individual Differences in Online Reviews. J. Int. Consum. Mark 2020, 32, 356–382. [Google Scholar] [CrossRef]
- Kapoteli, E.; Koukaras, P.; Tjortjis, C. Social Media Sentiment Analysis Related to COVID-19 Vaccines: Case Studies in English and Greek Language. In IFIP International Conference on Artificial Intelligence Applications and Innovations; Springer: Cham, Switzerland, 2022; pp. 360–372. [Google Scholar]
- Akritidis, L.; Bozanis, P. Low-Dimensional Text Representations for Sentiment Analysis NLP Tasks. SN Comput. Sci. 2023, 4, 474. [Google Scholar] [CrossRef]
- Akritidis, L.; Bozanis, P. How Dimensionality Reduction Affects Sentiment Analysis NLP Tasks: An Experimental Study. In IFIP International Conference on Artificial Intelligence Applications and Innovations; Springer: Cham, Switzerland, 2022; pp. 301–312. [Google Scholar]
- Friesen, G.C.; Weller, P.A.; Dunham, L.M. Price Trends and Patterns in Technical Analysis: A Theoretical and Empirical Examination. J. Bank Financ. 2009, 33, 1089–1100. [Google Scholar] [CrossRef]
- Pagolu, V.S.; Reddy, K.N.; Panda, G.; Majhi, B. Sentiment Analysis of Twitter Data for Predicting Stock Market Movements. In Proceedings of the 2016 International Conference on Signal Processing, Communication, Power and Embedded System (SCOPES), Paralakhemundi, India, 3–5 October 2016; pp. 1345–1350. [Google Scholar]
- Valle-Cruz, D.; Fernandez-Cortez, V.; López-Chau, A.; Sandoval-Almazán, R. Does Twitter Affect Stock Market Decisions? Financial Sentiment Analysis During Pandemics: A Comparative Study of the H1N1 and the COVID-19 Periods. Cognit. Comput. 2022, 14, 372–387. [Google Scholar] [CrossRef]
- Ellis, C.A.; Parbery, S.A. Is Smarter Better? A Comparison of Adaptive, and Simple Moving Average Trading Strategies. Res. Int. Bus. Financ. 2005, 19, 399–411. [Google Scholar] [CrossRef]
- Levy, R.A. Relative Strength as a Criterion for Investment Selection. J. Financ. 1967, 22, 595. [Google Scholar] [CrossRef]
- Vaiz, J.S.; Ramaswami, M. A Study on Technical Indicators in Stock Price Movement Prediction Using Decision Tree Algorithms. Am. J. Eng. Res. (AJER) 2016, 5, 207–212. [Google Scholar]
- Antonio Agudelo Aguirre, A.; Alfredo Rojas Medina, R.; Darío Duque Méndez, N. Machine Learning Applied in the Stock Market through the Moving Average Convergence Divergence (MACD) Indicator. Invest. Manag. Financ. Innov. 2020, 17, 44–60. [Google Scholar] [CrossRef]
- Mitchell, D.; Białkowski, J.; Tompaidis, S. Volume-Weighted Average Price Tracking: A Theoretical and Empirical Study. IISE Trans. 2020, 52, 864–889. [Google Scholar] [CrossRef]
- Albahli, S.; Nazir, T.; Mehmood, A.; Irtaza, A.; Alkhalifah, A.; Albattah, W. AEI-DNET: A Novel DenseNet Model with an Autoencoder for the Stock Market Predictions Using Stock Technical Indicators. Electronics 2022, 11, 611. [Google Scholar] [CrossRef]
- Liu, Y.; Ott, M.; Goyal, N.; Du, J.; Joshi, M.; Chen, D.; Levy, O.; Lewis, M.; Zettlemoyer, L.; Stoyanov, V. RoBERTa: A Robustly Optimized BERT Pretraining Approach. arXiv 2019, arXiv:1907.11692. [Google Scholar]
- Hutto, C.; Gilbert, E. VADER: A Parsimonious Rule-Based Model for Sentiment Analysis of Social Media Text. In Proceedings of the International AAAI Conference on Web and Social Media, Ann Arbor, MI, USA, 1–4 June 2014; 2014; Volume 8, pp. 216–225. [Google Scholar] [CrossRef]
- Loria, S. Textblob Documentation. Release 0.15 2018, 2, 269. [Google Scholar]
- Barbieri, F.; Camacho-Collados, J.; Espinosa Anke, L.; Neves, L. TweetEval: Unified Benchmark and Comparative Evaluation for Tweet Classification. arXiv 2020, arXiv:2010.12421. [Google Scholar]
- Wu, N.; Ke, Z.; Feng, L. Stock Price Forecast Based on LSTM and DDQN. In Proceedings of the 2022 14th International Conference on Advanced Computational Intelligence (ICACI), Wuhan, China, 15–17 July 2022; pp. 182–185. [Google Scholar]
- Zhang, H.; Qu, C.; Zhang, J.; Li, J. Self-Adaptive Priority Correction for Prioritized Experience Replay. Appl. Sci. 2020, 10, 6925. [Google Scholar] [CrossRef]
- Pedregosa, F.; Varoquaux, G.; Gramfort, A.; Michel, V.; Thirion, B.; Grisel, O.; Blondel, M.; Prettenhofer, P.; Weiss, R.; Dubourg, V.; et al. Scikit-Learn: Machine Learning in Python. J. Mach. Learn. Res. 2011, 12, 2825–2830. [Google Scholar]
- Zejnullahu, F.; Moser, M.; Osterrieder, J. Applications of Reinforcement Learning in Finance—Trading with a Double Deep Q-Network. arXiv 2022, arXiv:2206.14267. [Google Scholar]
- Sowerby, H.; Zhou, Z.; Littman, M.L. Designing Rewards for Fast Learning. arXiv 2022, arXiv:2205.15400. [Google Scholar]
- Mnih, V.; Kavukcuoglu, K.; Silver, D.; Graves, A.; Antonoglou, I.; Wierstra, D.; Riedmiller, M. Playing Atari with Deep Reinforcement Learning. arXiv 2013, arXiv:1312.5602. [Google Scholar]
- Lin, L.-J. Self-Improving Reactive Agents Based on Reinforcement Learning, Planning and Teaching. Mach. Learn. 1992, 8, 293–321. [Google Scholar] [CrossRef]
- Gu, W.; Wang, S. An Improved Strategy for Blood Glucose Control Using Multi-Step Deep Reinforcement Learning. arXiv 2024, arXiv:2403.07566. [Google Scholar]
- Kaleel, P.B.; Sheen, S. Focused Crawler Based on Reinforcement Learning and Decaying Epsilon-Greedy Exploration Policy. Int. Arab. J. Inf. Technol. 2023, 20, 819–830. [Google Scholar] [CrossRef]
- Liu, C.; Gao, Y.; Lv, J. Dynamic Normalization. arXiv 2021, arXiv:2101.06073. [Google Scholar]
- Gupta, V.; Hewett, R. Adaptive Normalization in Streaming Data. In Proceedings of the 2019 3rd International Conference on Big Data Research, Cergy-Pontoise, France, 20–22 November 2019; ACM: New York, NY, USA; pp. 12–17. [Google Scholar]
- Shi, Y.; Li, W.; Zhu, L.; Guo, K.; Cambria, E. Stock Trading Rule Discovery with Double Deep Q-Network. Appl. Soft Comput. 2021, 107, 107320. [Google Scholar] [CrossRef]
- Lepot, M.; Aubin, J.-B.; Clemens, F. Interpolation in Time Series: An Introductive Overview of Existing Methods, Their Performance Criteria and Uncertainty Assessment. Water 2017, 9, 796. [Google Scholar] [CrossRef]
- Ogasawara, E.; Martinez, L.C.; de Oliveira, D.; Zimbrao, G.; Pap, G.L.; Mattoso, M. Adaptive Normalization: A Novel Data Normalization Approach for Non-Stationary Time Series. In Proceedings of the 2010 International Joint Conference on Neural Networks (IJCNN), Barcelona, Spain, 18–23 July 2010; pp. 1–8. [Google Scholar]
Figure 1.
NVIDIA sentiment value statistics.

Figure 2.
Schematic representation of the Q-network process.

Figure 3.
Learning rate step decay.

Figure 4.
Experiment 1—buy/sell actions.

Figure 5.
Experiment 1—evolution of total profits per episode.

Figure 6.
Experiment 2—buy/sell actions.

Figure 7.
Experiment 2—evolution of total profits per episode.

Figure 8.
Experiment 3—buy/sell actions.

Figure 9.
Experiment 3—evolution of total profits per episode.

Figure 10.
Experiment 1—buy/sell actions across three different random seeds.

Figure 11.
Experiment 1—daily profits (green) and losses (red) across three different random seeds.

Figure 12.
Experiment 2—buy/sell actions across three different random seeds.

Figure 13.
Experiment 2—daily profits (green) and losses (red) across three different random seeds.

Figure 14.
Experiment 3—buy/sell actions across three different random seeds.

Figure 15.
Experiment 3—daily profits (green) and losses (red) across three different random seeds.

Figure 16.
Comparison of total profit range across experiments and random seeds.

Disclaimer/Publisher’s Note: The statements, opinions and data contained in all publications are solely those of the individual author(s) and contributor(s) and not of MDPI and/or the editor(s). MDPI and/or the editor(s) disclaim responsibility for any injury to people or property resulting from any ideas, methods, instructions or products referred to in the content. |
© 2024 by the authors. Licensee MDPI, Basel, Switzerland. This article is an open access article distributed under the terms and conditions of the Creative Commons Attribution (CC BY) license (https://creativecommons.org/licenses/by/4.0/).
Share and Cite
MDPI and ACS Style
Papageorgiou, G.; Gkaimanis, D.; Tjortjis, C. Enhancing Stock Market Forecasts with Double Deep Q-Network in Volatile Stock Market Environments. Electronics 2024, 13, 1629. https://doi.org/10.3390/electronics13091629
AMA Style
Papageorgiou G, Gkaimanis D, Tjortjis C. Enhancing Stock Market Forecasts with Double Deep Q-Network in Volatile Stock Market Environments. Electronics. 2024; 13(9):1629. https://doi.org/10.3390/electronics13091629
Chicago/Turabian StylePapageorgiou, George, Dimitrios Gkaimanis, and Christos Tjortjis. 2024. "Enhancing Stock Market Forecasts with Double Deep Q-Network in Volatile Stock Market Environments" Electronics 13, no. 9: 1629. https://doi.org/10.3390/electronics13091629
Note that from the first issue of 2016, this journal uses article numbers instead of page numbers. See further details here.