
Exploring Skin Interactions with 5G Millimeter-Wave through Fluorescence Lifetime Imaging Microscopy


1
6G Research and Innovation Lab, Swinburne University of Technology, Melbourne, VIC 3122, Australia
2
Department of Computing Technologies, School of Science, Computing and Engineering Technologies, Swinburne University of Technology, Melbourne, VIC 3122, Australia
3
Optical Sciences Centre, Department of Physics and Astronomy, School of Science, Computing and Engineering Technologies, Swinburne University of Technology, Melbourne, VIC 3122, Australia
*
Author to whom correspondence should be addressed.
Electronics 2024, 13(9), 1630; https://doi.org/10.3390/electronics13091630
Submission received: 1 April 2024
/
Revised: 16 April 2024
/
Accepted: 22 April 2024
/
Published: 24 April 2024
(This article belongs to the Section Microwave and Wireless Communications)
Abstract
:The ongoing expansion of fifth-generation (5G) and future sixth-generation (6G) mobile communications is expected to result in widespread human exposure to millimeter-wave (mmWave) radiation globally. Given the short penetration depth of mmWaves and their high absorption by the skin, it is imperative to investigate the potential effects of 5G radiation not only in terms of temperature increase but also at the cellular level. To understand the biological mechanisms of mmWave effects, accurate methods for assessing mmWave absorption in the skin are crucial. In this study, we use fluorescence lifetime imaging microscopy (FLIM) to explore these effects. Employing a mmWave exposure system operating at 26 gigahertz (GHz), porcine skin is irradiated for varying durations (5, 10, 20, and 30 min). We investigate changes in tissue temperature and the autofluorescence of flavin adenine dinucleotide (FAD). Our findings suggest that operating our mmWave exposure systems at the configured power level of 26 GHz is unlikely to cause damage to FADs, even after a 30 min exposure duration.
1. Introduction
Since the introduction of fifth-generation (5G) mobile communications in early 2020, millimeter wave (mmWave) frequencies have been utilized to achieve extremely low latency (around 1 millisecond (ms)) and high data rates (several gigabytes (GB)/s) [1]. The ongoing push to advance 5G and future sixth-generation (6G) mobile communications will lead to widespread human exposure to mmWave radiation worldwide. While considerable attention has been directed towards the technical advancements that 5G, 6G, and beyond will bring, there is also concern about the potential impacts that the technology may have on human health [2].
The dielectric properties of water within the 6–300 gigahertz (GHz) range result in an absorption coefficient (at 20 °C) that increases from 4 at 6 GHz to 30 at 30 GHz, 85 at 100 GHz, and 150 at 300 GHz. Consequently, the penetration depth () (defined as , the depth at which 37% of the incident radiation survives) at 30 GHz is approximately 1 mm, decreasing to about 0.3 mm at 100 GHz [3]. This characteristic leads to electromagnetic (EM) energy being primarily deposited superficially in tissues with a high-water content, such as the skin. For example, at the dermis layer of the skin, decreases from 8.1 mm at 6 GHz to 0.92 mm at 30 GHz [4]. “Heating” of the skin is a notable effect on the human body resulting from exposure to EM-fields (EMFs) [4].
Frequency Range 2 (FR2) (24,250–52,600 megahertz (MHz)) has a short electrical wavelength, resulting in a shorter transmission range but a wider operating bandwidth compared to frequency range 1 (FR1) (i.e., 410–7125 MHz) [5]. With the anticipation of deploying the 5G spectrum in the FR2 region across numerous countries to facilitate diverse applications, exploring its potential health effects is critical. In 5G, mmWave refers to frequencies between 24 and 71 GHz (the two frequency ranges, 26 GHz and 28 GHz, are included in the millimeter range by convention [5]). Therefore, this study focuses on the biological effects of the mmWave band, with particular emphasis on the 5G high-band (i.e., 26 GHz).
Extensive research efforts have been devoted to examining the health implications associated with deploying wireless communication devices operating in the high-frequency range of the EM spectrum (e.g., mmWave range). This includes both experimental and in silico studies [6,7,8,9,10]. Specifically, our research group has investigated the health effects of non-ionizing radiation at higher frequencies using both synchrotron radiation and computational methods [11,12,13].
Based on our previous studies, we determined that further experimental research is necessary to investigate the potential health impacts of 5G devices on sensitive tissues as advised by the International Commission on Non-ionizing Radiation Protection (ICNIRP) [4]. Consequently, we have commenced a research project aimed at developing a mmWave exposure system for biological studies [5]. In this current paper, we employ the developed mmWave exposure system for non-ionizing radiation dosimetry of the skin.
The skin and eyes are the primary human organs directly exposed to the mmWaves produced by 5G technology. However, the current scientific evidence regarding mmWaves’ effects on the skin and skin cells is limited to approximately 99 studies [14]. This indicates a significant gap in our understanding, making it challenging to establish evidence-based exposure limits and develop informed human health policies regarding the potential impacts of mmWaves on individuals. Developing precise methods to evaluate the absorption and penetration of mmWaves into the skin’s surface is crucial for gaining a deeper understanding of their biological effects at 26 GHz.
Numerous studies have investigated the impact of radiofrequency (RF) radiation on the skin, including both experimental and computational approaches [15,16,17,18,19]. However, there is a noticeable gap in the research, particularly regarding microscopic-level examinations. As the primary mechanism of RF-induced damage, heating is the most recognized mechanism for the biological effects of non-ionizing radiation [4,20]. Nonetheless, research on the non-thermal effects is scarce. Therefore, in this study, we aim to investigate both aspects: temperature increase and potential cellular damage.
Fluorescence lifetime imaging microscopy (FLIM) is a functional imaging technique used to examine the duration of a fluorophore’s excited state. Factors in the fluorophore’s environment, including local pH, temperature, viscosity, and oxygen concentration, can influence this duration [21].
FLIM has extensive applications in dermatology, allowing for the examination of both physiological and pathological skin conditions in ex vivo and in vivo samples. Additionally, it is suitable for studying cell cultures. This technique enables the non-invasive monitoring of metabolic activity, morphology, and oxidative stress in mesenchymal stem cells undergoing various differentiation stimuli. Autofluorescence imaging with FLIM relies on exciting specific endogenous cellular or extracellular components that emit fluorescence. Fluorophores are essential components of these molecules, contributing to their characteristic autofluorescence [22].
This study will examine the potential impacts of 26 GHz non-ionizing radiation on porcine skin after exposure durations of 5, 10, 20, and 30 min. The aim of this study is to assess the temperature increase in porcine tissues exposed to RF radiation at 26 GHz and investigate how this rise in temperature may affect the skin. We employ FLIM to examine potential RF-induced damage at the cellular level. To our knowledge, this approach has not been previously utilized in the literature for investigating RF damage on the skin at the cellular level.
2. Fluorescence Lifetime Imaging Microscopy
This section commences by defining FLIM and its configurations. Subsequently, we illustrate its application in studying the damage to the skin caused by exposure to RF radiation.
2.1. Fluorescence Lifetime
Fluorescence lifetime (FLT) represents the dynamic decay process of fluorescence intensity. When a laser of an appropriate wavelength stimulates a substance/tissue, its molecules absorb energy, transitioning from the ground state to an excited state. Subsequently, they emit fluorescence with a longer wavelength as they return to the ground state via radiation transition (note: the emission of a photon following excitation is referred to as fluorescence [23]). FLT denotes the average duration during which a molecule remains in its excited state before emitting a photon. Typically, it is defined as the time taken for the fluorescence intensity to decrease from its peak value to of its peak value [24]:
Here, FLT represents the fluorescence lifetime, where t denotes time, is the initial fluorescence intensity at , and signifies the fluorescence intensity at time t. In biological samples, such as porcine skin, multiple substances can generate fluorescence when excited by a laser. The combined effect of the fluorescence lifetime of these various fluorescent substances can be described by a multi-exponential function as demonstrated below:
where is the FLT of the fluorescent substance, and is the ith weighting factor.
2.2. Determining Lifetime through Phase-Modulation Method
There are two primary approaches to determining the FLT of tissue: frequency-domain and time-domain methods. In the frequency domain, also known as the phase-modulation method, a sinusoidally modulated continuous-wave laser (or LED) is used to excite the sample. The fluorescence emitted from the sample is likewise modulated sinusoidally with the same frequency as the excitation source. The FLT value is derived by measuring the demodulation coefficient and the phase shift between the fluorescence and the excitation light. Various modulation frequencies, typically corresponding to the reciprocal of FLT, can be selected for diverse samples/tissues, effectively broadening the range of the FLT measurements. Assuming a phase shift of fluorescence in relation to the excitation light denoted by ∅ and a modulation factor represented by M, the formulas for calculating FLT are as follows:
Here, is the modulation frequency; please note that for the case of the one-component fluorescence decay, (where represents the phase lifetime and represents the modulation lifetime). It is important to recognize that since we are focusing on using the frequency domain technique to calculate lifetimes, the time domain technique is outside the scope of this research.
2.3. Skin Anatomy and Fluorophores
The skin consists of three primary layers: the epidermis, the dermis, and the subcutaneous tissue. The epidermis, serving as the outermost layer, comprises a stratified squamous epithelium. Its thickness varies across different body regions, ranging from 0.05 mm on the eyelids to 1.5 mm on the palms and soles. The outermost stratum corneum layer of the epidermis consists of flattened, dead cells. Basal cells within the epidermis undergo division, differentiation, and eventual shedding. As they migrate towards the skin surface, they undergo further stratification, ultimately forming the cornified layer of the stratum corneum [25].
Human skin should be viewed as an optically turbid medium through which light passes, undergoing scattering before being absorbed. Some of the scattered light exits the skin through diffuse reflection. The absorbed light can then trigger a faint autofluorescence, which relies on naturally occurring fluorescent biomolecules present in the skin, such as flavins, reduced nicotinamide adenine dinucleotide phosphate (NAD(P)H) coenzymes, and metal-free porphyrins, as well as components of lipofuscin, collagen, elastin, and keratin (represented in Table 1) [25,26].
Flavin adenine dinucleotide (FAD), known for its autofluorescence properties, plays a vital role in cell metabolism, particularly in electron transfer processes. FAD fluorescence can be used as a marker to study cellular metabolism and redox processes. Changes in the intensity or duration of FAD fluorescence provide valuable indications about cellular metabolic activities, such as oxidative phosphorylation and glycolysis. Typical characteristics of FAD are demonstrated in Table 1.
Porcine (i.e., pig) skin exhibits histological similarities to human skin as evidenced by comparable stratum corneum thickness ranging from 21 to 26 μm [27]. Therefore, we used porcine skin as a surrogate for human tissues (e.g., skin) in this study.

Table 1.
Distinctive characteristics of endogenous skin fluorophores (NAD(P)H and FAD) adapted from [28]. Note: endogenous fluorophores are responsible for tissue autofluorescence [29].
| Fluorophore | 1-P Peak Excitation Wavelength (nm) | 2-P Peak Excitation Wavelength (nm) | Emission Wavelength (nm) | Fluorescence Lifetime (ns) |
|---|---|---|---|---|
| Bound FAD | 360–465 | 725–760, 850–950 | 520–530 | 0.003–4.55 |
| Free FAD | 360–465 | 725–760, 850–950 | 520–530 | 2.3–2.9 |
| Bound NAD(P)H | 330–360 | 760 | 440–470 | 1.9–5.7 |
| Free NAD(P)H | 330–360 | 760 | 440–470 | 0.3–0.4 |
3. Materials and Methods
This section outlines the experimental procedure involving exposing samples to RF (i.e., 26 GHz). Additionally, we describe the methodology used to analyze the samples (i.e., FLIM), and data analysis techniques.
3.1. Skin Samples
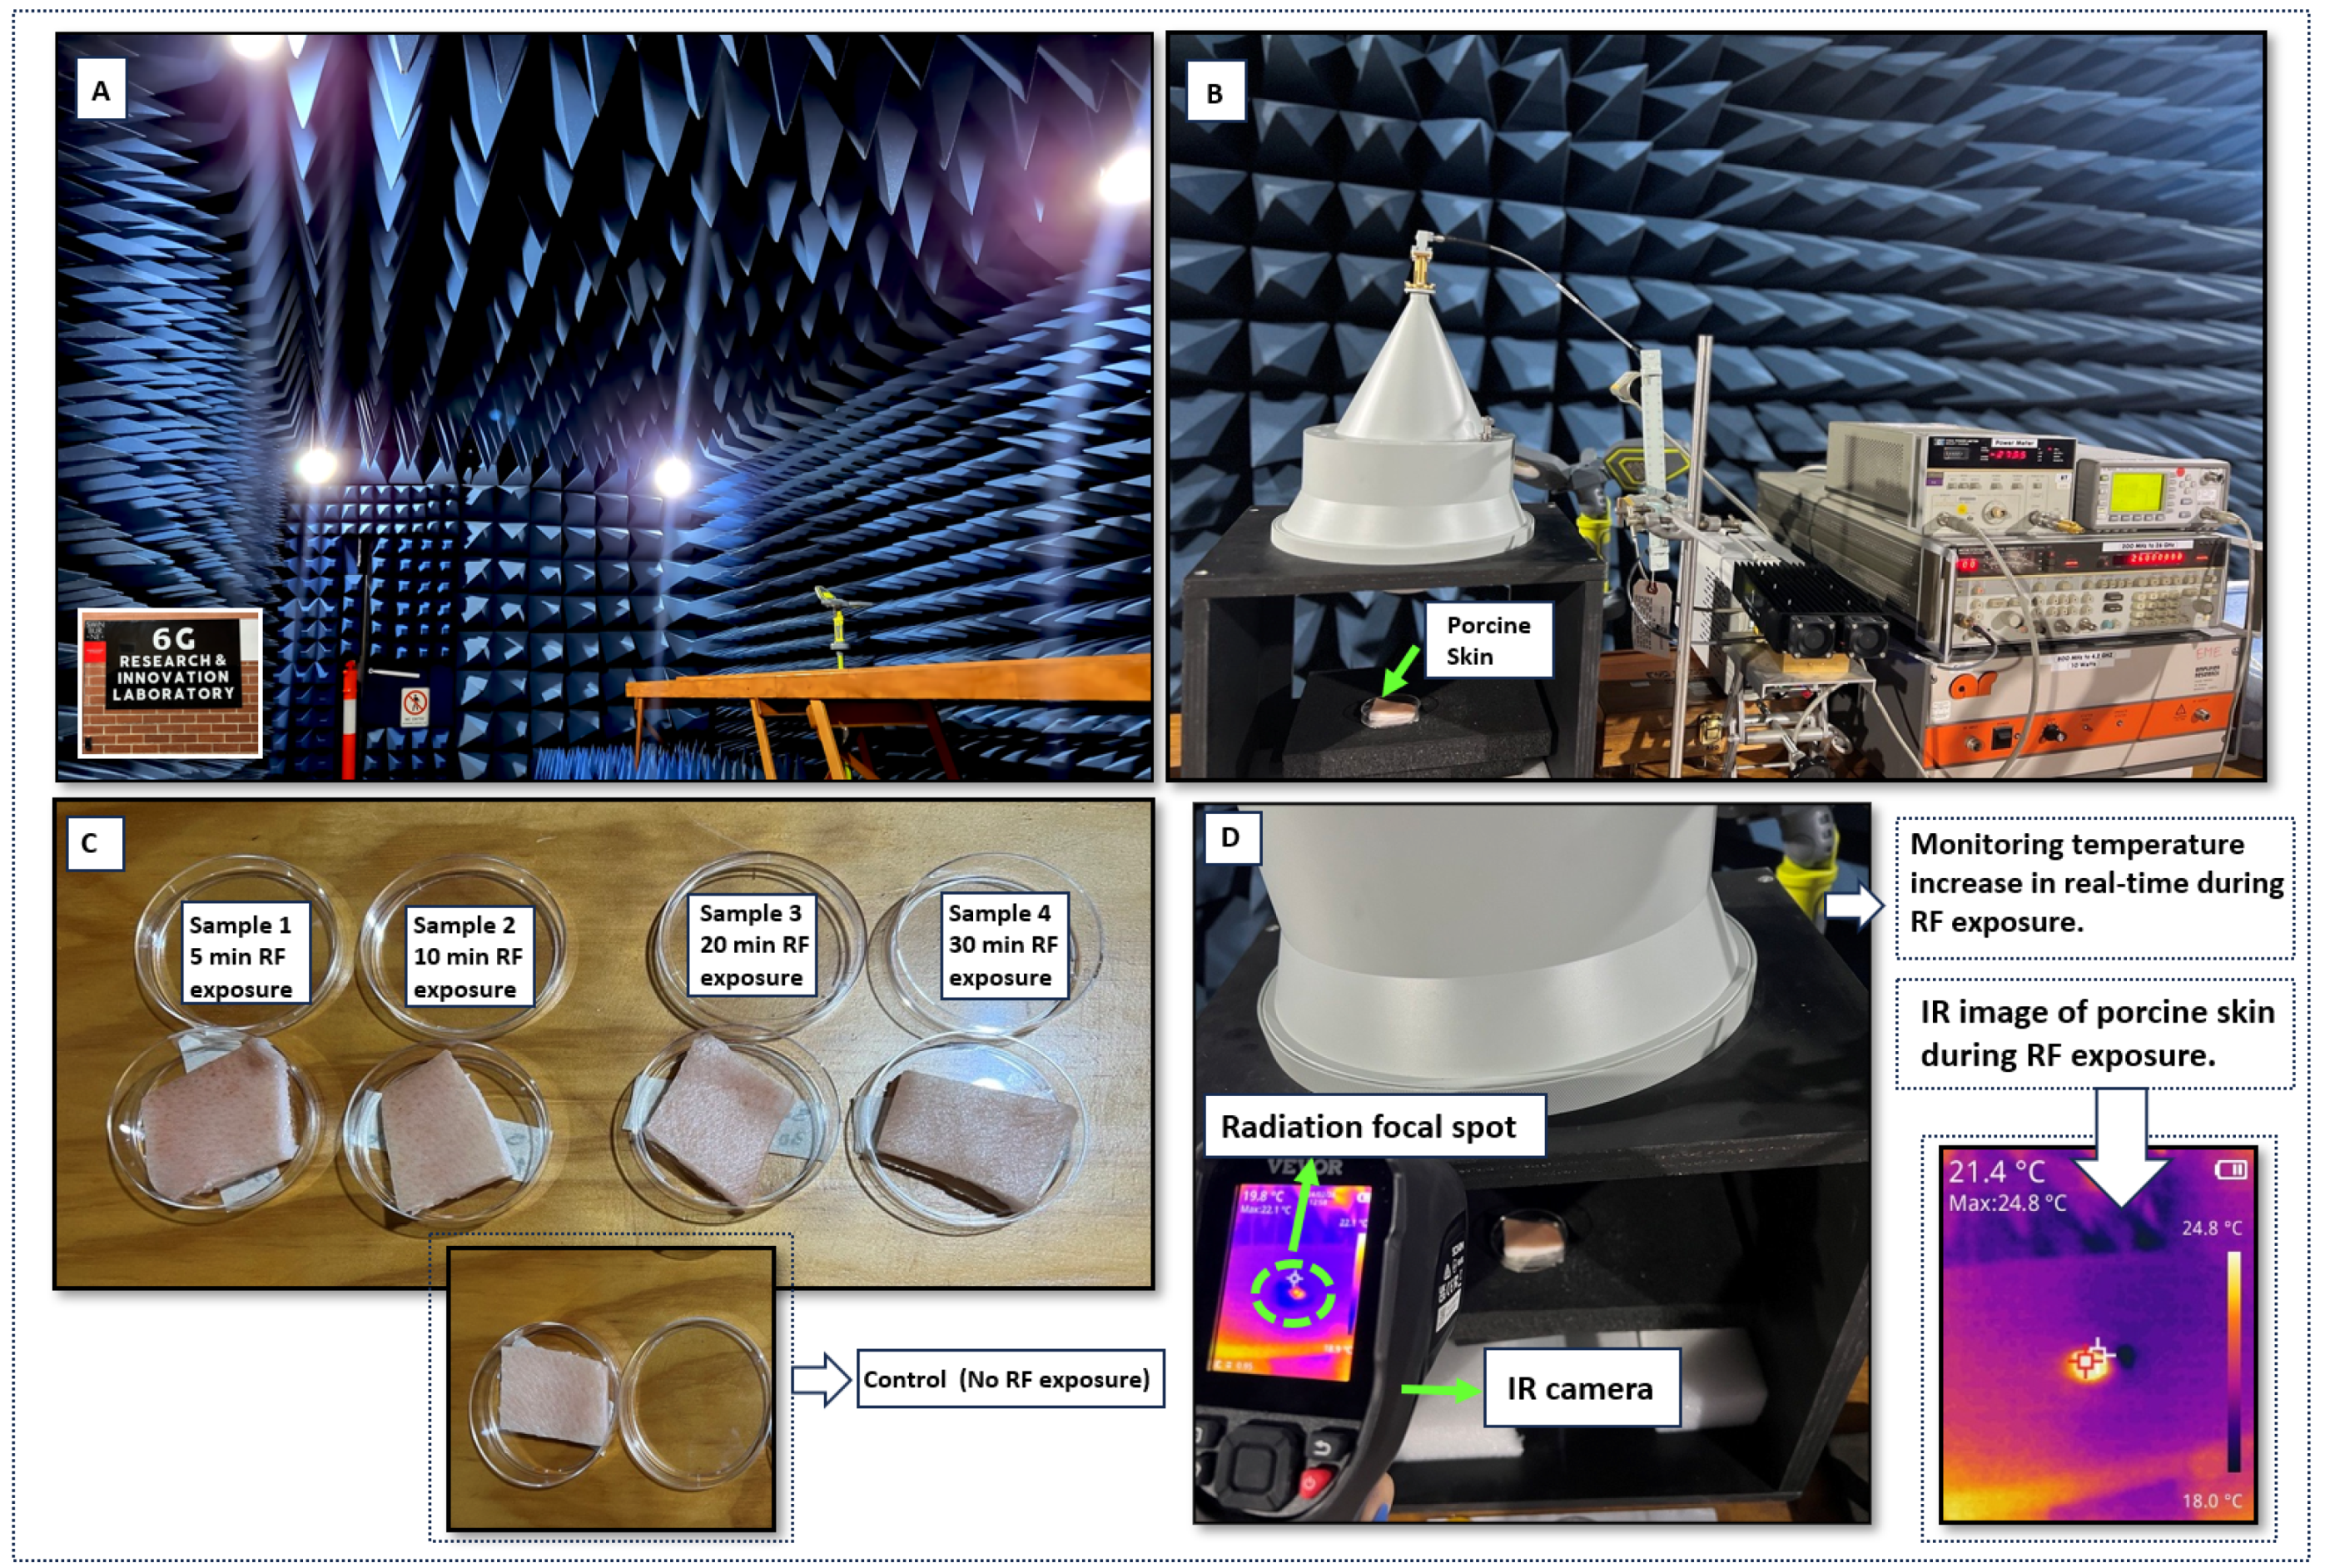
Fresh ex vivo skin samples, sourced from porcine skin on the day of the experiment, with an average thickness of approximately 20 mm, were obtained from an abattoir. The specimens were stored at 21 °C before use. Six specimens from identical porcine skin patch subjects were dissected for examination. Each skin sample was prepared by placing it in a petri dish (illustrated in Figure 1C). Before RF exposure, the samples underwent FLIM analysis.
3.2. mmWave Exposure
While the traditional definition of mmWave typically ranges from 30.0 to 300.0 GHz, our study specifically focuses on the 26 GHz frequency. We selected this frequency because, in the context of 5G, mmWave refers to frequencies ranging from 24 to 71 GHz, with the two frequency ranges of 26 GHz and 28 GHz conventionally included in the mmWave spectrum [5].
Following sample preparation, the samples’ temperatures were assessed using an IR thermal camera. Initially, the samples were stored in a laboratory refrigerator and then brought indoors to reach the stable temperature of the laboratory environment (this process was carried out quickly to prevent the samples from drying out and to expedite the experiment). Once the stable temperature was achieved, the samples were exposed to 5G radiation within an anechoic chamber (shown in Figure 1A) at 26 GHz using a spot-focusing antenna with a highly concentrated beam measured at a 1 cm spot size [5] (Figure 1D). The characteristics and components of this mmWave exposure system were previously detailed in our prior publication; please see [5] and the following figure (Figure 1) for details. The samples were exposed to RF for 5, 10, 20, and 30 min at the same power of 5.1 Kw·.
3.3. Temperature Rise Measurement
EM wave absorption involves the absorption of EM energy by tissue, leading to the attenuation of the primary radiation beam [30]. Given the shallow penetration depth of less than 1 mm at 26 GHz [5], the temperature rise predominantly impacts the surface [20]. Therefore, an IR thermal camera was employed to monitor the temperature increase on the skin’s surface. Three temperature readings were taken per minute and then averaged to enhance precision and minimize uncertainty.
3.4. FLIM Imaging and Data Analysis
Immediately after RF exposure, the samples were transported to the microscopy facility at Swinburne University. Specifically, FLIM was employed to examine and identify any potential tissue damage. We used FLIM to map the spatial distribution of nanosecond (ns) excited state lifetimes within microscopic images (illustrated in Figure 2D).
Configuration includes a modulation frequency of 35 MHz, a gain of 900 V, an exposure time of 300.0 ms, and 12 phase images. The LIFA unit (Lambert Instruments, The Netherlands) was affixed to a Ti Eclipse inverted microscope (Nikon Inc., Tokyo, Japan) (Figure 2D). Sample excitation occurred with 470 nm light, focused through a 2× air objective, and emission was observed through a hyper-spectral imaging system (His-400; Gooch & Housego; Orlando, FL, USA) set at 528.5 nm. Measurements were referenced against a solution of rhodamine 6G (FLT = 4.1 ns) to correct for instrumental demodulation and phase shift (Shown in Figure 2A–C). We generated polar plots for porcine skin (shown in Figure 2F) to visualize the distribution of lifetimes within the samples. As seen in Figure 2F, the polar plot of porcine skin exhibited a complex and heterogeneous lifetime decay pattern, consistent with findings commonly reported in the literature [31,32]. The observed intricate and varied decay pattern in the porcine skin polar plot aligns with well-established research findings. This variability likely arises from skin tissue’s complex composition and structure, leading to differences in fluorescence lifetimes across various sample regions. Additionally, factors such as tissue morphology, pigmentation, and diverse biomolecules contribute to the observed heterogeneity in fluorescence decay. However, we opted not to include these polar plots in this paper, as our study is primarily focused on examining the possible changes in the autofluorescence of FADs within skin tissue following irradiation.
Instead, we analyzed the FLIM data using the lifetime information obtained from the measured (phase lifetime) as a simple metric. To enhance precision, we selected six distinct ROIs within the image (as shown in Figure 2E) and calculated the average data from these ROIs.
The analysis of fluorescence lifetime images obtained through FLIM aimed to detect potential tissue damage. The fluorescence lifetime images provide valuable information about the structure and dynamics of the porcine skin and its molecular components. This is primarily attributed to the extended duration that the fluorescent molecules in the skin tissue remain in the excited state. During this period, various processes can occur, including alterations in orientation, conformational changes, and the binding of ions or other macromolecules. These changes enable the detection of molecular interactions within the tissue.
4. Results
In this section, we represent the study results, specifically highlighting the temperature changes observed at different exposure durations and the results obtained from FLIM imaging.
Figure 3 and Figure 4 represent the temperature variations of the skin exposed to RF at 26 GHz according to time.
Investigating autofluorescence in biological tissue presents challenges due to the overlapping excitation and emission spectra of these natural fluorophores, and their inherently low fluorescence intensity, as well as the significant scattering and heterogeneity within the tissue (e.g., skin) [33]. It is challenging to obtain dependable quantitative data solely from autofluorescence intensity measurements. Hence, we investigated additional fluorescence properties, such as lifetime (e.g., phase lifetime).
5. Discussion
As depicted in Figure 3 and Figure 4, when porcine skin is exposed to RF radiation initially, the rate of temperature increase is notably high after 5 and 10 min of exposure (0.59 and 0.54 °C/min, respectively). This rapid temperature elevation occurs as the skin absorbs energy from the RF source (i.e., mmWave exposure system), undergoing rapid internal changes and becoming less responsive to additional energy input.
The skin absorbs more energy as exposure continues and undergoes further changes, but the temperature rise gradually diminishes. This decrease is due to the skin approaching its maximum capacity to absorb and process energy effectively (e.g., factors such as limitations in heat dissipation mechanisms contribute to this phenomenon).
With prolonged exposure, the rate of temperature rise progressively decreases until it stabilizes or reaches a plateau. At this point, the skin has saturated its capacity to absorb energy from the RF exposure. Therefore, subsequent exposure under similar conditions is anticipated to result in minimal or negligible further temperature changes.
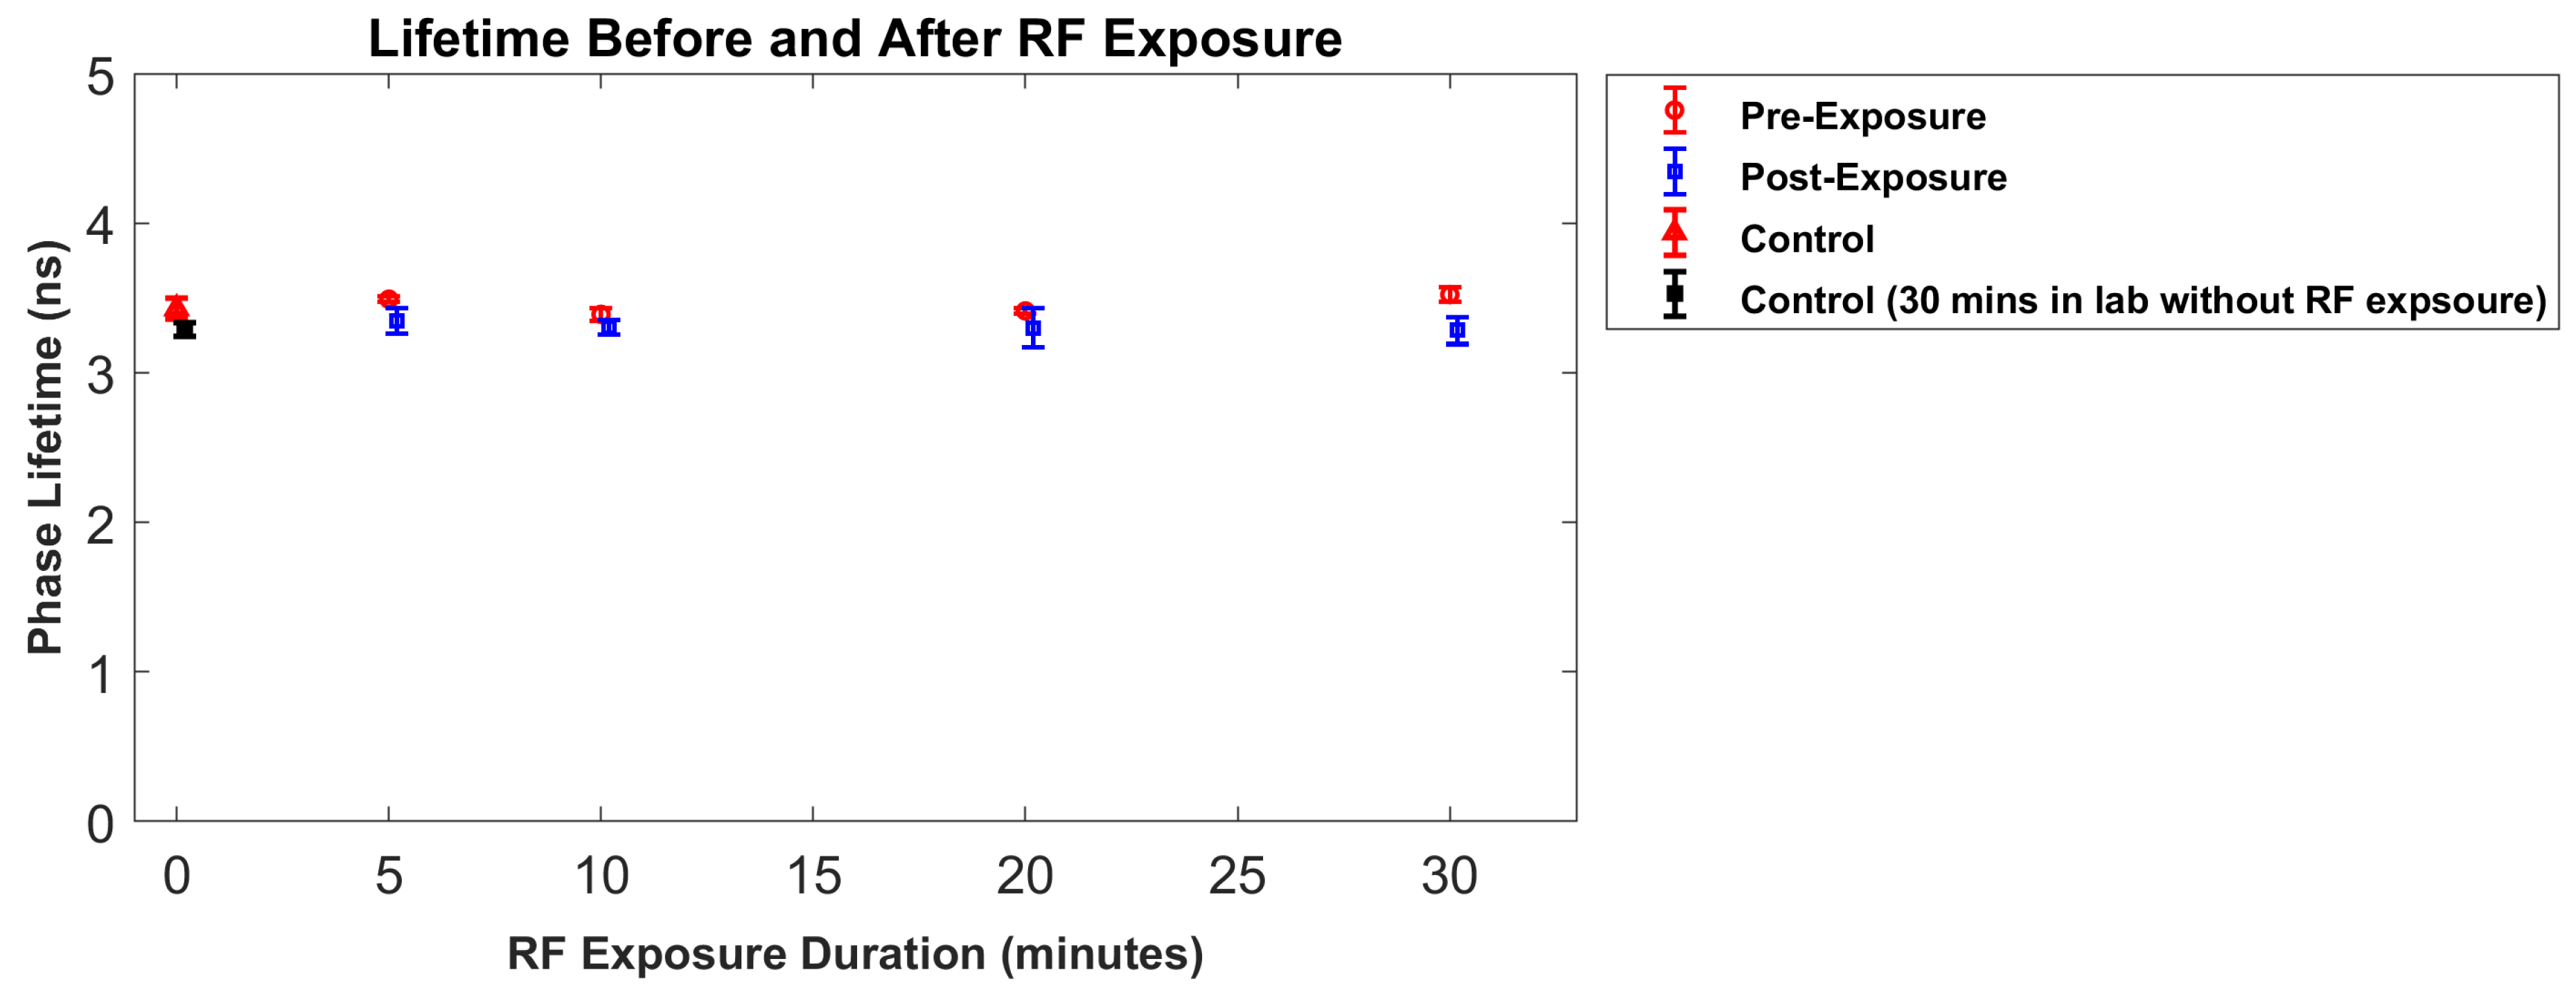
In this study, we opted not to use standard exogenous dyes or stains for our FLIM measurements. Instead, we relied on intrinsic fluorophores and reliable cell and tissue metabolism indicators (such as FADs). Measuring the lifetime of cofactors such as FADs allows us to estimate metabolic activity. As illustrated in Figure 5, the phase lifetime of porcine skin decreases following RF exposure. However, this reduction is not statistically significant and was observed in the control samples as well. This decline was marginally more pronounced after thirty minutes of exposure to 26 GHz radiation. Specifically, the lifetime decreased from 3.53 ± 0.04 ns to 3.28 ± 0.08 ns. A change in lifetime from 3.53 to 3.28 ns could represent a small relative change (<10%) and could result from a small change in the relative amounts of FAD in a semi-closed conformation (lifetime = 2 ns) relative to an open conformation (lifetime = 4 ns). The change signifies an alteration in the physical environment but it is unclear whether this change would have a significant impact of cell physiology [24].
Given our excitation wavelength of 470 nm and the obtained lifetimes falling within the range of FADs’ lifetimes, the data are attributed to autofluorescence, specifically bound FADs in porcine skin (as illustrated in Table 1). It is important to note that the decrease in phase lifetime did not change the physiological state of FAD (from bound to free). Our findings suggest that our mmWave exposure system, which emits a highly focused beam at its current power of 5.1 Kw·, is likely to result in around a 7 °C temperature rise (after 30 min exposure) in a highly water-rich tissue such as the skin. However, it is improbable to cause cellular damage at the tissue level.
Various studies have concentrated on examining the impacts of non-ionizing radiation on skin tissues, including protein expression [34], cellular stress [35], and temperature elevation [36] resulting from exposure to 900 MHz (GSM-900). However, as observed in the literature, a considerable number of these investigations have relied heavily on computational methods [37,38,39], which may present challenges in examining the non-thermal effects. To our knowledge, none of the existing studies in the literature have considered utilizing FLIM to examine the impact of RF-EMF. Thus, this study introduces new avenues for investigating whether RF radiation at frequencies utilized by 5G devices (such as 26 GHz) could potentially affect cellular levels following tissue temperature elevation. The future direction of this research involves exploring various power levels and different exposure scenarios to replicate real-life skin exposure to RF radiation.
6. Conclusions
This study investigated the impact of mmWave radiation (26 GHz) on porcine skin. We used a mmWave exposure system to expose skin samples to radiation for 5, 10, 20, and 30 min to assess the potential damage. We employed FLIM measurements for damage analysis, focusing on the lifetime of flavines (FADs), which serve as indicators of cellular and tissue metabolic activities. Our findings revealed a decrease in FAD lifetime in samples exposed to RF radiation, with the highest decline observed in samples exposed for 30 min. Notably, the decrease in FAD lifetime did not indicate a transition from bound FAD to free FAD, suggesting no anticipated damage.
Author Contributions
Conceptualization, N.F., A.H.A.C. and A.Y.; methodology, N.F.; formal analysis, N.F.; investigation, N.F., A.H.A.C. and A.Y.; writing—original draft preparation, N.F.; writing—review and editing, A.H.A.C. and A.Y.; visualization, N.F. All authors have read and agreed to the published version of the manuscript.
Funding
This research received no external funding.
Institutional Review Board Statement
The study has been granted ethics approval exemption by the Animal Ethics Committees of Swinburne University of Technology (13 June 2023).
Data Availability Statement
Data are contained within the article.
Conflicts of Interest
The authors declare no conflict of interest.
Abbreviations
The following abbreviations are used in this manuscript:
| (NAD(P)H) | Adenine Dinucleotide Phosphate |
| 6G | Sixth generation |
| 5G | Fifth generation |
| EM | Electromagnetic |
| FAD | Flavin Adenine Dinucleotide |
| FLIM | Fluorescence Lifetime Imaging Microscopy |
| FLT | Fluorescence lifetime |
| FR1 | Frequency Range 1 |
| FR2 | Frequency Range 2 |
| GB | Gigabytes |
| GHz | Gigahertz |
| ICNIRP | International Commission on Non-ionizing Radiation Protection |
| IR | Infrared |
| MHz | Megahertz |
| ms | Millisecond |
| mmWave | Millimeter-wave |
| ns | Nanosecond |
| RF | Radiofrequency |
| ROI | Region of Interest |
References
- Foroughimehr, N.; Vilagosh, Z.; Yavari, A.; Wood, A. The Impact of Base Cell Size Setup on the Finite Difference Time Domain Computational Simulation of Human Cornea Exposed to Millimeter Wave Radiation at Frequencies above 30 GHz. Sensors 2022, 22, 5924. [Google Scholar] [CrossRef] [PubMed]
- Shi, S.; Jiang, Y.; Ren, H.; Deng, S.; Sun, J.; Cheng, F.; Jing, J.; Chen, Y. 3D-printed carbon-based conformal electromagnetic interference shielding module for integrated electronics. Nano-Micro Lett. 2024, 16, 85. [Google Scholar] [CrossRef] [PubMed]
- Segelstein, D.J. The Complex Refractive Index of Water. Ph.D. Thesis, University of Missouri-Kansas City, Kansas City, MO, USA, 1981. [Google Scholar]
- ICNIRP. Guidelines for limiting exposure to electromagnetic fields (100 kHz to 300 GHz). Health Phys. 2020, 118, 483–524. [Google Scholar] [CrossRef] [PubMed]
- Foroughimehr, N.; Wood, A.; McKenzie, R.; Karipidis, K.; Yavari, A. Design and Implementation of a Specialised Millimetre-Wave Exposure System for Investigating the Radiation Effects of 5G and Future Technologies. Sensors 2024, 24, 1516. [Google Scholar] [CrossRef] [PubMed]
- Kojima, M.; Hanazawa, M.; Yamashiro, Y.; Sasaki, H.; Watanabe, S.; Taki, M.; Suzuki, Y.; Hirata, A.; Kamimura, Y.; Sasaki, K. Acute ocular injuries caused by 60-GHz millimeter-wave exposure. Health Phys. 2009, 97, 212–218. [Google Scholar] [CrossRef] [PubMed]
- Sasaki, K.; Sakai, T.; Nagaoka, T.; Wake, K.; Watanabe, S.; Kojima, M.; Hasanova, N.; Sasaki, H.; Sasaki, K.; Suzuki, Y.; et al. Dosimetry using a localized exposure system in the millimeter-wave band for in vivo studies on ocular effects. IEEE Trans. Microw. Theory Tech. 2014, 62, 1554–1564. [Google Scholar] [CrossRef]
- Diao, Y.; Rashed, E.A.; Hirata, A. Assessment of absorbed power density and temperature rise for nonplanar body model under electromagnetic exposure above 6 GHz. Phys. Med. Biol. 2020, 65, 224001. [Google Scholar] [CrossRef]
- Foster, K.R.; Laakso, I.; Chalfin, S. Nonuniform exposure to the cornea from millimeter waves. Health Phys. 2021, 120, 525–531. [Google Scholar] [CrossRef]
- Karampatzakis, A.; Samaras, T. Numerical modeling of heat and mass transfer in the human eye under millimeter wave exposure. Bioelectromagnetics 2013, 34, 291–299. [Google Scholar] [CrossRef]
- Foroughimehr, N.; Vilagosh, Z.; Wood, A.W. The reflectance of sepia melanin at THz frequencies. In Proceedings of the 2023 5th Australian Microwave Symposium (AMS), Melbourne, Australia, 16–17 February 2023; IEEE: Piscataway, NJ, USA, 2023; pp. 1–2. [Google Scholar]
- Foroughimehr, N.; Vilagosh, Z.; Yavari, A.; Wood, A. The effects of mmW and THz radiation on dry eyes: A finite-difference time-domain (FDTD) computational simulation using XFdtd. Sensors 2023, 23, 5853. [Google Scholar] [CrossRef]
- Foroughimehr, N.; Vilagosh, Z.; Yavari, A.; Wood, A. Investigating the Impact of Synchrotron THz Radiation on the Corneal Hydration Using Synchrotron THz-Far Infrared Beamline. Sensors 2022, 22, 8261. [Google Scholar] [CrossRef] [PubMed]
- Leszczynski, D. Physiological effects of millimeter-waves on skin and skin cells: An overview of the to-date published studies. Rev. Environ. Health 2020, 35, 493–515. [Google Scholar] [CrossRef] [PubMed]
- Christ, A.; Samaras, T.; Neufeld, E.; Kuster, N. RF-induced temperature increase in a stratified model of the skin for plane-wave exposure at 6–100 GHz. Radiat. Prot. Dosim. 2020, 188, 350–360. [Google Scholar] [CrossRef] [PubMed]
- Patrignoni, L.; Hurtier, A.; Orlacchio, R.; Joushomme, A.; Poulletier de Gannes, F.; Lévêque, P.; Arnaud-Cormos, D.; Revzani, H.R.; Mahfouf, W.; Garenne, A.; et al. Evaluation of mitochondrial stress following ultraviolet radiation and 5G radiofrequency field exposure in human skin cells. Bioelectromagnetics 2024, 45, 110–129. [Google Scholar] [CrossRef] [PubMed]
- Feldman, Y.; Puzenko, A.; Ishai, P.B.; Caduff, A.; Davidovich, I.; Sakran, F.; Agranat, A.J. The electromagnetic response of human skin in the millimetre and submillimetre wave range. Phys. Med. Biol. 2009, 54, 3341. [Google Scholar] [CrossRef] [PubMed]
- Alekseev, S.; Radzievsky, A.; Szabo, I.; Ziskin, M. Local heating of human skin by millimeter waves: Effect of blood flow. Bioelectromagnetics 2005, 26, 489–501. [Google Scholar] [CrossRef] [PubMed]
- Millenbaugh, N.J.; Roth, C.; Sypniewska, R.; Chan, V.; Eggers, J.S.; Kiel, J.L.; Blystone, R.V.; Mason, P.A. Gene expression changes in the skin of rats induced by prolonged 35 GHz millimeter-wave exposure. Radiat. Res. 2008, 169, 288–300. [Google Scholar] [CrossRef] [PubMed]
- Foroughimehr, N. Millimeter Wave Absorption by the Cornea. Ph.D. Thesis, Swinburne University of Technology, Melbourne, VIC, Australia, 2023. [Google Scholar]
- Skala, M.C.; Riching, K.M.; Bird, D.K.; Gendron-Fitzpatrick, A.; Eickhoff, J.; Eliceiri, K.W.; Keely, P.J.; Ramanujam, N. In vivo multiphoton fluorescence lifetime imaging of protein-bound and free NADH in normal and pre-cancerous epithelia. J. Biomed. Opt. 2007, 12, 024014. [Google Scholar] [CrossRef]
- Dancik, Y.; Favre, A.; Loy, C.J.; Zvyagin, A.V.; Roberts, M.S. Use of multiphoton tomography and fluorescence lifetime imaging to investigate skin pigmentation in vivo. J. Biomed. Opt. 2013, 18, 026022. [Google Scholar]
- Roberts, M.S.; Dancik, Y.; Prow, T.W.; Thorling, C.A.; Lin, L.L.; Grice, J.E.; Robertson, T.A.; König, K.; Becker, W. Non-invasive imaging of skin physiology and percutaneous penetration using fluorescence spectral and lifetime imaging with multiphoton and confocal microscopy. Eur. J. Pharm. Biopharm. 2011, 77, 469–488. [Google Scholar] [CrossRef]
- Liu, L.; Yang, Q.; Zhang, M.; Wu, Z.; Xue, P. Fluorescence lifetime imaging microscopy and its applications in skin cancer diagnosis. J. Innov. Opt. Health Sci. 2019, 12, 1930004. [Google Scholar] [CrossRef]
- Masters, B.R. Three-dimensional confocal microscopy of human skin in vivo: Autofluorescence of normal skin. Bioimages 1996, 4, 13–19. [Google Scholar]
- Koenig, K.; Riemann, I. High-resolution multiphoton tomography of human skin with subcellular spatial resolution and picosecond time resolution. J. Biomed. Opt. 2003, 8, 432–439. [Google Scholar] [CrossRef] [PubMed]
- Abd, E.; Yousef, S.A.; Pastore, M.N.; Telaprolu, K.; Mohammed, Y.H.; Namjoshi, S.; Grice, J.E.; Roberts, M.S. Skin models for the testing of transdermal drugs. Clin. Pharmacol. Adv. Appl. 2016, 8, 163–176. [Google Scholar] [CrossRef] [PubMed]
- Kolenc, O.I.; Quinn, K.P. Evaluating cell metabolism through autofluorescence imaging of NAD (P) H and FAD. Antioxidants Redox Signal. 2019, 30, 875–889. [Google Scholar] [CrossRef]
- Laiho, L.H.; Pelet, S.; Hancewicz, T.M.; Kaplan, P.D.; So, P.T. Two-photon 3-D mapping of ex vivo human skin endogenous fluorescence species based on fluorescence emission spectra. J. Biomed. Opt. 2005, 10, 024016. [Google Scholar] [CrossRef]
- Eskandari, V.; Kordzadeh, A.; Zeinalizad, L.; Sahbafar, H.; Aghanouri, H.; Hadi, A.; Ghaderi, S. Detection of molecular vibrations of atrazine by accumulation of silver nanoparticles on flexible glass fiber as a surface-enhanced Raman plasmonic nanosensor. Opt. Mater. 2022, 128, 112310. [Google Scholar] [CrossRef]
- Zeng, H. Human Skin Optical Properties and Autofluorescence Decay Dynamics. Ph.D. Thesis, University of British Columbia, Vancouver, BC, Canada, 1993. [Google Scholar]
- Meerwaldt, R.; Links, T.; Graaff, R.; Thorpe, S.R.; Baynes, J.W.; Hartog, J.; Gans, R.; Smit, A. Simple noninvasive measurement of skin autofluorescence. Ann. N. Y. Acad. Sci. 2005, 1043, 290–298. [Google Scholar] [CrossRef] [PubMed]
- De Beule, P.; Dunsby, C.; Galletly, N.; Stamp, G.; Chu, A.; Anand, U.; Anand, P.; Benham, C.; Naylor, A.; French, P. A hyperspectral fluorescence lifetime probe for skin cancer diagnosis. Rev. Sci. Instrum. 2007, 78, 123101. [Google Scholar] [CrossRef]
- Karinen, A.; Heinävaara, S.; Nylund, R.; Leszczynski, D. Mobile phone radiation might alter protein expression in human skin. BMC Genom. 2008, 9, 77. [Google Scholar] [CrossRef]
- Sanchez, S.; Milochau, A.; Ruffie, G.; Poulletier de Gannes, F.; Lagroye, I.; Haro, E.; Surleve-Bazeille, J.E.; Billaudel, B.; Lassegues, M.; Veyret, B. Human skin cell stress response to GSM-900 mobile phone signals: In vitro study on isolated primary cells and reconstructed epidermis. FEBS J. 2006, 273, 5491–5507. [Google Scholar] [CrossRef]
- Straume, A.; Oftedal, G.; Johnsson, A. Skin temperature increase caused by a mobile phone: A methodological infrared camera study. Bioelectromagnetics 2005, 26, 510–519. [Google Scholar] [CrossRef]
- Keshvari, J.; Lang, S. Comparison of radio frequency energy absorption in ear and eye region of children and adults at 900, 1800 and 2450 MHz. Phys. Med. Biol. 2005, 50, 4355. [Google Scholar] [CrossRef]
- Kodera, S.; Gomez-Tames, J.; Hirata, A. Temperature elevation in the human brain and skin with thermoregulation during exposure to RF energy. Biomed. Eng. Online 2018, 17, 1. [Google Scholar] [CrossRef]
- Hirata, A.; Asano, T.; Fujiwara, O. FDTD analysis of human body-core temperature elevation due to RF far-field energy prescribed in the ICNIRP guidelines. Phys. Med. Biol. 2007, 52, 5013. [Google Scholar] [CrossRef]
Figure 1.
The experimental configuration employed in this study: (A) the 6G Research and Innovation’s laboratory anechoic chamber for conducting RF exposure; (B) the mmWave exposure system equipped with a spot-focusing antenna featuring a 1 cm spot size with the beam focused on the porcine skin; (C) employing four samples for RF exposure and one control sample; (D) visualization of the radiation focal spot (1 cm) on an infrared (IR) camera with the monitoring of the temperature rise during RF exposure.

Figure 2.
Experimental setup and intensity images obtained during FLIM measurements (A) rhodamine 6G in distilled water (lifetime = 4.1 ns) used as a reference. (B) Corresponding intensity image of rhodamine 6G. (C) Polar plot showing the location of a 4.1 ns lifetime fluorophore (rhodamine 6G). (D) FLIM measurement setup featuring the LIFA unit controlled by LI-FLIM version 1.2.6 (Lambert Instruments, Groningen, The Netherlands). (E) Selection of six regions of interest (ROI) within the intensity image to determine the phase lifetime within those areas. (F) Polar plot illustrating heterogeneous lifetime distribution of autofluorescence (plot is broad and inside the semi-circle).

Figure 3.
The temperature response of porcine skin to RF exposure at 26 GHz. The top image illustrates temperature variation after 5 min of exposure, while the bottom image illustrates the variation after 10 min of exposure. Temperature measurements were captured using an IR camera, with three readings per minute averaged to reduce uncertainty. The rate of temperature rise was determined by calculating the slope between the first and last data points.
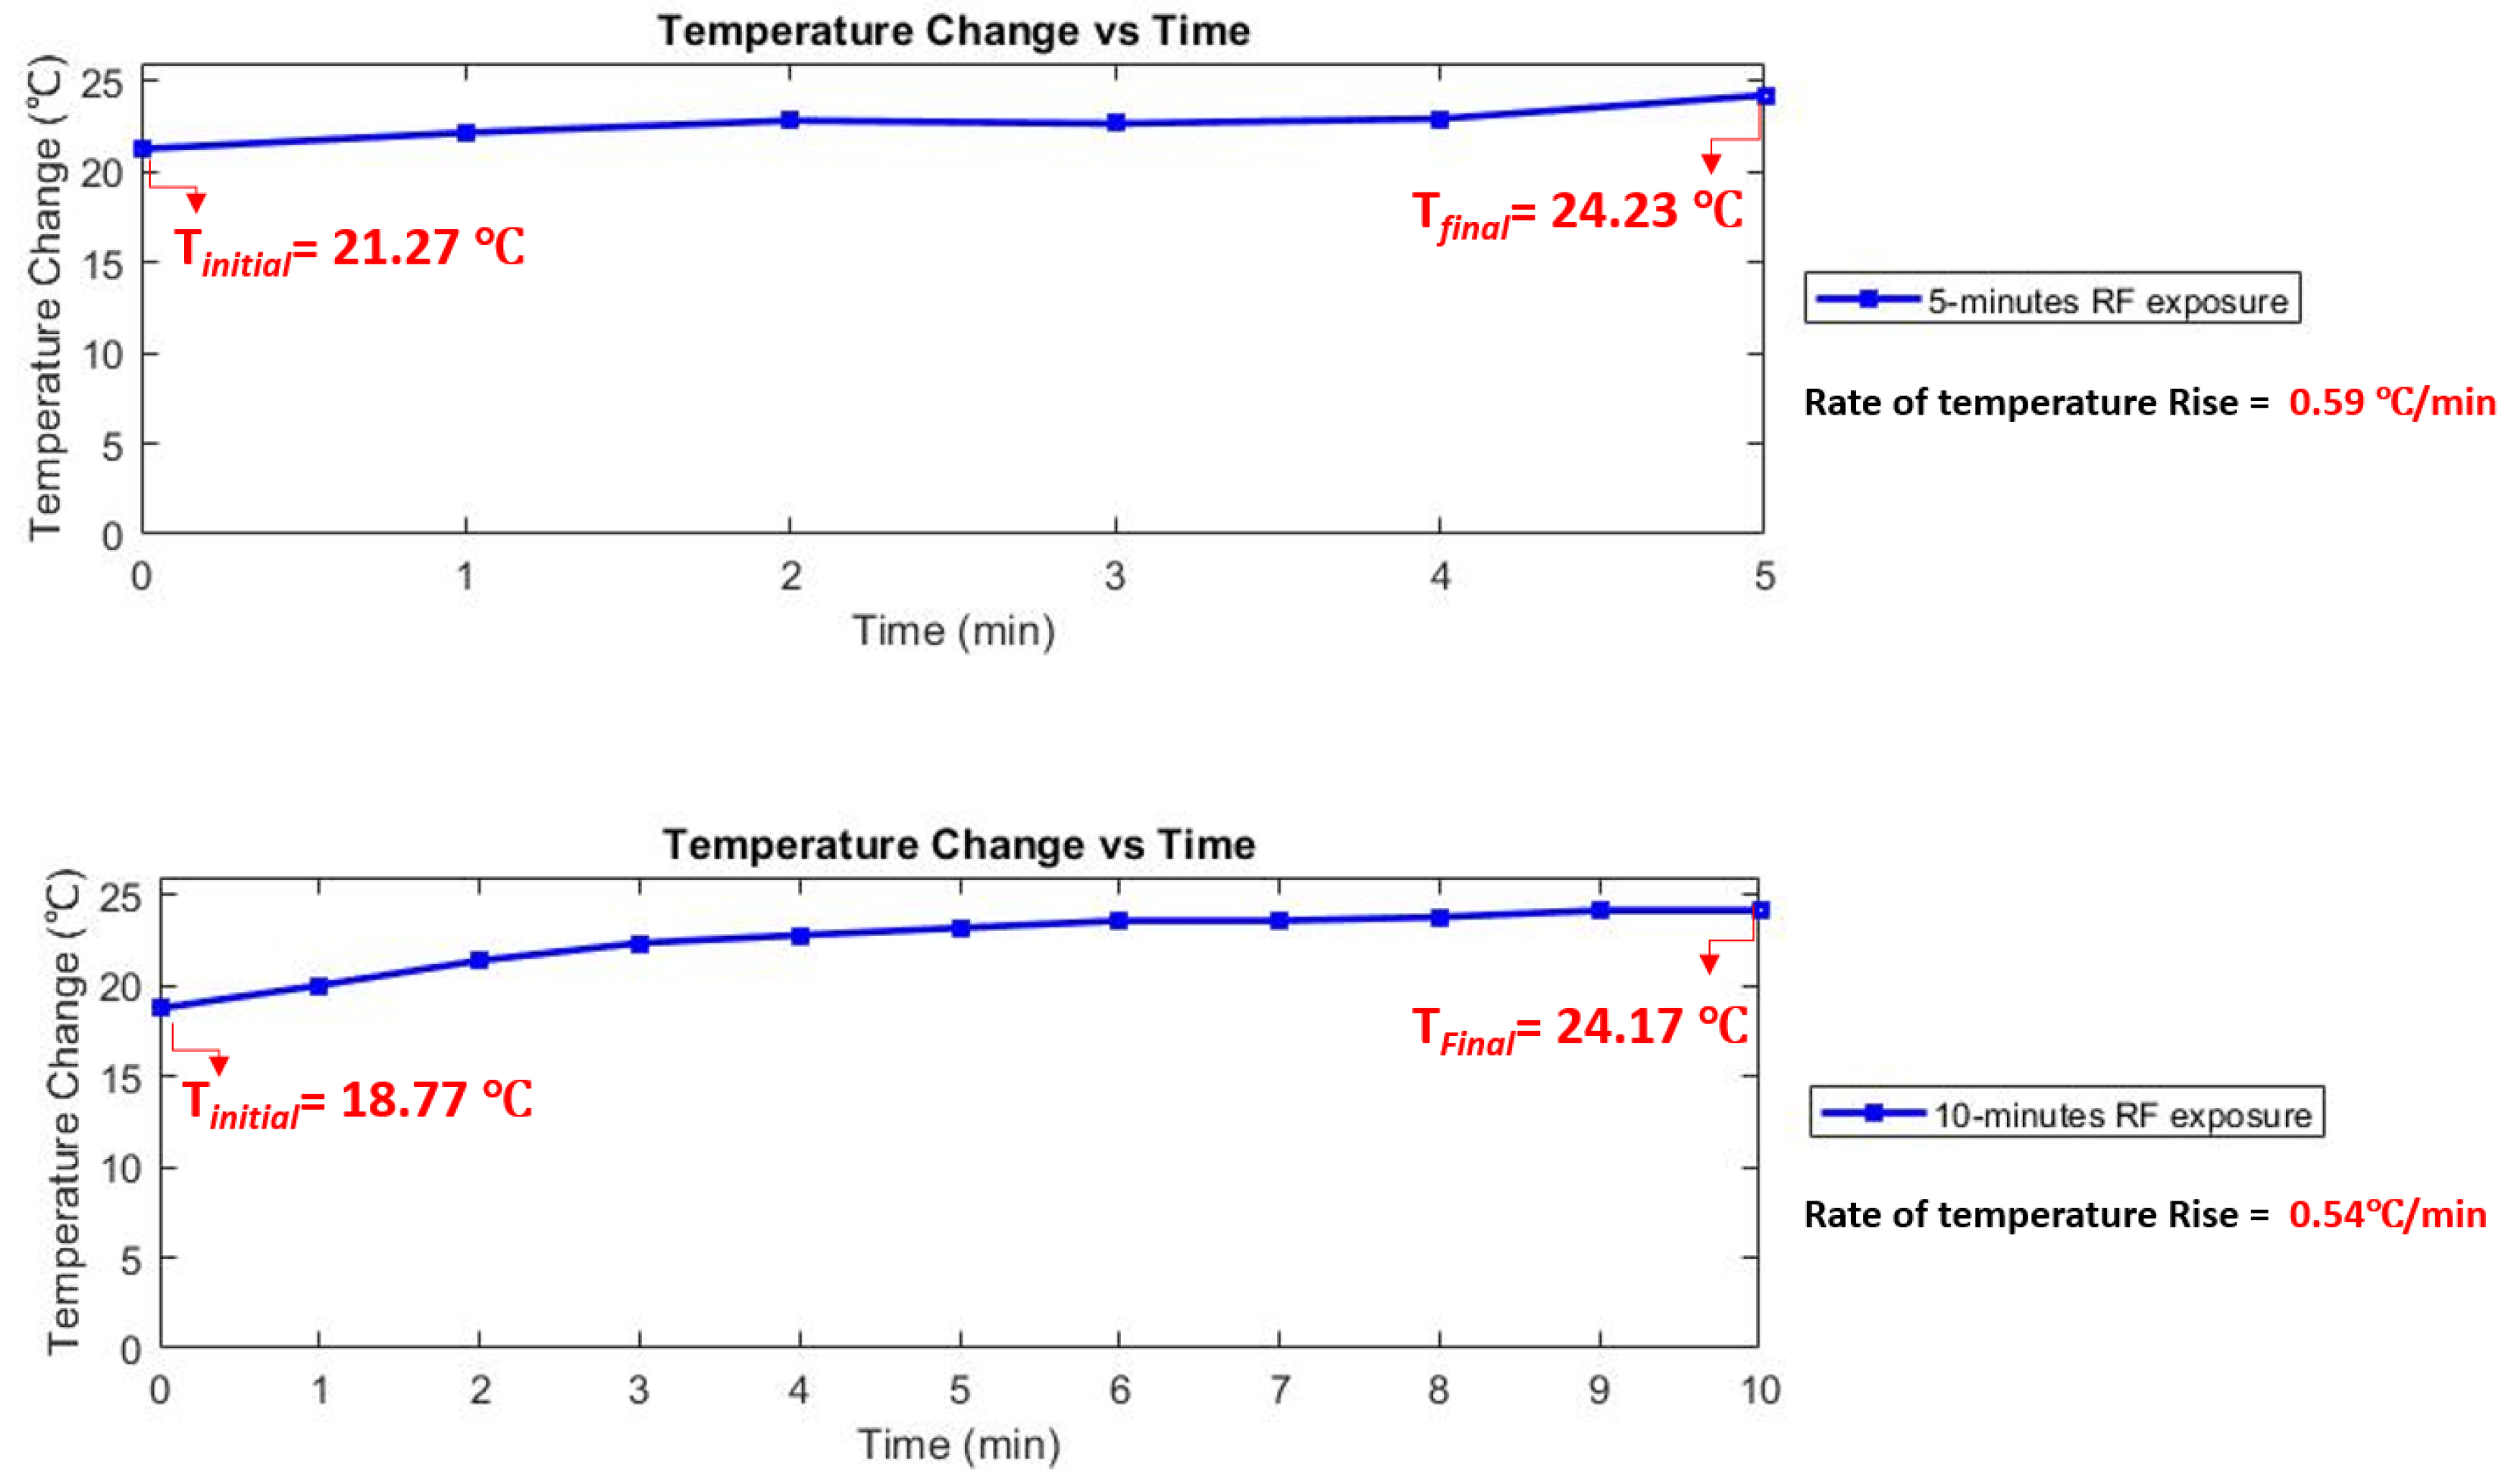
Figure 4.
The temperature response of porcine skin to RF exposure at 26 GHz. The top image illustrates temperature variation after 20 min of exposure, while the bottom image illustrates the variation after 30 min of exposure. Temperature measurements were captured using an IR camera, with three readings per minute averaged to reduce uncertainty. The rate of temperature rise was determined by calculating the slope between the first and last data points.
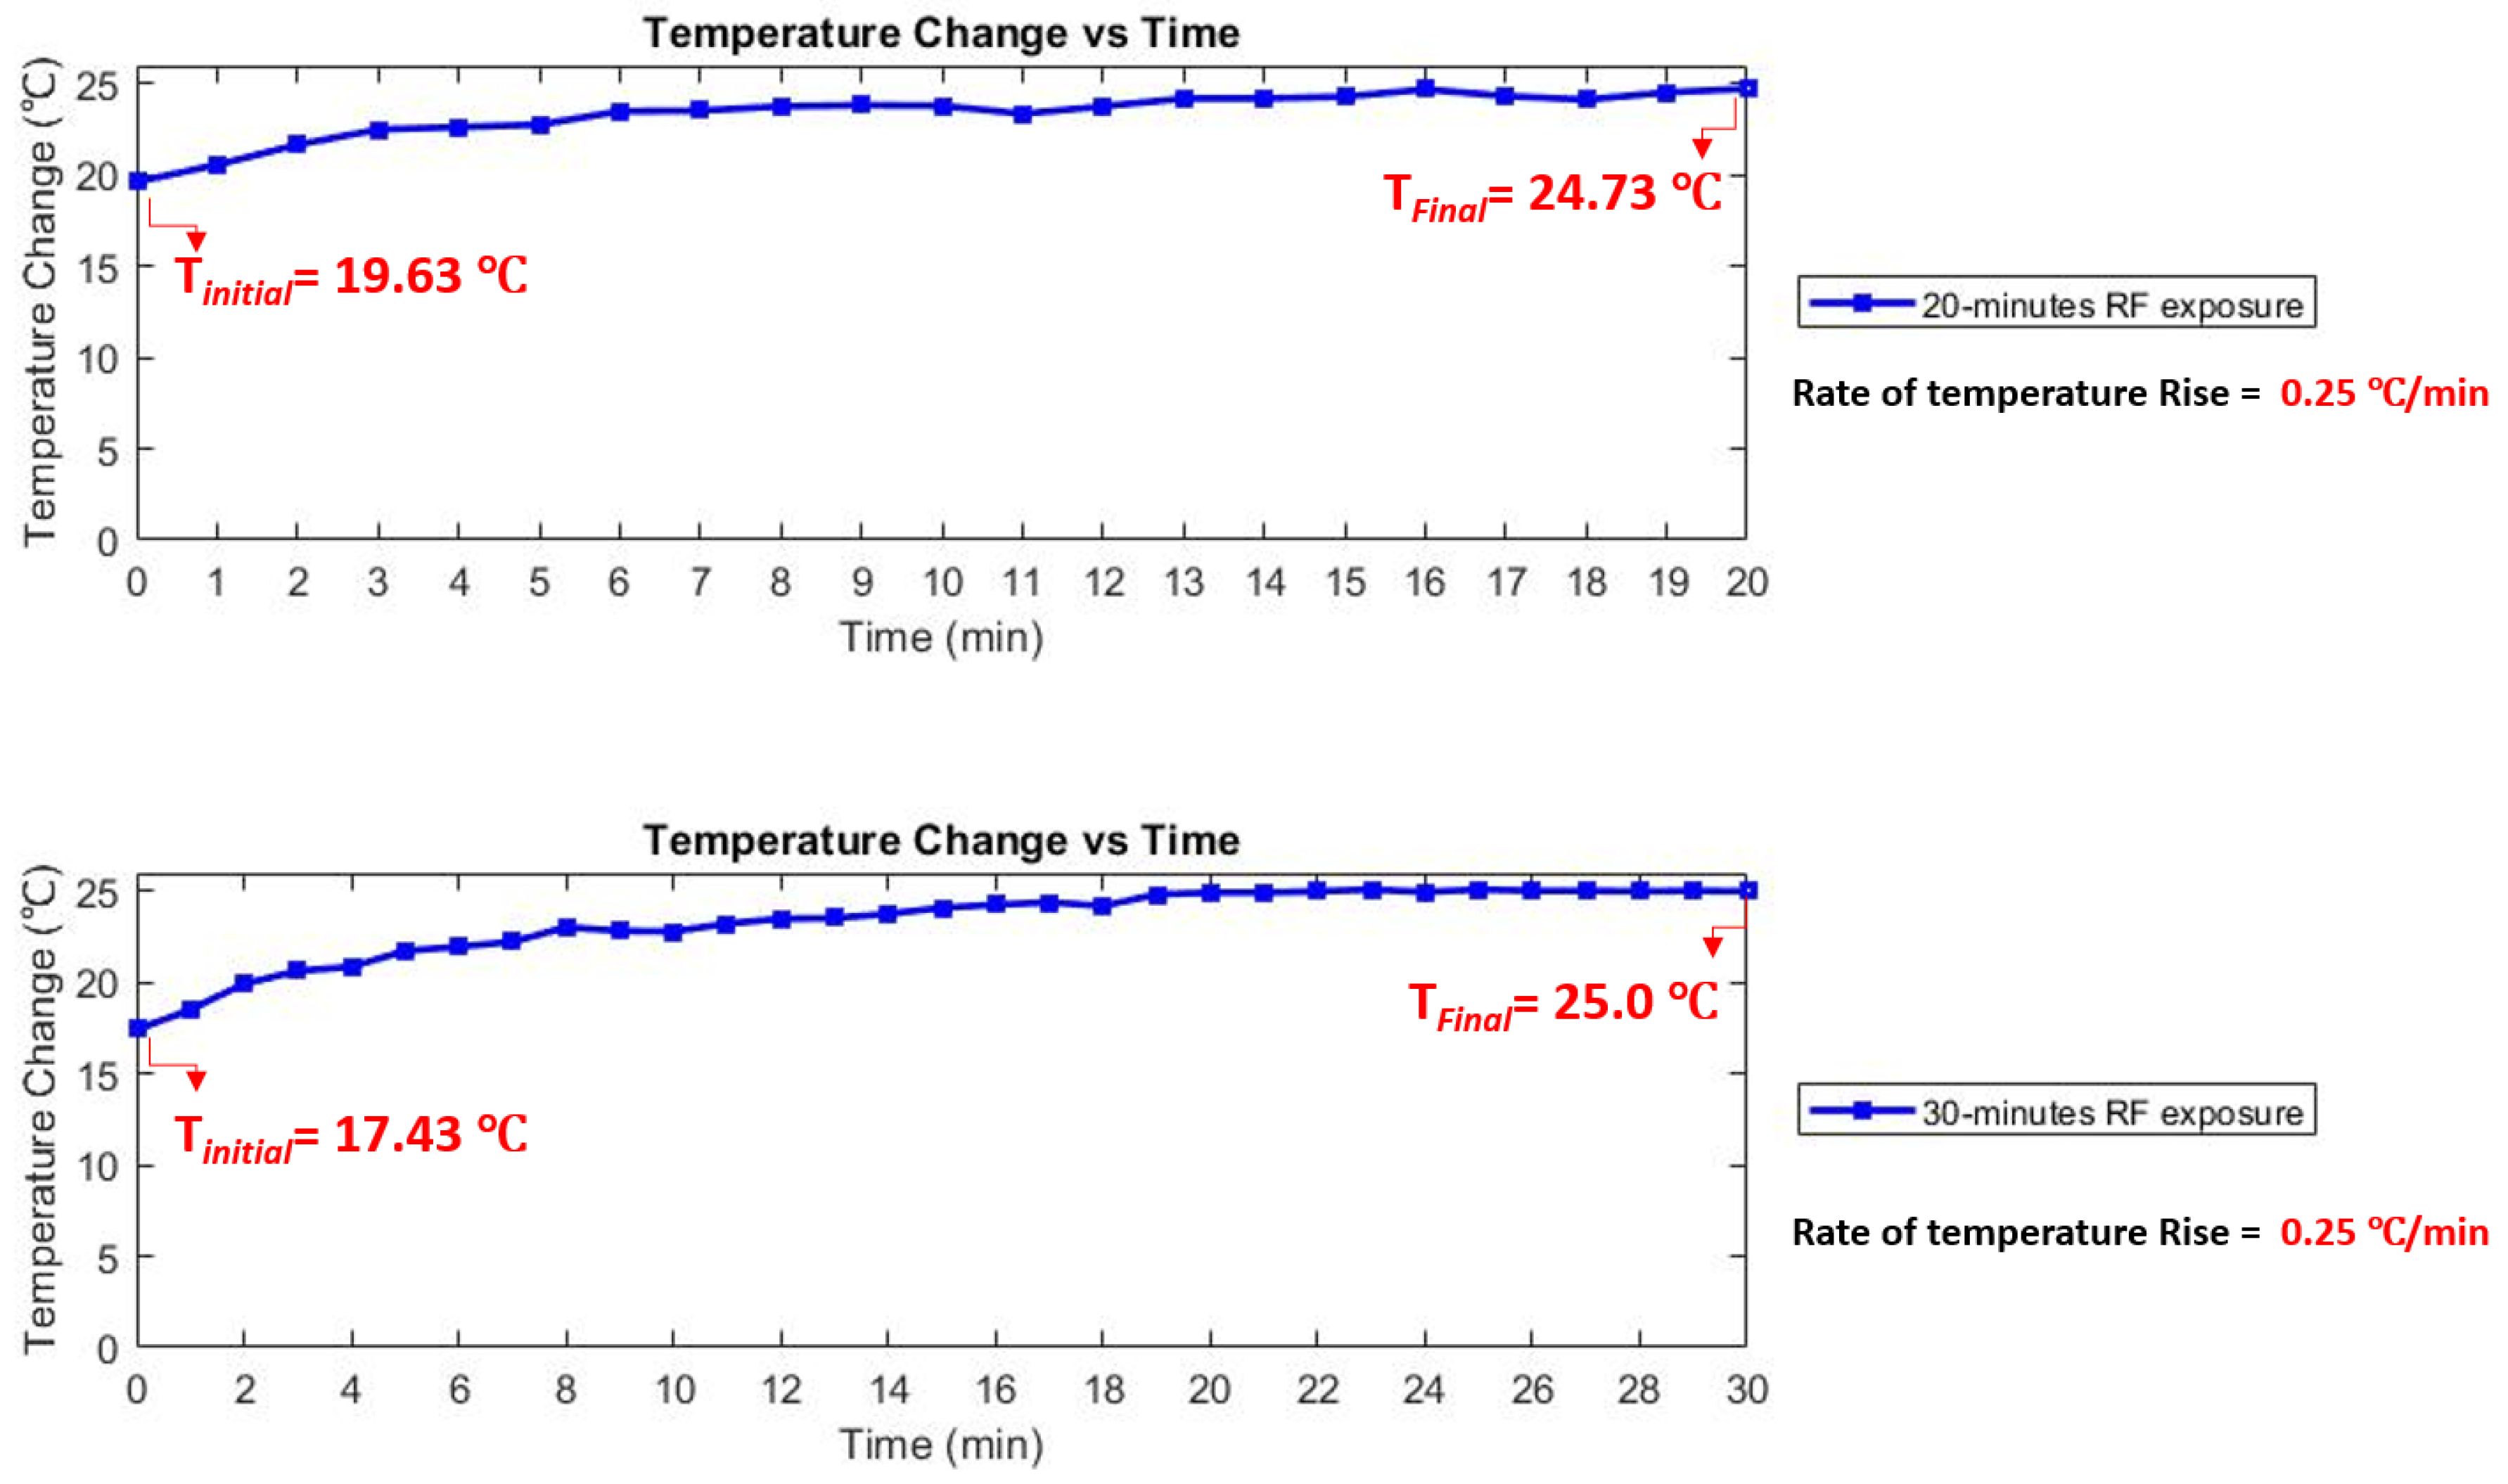
Figure 5.
Phase lifetime of porcine skin. FLIM measurements were used to determine the phase lifetime of porcine skin. Four samples underwent RF exposure for durations of 5, 10, 20, and 30 min alongside a control. Measurements were taken before and after exposure, with the control kept in the lab environment but not exposed to RF. Data points depict mean values (averaged across 6 ROIs), with error bars representing standard deviations.
Disclaimer/Publisher’s Note: The statements, opinions and data contained in all publications are solely those of the individual author(s) and contributor(s) and not of MDPI and/or the editor(s). MDPI and/or the editor(s) disclaim responsibility for any injury to people or property resulting from any ideas, methods, instructions or products referred to in the content. |
© 2024 by the authors. Licensee MDPI, Basel, Switzerland. This article is an open access article distributed under the terms and conditions of the Creative Commons Attribution (CC BY) license (https://creativecommons.org/licenses/by/4.0/).
Share and Cite
MDPI and ACS Style
Foroughimehr, N.; Clayton, A.H.A.; Yavari, A. Exploring Skin Interactions with 5G Millimeter-Wave through Fluorescence Lifetime Imaging Microscopy. Electronics 2024, 13, 1630. https://doi.org/10.3390/electronics13091630
AMA Style
Foroughimehr N, Clayton AHA, Yavari A. Exploring Skin Interactions with 5G Millimeter-Wave through Fluorescence Lifetime Imaging Microscopy. Electronics. 2024; 13(9):1630. https://doi.org/10.3390/electronics13091630
Chicago/Turabian StyleForoughimehr, Negin, Andrew H. A. Clayton, and Ali Yavari. 2024. "Exploring Skin Interactions with 5G Millimeter-Wave through Fluorescence Lifetime Imaging Microscopy" Electronics 13, no. 9: 1630. https://doi.org/10.3390/electronics13091630
Note that from the first issue of 2016, this journal uses article numbers instead of page numbers. See further details here.