

Set-Up for Measuring Thermal Parameters of Power Semiconductor Devices


Department of Marine Electronics, Gdynia Maritime University, Morska 81-87, 81-225 Gdynia, Poland
*
Author to whom correspondence should be addressed.
Electronics 2024, 13(9), 1636; https://doi.org/10.3390/electronics13091636
Submission received: 16 March 2024
/
Revised: 11 April 2024
/
Accepted: 23 April 2024
/
Published: 24 April 2024
(This article belongs to the Special Issue Advances in Modeling, Control and Protection of Power System Containing a High Proportion of Power Electronics)
Abstract
:In order to determine the junction temperature of semiconductor devices operating at different power supply and cooling conditions, their thermal parameters are needed. This article describes an original measurement set-up enabling the determination of thermal parameters of power semiconductor devices. In contrast to other set-ups described in the literature, this set-up makes it possible to measure thermal parameters which characterize the efficiency of the removal generated due to a self-heating phenomenon, as well as the parameters characterizing mutual thermal couplings. The presented set-up makes use of an indirect electrical method to determine the junction temperature of diodes, bipolar and unipolar transistors and IGBTs. The methods used to measure the self and transfer transient thermal impedances of these devices and the construction of the set-up are described. The influence of selected factors on the accuracy of the measurements is analyzed. Examples of the measurement results of thermal parameters (self and transfer transient thermal impedances) of power semiconductor devices operating at different cooling conditions are presented. The obtained research results are discussed.
1. Introduction
An important problem for designers of electronic systems is to limit the value of the junction temperature Tj of the components of these systems during their operation due to the decisive influence of this temperature on the lifetime of these components [1,2,3]. This temperature is higher than the ambient temperature Ta due to thermal phenomena, i.e., self-heating and mutual thermal couplings with the other components [4,5,6,7]. The parameters that characterize the mentioned thermal phenomena are self Zth(t) and transfer Zthm(t) transient thermal impedances [8]. Both the mentioned parameters are used in compact thermal models of electronic networks containing semiconductor devices situated on the common base, e.g., a common PCB, case or heat-sink [6,8,9]. Such a model makes it possible to calculate the junction temperature of each device at known waveforms of the power dissipated in these devices. The waveform of Zth(t) should be measured for each device, whereas Zthm(t) should be measured for each pair of such devices.
Zth(t) and Zthm(t) waveforms depend, among other factors, on the structure of the case of the electronic device, the structure of the cooling system of this device and the power dissipated in them [9]. Meanwhile, manufacturers of electronic components provide information on Zth(t) curves only for selected cooling conditions—most often for the ideal cooling of their case [8,10,11,12]. In order to determine Zth(t) and Zthm(t) waveforms for the established operating conditions of electronic devices, it is necessary to measure these parameters.
The literature presents numerous descriptions of methods for measuring thermal parameters of semiconductor devices [13,14,15,16,17,18,19] and magnetic elements [20]. However, little work concerns practical solutions of the measurement systems enabling the measurement of these parameters. Previous papers [17,21] have described a system for measuring optical and thermal parameters of power LEDs. In [22], the properties of this system were compared with the authors’ system for measuring the thermal parameters of power LEDs. In turn, other papers [23,24] presented systems for measuring thermal parameters of high-frequency transistors. Another paper [25] described a method for measuring self and transfer transient thermal impedances in a system of MOSFETs mounted on a common substrate. Another paper [26] contains a review of the measurement methods making it possible to determine the junction temperature of semiconductor devices. However, the cited papers did not provide any description of the technical solutions used in these measurement systems, focusing only on the concept of their operation.
Some measurement set-ups enabling the practical implementation of indirect electrical methods of thermal resistance of transient thermal impedance of selected semiconductor devices are described in previous papers [9,14,17,21,22,24,25,27,28,29,30]. Other papers [9,25,28] have focused on power MOSFETS. The papers [14,27] present the considerations devoted to a BJT. The papers [17,21,22,29] present measurement set-ups dedicated to power LEDs. The paper [24] presents a set-up used to measure thermal parameters of SiC Schottky diodes. The paper [30] presents a set-up making it possible to measure self and transfer transient thermal impedances occurring in the compact thermal model of an IGBT module.
Each of the mentioned papers described a set-up making it possible to measure the thermal parameters of only one kind of semiconductor devices. Additionally, many of these set-ups do not make it possible to measure transfer transient thermal impedances. In the used indirect electrical measurement methods, nonlinearities of the used thermometric characteristics are neglected.
This paper presents a measurement set-up for determining self and transfer transient thermal impedances of selected power semiconductor devices operating both individually and in systems mounted on a common substrate. This system implements the concept of measuring thermal parameters using indirect electrical methods and takes into account the nonlinearity of the used thermometric characteristics.
Section 2 describes the measurement methods implemented in this set-up. Section 3 presents the structure of this set-up along with a description of its functional blocks. The software controlling the set-up′s operation is described in Section 4. The measurement uncertainty is analyzed in Section 5. Section 6 contains the results of exemplary measurement results of thermal parameters obtained using the presented set-up.
2. Measurement Methods
The thermal parameters considered in this paper occur in the compact thermal model of electronic devices [14,21] and electronic systems [8]. According to the definitions given in these papers, the considered transient thermal impedances are described by the following formulas:
where Tj is the junction temperature of the tested device (hereafter called the heater), which emits a step-shaped power with the value P; Tjk is the junction temperature of the k-th device (hereafter called the sensor), which exceeds the ambient temperature Ta due to the dissipation of power P in the heater. Both the considered parameters are measured when the power is released in only one device—the heater.
The forms of the Equations (1) and (2) are similar. Only one difference can be observed—in the definition of Zth(t), the junction temperature Tj of the heater is used, whereas in the definition of Zthm(t), the junction temperature Tjk of the sensor is used. The waveform Zth(t) characterizes a self-heating phenomenon, whereas the waveform Zthm(t) characterizes mutual thermal couplings between the heater and the sensor. For ideal cooling conditions, both the parameters have a constant value equal to zero.
The power value P is determined based on the values of terminal voltages and currents of the heater. The steady-state values of these quantities are measured using voltmeters and ammeters. The value of the ambient temperature Ta is measured with a thermometer and its value should be constant during the measurement.
The measurement of the junction temperature of these devices is of key importance when measuring thermal parameters of semiconductor devices. An overview of such measurement methods is presented, among others, in previous papers [13,26,27]. The most frequently used is the indirect electrical method, in which the value of the junction temperature of the device is determined based on the measured value of a parameter of this device called the thermosensitive parameter (TSP) [28]. The selection of the appropriate TSP strongly depends on the type of device used. In the case of diodes, the voltage at the forward-biased p-n junction is typically used [13]; for a MOSFET, it may be the on-channel resistance or the threshold voltage [27]. In the case of IGBTs, the threshold voltage is also used as a TSP, but the use of VCEsat voltage is also popular [18].
According to the results presented, e.g., in [19,25,31], the resolution of the junction temperature measurement of semiconductor devices strongly depends on the selection of a TSP. This resolution is limited by the temperature sensitivity of the TSP. For p-n or m-s junctions this sensitivity is typically approximately −2 mV/K, whereas for the threshold voltage of power MOSFETs or IGBTs it is approximately −8 mV/K. For the on-channel resistance of a power MOSFET it is up to 1%/K. In turn, the resolution of the junction temperature measurements limits the accuracy of thermal parameters measurements.
Before performing the actual measurement, it is necessary to calibrate thermometric characteristics, i.e., the dependence of a TSP on temperature T, performed for the case when thermal phenomena are negligible. In practice, the calibration is performed at a low current value of the tested device. It is desirable that the thermometric characteristic is linear [13,14,17,24,27]. Unfortunately, the TSP(T) characteristics obtained in practice often deviate from linearity, which was considered, among others, in a previous paper [31]. The selection of the appropriate function approximating the measurement results ensures the desired accuracy of temperature measurement. By using a quadratic function to approximate the TSP(T) characteristic, it is possible to obtain high accuracy in measuring the junction temperature of a semiconductor device using each of the above-mentioned TSPs [31]. In the presented measurement set-up, the thermometric characteristic is approximated using a formula of the form
where a2, a1 and a0 are the coefficients of the approximating function.
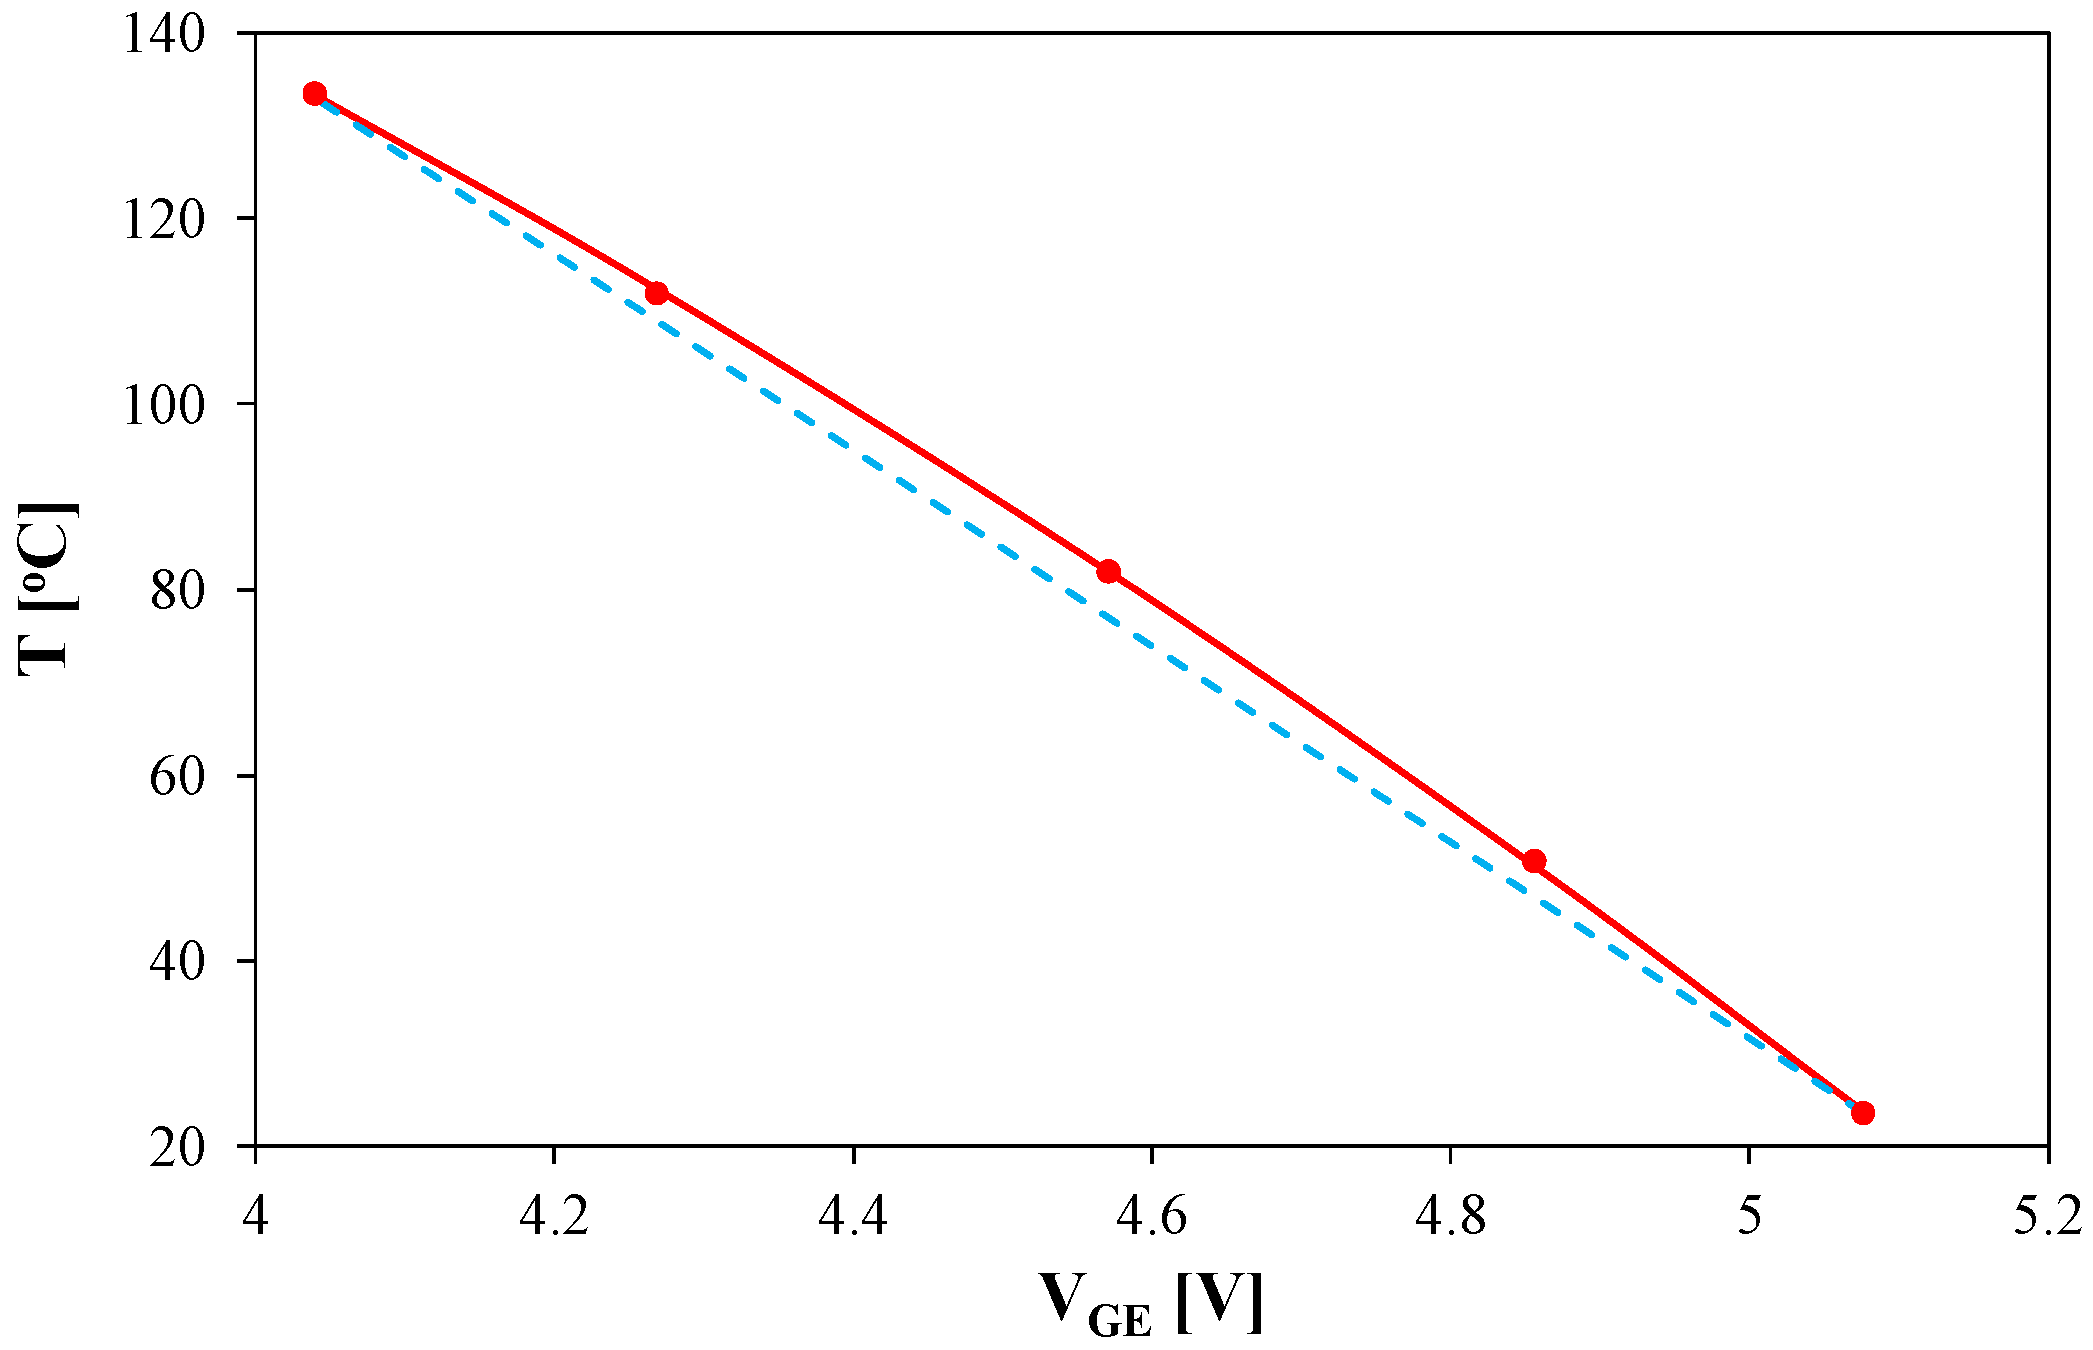
To illustrate the problem of nonlinearity of the dependence TSP(T), the measured (points) and approximated (lines) thermometric characteristics VGE(T) of an IGBT are shown in Figure 1. The characteristic approximated using a quadratic function is denoted with red solid lines, whereas the characteristic obtained using a linear function is denoted with blue dashed lines.
As is visible in Figure 1, the quadratic function very well approximates the results of measurements. In turn, using the linear function, a worse accuracy of the approximation is obtained. The differences between the results of measurements and the approximation even exceed 5 °C. Such an inaccuracy can cause an error in the measurement of the junction temperature in excess of the ambient temperature, equal even to 8%.
In the next step of the measurement, power P of a known value is dissipated in the heater for the time necessary to obtain a thermally steady state, in which the value of the junction temperature of the tested device does not change for at least several minutes. After recording the power P value, there is a sudden change in the power supply conditions of the tested transistor, i.e., the power dissipated in it decreases to a value close to zero and the power supply of the tested device is identical to during the calibration of thermometric characteristics. The moment of switching corresponds to time t = 0. From that moment on, the time course of the value of the thermosensitive parameter TSP(t) is recorded until the heater is fully cooled, i.e., until temperature Tj is practically equal to temperature Ta. If the transfer transient thermal impedance is measured, the waveform of the value of the thermal-sensitive parameter TSP1(t) for the sensor is simultaneously recorded.
Based on the measured TSP(t) and TSP1(t) waveforms and the previously measured TSP(T) and TSP1(T) thermometric characteristics, the waveforms of temperatures Tj(t) and Tjk(t) are calculated. By substituting these waveforms into the Equations (1) and (2), the waveforms Zth(t) and Zthm(t) are determined.
3. Construction of the Developed Measurement Set-Up
The measurement procedure described in the previous section was carried out using a dedicated measurement set-up. Such systems are known from the literature, e.g., [6,17,21,22,23,24,26,29,32]. For example, in [6,21,29,33,34]. a professional set-up for measuring thermal parameters of power LEDs is described. However, its application was limited only to this type of semiconductor devices. Another paper [23] described an original measurement set-up dedicated to measuring optical and thermal parameters of power LEDs. Many other papers have described measurement set-ups enabling the measurement of thermal parameters of semiconductor devices of one type, e.g., BJTs [14], MOSFETs [9] and IGBTs [30]. However, the authors of these papers focused on the measurement concept and not on the construction of the measurement set-up.
The measurement set-ups described in the literature are complete devices, which translates into limiting the permissible values of voltages and currents of the tested devices and an inability to measure transfer transient thermal impedances. The measurement set-up developed in this study is universal, i.e., it enables Zth(t) and Zthm(t) measurements of diodes, BJTs, MOSFETs and IGBTs, as well as modules containing such devices. The open architecture concept and the use of external power supplies makes it possible to update voltages and currents selected from a wide range of the allowable values.
The presented measurement set-up has two independent measurement channels. This makes it possible to simultaneously measure Zth(t) and Zthm(t) waveforms. The first channel is dedicated to measuring self transient thermal impedances of the devices such as diodes, BJTs, MOSFETs and IGBTs. The other channel is for measuring transfer transient thermal impedances and measuring the self transient thermal impedance of a MOSFET or an IGBT transistor, using voltage on the anti-parallel diode or the threshold voltage as a TSP. To facilitate the analysis of the operation of these channels, their diagrams are presented in separate figures (Figure 2 and Figure 3). In these figures, the components of the measurement set-up are located inside yellow rectangles. The components outside these rectangles constitute the external power and the measurement devices.
Figure 2 shows a block diagram of a separate set-up for measuring thermal parameters of a diode and a BJT, while Figure 3 shows a block diagram of a separate set-up for measuring thermal parameters of MOSFETs and IGBTs. In both the measuring set-ups, the tested device is connected to the measuring terminals and marked with the symbol DUT (Device Under Test). The voltage at the forward-biased p-n junction (in both systems) or the voltage between the control or output terminals of the transistor (the set-up in Figure 3) can be used as a TSP. The operation of the measurement set-up is controlled by a PC with the installed software, the block algorithm of which is presented and described in Section 4.
As can be observed, the developed measurement set-up consists of four main blocks. The first one contains the power supply that generates three DC voltages of +5 V, +15 V and −15 V, respectively. These voltages are used to power the remaining blocks of the set-up, i.e., measurement amplifiers and drivers controlling MOSFETs (Metal Oxide Semiconductor Field Effect Transistor) T1, T2 and T3 included in both the polarization blocks. The second block is a set of measurement amplifiers, whose task is to adjust the level of the measured thermal-sensitive voltage to the processing range of the analog inputs of the analog-to-digital converter card. The measurement amplifiers were developed based on the TL081 integrated circuit powered using a symmetrical voltage of ±15 V. These amplifiers have the ability to adjust a voltage gain through step-switched resistors with different resistances included in the application circuit of these amplifiers.
The third block of the measurement set-up is a USB-1608GX-2A0 analog-to-digital sigma-delta (ΣΔ) converter card with a resolution of 16 bit and a maximum sampling frequency of 500 kS/s manufactured by Measurement Computing (Pullman, WA, USA). This measurement card has 16 analog inputs when operating in a single-ended mode or 8 analog inputs when operating in a differential mode. During the tests, the measurement card was configured to operate in the differential mode, which allowed for measurements to be made with a resolution of 0.561 mV for a measurement range of ±1 V.
The fourth block of the discussed measurement set-up comprises the power supply blocks for the tested devices. They contain fully controlled switches in the form of MOSFETs of the IXTH140P10T type [10]. These switches are controlled from the digital outputs of the analog-to-digital converter card used through dedicated driver systems.
In the set-up in Figure 2, the IMD current source produces a small measurement current that flows through the tested device during the calibration and while recording the waveform of the TSP, which is the voltage between terminals A and K. The value of the heating current ID is regulated by selecting the voltage on the voltage source UD and the resistance of resistor RD. When heating, T3 transistor is turned off, and during the calibration and while recording the TSP value this transistor is turned on. A voltmeter and an ammeter are used to measure the current and voltage across the diode under test at the end of the heating process. In the case where the measured device is a BJT, the collector of this device is connected to terminal C, and the voltage source Ucc is used to establish the voltage value between the collector and the emitter during the heating process of the device under test.
In turn, in the set-up shown in Figure 3, the polarization block 2 is used to polarize the tested voltage-controlled power transistor. The DUT is connected between the terminals marked with the letters D, G and S. Capacitors C1 and C2, connected in parallel to the pairs of the terminals of the tested transistor, are used to suppress voltage oscillations that appear shortly after switching off the power supply. If the TSP is the transistor threshold voltage, the measurement current is determined by the IM2 current source. When heating the tested transistor, the value of the drain (or collector) current is determined by selecting the value of the voltage source −USS and resistor RS, while the voltage at the drain (collector) is determined by the voltage source UDD. When heating the DUT, transistor T2 is turned off, and during the calibration and DUT cooling, transistor T2 is turned on. In turn, transistor T1 is turned on in all the stages of the measurement.
If the voltage between the drain and the source (collector and emitter) is used as a TSP, the measurement current is determined by the IM1 current source. When heating, the tested transistor is powered in the same way as when using the second of the considered TSPs. In turn, during the calibration and registration of the waveform of the TSP, transistor T1 is turned off and transistor T2 is turned on.
Comparing the diagrams shown in Figure 2 and Figure 3, some differences can be observed. The set-up visible in Figure 2 makes it possible to measure thermal resistance using the forward voltage of a p-n junction of the diode or the BJT as a TSP. It is also possible to measure the thermal parameters of the MOSFET and the IGBT using the threshold voltage as a TSP. The set-up shown in Figure 3 is dedicated to measuring the thermal parameters of MOSFETs and IGBTs using as a TSP the forward voltage of the antiparallel diode or the input voltage (VGS or VGE) of the mentioned transistors.
Figure 4 shows a view of the front panel of the developed measurement set-up. Three terminal blocks are visible. On the left side there are terminals of the internal power supply with an LED indicating the overload condition. The middle block and the block located on the right side of the device are dedicated to measurements of self (middle) and transfer (right) transient thermal impedances. Both the blocks contain terminals for connecting test devices, resistances in the circuit (RD, RC, RS) and the necessary power supplies (VDD, VCC and VSS) and measuring devices (ID, IS, VD, VDG, VSG). Terminals IMD, IM1 and IM2 are used to connect an external measuring current source.
Figure 5 shows a view of the inside of the housing of the developed measurement set-up. This figure shows the location of the individual functional blocks of this system. It is worth noting that all the power transistors are placed on a large heat-sink. The semiconductor devices used enable the tested semiconductor devices to operate with a current of up to 20 A and a voltage between the output terminals of the tested device of up to 100 V.
Figure 6 shows a view of the measurement station containing the described measurement set-up with the necessary external polarizing sources and resistors limiting the current in the power circuits. The presented set-up is connected into a system for measuring transient thermal impedance of a power LED. This diode is placed inside the light-tight chamber visible on the right side of the figure. During this measurement, the power of optical radiation emitted by the tested device is simultaneously measured.
4. Controlling Software
The operation of the described measurement set-up is controlled by the original MEASURE software written in Python. This software uses the libraries of this language and implements the algorithm whose block diagram is shown in Figure 7.
The calibration process is not supervised by the developed software. Only the values of the coefficients a2, a1 and a0 of the function approximating the thermometric characteristics are determined in the MEASURE software. It also controls the process of generating signals that control transistors contained in the polarization blocks. When heating, the waveforms of thermosensitive parameters are not recorded. After achieving a thermally steady state, the transistors are switched off and the waveforms of the TSP are recorded until a thermally steady state is obtained. It is detected if, during 2 min, the changes in the value of the TSP do not exceed a double value of the resolution of the used measurement card module.
In order to limit the amount of saved data and reduce the size of the resulting file, the presented algorithm was divided into two sections. The first section is responsible for measuring the TSP in the initial phase of the cooling process, i.e., for time t below 1 s. The other section of this algorithm measures it for times longer than 1 s until a thermally steady state is reached. The value of the thermosensitive parameter is recorded with a variable time step, i.e., x samples are measured with a fixed time-step value. Then the step value is increased ten-fold and other x samples are recorded. This cycle is repeated until the recording time t exceeds 1 s. For the times exceeding 1 s, the measurement step is set by the user and the measurement is performed in the time interval from 1 s to 100 s with a step of 1 s, in the range from 100 s to 1000 s in steps of 10 s and in the time interval above 1000 s in steps of 100 s. The measurements are carried out until a thermally steady state is reached, when the values of the TSP recorded within 300 s do not differ from each other by more than the set value threshold.
For time t < 1 s, the measurement data are saved in a specially prepared hardware buffer, after which the data are filed and sent to a temporary database. After setting the measurement data ranges, the digital outputs of the measurement card used are set, and the measurement currents IMD, IM1 or IM2 flow through the DUT, small enough not to cause an increase in the junction temperature of the DUTs. After starting the measurements, the states of the digital outputs change and the DUT is polarized with the heating current set by the user.
The results obtained in each time interval are saved in the temporary database, and then at the end of recording all the data are saved to a text file with the *.csv extension. This file contains columns of numbers containing the values of time t, TSP and TSP1.
Based on the recorded TSP waveforms, the previously determined values of the function coefficients approximating the thermometric characteristics and the measured values of heating currents and voltages immediately before the end of the cooling stage, the waveforms of the junction temperature of the tested devices and the waveforms of Zth(t) and possibly Zthm(t) are calculated.
Using the ESTYM program described in [8], it is possible to determine the parameters describing the Zth(t) and Zthm(t) waveforms, the network representation of the compact thermal model in the form of a Cauer or Foster network and the structure function. They enable the practical use of the obtained measurement results in a thermal analysis of electronic systems containing the measured devices.
5. Measurement Uncertainty Analysis
In order to estimate the usefulness of the measurement methods and the elaborated measurement set-up, the measurement error was analyzed. The analyses were performed at the steady-state, this means for a thermal resistance Rth equal to the value of transient thermal impedance at the steady state. In compliance with the classical theory of measurement error, two components of this error can be distinguished [35]. The first one results from inaccuracies of the instruments used to measure the values of quantities occurring in Formulas (1) and (2). In turn, the other component of the error results from non-performances of the foundations of the measuring method.
The measuring error of thermal resistance for all the considered measuring methods can be estimated using the method of the complete differential with reference to Equation (1). As a result, one obtains the following formula describing the relative error of the Rth measurement:
where ΔTj, ΔTa and ΔP denote the absolute errors of the measurement of temperatures Tj and Ta and the heating power P.
From the dependence (4), it is visible that at the fixed accuracy of the measurement of the mentioned quantities, the measuring error of Rth is a decreasing function of both the power and the difference in temperature between Tj and Ta. The value of the power dissipated in the semiconductor device is determined using the measured values of terminal voltages and currents of the device. The relative error of the measurement of the power ΔP/P with the use of typical laboratory multimeters and the correct selection of the measuring ranges does not exceed 0.1% [35]. In turn, the absolute error of the ambient temperature ΔTa with the use of the thermometer typically does not exceed 0.5 °C.
The error of the measurement of the junction temperature ΔTj depends on the applied measuring method. For the indirect electric method, this error is given by the following formula:
where ΔTSP means the absolute error of delimitation of the value of the thermally sensitive parameter, while Δa2, Δa1 and Δa0 are the errors of the estimation of parameters describing the thermometric characteristic. Equation (5) is obtained as a result of the use of a complete differential method regarding formula (3). For the used measurement card ΔTSP ≤ 1 mV, whereas at the correct selection of the value of the measuring current, to assure the proper thermometric characteristic of a TSP(T) over a wide range of temperature, the relative errors Δa2/a2, Δa1/a1 and Δa0/a0 do not exceed 1%. At the fixed value of ΔTSP, the value of ΔTj can be limited by the use of a TSP characterized by high temperature sensitivity. For example, for a power MOSFET it is more useful to use VGS voltage instead of the body diode forward voltage as a TSP. Typically, the temperature sensitivity for the mentioned TSPs differs between each other even by five-fold [25].
The error ΔTjt of the measurement of the value Tj connected with the time interval t1 between the switch-off of the impulse of the power and a moment of measuring the TSP depends on the cooling conditions of the tested device characterized by its thermal resistance Rth, the shortest thermal time constant τth1 and the weight-coefficient ath1 [4,36]. This can be estimated using the following formula [35]:
For the used measurement card and typical power semiconductor devices operating with the dissipated power sufficient to obtain the values of difference between Tj and Ta, approximately 80 °C, the measurement error of Rth does not exceed 5%. Of course, such an error is higher for lower values of the dissipated power and lower values of the difference between Tj and Ta.
It is clear that the measurement error of the used ammeters and voltmeters also influences the value of the measurement error of the dissipated power and thermal resistance. However, for properly selected instruments and their measurement range, typically the relative error of voltage and current measurements is below 0.1%. This means that this component of the measurement error of thermal resistance can be neglected, because it is much lower than the error caused by a non-accurate measurement of the junction temperature.
6. Sample Measurement Results
The measurement set-up described in this paper was used to measure the thermal parameters of many power semiconductor devices. The measurements of both discrete devices and power modules containing at least two semiconductor chips in one case were performed. Some of the obtained measurements are presented in this section.
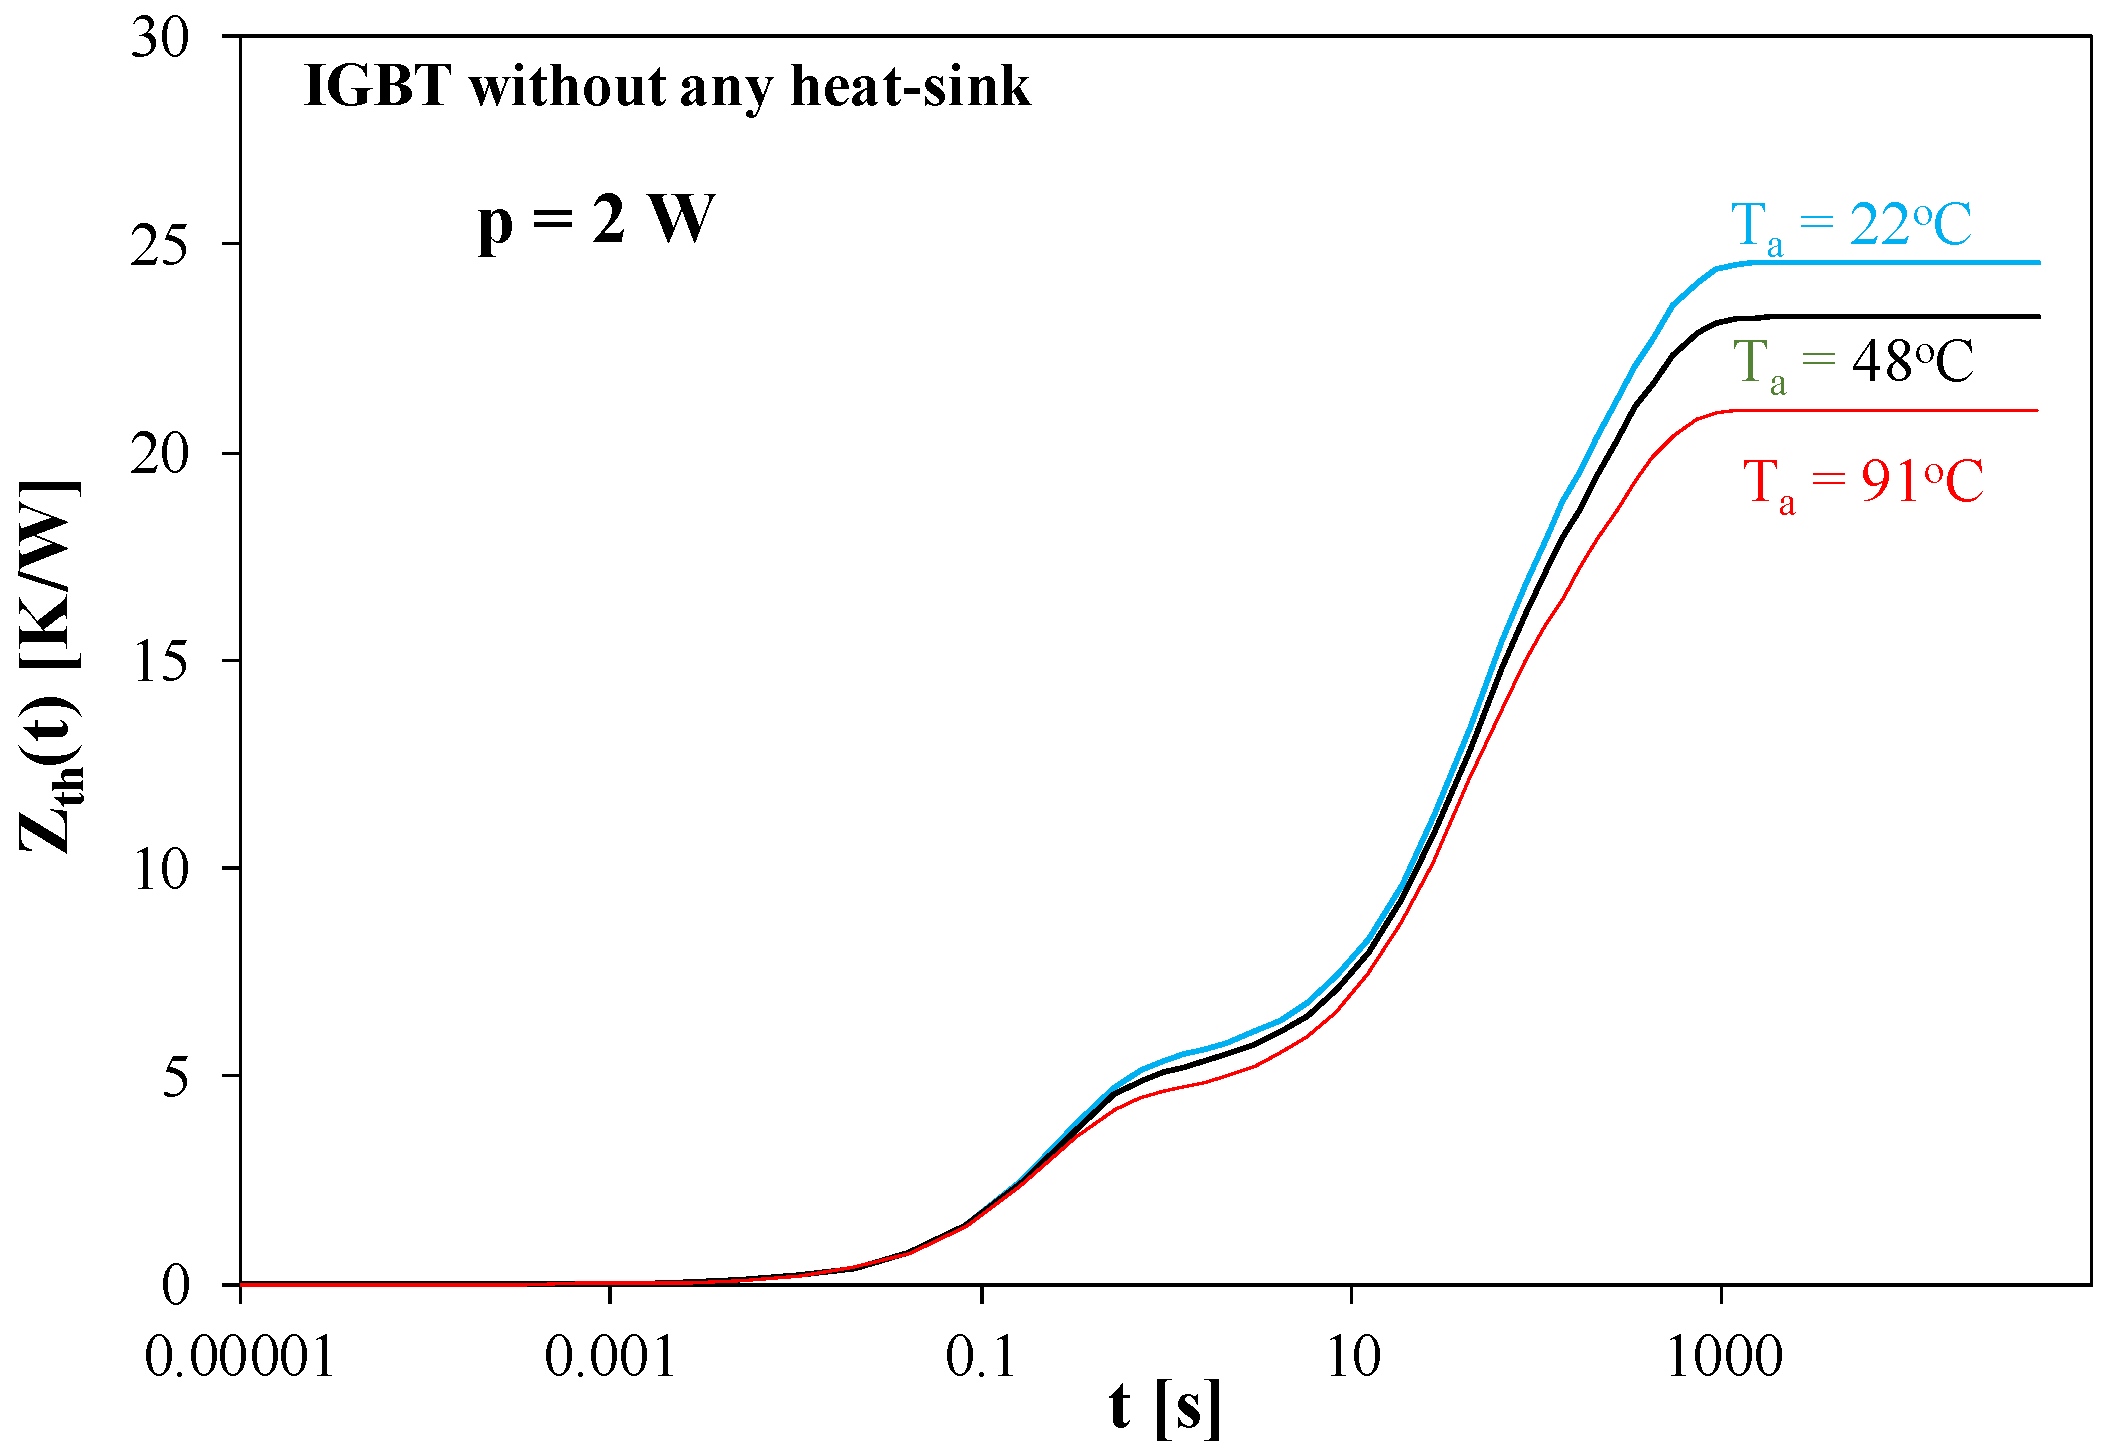
Figure 8 shows the measured waveforms Zth(t) of the IRG4PC40UD type IGBT operating without a heat-sink. The measurements were performed for selected ambient temperature values with a power dissipation of 2 W.
As can be seen, the Zth(t) waveforms show significant differences for the times above 10 s. An increase in the ambient temperature causes a decrease in the thermal resistance value. The change in the Rth value reaches as much as 15% when the ambient temperature increases from 22 to 91 °C. Observing the measured waveforms of Zth(t), it can be seen that the values of this parameter are significantly higher than zero for times t > 0.01 s, and the thermally steady state is obtained for the times t > 1000 s. It is also worth noticing that a change in the value of the ambient temperature does not visibly change the value of the time indispensable to obtain a steady state. When the transistor operates without any heat-sink, the efficiency of heat convection on the surface of the transistor case has a decisive influence on the value of thermal resistance.
Figure 9 illustrates the influence of the power dissipated in the transistor on the Zth(t) waveform for the same transistor operating on a heat-sink connected to a liquid cooling system (cold plate).
As can be seen, the cooling system used ensures a highly effective heat removal from the case of the tested transistor. The value of the power dissipated in the range from 32 to 91 W has practically no impact on the measurement result obtained at the steady state. However, an increase in the transient thermal impedance value for the times below 1 s with an increase in the power dissipation is visible, which was caused by a decrease in the thermal conductivity of silicon (from which the transistor is made) with an increase in temperatures [37,38]. Compared with the results presented in Figure 8, it can be seen that the use of liquid cooling allowed the thermal resistance value to be reduced by as much as 16 times. It is also visible that the thermally steady state already occurs after 100 s. Changes in the value of the dissipated power do not cause visible changes in the value of the time indispensable to obtain a thermally steady state. According to the datasheet [39], the value of the thermal resistance junction case is not higher than 0.77 K/W. In the presented case, the thermal properties of the transistor case and the thermal interface between the transistor case and the cold plate have a decisive influence on the measured Zth(t) waveform, particularly its values at the steady state.
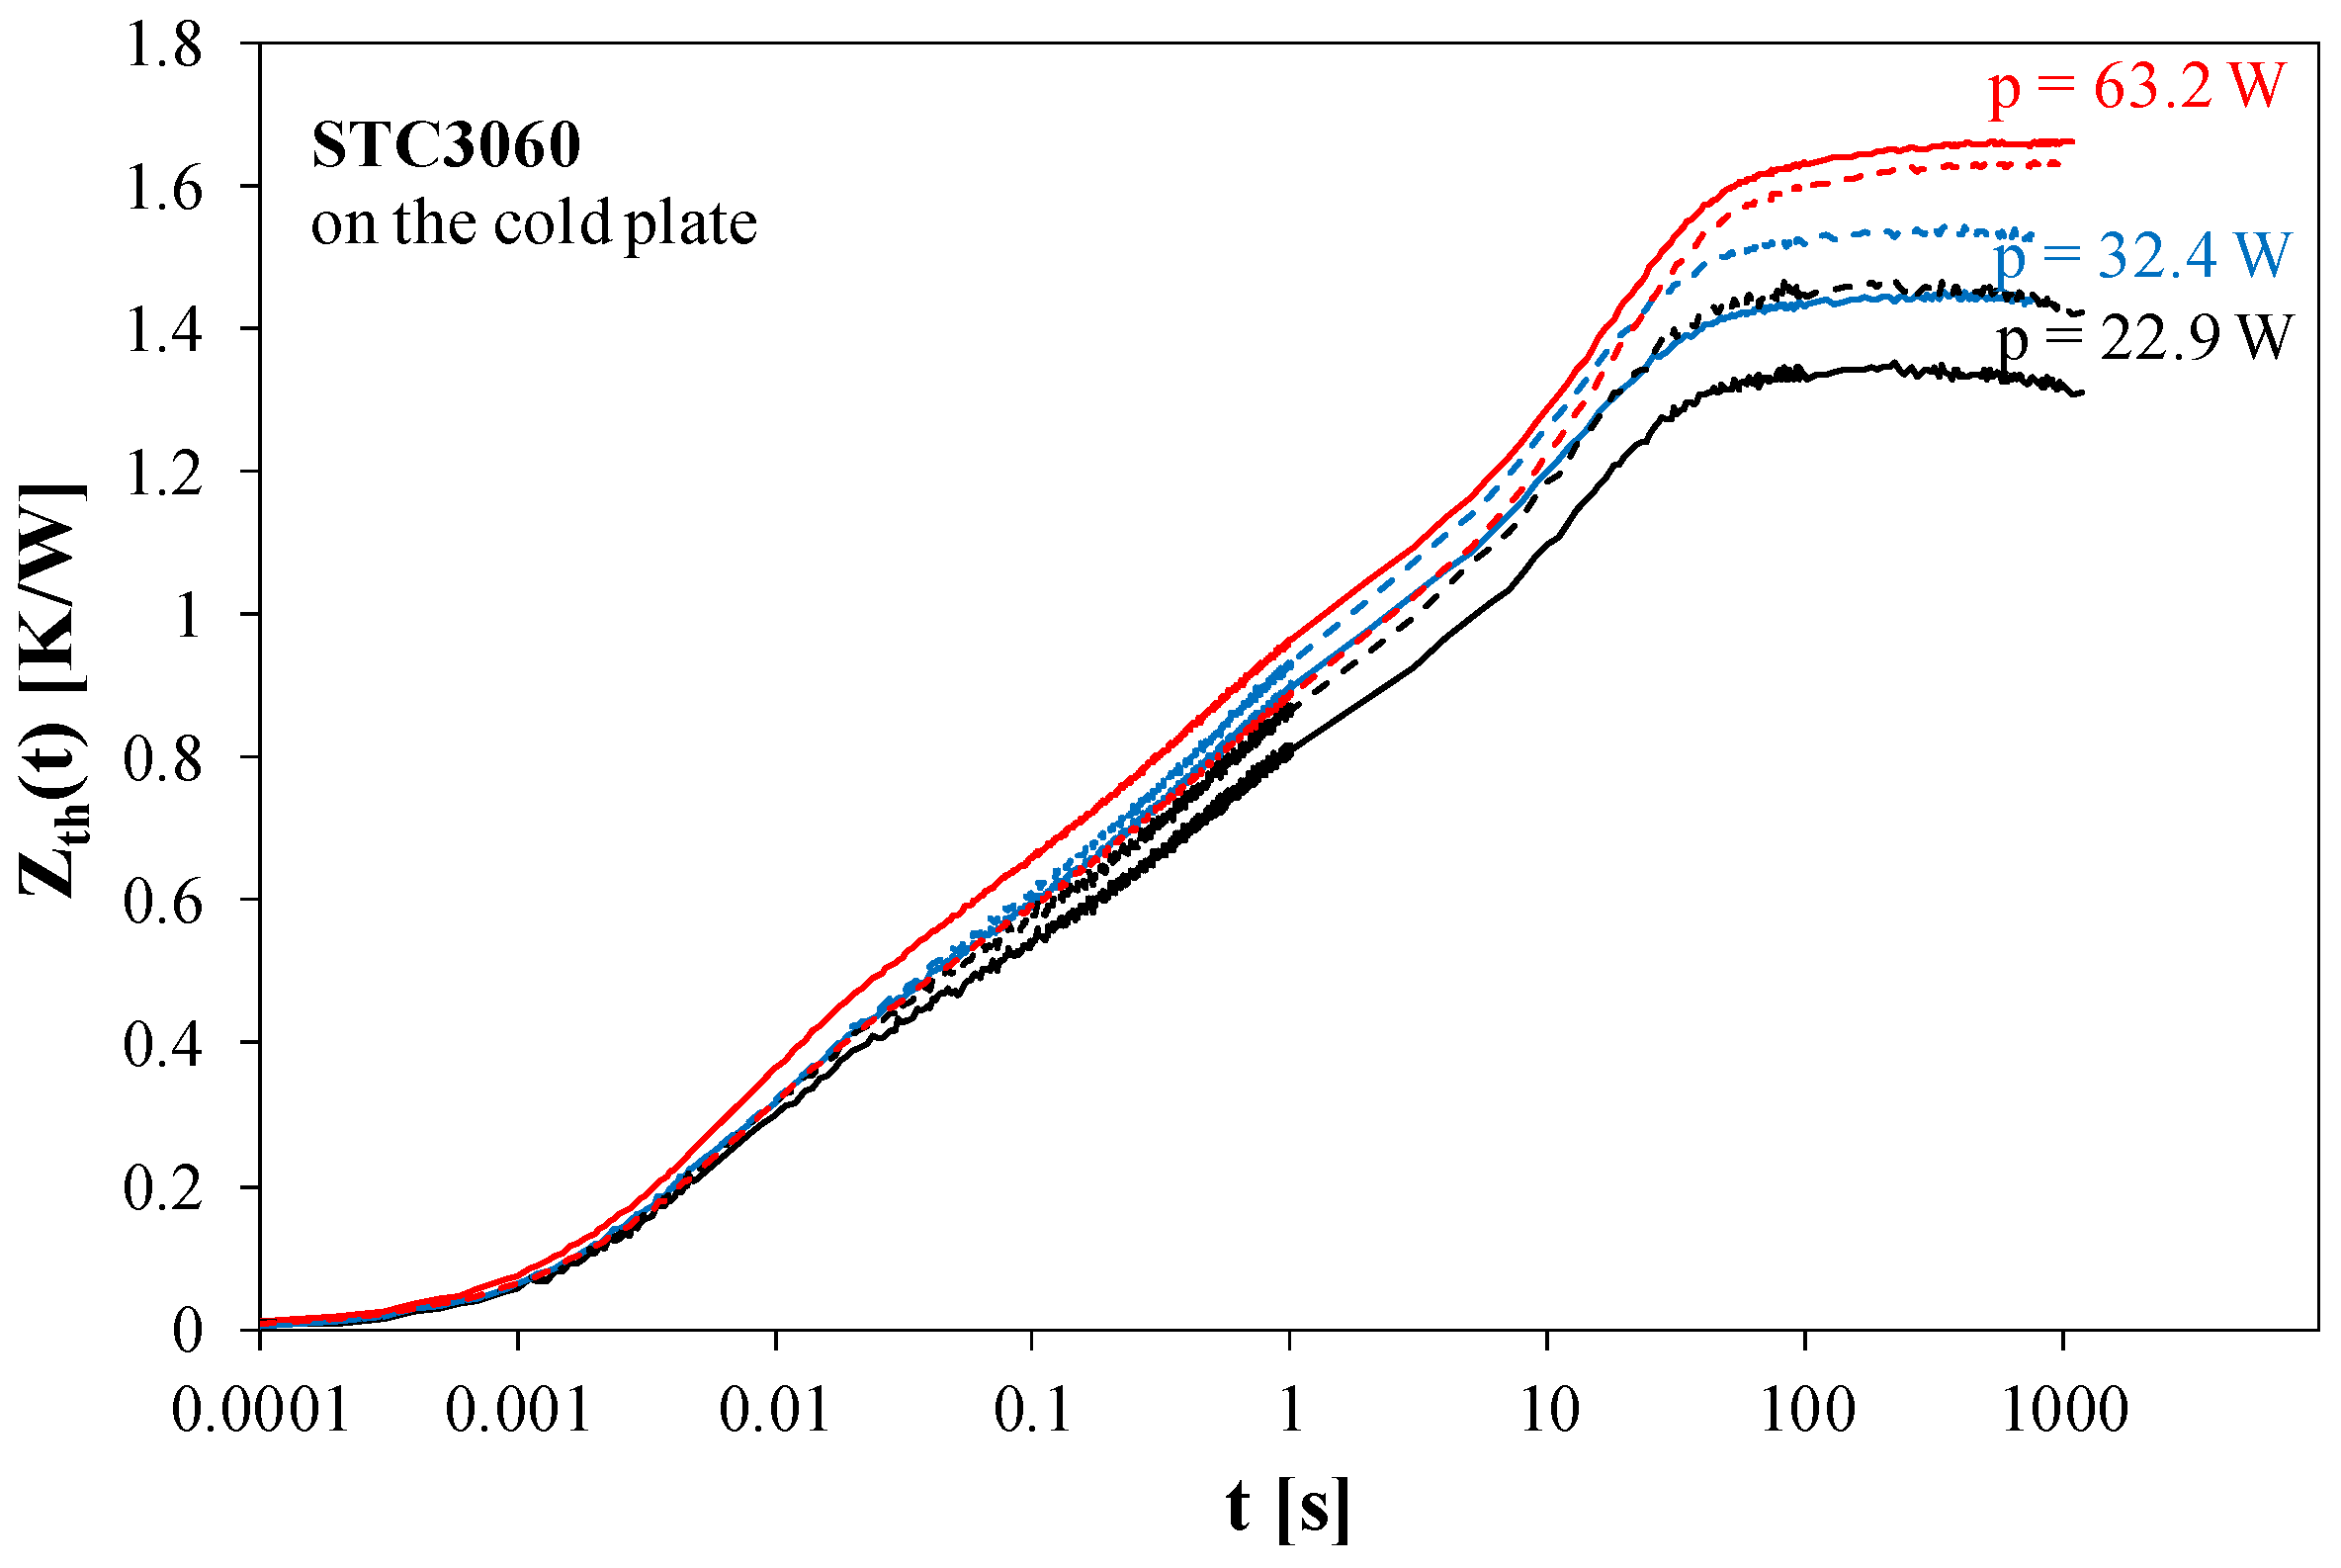
Figure 10 illustrates the influence of the power dissipated in the STC3060 SiC MOSFET on the Zth(t) waveform. The measurements were made for the transistor placed on a finned heat-sink 165 × 80 × 32 mm3 with an insulating pad. The ripples visible in the measured waveforms at low values of time are a result of the limited resolution of the used measurement card module.
The presented measurement results prove that an increase in the value of the power dissipated in the transistor causes a decrease in the value of thermal resistance. Within the considered range of power changes, the Rth value decreases by as much as 15%. It is also visible that the thermally steady state occurs more than 10,000 s after the measurement begins. This is related to the high value of the thermal time constant characterizing heat convection on the heat-sink surface. It is worth paying attention to the fact that with an effective cooling system, changes in the Zth(t) waveforms are visible already after a time of a fraction of ms. This is characteristic for transistors made of silicon carbide [7,40].
Figure 11 illustrates the influence of the power dissipated in a SiC MOSFET on the Zth(t) waveform of this transistor mounted on a cold plate for liquid cooling. Additionally, in order to illustrate an influence of the selection of a function approximating thermometric characteristics on the obtained measurement results, in this figure solid lines denote the results obtained with the use of a linear function approximating T(TSP) characteristics, whereas dashed lines represent a quadratic function approximating these characteristics.
As can be observed in the case under consideration, an increase in the power value results in a deterioration of the cooling efficiency, i.e., an increase in the thermal resistance Rth value. Within the considered range of power changes, the Rth value changes by as much as 25%. Under these cooling conditions, a decrease in the thermal conductivity of materials with increasing temperature is particularly significant. Compared with a classic heat-sink (Figure 9), a cold plate allows the thermal resistance to be reduced by up to 2.5 times. At the same time, for the liquid cooling system, even a 100-fold reduction in the time necessary to achieve a thermally steady state is observed.
For a linear approximating function the dependence T(TSP) causes an underestimation of the measured waveform of Zth(t) in the range of low values of the dissipated power, whereas for high values of the dissipated power such approximation causes an overestimation of this waveform. The observed difference between the obtained values of Zth(t) at the steady state are up to 6%.
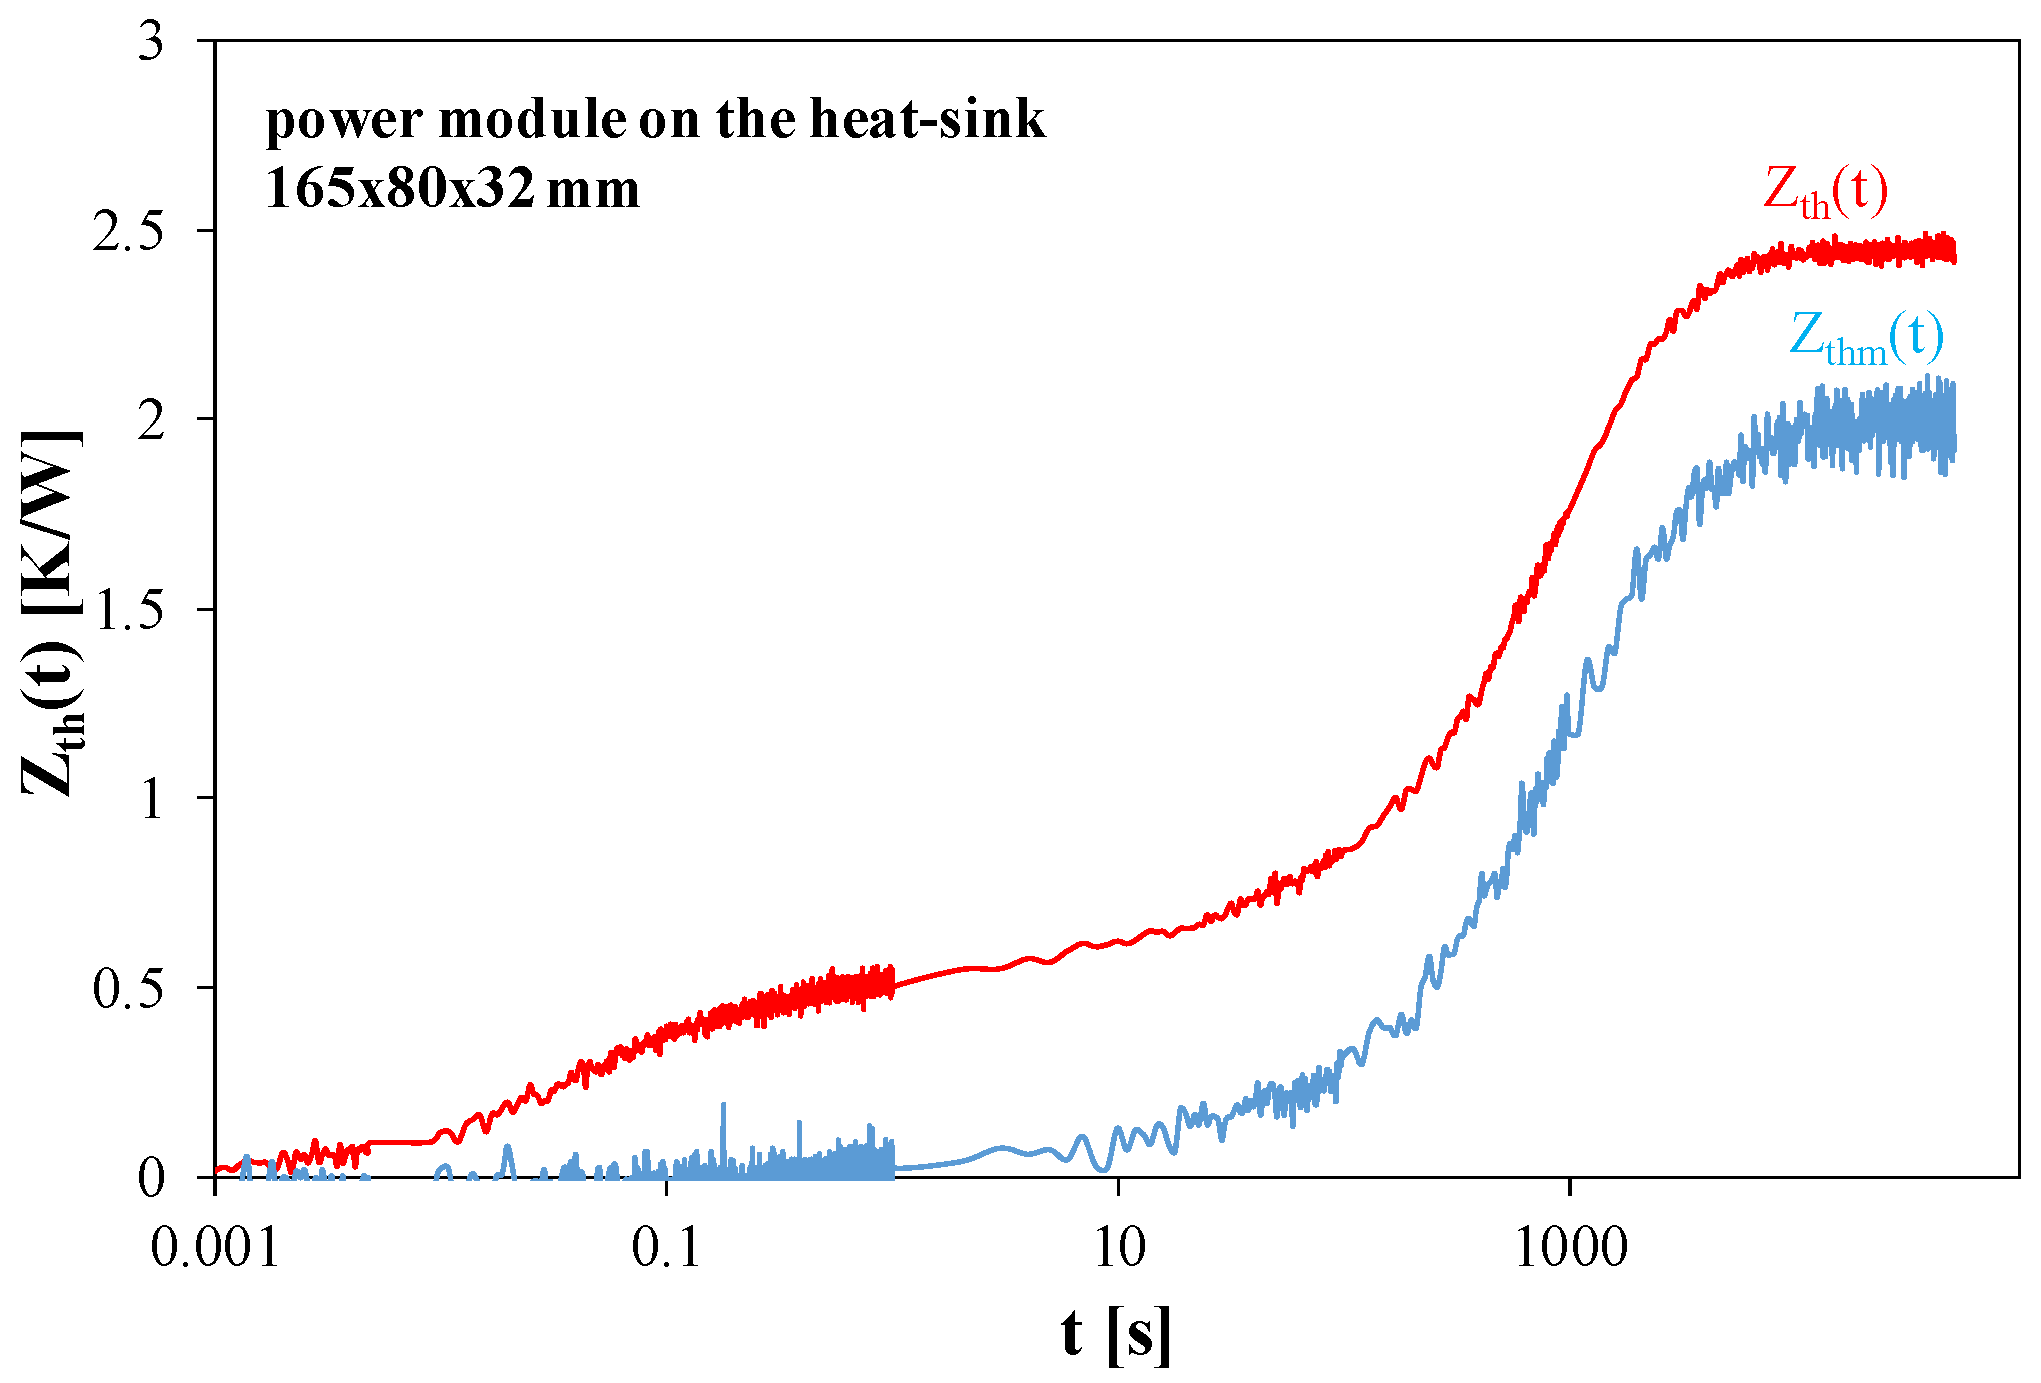
Figure 12 illustrates the relationship between the transient thermal impedance Zth(t) of the transistor placed in the FF50R12RT4 power module and the mutual transient thermal impedance Zthm(t) between the transistor and the diode contained in this module. During the measurements, the tested module was placed on a heat-sink of the dimensions 165 × 80 × 32 mm3.
As you can see, the heat sink used ensures the effective dissipation of the heat dissipated in the tested module. The Zth(t) waveform begins to increase already for time t = 1 ms, while the Zthm(t) waveform begins to increase visibly for time t > 1 s. The values of the Zth(t) and Zthm(t) at the steady state differ between each other by 20%. The delay between the measured waveforms Zth(t) and Zthm(t) results from the distance between the transistor and diode chips inside the module and the size of the module. The heat flows between both the semiconductor chips and then goes to the surroundings.
7. Conclusions
This article presents a practical solution for a set-up for measuring the thermal parameters of power semiconductor devices. This set-up implements the concept of measuring self and transfer transient thermal impedances using an indirect electrical method. It is possible to use thermally sensitive parameters such as the voltage at the forward-biased p-n or m-s junction, the threshold voltage of a MOSFET or IGBT and the output voltage of a unipolar transistor. In contrast to other measurement set-ups described in the literature, the proposed solution makes it possible to measure not only self transient thermal impedance of the tested devices, but also transfer transient thermal impedance between such devices operating on a common base. This is important from the point of view of the practical use of the obtained results in compact thermal models of electronic and power electronic networks.
The structure of the designed measurement set-up and its operation method were described. The software controlling the operation of this system was also described. A unique feature of the presented measurement system is its universality, which enables the determination of the waveforms of thermal parameters of various groups of semiconductor devices. Thanks to the use of external power sources, it is possible to perform measurements at different values of the power dissipated in the measured device and obtained at different voltage and current values.
Examples of the measurement results of thermal parameters of IGBTs, SiC MOSFETs and power modules were presented. The obtained results were discussed, analyzing the impact of the cooling system on the considered thermal parameters. It was shown that the developed measurement system correctly measures Zth(t) and Zthm(t) waveforms in a wide time range (from 0.1 ms to 20 ks). The developed measurement set-up can be used both in scientific research and in enterprises to verify the effectiveness of the designed cooling systems. It was also shown that the use of the quadratic approximation of thermometric characteristics makes it possible to obtain much higher measurement accuracy than for the classical linear approximation. The differences between the measurement results obtained using both the mentioned approximation functions were up to 6%.
The measurement results are presented in the form of a text file. Using the proprietary software, it is possible to determine the values of the devices of the equivalent thermal model diagram in the form of a Cauer or Foster network based on the data from this file. These models are commonly used in the analysis of electronic systems taking into account their thermal properties.
Author Contributions
Conceptualization, K.G. and P.G.; methodology, K.G., P.P. and P.G.; software, A.D.; validation, P.G.; investigation, P.G.; writing—original draft preparation, K.G. and P.P.; writing—review and editing, K.G., P.G. and P.P.; visualization, K.G. and P.P.; supervision, K.G. All authors have read and agreed to the published version of the manuscript.
Funding
This research received no external funding.
Data Availability Statement
Data are available upon request.
Conflicts of Interest
The authors declare no conflicts of interest.
References
- Chang, M.H.; Das, D.; Varde, P.V.; Pecht, M. Light emitting diodes reliability review. Microelectron. Reliab. 2012, 52, 762–782. [Google Scholar] [CrossRef]
- Castellazzi, A.; Gerstenmaier, Y.C.; Kraus, R.; Wachutka, G.K.M. Reliability analysis and modeling of power MOSFETs in the 42-V-PowerNet. IEEE Trans. Power Electron. 2006, 21, 603–612. [Google Scholar] [CrossRef]
- Ciappa, M.; Carbognami, F.; Cora, P.; Fichtner, W. A novel thermomechanics-based lifetime prediction model for cycle fatique failure mechanisms in power semiconductors. Microelectron. Reliab. 2002, 42, 1653–1658. [Google Scholar] [CrossRef]
- Szekely, V. A new evaluation method of thermal transient measurement results. Microelectron. J. 1997, 2, 277–292. [Google Scholar] [CrossRef]
- D’Alessandro, V.; Rinaldi, N. A critical review of thermal models for electro-thermal simulation. Solid State Electron. 2002, 46, 487–496. [Google Scholar] [CrossRef]
- Schweitzer, D.; Ender, F.; Hantos, G.; Szabo, P.G. Thermal transient characterization of semiconductor devices with multiple heat sources-Fundamentals for a new thermal standard. Microelectron. J. 2015, 46, 174–182. [Google Scholar] [CrossRef]
- D’Alessandro, V.; Codecasa, L.; Catalano, A.P.; Scognamillo, C. Circuit-based electrothermal simulation of multicellular SiC power MOSFETs using FANTASTIC. Energies 2020, 13, 4563. [Google Scholar] [CrossRef]
- Górecki, K.; Zarębski, J.; Górecki, P.; Ptak, P. Compact thermal models of semiconductor devices—A review. Int. J. Electron. Telecommun. 2019, 65, 151–158. [Google Scholar] [CrossRef]
- Górecki, K.; Posobkiewicz, K. Influence of a PCB layout design on the efficiency of heat dissipation and mutual thermal couplings between transistors. Electronics 2023, 12, 4116. [Google Scholar] [CrossRef]
- Datasheet IXTH140P10T MOSFET Transistor. Available online: https://octopart.com/datasheet/ixtt140p10t-ixys-24380621 (accessed on 20 February 2024).
- Thermal Performance of CoolMOS™ CFD7A in D2PAK 7-Pin on Insulated Metal Substrates. Infineon, Nota AN_2001_PL52_2005_184555, Ver 1.0, 20.04.2020. Available online: https://www.infineon.com/dgdl/Infineon-MOSFET_CoolMOS_650_CFD7A_D2PAK_7PIN-ApplicationNotes-v01_00-EN.pdf?fileId=5546d462719b592301719bd2a82300fc (accessed on 8 July 2022).
- FDB52N20, Data Sheet, Fairchild Semiconductor. Available online: https://www.onsemi.com/download/data-sheet/pdf/fdb52n20-d.pdf (accessed on 22 April 2024).
- Blackburn, D.L. Temperature measurements of semiconductor devices—A review. In Proceedings of the Twentieth Annual IEEE Semiconductor Thermal Measurement and Management Symposium, San Jose, CA, USA, 11 March 2004; pp. 70–80. [Google Scholar]
- Oettinger, F.F.; Blackburn, D.L.; Rubin, S. Thermal characterization of power transistors. IEEE Trans. Electron. Devices 1976, 23, 831–838. [Google Scholar] [CrossRef]
- Bagnoli, P.E.; Caracosa, C.; Ciampi, M.; Dallago, E. Thermal resistance analysis by induced transient (TRAIT) method for power electronic devices thermal characterization. IEEE Trans. Power Electron. Fundam. Theory 1998, 13, 1208–1219. [Google Scholar] [CrossRef]
- Rencz, M.; Szekely, V. Measuring partial thermal resistances in a heat-flow path. IEEE Trans. Compon. Packag. Manuf. Technol. 2002, 25, 547–553. [Google Scholar] [CrossRef]
- JESD51-51; Implementation of the Electrical Test Method for the Measurement of Real Thermal Resistance and Impedance of Light-Emitting Diodes with Exposed Cooling. JEDEC Standard: Arlington, VA, USA, 2012.
- Dupont, L.; Avenas, Y.; Jeannin, P.O. Comparison of junction temperature evaluations in a power IGBT module using an IR camera and three thermosensitive electrical parameters. IEEE Trans. Ind. Appl. 2013, 49, 1599–1608. [Google Scholar] [CrossRef]
- Dupont, L.; Avenas, Y. Preliminary evaluation of thermo-sensitive electrical parameters based on the forward voltage for online chip temperature measurements of IGBT devices. IEEE Trans. Ind. Appl. 2015, 51, 4688–4698. [Google Scholar] [CrossRef]
- Górecki, K.; Detka, K. Improved Method for Measuring Power Losses in the Inductor Core. IEEE Trans. Instrum. Meas. 2021, 70, 1500710. [Google Scholar] [CrossRef]
- Lasance, C.J.M.; Poppe, A. Thermal Management for LED Applications; Springer Science & Business Media: New York, NY, USA, 2014. [Google Scholar]
- Górecki, K.; Ptak, P.; Janicki, M.; Napieralska, M. Comparison of properties for selected experimental set-ups dedicated to measuring thermal parameters of power LEDs. Energies 2021, 14, 3240. [Google Scholar] [CrossRef]
- Janke, W.; Kraśniewski, J. Investigation of transient thermal characteristics of microwave transistors. Metrol. Meas. Syst. 2009, 16, 433–442. [Google Scholar]
- Zarębski, J.; Dąbrowski, J.; Bisewski, D. Measurements of thermal parameters of silicon carbide semiconductor devices. Prz. Elektrotech. 2011, 87, 29–32. [Google Scholar]
- Górecki, K.; Posobkiewicz, K. Selected problems of power MOSFETs thermal parameters measurements. Energies 2021, 14, 8353. [Google Scholar] [CrossRef]
- Dziarski, K.; Hulewicz, A.; Kuwałek, P.; Wiczyński, G. Methods of Measurement of Die Temperature of Semiconductor Elements: A Review. Energies 2023, 16, 2559. [Google Scholar] [CrossRef]
- Blackburn, D.L.; Oettinger, F.F. Transient thermal response measurement of power transistors. IEEE Trans. Ind. Electron. Control Instrum. 1975, 22, 134–141. [Google Scholar] [CrossRef]
- Avenas, Y.; Dupont, L.; Khatir, Z. Temperature measurement of power semiconductor devices by thermo-sensitive electrical parameters—A review. IEEE Trans. Power Electron. 2012, 27, 3081–3092. [Google Scholar] [CrossRef]
- T3Ster Thermal Transient Tester, Technical Information, Siemens. Available online: https://plm.sw.siemens.com/en-US/simcenter/physical-testing/t3ster/ (accessed on 16 February 2024).
- Górecki, K.; Górecki, P.; Zarębski, J. Measurements of parameters of the thermal model of the IGBT module. IEEE Trans. Instrum. Meas. 2019, 68, 4864–4875. [Google Scholar] [CrossRef]
- Górecki, K.; Posobkiewicz, K. Influence of the selection of the approximating function of thermometric characteristics on the measurement results of thermal resistance of power MOSFETs. Metrol. Meas. Syst. 2024, 31, 149702. [Google Scholar]
- Janicki, M.; Sarkany, Z.; Napieralski, A. Impact of nonlinearities on electronic device transient thermal responses. Microelectron. J. 2014, 45, 1721–1725. [Google Scholar] [CrossRef]
- Janicki, M.; Torzewicz, T.; Samson, A.; Raszkowski, T.; Napieralski, A. Experimental identification of LED compact thermal model element values. Microelectron. Reliab. 2018, 86, 20–26. [Google Scholar] [CrossRef]
- Poppe, A. Multi-domain compact modeling of LEDs: An overview of models and experimental data. Microelectron. J. 2015, 46, 1138–1151. [Google Scholar] [CrossRef]
- Górecki, K.; Górecki, P. The analysis of accuracy of the selected methods of measuring thermal resistance of IGBTs. Metrol. Meas. Syst. 2015, 22, 455–464. [Google Scholar] [CrossRef]
- Poppe, A. Thermal Measurements and Modelling. The Transient and Multichip Issues. Tutorial, 11th THERMINIC Workshop, Belgirate, Italy. 2005. Available online: https://therminic.org/therminic2005/APoppe_Tutorial.pdf (accessed on 2 May 2023).
- Bahman, A.; Ma, K.; Blaabjerg, F. A lumped Thermal Model Including Thermal Coupling and Thermal Boundary Conditions for High-Power IGBT Modules. IEEE Trans. Power Electron. 2018, 33, 2518–2530. [Google Scholar] [CrossRef]
- Liebhard, J.H., IV; Liebhard, J.H., V. A Heat Transfer Textbook, 3rd ed.; Phlogiston Press: Cambridge, MA, USA, 2008. [Google Scholar]
- IRG4PC40UD Insulated Gate Bipolar Transistor with Ultrafast Soft Recovery Diode, Datasheet, International Rectifier. Available online: https://www.irf.ru/pdf/irg4pc40ud.pdf (accessed on 22 April 2024).
- SCT3060ALHR, Automotive Grade N-Channel SiC Power MOSFET, Datasheet ROHM 2012. Available online: https://fscdn.rohm.com/en/products/databook/datasheet/discrete/sic/mosfet/sct3060alhr-e.pdf (accessed on 22 April 2024).
Figure 1.
Measured and approximated thermometric characteristics of an IGBT (red dots—measurement results, red line—quadratic approximation, blue line—linear approximation).
Figure 1.
Measured and approximated thermometric characteristics of an IGBT (red dots—measurement results, red line—quadratic approximation, blue line—linear approximation).

Figure 2.
Block diagram of a set-up for measuring self transient thermal impedances.

Figure 3.
Block diagram of a set-up for measuring self transient thermal impedances of a MOSFET or an IGBT and transfer transient thermal impedances.
Figure 3.
Block diagram of a set-up for measuring self transient thermal impedances of a MOSFET or an IGBT and transfer transient thermal impedances.

Figure 4.
View of the front panel of the system for measuring thermal parameters.

Figure 5.
View of the inside of the housing of the system for measuring thermal parameters.

Figure 6.
View of the measurement set-up with the connected external polarizing devices for the tested power device.
Figure 6.
View of the measurement set-up with the connected external polarizing devices for the tested power device.

Figure 7.
The operating algorithm of the software controlling the set-up for measuring thermal parameters of selected semiconductor devices.
Figure 7.
The operating algorithm of the software controlling the set-up for measuring thermal parameters of selected semiconductor devices.

Figure 8.
Measured transient thermal impedance waveforms of an IGBT operating without a heat-sink for selected ambient temperature values.
Figure 8.
Measured transient thermal impedance waveforms of an IGBT operating without a heat-sink for selected ambient temperature values.

Figure 9.
Measured transient thermal impedance waveforms of an IGBT mounted on a cold plate.

Figure 10.
Transient thermal impedance waveforms of a SiC MOSFET placed on a heat-sink with an insulating pad.
Figure 10.
Transient thermal impedance waveforms of a SiC MOSFET placed on a heat-sink with an insulating pad.

Figure 11.
Measured waveforms of transient thermal impedance of a SiC MOSFET operating with liquid cooling and selected values of power dissipated in it.
Figure 11.
Measured waveforms of transient thermal impedance of a SiC MOSFET operating with liquid cooling and selected values of power dissipated in it.

Figure 12.
Measured waveforms of self and transfer transient thermal impedance in the power module placed on the heat-sink.
Figure 12.
Measured waveforms of self and transfer transient thermal impedance in the power module placed on the heat-sink.

Disclaimer/Publisher’s Note: The statements, opinions and data contained in all publications are solely those of the individual author(s) and contributor(s) and not of MDPI and/or the editor(s). MDPI and/or the editor(s) disclaim responsibility for any injury to people or property resulting from any ideas, methods, instructions or products referred to in the content. |
© 2024 by the authors. Licensee MDPI, Basel, Switzerland. This article is an open access article distributed under the terms and conditions of the Creative Commons Attribution (CC BY) license (https://creativecommons.org/licenses/by/4.0/).
Share and Cite
MDPI and ACS Style
Górecki, K.; Ptak, P.; Górecki, P.; Data, A. Set-Up for Measuring Thermal Parameters of Power Semiconductor Devices. Electronics 2024, 13, 1636. https://doi.org/10.3390/electronics13091636
AMA Style
Górecki K, Ptak P, Górecki P, Data A. Set-Up for Measuring Thermal Parameters of Power Semiconductor Devices. Electronics. 2024; 13(9):1636. https://doi.org/10.3390/electronics13091636
Chicago/Turabian StyleGórecki, Krzysztof, Przemysław Ptak, Paweł Górecki, and Aleksander Data. 2024. "Set-Up for Measuring Thermal Parameters of Power Semiconductor Devices" Electronics 13, no. 9: 1636. https://doi.org/10.3390/electronics13091636
Note that from the first issue of 2016, this journal uses article numbers instead of page numbers. See further details here.