
State of Health (SOH) Estimation of Lithium-Ion Batteries Based on ABC-BiGRU


College of Computer Science and Engineering, Sichuan University of Science and Engineering, Zigong 643000, China
*
Author to whom correspondence should be addressed.
Electronics 2024, 13(9), 1675; https://doi.org/10.3390/electronics13091675
Submission received: 29 March 2024
/
Revised: 16 April 2024
/
Accepted: 19 April 2024
/
Published: 26 April 2024
(This article belongs to the Special Issue Energy Storage, Analysis and Battery Usage)
Abstract
:As a core component of new energy vehicles, accurate estimation of the State of Health (SOH) of lithium-ion power batteries is essential. Correctly predicting battery SOH plays a crucial role in extending the lifespan of new energy vehicles, ensuring their safety, and promoting their sustainable development. Traditional physical or electrochemical models have low accuracy in measuring the SOH of lithium batteries and are not suitable for the complex driving conditions of real-world vehicles. This study utilized the black-box characteristics of deep learning models to explore the intrinsic correlations in the historical cycling data of lithium batteries, thereby eliminating the need to consider the internal chemical reactions of lithium batteries. Through Pearson correlation analysis, this study selects health indicators (HIs) from lithium battery cycling data that significantly impact SOH as input features. In the field of lithium batteries, this paper applies ABC-BiGRU for the first time to SOH prediction. Compared with other recursive neural network models, ABC-BiGRU demonstrates superior predictive performance, with maximum root mean square error and mean absolute error of only 0.016799317 and 0.012626847, respectively.
1. Introduction
The acceleration of global industrialization, coupled with the deterioration of the atmospheric environment and the high consumption of fossil fuels, has underscored the critical importance of seeking sustainable energy development [1]. Lithium-ion batteries are widely used in new energy vehicles and energy repository industries, owing to their elevated energy density, prolonged life cycle, and minimal pollution [2]. However, practical applications of lithium-ion batteries still face challenges such as safety concerns, capacity degradation, energy density limitations, and charging efficiency issues [3]. With a substantial amount of flammable electrolytes and reactive materials contained in the electrodes of lithium-ion batteries, various factors such as incorrect usage, prolonged exposure to extreme conditions, or an increasing number of battery cycles may lead to abnormal situations. Overcharging and over-discharging batteries can result in several detrimental effects. These include internal electrolyte decomposition, the solid electrolyte interface (SEI) breakdown, and the possibility of direct contact and reaction between the positive and negative electrode materials and the electrolytes. Consequently, the heat generated by internal chemical reactions may be out of the battery pack’s temperature control, triggering a thermal runaway reaction [4,5,6].
The problem of thermal runaway and battery failure during the use of lithium-ion batteries severely constrains the development of the new energy vehicle field. In recent years, many lithium batteries have been recycled due to explosion and spontaneous combustion accidents, causing immeasurable losses to users’ lives and property, as well as the brand reputation of manufacturing companies [7]. In March 2024, for instance, in a residential apartment in Bankstown, Western Sydney, Australia, a fire broke out due to the thermal runaway of a lithium battery within an electric bicycle, resulting in the emergency evacuation of 40 individuals and a male of who sustained burns from the fire. In August 2023, in Nanjing, Jiangsu Province, China, a fire broke out on an intercity bus during transit, caused by the spontaneous combustion of a lithium battery carried by a passenger, resulting in a tragic incident where two people died and five people suffered partial burns. In July 2023, a cargo ship carrying 2000 new cars caught fire in waters 300 km from Honshu Island, Japan, due to the spontaneous combustion of electric vehicle batteries, resulting in the ship sinking to the seabed and causing significant economic losses. In March 2023, a Florida-bound flight operated by Spirit Airlines was forced to make an emergency landing in Jacksonville after a malfunctioning lithium-ion battery in the cabin sparked a fire, resulting in the hospitalization of ten passengers. The widespread reports of lithium battery safety incidents have raised concerns among various sectors of society about the safety of new energy batteries [8,9,10].
To mitigate the risk of safety incidents associated with lithium batteries, it is commonplace to establish a battery retirement standard, typically set at 80% of their rated capacity, while concurrently utilizing SOH metrics to quantify this process [11]. Adhering to timely replacement protocols for aging lithium batteries by these standards can significantly reduce safety incidents, thus protecting the lives and assets of users. Therefore, it is imperative to predict the future trend of SOH in batteries accurately. By accurate prediction of battery SOH, problems can be detected in time, battery life can be extended, and safety and performance stability can be improved, thus promoting lithium-ion batteries’ further development and application [12,13]. Presently, there are three primary categories of methods for forecasting the SOH.
The first is based on battery mechanistic models, which summarize the internal active behavior of the battery by establishing its mechanistic model and utilizing directly measured battery parameters to build mathematical models to predict the battery’s SOH based on the characteristics of internal physical and chemical processes of the battery [14]. Liping Chen et al. [15] combined equivalent circuit models (ECMs) with deep learning networks to enhance prediction accuracy and generalization by data features. However, ECM parameters are susceptible to environmental changes, which may result in fluctuating outcomes and accumulating errors. S. Amir et al. [16] used 2-RC ECMs to capture degradation for estimating battery SOH and, through experimental verification, demonstrated the superiority of the 2-RC model in estimating SOH but with higher computational costs. Zhicheng Xu et al. [17] combined ECMs with simplified electrochemical models to evaluate lithium-ion batteries’ charge state and SOH simultaneously. Model parameters were determined online using the recursive least squares method, thereby obtaining the battery’s SOH. Manh-Kien Tran et al. [18] studied the application of ECMs to battery management systems, proposing a concise empirical framework to describe the influence of SOH and temperature on the parameters of the ECM, and demonstrated effectiveness in practical applications. Despite the ability of battery mechanism models to provide in-depth explanations of battery discharge behavior, their complexity, sensitivity to parameters, and high computational costs limit their widespread use in practical applications.
The second approach involves adaptive filtering methods. By dynamically adjusting the parameters of the filter, it optimally combines system models and measurement data to estimate the SOH of the battery, demonstrating strong adaptability but lacking online capability [19]. Miao miao Zeng et al. [20] introduced a novel fuzzy unscented Kalman filtering algorithm, combined with improved second-order RC ECMs, to enhance the accuracy of lithium battery SOH estimation but with higher computational complexity of the model. Qingxia Yang et al. [21] proposed a joint estimation method based on Kalman filtering, with results indicating improved accuracy in estimating the SOC and SOH of power batteries. MadhuSudana Rao Ranga et al. [22] proposed a method based on unscented Kalman filtering, utilizing sigma points to fit non-linearity, thereby improving the prediction accuracy of SOH. Feng Zhu et al. [23] improved the speed and accuracy of SOH assessment for lithium-ion batteries by integrating unscented Kalman filtering and an enhanced unscented particle filtering algorithm, achieving a practical estimation of SOH. Claudio Rossi et al. [24] utilized a genetic algorithm to optimize the covariance matrix of the extended Kalman filter to aid in SOH prediction. This method demonstrated good accuracy throughout the entire battery lifecycle. Shulin Liu et al. [25] utilized 2-RC ECMs combined with a recursive least squares algorithm with attached genetic factors for model parameter selection and then used an adaptive unscented Kalman filter to predict the SOC and SOH of lithium batteries jointly. Compared to unscented Kalman filtering, this method exhibited superior accuracy. Although adaptive filtering models have lower storage and computational costs, they heavily rely on preset initial conditions, requiring significant expertise and experience for parameter adjustment and optimization while struggling with non-linear systems and non-Gaussian noise.
The third is based on data-driven methods. Data-driven methods are black-box models that operate without necessitating an understanding of the internal physical or chemical reactions within the battery [26]. By analyzing data generated during the operation of lithium batteries, such as open-circuit voltage, charge-discharge duration, operating temperature, etc., and utilizing artificial intelligence or statistical models for modeling and prediction, it is feasible to accurately estimate the SOH. This approach enables real-time monitoring of battery SOH and better adaptation to changes in battery performance under different operating conditions [27]. Lijun Zhang et al. [28] utilized a long short-term memory (LSTM) model to predict the SOH of lithium-ion batteries, and the research results showed that it could effectively improve battery management efficiency and safety. However, the study only selected battery capacity as the sole input feature, lacking feature dimensions in the data, which may lead to poor model generalization performance. Dan Zhang et al. [29] utilized feature engineering to explore the high-temperature variation rate of lithium-ion batteries, established a TCN model for SOH prediction, and adopted sampling methods to provide confidence intervals for the prediction results. The verification results indicate that it has high accuracy and effectiveness in battery SOH prediction. Ran Li et al. [30] introduced an online battery health estimation model utilizing a particle swarm support vector machine, enabling concurrent efficient estimation of SOC and SOH with notable adaptability and generality capability. Shuxiang Song et al. [31] proposed a lithium-ion battery SOH estimation method with higher accuracy using the XGBoost algorithm. By extracting key features to describe the battery aging process and combining them with Markov chains for accuracy correction, this method achieved a 10–20% improvement in accuracy compared to traditional algorithms. Jianfang Jia et al. [32] proposed a joint prediction method for lithium-ion battery SOH and RUL based on indirect HI, which uses Gaussian process regression for short-term prediction and RUL mapping relationship to predict remaining life. Data-driven approaches are suitable for solving complex non-linear system problems. However, the modeling process requires a large amount of historical data as support, leading to high computational and time costs and requiring significant time and resources for data collection and processing [33].
In summary, traditional methods face various challenges when forecasting the SOH. With the ongoing improvement of battery management systems (BMSs), the importance of data collection in new energy vehicles is increasingly prominent. These data support constructing digital twin models of new energy vehicles and help vehicle manufacturers and users understand vehicle status in real time. Therefore, adopting a data-driven approach to mine cycle data of power batteries for obtaining battery status is essential and feasible. In contrast, data-driven methods do not require prior knowledge but achieve accurate estimation of health status through analyzing battery operation data, offering advantages such as real-time performance and adaptability. By analyzing the intrinsic correlations in battery cyclic data, HIs highly related to SOH can be extracted for model training, enabling the removal of redundant data and alleviating the high prediction cost issue caused by a large amount of data. Currently, some scholars model using a single data dimension, such as capacity. However, relying solely on inadequate data dimensions may lead to insufficient prediction accuracy and lower adaptability.
This paper extracts multiple HIs as input features, applies the bidirectional information processing capability of BiGRU to avoid the impact of redundant data on results, utilizes the artificial bee colony optimization algorithm to fine-tune the model, and enhances the prediction accuracy of SOH. An improved ABC-BiGRU model is constructed and validated through cross-validation and comparative evaluation of the National Aeronautics and Space Administration (NASA) battery cycle dataset. Experimental results demonstrate that the model can further improve the accuracy of estimating lithium battery health status. The primary contributions of this paper include:
- (1)
- The BiGRU model with bidirectional feature learning capabilities was introduced. Combining the gated recurrent unit (GRU) structure and bidirectional transmission mechanism, the model can better capture the time series features in the data. Particularly, when dealing with capacity rebound caused by capacity recovery during battery cycling processes, the BiGRU model can make more accurate predictions, thus enhancing the accuracy and performance of the predictive model;
- (2)
- The artificial bee colony intelligent algorithm was introduced as a means of model optimization, conducting hyperparameter tuning for the BiGRU model, enabling effective search for the optimal hyperparameter combination of the BiGRU model;
- (3)
- The advantages of the proposed model are extensively discussed through comparisons of prediction results from different models and test sets. Experimental results indicate that predictions based on the BiGRU model exhibit higher accuracy and robustness than GRU and LSTM models. Furthermore, even when compared to a BiGRU model based on grid search, the ABC-BiGRU model proposed in this study demonstrates significant performance enhancement.
The remainder of this paper is presented in the following order: Section 2 introduces the data and the selection of HIs. Section 3 delineates the BiGRU model and elucidates the optimization process utilizing intelligent algorithms. Section 4 expounds upon the experimental settings and methodologies for data processing. Section 5 showcases the SOH prediction results alongside corresponding comparative analyses. Finally, Section 6 encapsulates the findings of this paper and discusses future improvements and research directions.
2. Data Introduction and Processing
2.1. Battery Data
This paper utilizes the publicly available lithium battery accelerated aging experiment cycle dataset from NASA [34]. The dataset has undergone rigorous testing and encompasses a wide range of physical indicators of batteries. It is open, practical, and can provide reliable support for in-depth analysis of the impact of parameter changes during charging and discharging on battery performance. Three sets of batteries, B0005, B0006, and B0007, were selected as experimental subjects for cross-validation. All three sets of batteries were under the same operating conditions. Charging is conducted at a constant current (CC) of 1.5 A until the battery voltage reaches 4.2 V, then it continues in constant voltage (CV) mode until the charging current drops to 20 mA. Discharge is performed at a constant current (CC) level of 2 A until the battery voltages of cells 5, 6, and 7 drop to 2.7 V, 2.5 V, and 2.2 V, respectively. Cycle data parameters encompass battery temperature, charging and discharging currents and voltages, and corresponding times. Table 1 delineates the battery’s characteristics. Figure 1 illustrates the process of battery capacity decay with increasing number of cycles for three batteries in an environment at room temperature of 24 °C.
SOH is one of the indicators describing the current health status and degree of performance degradation of lithium batteries, which can help users understand the battery usage situation, formulate more reasonable battery usage and maintenance plans, prolong battery life, and ensure safe battery use. Due to the multiple characterization parameters of battery chemical properties, multiple methodologies exist for assessing SOH. Currently, mainstream evaluation methods typically rely on changes in capacity or internal resistance. In this paper, the SOH of a battery is defined as the percentage of the current capacity () of the battery in relation to its rated capacity () [13]; it is calculated as follows:
2.2. Selection of HIs
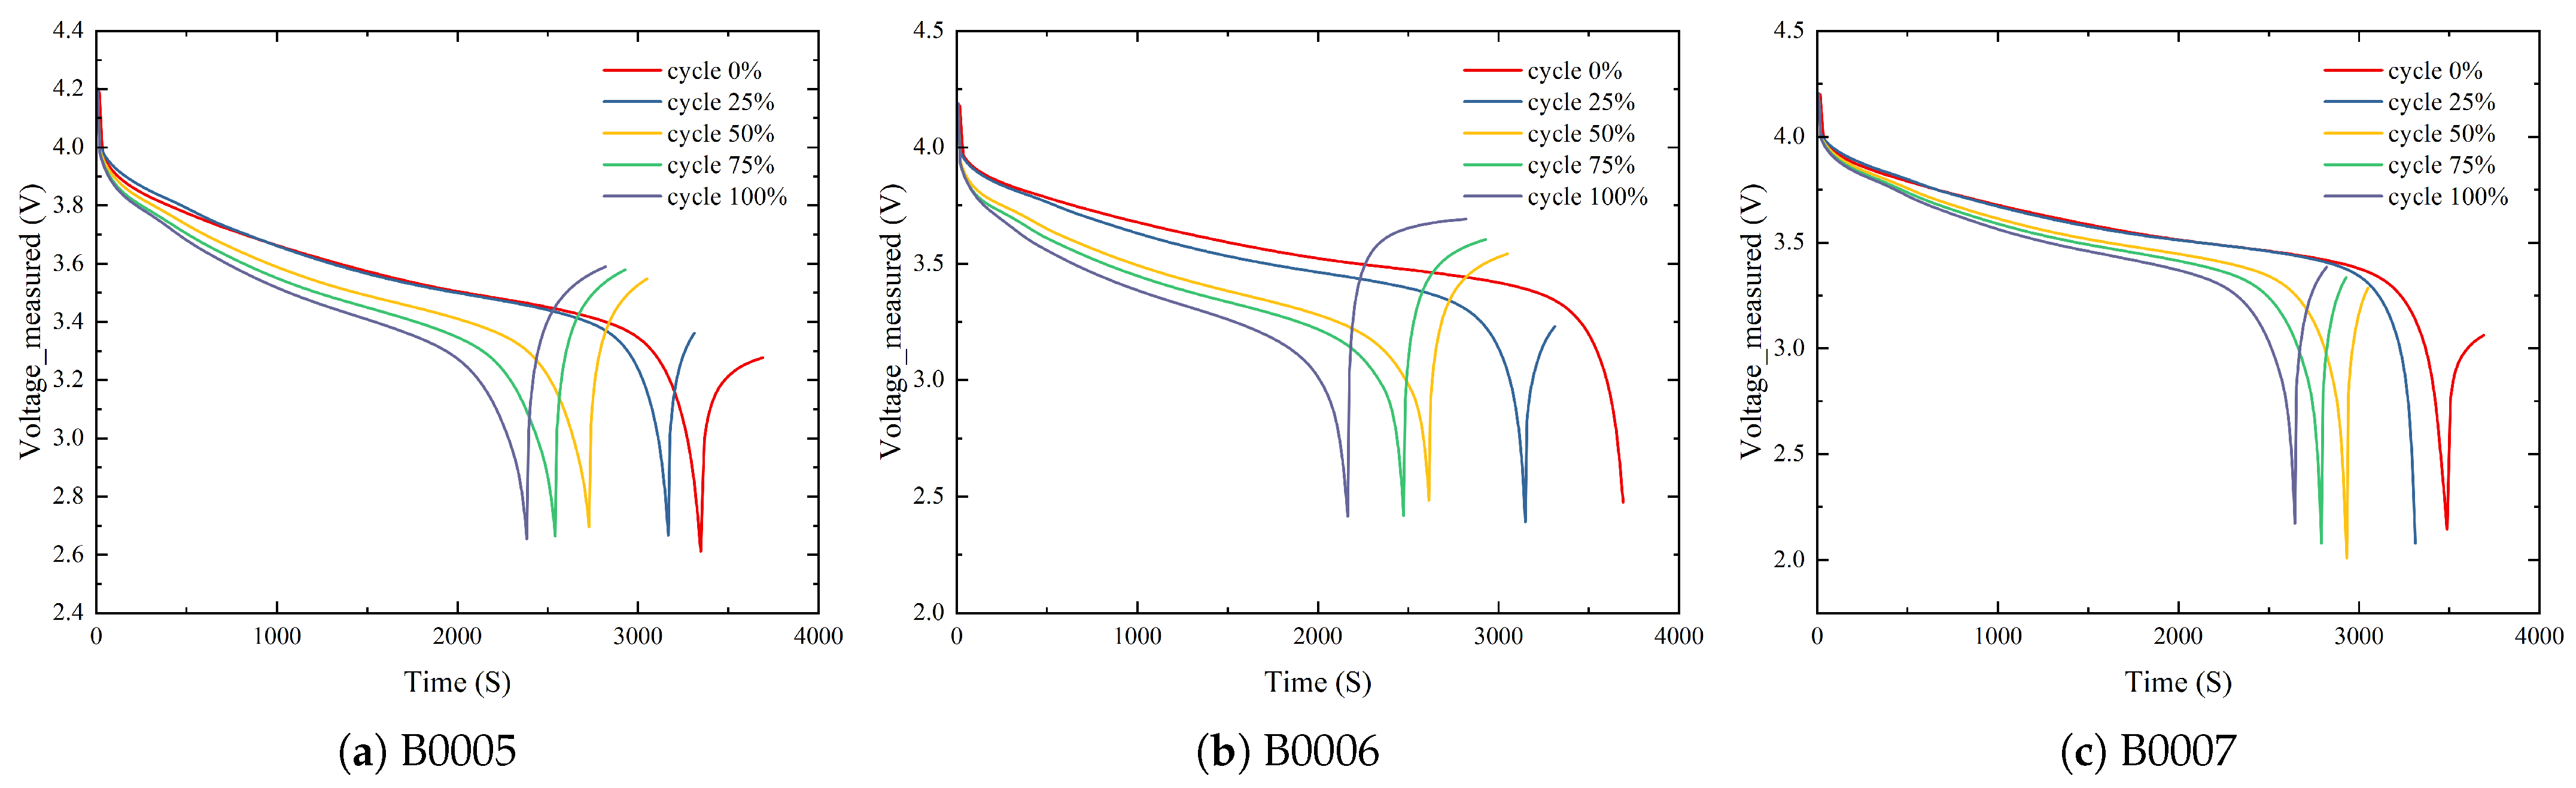
Lithium-ion battery cyclic data could reflect the process of battery life decay. By analyzing the correlation of physical parameters in the cycle data, relevant parameters that depict the health status of lithium batteries, namely HIs, are extracted. HIs contain the trends and characteristics of battery health status changes. This paper extracts parameters related to indirect HIs from the lithium battery cyclic dataset as characteristic indicators of lithium battery health status [35]. Before conducting correlation analysis, this paper first analyzed the physical data collected from the cyclic data to ensure the rationality of health indicator selection. Figure 2 shows the voltage curves of three sets of batteries with discharge time, and it also shows that the voltage curves exhibit clear trends, gradually shifting towards the negative direction of the x-axis with increasing cycle numbers. Therefore, it should be considered to extract HIs from the changes in load voltage during the discharge process. Additionally, the HIs were simultaneously extracted during the charging process for correlation analysis to ensure sufficient feature extraction. Specifically, this paper selected discharge peak voltage (DPT), average discharge voltage (ADV), as well as charging peak voltage (CPT) and average charging voltage (ACV) as alternative HIs.
Figure 3 illustrates the temperature versus time curves of the three cells at different cycling ratios. The graph indicates that alterations in the cycling ratio lead to changes in the occurrence time of the maximum temperature, causing the curve to shift in the negative direction of the x-axis. Consequently, both the peak temperature and average temperature during charging and discharging processes may significantly affect SOH. That is the reason why this paper considers selecting discharge peak temperature (DPT), average discharge temperature (ADT), charge peak temperature (CPT), and average charge temperature (ACT) as alternative HIs. The variation of time and data during the cycling process is closely related. Thus, charge duration (CD) and discharge duration (DD) can be selected as alternative HIs and included in correlation analysis. The fluctuation of current in Li-ion batteries during the cycling phase is influenced by various external factors, including charging and discharging patterns and rates. These factors lead to unstable and irregular changes in current. Consequently, this paper excludes parameters dependent on current from consideration as HIs.
After analysis, the following indicators generated during the charging and discharging processes are selected as the alternative HIs for correlation analysis. Charging-related factors include charge duration (CD), average charge temperature (ACT), charge peak temperature (CPT), average charge voltage (ACV), and charge peak voltage (CPV), while the discharge-related factors include discharge duration (DD), average discharge temperature (ADT), discharge peak temperature (DPT), average discharge voltage (ADV), and discharge peak voltage (DPV).
Correlation analysis serves to determine the relationships between different variables, facilitating a deeper understanding of the patterns and regularities within the data. As a vital variable selection tool, Pearson correlation analysis plays a crucial role in data analysis and model construction. It helps determine the significance of relationships between variables and identifies features with higher correlations to the target variable, simplifying the model and improving predictive performance. The Pearson correlation coefficient measures the linear relationship between HIs and capacity, with its absolute value closer to 1, indicating a more significant correlation. This data-driven, simple, intuitive, and accurate method reliably supports lithium battery health prediction. The Pearson correlation coefficient can be computed using the formula below:
where represents the Pearson correlation coefficient between HIs x and capacity y. and , respectively, denote the i-th observation in the sample, and and represent the means of HIs and capacity. Perform Pearson correlation analysis on alternative HIs and battery capacity, calculating correlation coefficients. The correlation coefficient heatmap between HIs and capacity is shown in Figure 4, with specific correlation coefficient values listed in Table 2. According to the definition of Pearson correlation coefficient, HIs with larger absolute values of coefficients have stronger correlations with capacity, better explaining the variation in SOH. Therefore, this paper selects HIs with correlation coefficients greater than 0.7 as input features for the model. Average discharge voltage (ADV), discharge peak temperature (DPT), average discharge temperature (ADT), discharge duration (DD), and average charge voltage (ACV) are used as HIs for model training [36].
3. Method for Estimating SOH Based on ABC-BiGRU
3.1. BiGRU Model
Lithium battery cyclic data are made up of a temporal dataset with long-term dependencies between data, implying that changes in data may exhibit periodicity or be influenced by time. Initially, the selection of RNNs, capable of capturing the features of time-series data, is contemplated for model construction. Unlike feedforward neural networks, RNNs possess recurrent connections, allowing them to retain historical state information when processing sequential data. This implies that RNNs can take into account contextual information while processing sequence data, rendering them highly suitable for SOH prediction of lithium batteries. However, due to the extensive time span of lithium battery datasets, RNNs face challenges in capturing the long-term dependencies present in the data. During deep training, gradients may grow or diminish exponentially, leading to gradient vanishing or exploding. This phenomenon results in the loss of crucial contextual information, leading to poor model prediction performance.
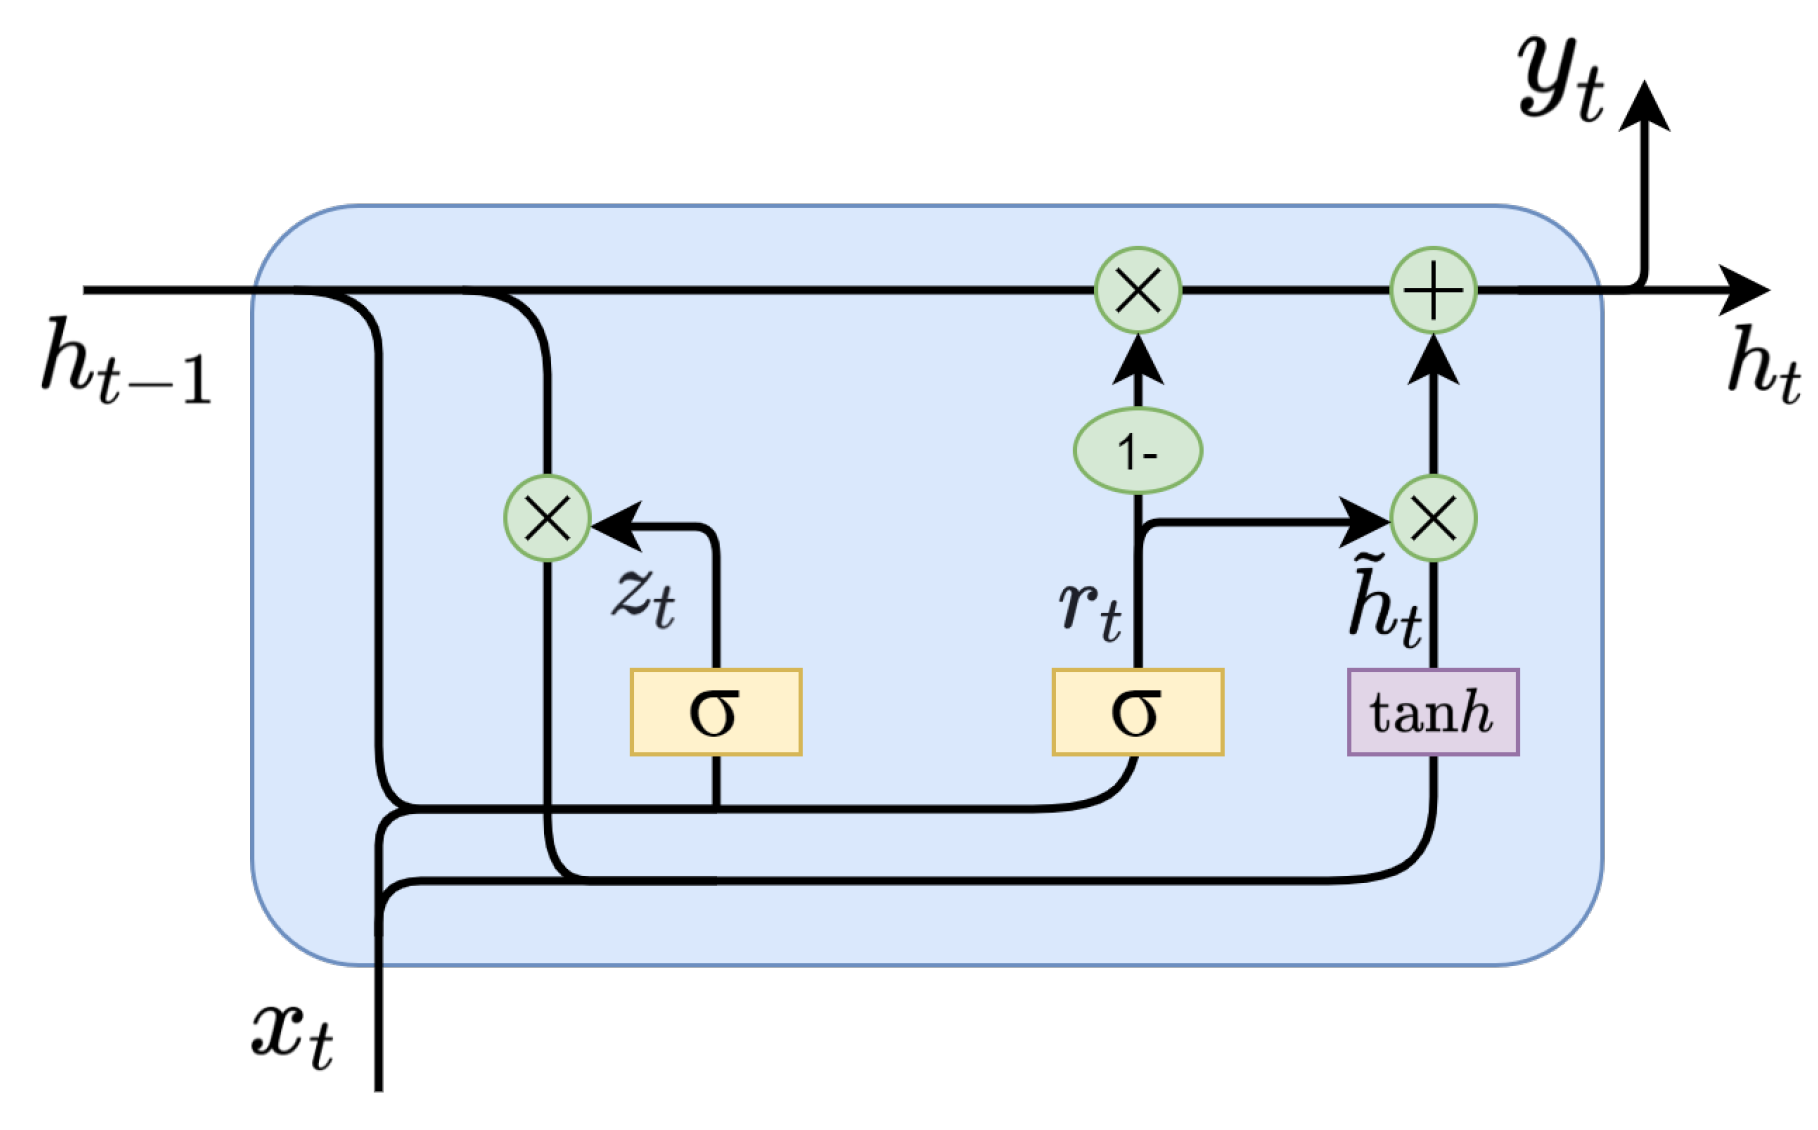
In 2014, introduced by Kyunghyun Cho et al., the gated recurrent unit (GRU) was devised to tackle the issue of gradient vanishing or explosion encountered by conventional RNNs when handling lengthy sequence tasks, thereby addressing the difficulty in capturing long-distance dependencies within sequences [37]. In contrast to LSTM, GRU boasts a more straightforward structure and fewer parameters, rendering it advantageous in tasks involving smaller datasets and aiding in overfitting prevention [38]. The unit structure of GRU is depicted in Figure 5.
The primary framework of the GRU incorporates two pivotal gate units: the update gate and the reset gate. They help handle the data flow and determine which information should be passed and retained at each time step, enhancing the model’s memory and generalization capabilities.
The update gate, denoted as , is tasked with updating the hidden state and determining how much previous memory the model should retain at each step. The reset gate is responsible for deciding whether the model should ignore previous memory and compute the output based on the current input. The calculation formulas are as follows.
where and denote weight matrices, and represent bias vectors, signifies the sigmoid function, and indicates the concatenation of the hidden state from the preceding time step and the input .
denotes the candidate hidden state, which is computed from the current input and past hidden states. The specific formula is shown below:
where stands for the weight matrix utilized in computing the candidate hidden state, denotes the reset gate, and represents the bias vector for candidate values. The symbol ⊙ signifies element-wise multiplication.
The current hidden state is computed based on the update gate and the candidate hidden state, and it functions to retain information from all preceding time steps. The specific formula is shown below:
where represents the update gate and represents the current hidden state.
To verify the feasibility of the GRU model, this paper processed the data and employed the GRU model for training and prediction. Figure 6 compares the predicted and actual values through cross-validation after training with the GRU model. The results indicate that the prediction performance of the GRU model is poor at the beginning and end of the sequence when predicting the SOH of lithium batteries, suggesting that it fails to fully capture the characteristics of the data.
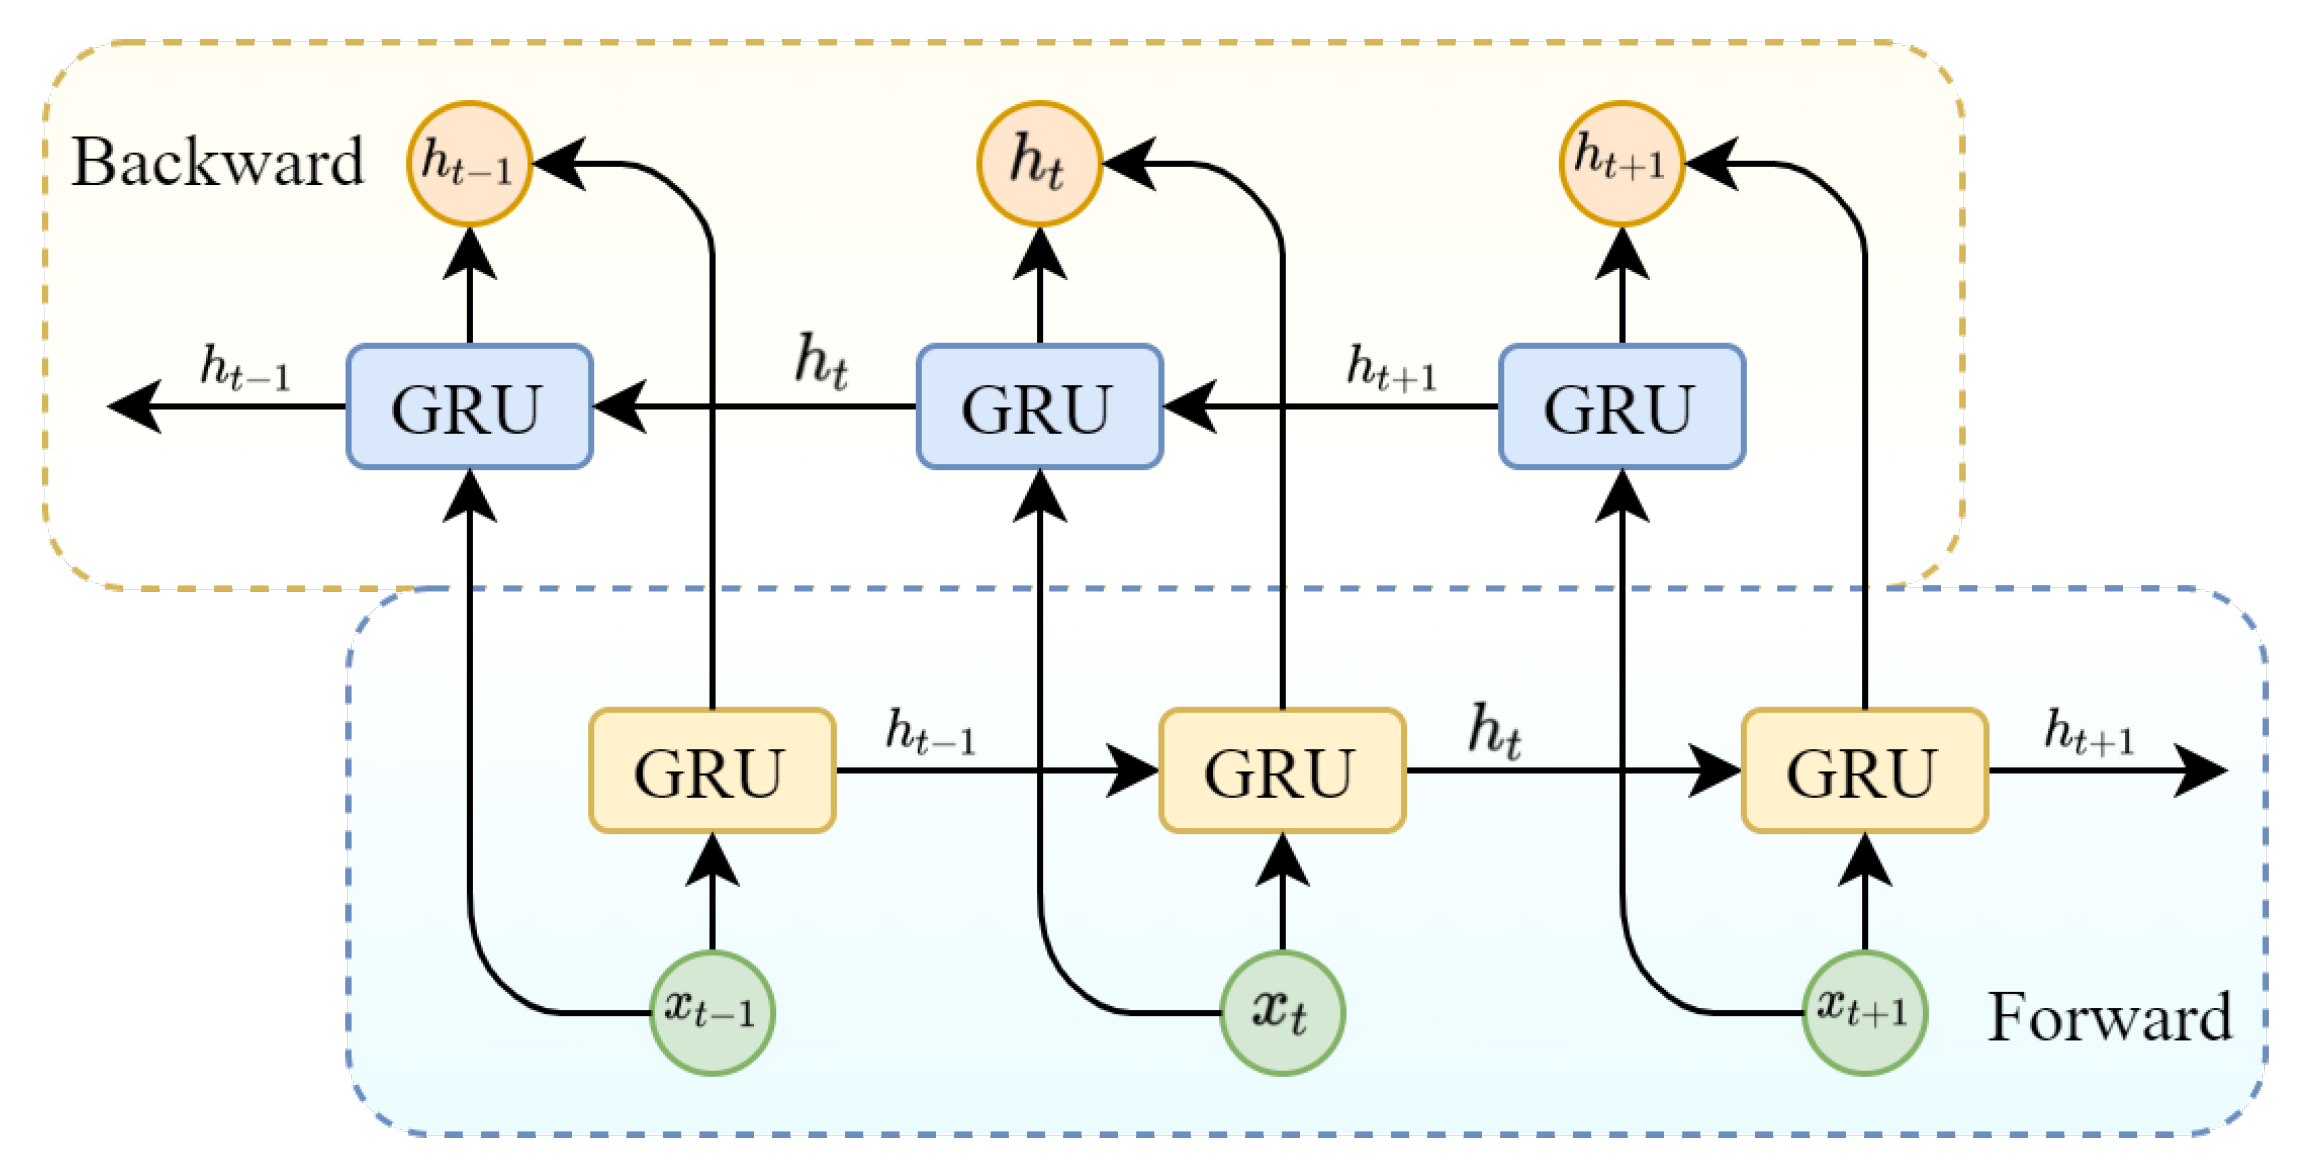
The capacity degradation curve of lithium-ion batteries does not decrease linearly with the number of cycles but exhibits complex non-linear characteristics. Considering that the estimation accuracy of lithium battery SOH is affected by multidimensional features, the change curve at the beginning and end of its life differs, and a capacity recovery phenomenon affects the prediction effect. To overcome the limitations of GRU, we introduce the BiGRU model with bidirectional feature learning capability. The BiGRU model has the ability to process both forward and backward information, enabling it to more comprehensively capture the key features and trends of the SOH degradation curve, thus better fitting the SOH degradation curve and more effectively describing the complex characteristics of the SOH degradation process.
BiGRU combines multiple independent GRU models. The forward GRU propagates information along the sequence in the forward direction, while the backward GRU along the reverse direction. These independent models derive hidden states separately then merge and calculate to obtain a comprehensive hidden state at each time step. The network structure of BiGRU, which could simultaneously explore past and future information in time-series data, thereby overcoming performance errors caused by the phenomenon of capacity recovery in lithium batteries, could more accurately extract the SOH degradation features of lithium batteries. The structure of the BiGRU network is shown in Figure 7.
3.2. Artificial Bee Colony Optimization Algorithm
By optimizing the hyperparameters of the model through optimization algorithms, the performance of the model can be enhanced. The grid search optimization algorithm is a commonly used method for hyperparameter optimization. However, it requires manual setting of hyperparameter combinations during algorithm initialization. Since the optimization process for hyperparameters often has infinite solutions, it is difficult to find the optimal solution from a limited set of hyperparameters. Therefore, the grid search algorithm is unsuitable for optimizing parameters with continuous values [39]. In order to achieve the best performance of the model with limited computing resources and avoid hyperparameters falling into local optimal solutions, this paper utilizes the ABC intelligent algorithm for hyperparameter optimization. The ABC algorithm requires fewer initial parameters and exhibits stronger global search capabilities, making it suitable for continuous optimization problems. Unlike the particle swarm optimization algorithm, the ABC algorithm does not require the maintenance of particles’ position and velocity information, and its parameter setting is simple, thus saving computational resources. This enables it to perform efficient optimization with limited resources [40].
ABC is a heuristic optimization algorithm proposed by Karaboga et al. in 2005, which abstracts specific algorithms from the nectar harvesting behavior of bee colonies by observing their biological behavior [41]. By simulating the behavior of bees searching for nectar sources, the algorithm utilizes an information-sharing mechanism among individual bees to explore the solution space globally. During foraging, bees choose the optimal food source or the best solution based on the nectar concentration and distance of flowers. In the algorithm, “bees” are divided into employed bees, onlooker bees, and scout bees [42]. Employed bees are responsible for exploring food sources and evaluating their quality within a local area. Onlooker bees are responsible for exploring more satisfactory nectar sources on a global scale and exchanging information with other bees. Finally, scout bees are responsible for evaluating the quality of known nectar sources and updating them.
During the employed bee phase, after determining the number and range of hyperparameters to be optimized, generate N initial feasible solutions randomly within the specified range as follows:
which assigns feasible solutions to employed bees, where represents the jth parameter of the ith feasible solution. and are the upper and lower bounds of the jth parameter, respectively, and are randomly sampled by multiplying a random number between .
Employed bees begin foraging in the vicinity of the allocated feasible solutions and calculate their corresponding fitness . The fitness calculation formula is as follows:
where represents the objective function, and in the context of this paper’s State of Health (SOH) prediction task, the objective function outputs the evaluation criterion of the model.
During the onlooker bee phase, selecting and updating the solutions based on the nectar sources discovered by the employed bees is necessary. If the solution has a more optimal within its domain, the update is performed according to the following formula.
where is the current solution, is the updated solution, is the solution of a randomly selected employed bee, and is a random number within .
In the scout bee phase, it is necessary to check all solutions from employed bees and onlooker bees. If some solutions have yet to be updated within a certain number of iterations, they are considered local optima and need to be replaced. When replacing these local optima, new solutions are randomly generated, and the iteration algorithm is repeated until the maximum preset number of iterations is reached.
The ABC algorithm optimizes the solution to the problem by simulating these behaviors of bees, iteratively searching and continuously updating the positions of nectar sources until the stopping criteria are met [43]. It is simple and easy to understand, with low computational costs, making it particularly suitable to solve complex optimization problems. The initial parameter configuration of the ABC algorithm is shown in Table 3.
3.3. ABC-BiGRU
In summary, this paper proposes a hybrid model based on the artificial bee colony algorithm and bidirectional gated recurrent unit, namely the ABC-BiGRU model, for accurately estimating the SOH of lithium batteries that overcomes the limitation of the traditional GRU model’s unidirectional information propagation mechanism, which fails to capture the bidirectional dependencies in sequences fully. The BiGRU model trains gated recurrent units in different information propagation directions, simultaneously considering past and future information, better capturing bidirectional dependencies in time series data, and enhancing the model’s fitting capability and prediction accuracy. However, introducing BiGRU also causes some problems. For example, it increases the model’s training cost and time, especially when dealing with large datasets, requiring more computational resources and time for training. Therefore, introducing the ABC intelligent algorithm can compensate for the shortcomings of the BiGRU model, with its outstanding ability to search for hyperparameters and efficient optimization capability that can help the model reach a better state during training, enabling the model to quickly find the optimal combination of hyperparameters, reducing the model’s training time and resource consumption, and avoiding falling into local optimal solutions, thereby improving the model’s generalization ability and stability. Figure 8 shows the architecture of the ABC-BiGRU model.
4. Experimental Process
4.1. Experimental Settings
In this study, we constructed a new SOH prediction model using deep learning techniques, and it was tuned using an artificial bee colony algorithm. To verify the model stability, B0005, B0006, and B0007 from NASA’s publicly available lithium battery cycling dataset were divided into three experimental groups and cross-validated, as detailed in Table 4.
Meanwhile, in order to verify the validity and reliability of the ABC-BiGRU prediction model, we conducted model comparison experiments using M1 (GRU), M2 (LSTM), M3 (BiGRU), M4 (BiGRU based on grid search), and M5 (ABC-BiGRU), as detailed in Table 5. The performance advantages of ABC-BiGRU in the SOH prediction task are compared by analyzing the performance of different types of recurrent neural network models in the SOH prediction task.
To comprehensively capture the time-dependent characteristics in lithium battery cycling data, this paper adopts the sliding window technique to partition the data, aiming to preserve the original structure and temporal continuity of the data. The sliding window has a step size of 1, sliding on the data sequence, and each sliding takes s columns of data as input, where s represents the size of the sliding window. represents the ith column of input data, containing 5 highly correlated health indicators selected and the current SOH status, serving as the input for training the model. The structure of the input and output data is shown in Figure 9. Due to the close correlation between the health status of lithium batteries and their historical data, using a sliding window can ensure that the model captures the evolution of battery health status over time. Sliding a fixed-size window along the time axis allows for the generation of continuous and overlapping subsequences from historical data, aiding the model in better understanding the operation process of the battery and changes in its health status.
4.2. Experimental Steps
To better fit the SOH prediction curve, the experimental process of the ABC-BiGRU model is illustrated in Figure 10, primarily comprising the following four steps.
Step 1: Extract HIs. Conduct correlation analysis on the data and calculate the Pearson coefficient to determine which HIs selected have a significant impact on the degradation of SOH. Then, select the HIs that have a more significant impact on SOH for subsequent model training input features.
Step 2: Data preprocessing. Extract the dataset containing HIs and remove the irrelevant and redundant data. In addition, the data were divided into training and test sets using a sliding window to prepare for subsequent analysis and modeling. Normalize the data to eliminate the dimensional impact among features and accelerate model convergence. This ensures consistency of scales among different features, enhances the training speed of the model, and avoids instability in model training caused by different numerical ranges.
Step 3: Hyperparameter optimization. Employ the artificial bee colony algorithm to optimize the unoptimized BiGRU model to minimize the RMSE model evaluation metric. Conduct a random search in the hyperparameter space to discover the optimal combination of hyperparameters, aiding the model in avoiding local optimal solutions and enhancing model performance.
Step 4: Training and evaluation. Set the optimal hyperparameter combination as the initial hyperparameters of the model and continuously adjust the internal parameters of the BiGRU model through the backpropagation algorithm to minimize the loss function. After training, assess the performance of the model through cross-validation and comparative experiments.
4.3. Evaluation Criteria
In order to comprehensively evaluate the prediction performance of the ABC-BiGRU model, we choose the root mean square error (RMSE), the mean absolute error (MAE), and the coefficient of determination (R2) as the assessment metrics to validate the effectiveness of the model [44].
- (1)
- RMSE is the square root of the average of the squares of the differences between the predicted values and the actual values. A smaller RMSE indicates a minor deviation between the model’s predicted results and the actual values, indicating better predictive performance. The calculation formula is as follows:
- (2)
- MAE is the average of the absolute differences between predicted and actual values. A more petite MAE indicates a more minor average prediction deviation of the model, indicating better predictive performance. The calculation formula is as follows:
- (3)
- R2 measures the degree to which the model describes the total variance, used to express the proportion of change in the dependent variable that changes in the independent variable can elucidate. A value closer to 1 indicates a better fit of the model, meaning that the independent variables have a more substantial explanatory power for the dependent variable.where n is the number of samples, is the actual value of the ith sample, is the predicted value of the ith sample by the model, and is the mean value of the actual values. By calculating and comparing these three indicators, the predictive performance and fitting degree of the model can be comprehensively evaluated, thereby verifying the effectiveness and reliability of the ABC-BiGRU model.
5. Experimental Results and Analysis
5.1. ABC-BiGRU Model Performance
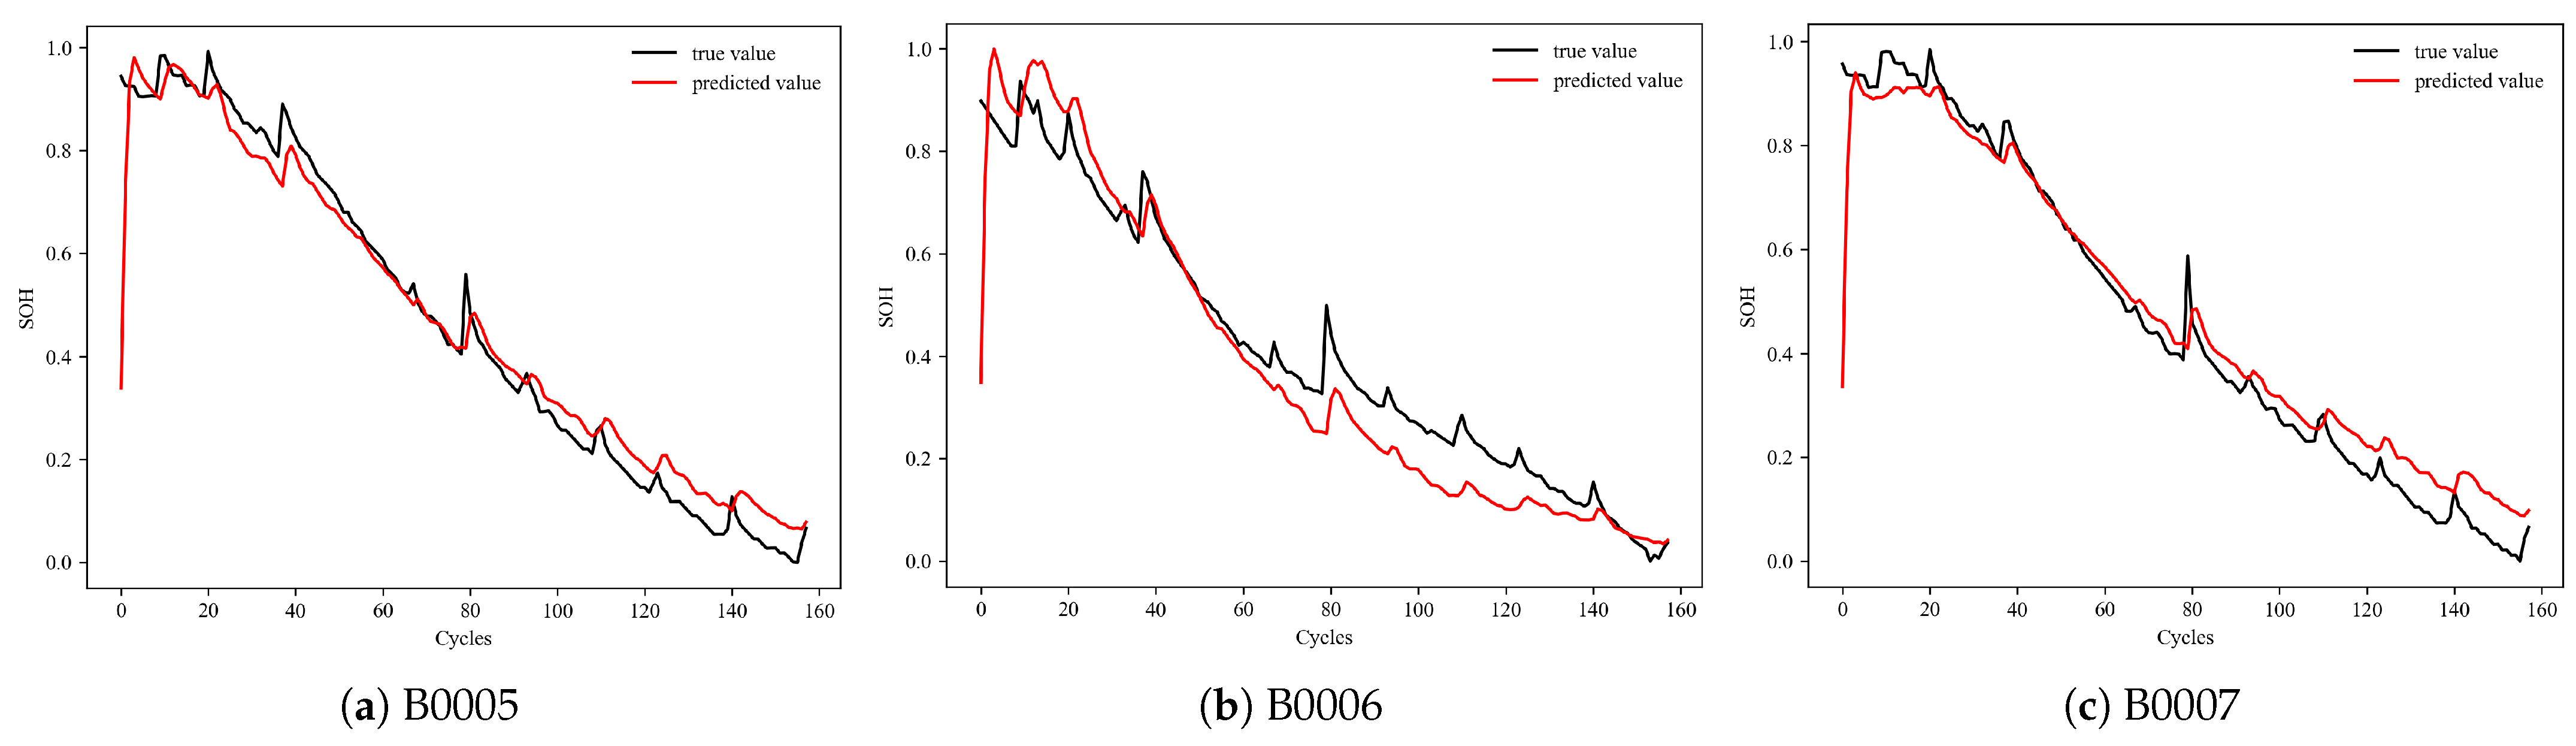
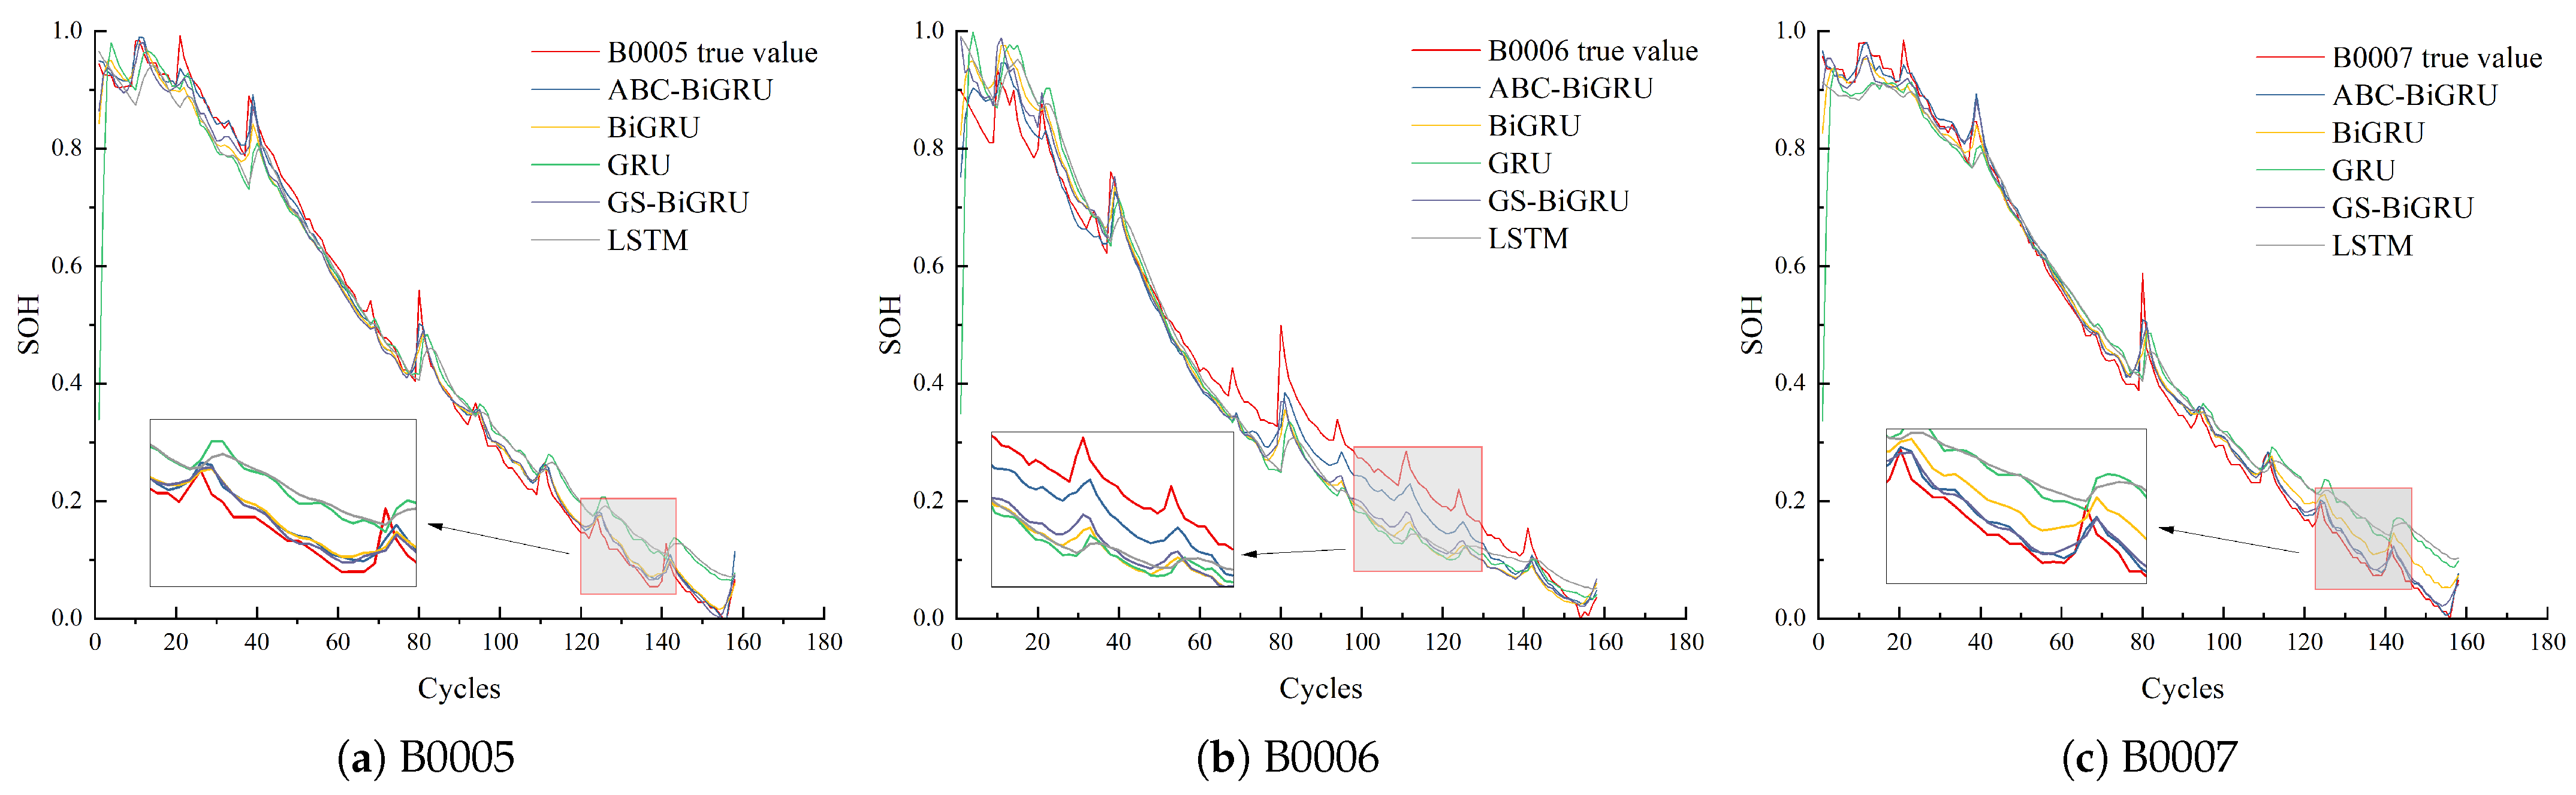
Table 6 displays the performance of the ABC-BiGRU model through cross-validation, while Figure 11 illustrates the prediction results. Moreover, all models in this paper utilized a fixed random seed to ensure the result reproducibility.
It can be observed that models trained with B0005 and B0006 as the input set, B0007 as the validation set, as well as models trained with B0006 and B0007 as the input set, B0005 as the validation set, all demonstrated excellent performance, with three evaluation metrics reaching their minimum values compared to other models. Due to significant differences in the overall trends of B0006 cyclic data compared to B0005 and B0007, models trained with B0007 and B0005 and tested with B0006 yielded relatively poorer performance. However, compared to other baseline models trained with B0007 and B0005, there was still significant performance improvement.
5.2. Comparative Analysis
This study thoroughly validates the experimental results through ablation and comparative experiments. All model results are presented in Table 7, while the comparison of predictive performance among various models is illustrated in Figure 12. The comparison reveals that the bidirectional gated unit based on the artificial bee colony algorithm exhibits the best performance across all sample sets regarding the three evaluation metrics. For example, using the ABC-BiGRU model to predict the B0005 battery, the RMSE is 0.016468789. Compared to using LSTM for prediction, it reduces by 0.029394544, resulting in a 64.1% decrease in error. Compared to GRU for prediction, it reduces by 0.051050016, leading to a 75.6% decrease in error. Compared to the BiGRU optimized using grid search, it still reduces the RMSE by 0.007027448, resulting in a 30.1% decrease in error. Therefore, the ABC-BiGRU model exhibits significant performance advantages in lithium battery SOH prediction tasks.
6. Conclusions
This paper developed a lithium battery SOH prediction model that combines BiGRU and the ABC intelligent optimization algorithm. By studying the NASA lithium battery cycling dataset, we extracted capacity-related HIs from the battery’s electrochemical data and utilized the PCC analysis method to select highly correlated data as input features for the model. Furthermore, time dependence in battery cycle data can be efficiently captured using BiGRU models, enhancing the understanding and predictive capability of battery state changes. Compared to traditional recurrent neural network structures such as RNN and unidirectional GRU, BiGRU can more fully utilize past and future information, thereby improving the model’s predictive performance. Additionally, by combining the global search capability and efficiency of the ABC algorithm, we found the optimal parameter combination in the parameter space, further improving the performance and generalization ability of the model. Experimental results indicate that the proposed model exhibits stable and reliable predictive performance. The ABC-BiGRU model demonstrates significant performance advantages and robustness compared to other recurrent neural network structures.
In future research, we would consider employing different selection methods to choose more suitable HIs. Additionally, we will investigate a more expansive range of battery types and examine additional external environmental factors that impact battery capacity, such as varying temperatures and storage durations on capacity changes.
Author Contributions
Conceptualization, H.L. and C.C.; methodology, H.L.; software, H.L. and G.L.; validation, H.L., J.W. and Z.C.; formal analysis, H.L., C.C. and J.W.; investigation, H.L.; resources, H.L. and G.L.; data curation, H.L. and Z.C.; writing—original draft preparation, H.L.; writing—review and editing, H.L. and L.W.; visualization, H.L.; supervision, C.C.; project administration, H.L.; funding acquisition, C.C. All authors have read and agreed to the published version of the manuscript.
Funding
This work was supported by the Key Laboratory of Philosophy and Social Sciences of Sichuan Province – Key Laboratory of Liquor Intelligent Management and Ecological Decision Optimization in the Upper Reaches of Yangtze River under Grant (No.zdsys-12), and the Key Research Base of Intelligent Tourism in Sichuan Province under Grant (No.ZHYR23-03). This study was supported by the computational support provided by the High Performance Computing Center, School of Computer Science & Engineering, Sichuan University of Science & Engineering.
Data Availability Statement
Data are contained within the article.
Conflicts of Interest
The authors declare no conflicts of interest.
References
- Waseem, M.; Ahmad, M.; Parveen, A.; Suhaib, M. Battery technologies and functionality of battery management system for EVs: Current status, key challenges, and future prospectives. J. Power Sources 2023, 580, 233349. [Google Scholar] [CrossRef]
- Jouhara, H.; Khordehgah, N.; Serey, N.; Almahmoud, S.; Lester, S.P.; Machen, D.; Wrobel, L. Applications and thermal management of rechargeable batteries for industrial applications. Energy 2019, 170, 849–861. [Google Scholar] [CrossRef]
- Zhu, X.; Wang, Z.; Wang, Y.; Wang, H.; Wang, C.; Tong, L.; Yi, M. Overcharge investigation of large format lithium-ion pouch cells with Li(Ni0.6Co0.2Mn0.2)O2 cathode for electric vehicles: Thermal runaway features and safety management method. Energy 2019, 169, 868–880. [Google Scholar] [CrossRef]
- Tsujikawa, T.; Yabuta, K.; Arakawa, M.; Hayashi, K. Safety of large-capacity lithium-ion battery and evaluation of battery system for telecommunications. J. Power Sources 2013, 244, 11–16. [Google Scholar] [CrossRef]
- Wang, Q.; Ping, P.; Zhao, X.; Chu, G.; Sun, J.; Chen, C. Thermal runaway caused fire and explosion of lithium ion battery. J. Power Sources 2012, 208, 210–224. [Google Scholar] [CrossRef]
- Balakrishnan, P.; Ramesh, R.; Prem Kumar, T. Safety mechanisms in lithium-ion batteries. J. Power Sources 2006, 155, 401–414. [Google Scholar] [CrossRef]
- Feng, X.; Ouyang, M.; Liu, X.; Lu, L.; Xia, Y.; He, X. Thermal runaway mechanism of lithium ion battery for electric vehicles: A review. Energy Storage Mater. 2018, 10, 246–267. [Google Scholar] [CrossRef]
- Meng, H.; Li, Y.F. A review on prognostics and health management (PHM) methods of lithium-ion batteries. Renew. Sustain. Energy Rev. 2019, 116, 109405. [Google Scholar] [CrossRef]
- Lai, X.; Yao, J.; Jin, C.; Feng, X.; Wang, H.; Xu, C.; Zheng, Y. A Review of Lithium-Ion Battery Failure Hazards: Test Standards, Accident Analysis, and Safety Suggestions. Batteries 2022, 8, 248. [Google Scholar] [CrossRef]
- Christensen, P.A.; Anderson, P.A.; Harper, G.D.; Lambert, S.M.; Mrozik, W.; Rajaeifar, M.A.; Wise, M.S.; Heidrich, O. Risk management over the life cycle of lithium-ion batteries in electric vehicles. Renew. Sustain. Energy Rev. 2021, 148, 111240. [Google Scholar] [CrossRef]
- Vennam, G.; Sahoo, A.; Ahmed, S. A survey on lithium-ion battery internal and external degradation modeling and state of health estimation. J. Energy Storage 2022, 52, 104720. [Google Scholar] [CrossRef]
- Tian, H.; Qin, P.; Li, K.; Zhao, Z. A review of the state of health for lithium-ion batteries: Research status and suggestions. J. Clean. Prod. 2020, 261, 120813. [Google Scholar] [CrossRef]
- Hu, X.; Feng, F.; Liu, K.; Zhang, L.; Xie, J.; Liu, B. State estimation for advanced battery management: Key challenges and future trends. Renew. Sustain. Energy Rev. 2019, 114, 109334. [Google Scholar] [CrossRef]
- Miguel, E.; Plett, G.L.; Trimboli, M.S.; Oca, L.; Iraola, U.; Bekaert, E. Review of computational parameter estimation methods for electrochemical models. J. Energy Storage 2021, 44, 103388. [Google Scholar] [CrossRef]
- Chen, L.; Xie, S.; Lopes, A.M.; Li, H.; Bao, X.; Zhang, C.; Li, P. A new SOH estimation method for Lithium-ion batteries based on model-data-fusion. Energy 2024, 286, 129597. [Google Scholar] [CrossRef]
- Amir, S.; Gulzar, M.; Tarar, M.O.; Naqvi, I.H.; Zaffar, N.A.; Pecht, M.G. Dynamic Equivalent Circuit Model to Estimate State-of-Health of Lithium-Ion Batteries. IEEE Access 2022, 10, 18279–18288. [Google Scholar] [CrossRef]
- Xu, Z.; Wang, J.; Lund, P.D.; Zhang, Y. Co-estimating the state of charge and health of lithium batteries through combining a minimalist electrochemical model and an equivalent circuit model. Energy 2022, 240, 122815. [Google Scholar] [CrossRef]
- Tran, M.K.; Mathew, M.; Janhunen, S.; Panchal, S.; Raahemifar, K.; Fraser, R.; Fowler, M. A comprehensive equivalent circuit model for lithium-ion batteries, incorporating the effects of state of health, state of charge, and temperature on model parameters. J. Energy Storage 2021, 43, 103252. [Google Scholar] [CrossRef]
- Topan, P.A.; Ramadan, M.N.; Fathoni, G.; Cahyadi, A.I.; Wahyunggoro, O. State of Charge (SOC) and State of Health (SOH) estimation on lithium polymer battery via Kalman filter. In Proceedings of the 2016 2nd International Conference on Science and Technology-Computer (ICST), Yogyakarta, Indonesia, 27–28 October 2016; pp. 93–96. [Google Scholar] [CrossRef]
- Zeng, M.; Zhang, P.; Yang, Y.; Xie, C.; Shi, Y. SOC and SOH Joint Estimation of the Power Batteries Based on Fuzzy Unscented Kalman Filtering Algorithm. Energies 2019, 12, 3122. [Google Scholar] [CrossRef]
- Yang, Q.; Ma, K.; Xu, L.; Song, L.; Li, X.; Li, Y. A Joint Estimation Method Based on Kalman Filter of Battery State of Charge and State of Health. Coatings 2022, 12, 1047. [Google Scholar] [CrossRef]
- Ranga, M.R.; Aduru, V.R.; Krishna, N.V.; Rao, K.D.; Dawn, S.; Alsaif, F.; Alsulamy, S.; Ustun, T.S. An Unscented Kalman Filter-Based Robust State of Health Prediction Technique for Lithium Ion Batteries. Batteries 2023, 9, 376. [Google Scholar] [CrossRef]
- Zhu, F.; Fu, J. A Novel State-of-Health Estimation for Lithium-Ion Battery via Unscented Kalman Filter and Improved Unscented Particle Filter. IEEE Sens. J. 2021, 21, 25449–25456. [Google Scholar] [CrossRef]
- Rossi, C.; Falcomer, C.; Biondani, L.; Pontara, D. Genetically Optimized Extended Kalman Filter for State of Health Estimation Based on Li-Ion Batteries Parameters. Energies 2022, 15, 3404. [Google Scholar] [CrossRef]
- Liu, S.; Dong, X.; Yu, X.; Ren, X.; Zhang, J.; Zhu, R. A method for state of charge and state of health estimation of lithium-ion battery based on adaptive unscented Kalman filter. Energy Rep. 2022, 8, 426–436. [Google Scholar] [CrossRef]
- Ge, M.F.; Liu, Y.; Jiang, X.; Liu, J. A review on state of health estimations and remaining useful life prognostics of lithium-ion batteries. Measurement 2021, 174, 109057. [Google Scholar] [CrossRef]
- Zou, Y.; Lin, Z.; Li, D.; Liu, Z. Advancements in Artificial Neural Networks for health management of energy storage lithium-ion batteries: A comprehensive review. J. Energy Storage 2023, 73, 109069. [Google Scholar] [CrossRef]
- Zhang, L.; Ji, T.; Yu, S.; Liu, G. Accurate Prediction Approach of SOH for Lithium-Ion Batteries Based on LSTM Method. Batteries 2023, 9, 177. [Google Scholar] [CrossRef]
- Zhang, D.; Zhao, W.; Wang, L.; Chang, X.; Li, X.; Wu, P. Evaluation of the State of Health of Lithium-Ion Battery Based on the Temporal Convolution Network. Front. Energy Res. 2022, 10, 929235. [Google Scholar] [CrossRef]
- Li, R.; Li, W.; Zhang, H.; Zhou, Y.; Tian, W. On-Line Estimation Method of Lithium-Ion Battery Health Status Based on PSO-SVM. Front. Energy Res. 2021, 9, 693249. [Google Scholar] [CrossRef]
- Song, S.; Fei, C.; Xia, H. Lithium-Ion Battery SOH Estimation Based on XGBoost Algorithm with Accuracy Correction. Energies 2020, 13, 812. [Google Scholar] [CrossRef]
- Jia, J.; Liang, J.; Shi, Y.; Wen, J.; Pang, X.; Zeng, J. SOH and RUL Prediction of Lithium-Ion Batteries Based on Gaussian Process Regression with Indirect Health Indicators. Energies 2020, 13, 375. [Google Scholar] [CrossRef]
- Chen, C.; Wei, J.; Li, Z. Remaining Useful Life Prediction for Lithium-Ion Batteries Based on a Hybrid Deep Learning Model. Processes 2023, 11, 2333. [Google Scholar] [CrossRef]
- Saha, B.; Goebel, K. “Battery Data Set”, NASA Prognostics Data Repository; NASA Ames Research Center: Moffett Field, CA, USA, 2007.
- Zhou, W.; Lu, Q.; Zheng, Y. Review on the Selection of Health Indicator for Lithium Ion Batteries. Machines 2022, 10, 512. [Google Scholar] [CrossRef]
- Hou, Z.; Xu, W.; Jia, G.; Wang, J.; Cai, M. Estimation of SOH of Lithium-Ion Batteries Based on PSO-Bi GRU-Attention Network. J. Electrochem. Soc. 2024, 171, 020550. [Google Scholar] [CrossRef]
- Cho, K.; van Merrienboer, B.; Gulcehre, C.; Bahdanau, D.; Bougares, F.; Schwenk, H.; Bengio, Y. Learning Phrase Representations using RNN Encoder-Decoder for Statistical Machine Translation. arXiv 2014, arXiv:1406.1078. [Google Scholar]
- Yang, S.; Yu, X.; Zhou, Y. LSTM and GRU Neural Network Performance Comparison Study: Taking Yelp Review Dataset as an Example. In Proceedings of the 2020 International Workshop on Electronic Communication and Artificial Intelligence (IWECAI), Shanghai, China, 12–14 June 2020; pp. 98–101. [Google Scholar] [CrossRef]
- AÇIKKAR, M. Fast grid search: A grid search-inspired algorithm for optimizing hyperparameters of support vector regression. Turk. J. Electr. Eng. Comput. Sci. 2024, 32, 68–92. [Google Scholar] [CrossRef]
- Wang, Y.; Ni, Y.; Lu, S.; Wang, J.; Zhang, X. Remaining Useful Life Prediction of Lithium-Ion Batteries Using Support Vector Regression Optimized by Artificial Bee Colony. IEEE Trans. Veh. Technol. 2019, 68, 9543–9553. [Google Scholar] [CrossRef]
- Karaboga, D.; Basturk, B. On the performance of artificial bee colony (ABC) algorithm. Appl. Soft Comput. 2008, 8, 687–697. [Google Scholar] [CrossRef]
- Chen, K.; Liao, Q.; Liu, K.; Yang, Y.; Gao, G.; Wu, G. Capacity degradation prediction of lithium-ion battery based on artificial bee colony and multi-kernel support vector regression. J. Energy Storage 2023, 72, 108160. [Google Scholar] [CrossRef]
- Zhou, J.; Yao, X.; Chan, F.T.; Lin, Y.; Jin, H.; Gao, L.; Wang, X. An individual dependent multi-colony artificial bee colony algorithm. Inf. Sci. 2019, 485, 114–140. [Google Scholar] [CrossRef]
- Strušnik, D.; Avsec, J. Exergoeconomic machine-learning method of integrating a thermochemical Cu–Cl cycle in a multigeneration combined cycle gas turbine for hydrogen production. Int. J. Hydrogen Energy 2022, 47, 17121–17149. [Google Scholar] [CrossRef]
Figure 1.
Battery capacity changes with cycle times.

Figure 2.
Changes in the discharge voltage of batteries with different cycle numbers over time.

Figure 3.
Changes in the discharge temperature of batteries with different cycle numbers over time.

Figure 4.
Pearson correlation coefficient heatmap.

Figure 5.
Single GRU structure.

Figure 6.
Comparison between GRU model prediction results and actual values.

Figure 7.
BiGRU structure.

Figure 8.
Architecture of the ABC-BiGRU model.

Figure 9.
Sliding window.

Figure 10.
Process of SOH prediction using ABC-BiGRU.

Figure 11.
Comparison between BiGRU model prediction results and actual values.

Figure 12.
Comparison of errors among different models.


Table 1.
Battery cycle data parameters.
| Battery | Charge Current/A | Charge Voltage/V | Charge Cutoff Current/mA | Discharge Current/A | Discharge Cutoff Voltage/V | Rated Capacity/Ah |
|---|---|---|---|---|---|---|
| B0005 | 1.5 | 4.2 | 20 | 2 | 2.7 | 2 |
| B0006 | 1.5 | 4.2 | 20 | 2 | 2.5 | 2 |
| B0007 | 1.5 | 4.2 | 20 | 2 | 2.2 | 2 |
Table 2.
HIs and their correlation coefficients.
| Charge HIs | Correlation Coefficient | Discharge HIs | Correlation Coefficient |
|---|---|---|---|
| CD | −0.286117 | DD | 0.948277 |
| ACT | 0.111535 | ADT | −0.781264 |
| CPT | 0.149684 | DPT | −0.771028 |
| ACV | −0.827478 | ADV | 0.887130 |
| CPV | 0.334212 | DPV | 0.127640 |
Table 3.
Initial parameters of ABC optimization algorithm.
| Params | Value |
|---|---|
| Population Size | 20 |
| Learning Rate Range | [0.01, 0.0001] |
| Hidden Size Range | [16, 128] |
| Maximum Iterations | 30 |
| Objective Function | RMSE |
Table 4.
Experimental group.
| Train Data | Test Data |
|---|---|
| B0006, B0007 | B0005 |
| B0007, B0005 | B0006 |
| B0005, B0006 | B0007 |
Table 5.
Experimental results comparison model.
| Model | Details |
|---|---|
| M1 | GRU |
| M2 | LSTM |
| M3 | BiGRU |
| M4 | GS-BiGRU |
| M5 | ABC-BiGRU |
Table 6.
ABC-BiGRU model performance.
| Model | Train Data | Test Data | RMSE | MAE | R2 |
|---|---|---|---|---|---|
| ABC-BiGRU | B0006, B0007 | B0005 | 0.016468 | 0.013015 | 0.997391 |
| B0007, B0005 | B0006 | 0.040698 | 0.033586 | 0.975761 | |
| B0005, B0006 | B0007 | 0.016856 | 0.013511 | 0.997109 |
Table 7.
Comparative experimental results.
| Model | Train Data | Test Data | RMSE | MAE | R2 |
|---|---|---|---|---|---|
| M1 | B0006, B0007 | B0005 | 0.067518 | 0.041553 | 0.956152 |
| B0007, B0005 | B0006 | 0.084081 | 0.062595 | 0.896789 | |
| B0005, B0006 | B0007 | 0.071553 | 0.044247 | 0.947920 | |
| M2 | B0006, B0007 | B0005 | 0.045863 | 0.036546 | 0.979768 |
| B0007, B0005 | B0006 | 0.067998 | 0.056578 | 0.932496 | |
| B0005, B0006 | B0007 | 0.050060 | 0.040486 | 0.974508 | |
| M3 | B0006, B0007 | B0005 | 0.026747 | 0.019499 | 0.993118 |
| B0007, B0005 | B0006 | 0.055819 | 0.048749 | 0.954512 | |
| B0005, B0006 | B0007 | 0.022451 | 0.016103 | 0.994872 | |
| M4 | B0006, B0007 | B0005 | 0.023826 | 0.018451 | 0.994539 |
| B0007, B0005 | B0006 | 0.044727 | 0.037742 | 0.970794 | |
| B0005, B0006 | B0007 | 0.021127 | 0.015861 | 0.995459 | |
| M5 | B0006, B0007 | B0005 | 0.016468 | 0.013015 | 0.997391 |
| B0007, B0005 | B0006 | 0.040698 | 0.033586 | 0.975761 | |
| B0005, B0006 | B0007 | 0.016856 | 0.013511 | 0.997109 |
Disclaimer/Publisher’s Note: The statements, opinions and data contained in all publications are solely those of the individual author(s) and contributor(s) and not of MDPI and/or the editor(s). MDPI and/or the editor(s) disclaim responsibility for any injury to people or property resulting from any ideas, methods, instructions or products referred to in the content. |
© 2024 by the authors. Licensee MDPI, Basel, Switzerland. This article is an open access article distributed under the terms and conditions of the Creative Commons Attribution (CC BY) license (https://creativecommons.org/licenses/by/4.0/).
Share and Cite
MDPI and ACS Style
Li, H.; Chen, C.; Wei, J.; Chen, Z.; Lei, G.; Wu, L. State of Health (SOH) Estimation of Lithium-Ion Batteries Based on ABC-BiGRU. Electronics 2024, 13, 1675. https://doi.org/10.3390/electronics13091675
AMA Style
Li H, Chen C, Wei J, Chen Z, Lei G, Wu L. State of Health (SOH) Estimation of Lithium-Ion Batteries Based on ABC-BiGRU. Electronics. 2024; 13(9):1675. https://doi.org/10.3390/electronics13091675
Chicago/Turabian StyleLi, Hao, Chao Chen, Jie Wei, Zhuo Chen, Guangzhou Lei, and Lingling Wu. 2024. "State of Health (SOH) Estimation of Lithium-Ion Batteries Based on ABC-BiGRU" Electronics 13, no. 9: 1675. https://doi.org/10.3390/electronics13091675
Note that from the first issue of 2016, this journal uses article numbers instead of page numbers. See further details here.