Article

High Performance Graphene-Based Electrochemical Double Layer Capacitors Using 1-Butyl-1-methylpyrrolidinium tris (pentafluoroethyl) trifluorophosphate Ionic Liquid as an Electrolyte

1
Department of Physics, Southern Illinois University, Carbondale, IL 62901, USA
2
National Synchrotron Radiation Laboratory, University of Science and Technology of China, Hefei 230029, China
3
Department of Physics, Northeastern University, Boston, MA 02115, USA
*
Author to whom correspondence should be addressed.
J.D.H. and M.W. contributed equally to this work.
Electronics 2018, 7(10), 229; https://doi.org/10.3390/electronics7100229
Submission received: 6 August 2018 / Revised: 7 September 2018 / Accepted: 29 September 2018 / Published: 2 October 2018
(This article belongs to the Special Issue Nanoelectronic Materials, Devices and Modeling)

Abstract

:
There are several advantages to developing electrochemical double-layer capacitors (EDLC) or supercapacitors with high specific energy densities, for example, these can be used in applications related to quality power generation, voltage stabilization, and frequency regulation. In this regard, ionic liquids capable of providing a higher voltage window of operations compared to an aqueous and/or polymer electrolyte can significantly enhance the specific energy densities of EDLCs. Here we demonstrate that EDLCs fabricated using ionic liquid 1-butyl-1-methylpyrrolidinium tris (pentafluoroethyl) trifluorophosphate (BMP-FAP) as an electrolyte and few layer liquid-phase exfoliated graphene as electrodes show remarkable performance compared to EDLC devices fabricated with aqueous potassium hydroxide (6M) as well as widely used ionic liquid 1-butyl-3-methylimidazolium hexafluorophosphate (BMIM-PF6). We found that graphene EDLC’s with BMP-FAP as an electrolyte possess a high specific energy density of ≈25 Wh/kg along with specific capacitance values as high as 200 F/g and having an operating voltage windows of >5 volts with a rapid charge transfer response. These findings strongly indicate the suitability of BMP-FAP as a good choice of electrolyte for high energy density EDLC devices.

1. Introduction

The ever-increasing energy storage needs of the world have presented a complex puzzle for energy scientists of all types. The large amount of energy desired to be stored in order to keep up with “dead zones” within the varied energy production methods (e.g., at night for solar energy) would suggest batteries as an ideal local component for the storage. They, however, cannot always meet the power demands of the energy sources. The power variance of the energy sources suggests a device with a large capability for handling high power output would be necessary, such as a capacitor. However, capacitors do not meet the stringent energy requirements of alternative energy as they would too quickly reach capacity. Clearly, it is imperative that a device capably handles both high energy and high-power output [1,2,3,4]; however, that is still not enough. In order to keep lifetime maintenance costs down and remain competitive, the device in question must be able to survive unmaintained for thousands if not tens of thousands or more full cycles. Electrochemical double-layer capacitors (aka EDLC/supercapacitor/ultracapacitor), composed of two electrodes separated by a porous membrane and soaked in an electrolyte sandwiched between current collectors, exhibit strong performance in all of these aspects [2]. Their range of energy densities typically outperforms traditional capacitors by 1–2 orders of magnitude. At the same time, their range of power densities outperforms batteries by 1–2 orders of magnitude [5]. Additionally, a vast majority of EDLC devices tested exhibit extraordinary lifecycles, where typically 80% or greater maximum capacitive behavior is retained even after tens of thousands of cycles or more. These behaviors perfectly place them in an ideal position to manage a vast variety of devices powered through alternative energy means, and to continue doing so without outside intervention or maintenance for extended periods of time [1,2,3,4].
In the recent past carbon-based materials [6], 2-D nanomaterials [7,8], conductive metal organic frameworks (MOFs) [9], as well as redox-active polymers [10], have been investigated as electrical energy storage systems/EDLCs. Among them, carbon-based materials (carbon nanotubes [2,11,12,13,14], graphene [15,16,17,18,19,20,21], activated carbon [2,5,22], hybrid structures [23,24,25], etc.) are preferred electrode materials for EDLC devices due to their high conductivity, low reactivity and extremely high specific surface area [2]. Past studies have shown that several electrolytes, for example, aqueous, polymer and ionic liquid electrolytes are suitable for carbon-based EDLC devices. However, an inherent technological bottleneck in carbon-based ELDC devices fabricated with aqueous, polymer and widely used ionic liquids, for example, 1-butyl-3-methylimidazolium hexafluorophosphate (BMIM)(PF6) electrolyte is in their limited operating voltage windows, which leads to low energy densities. The choice of electrolyte to be used in EDLCs, therefore, is crucial since the nature of the electrolyte can substantially enhance the performance of these devices.
In the choice of electrolyte lies a myriad of questions, each with different optimal answers. A balance must be struck between operating temperature, operating potential, electrochemical stability, conductivity, viscosity and ion size. Ionic liquids have become the preferred electrolyte due in no small part to their much wider operating potential windows and chemical stability [20,21]. This wider operating potential allows for the devices prepared from these samples to be used in a much more varied range of applications. Due to the issue of electrolysis with aqueous solutions, most are limited in range to 1 V. 1-Butyl-1-methylpyrrolidinium tris (pentafluoroethyl) trifluorophosphate (BMP-FAP) is a particularly good choice with its far wider 6.6–6.8 V window [26,27]. It will be discussed later that this full window is not entirely available for completely reversible charging and discharging, but it will be shown that even if a portion of this window is used, the devices will outperform standard aqueous electrolyte devices by a significant margin. BMP-FAP is also ideal in its chemical stability with smaller Faradaic peaks potentially being associated with impurities, rather than the breakdown of the electrolyte itself [26]. In contrast to aqueous electrolytes, the temperature stability of BMP-FAP allows for use within a wider range of temperatures, approximately −50 °C to ≈250–277 °C [26,27]. This widening of the allowable circumstances presents a strong argument for their use in extreme applications, such as military, space, and explorative research.
The liquid-phase exfoliation method in particular is ideal for exploratory testing of varying parameters such as this in devices as the production methods are quick and simple and produce consistent, few-layer dispersions of similarly-sized flakes. From this stage, the devices could be further improved through the use of functionalized materials, heterostructures or composite materials as electrodes. Here we demonstrate, that EDLCs fabricated using ionic liquid BMP-FAP as an electrolyte and few-layer liquid-phase exfoliated graphene (LPEG) as electrodes show remarkable performance compared to EDLC devices fabricated with aqueous 6 M potassium hydroxide (KOH), as well as widely used ionic liquid BMIM-PF6. Our results indicate that simple LPEG EDLCs utilizing BMP-FAP show an energy density of ≈25 Wh/kg which is on par with aqueous results for more complex electrode materials [28,29], while demonstrating power densities as much as 2 to nearly 5 times higher.

2. Materials and Methods

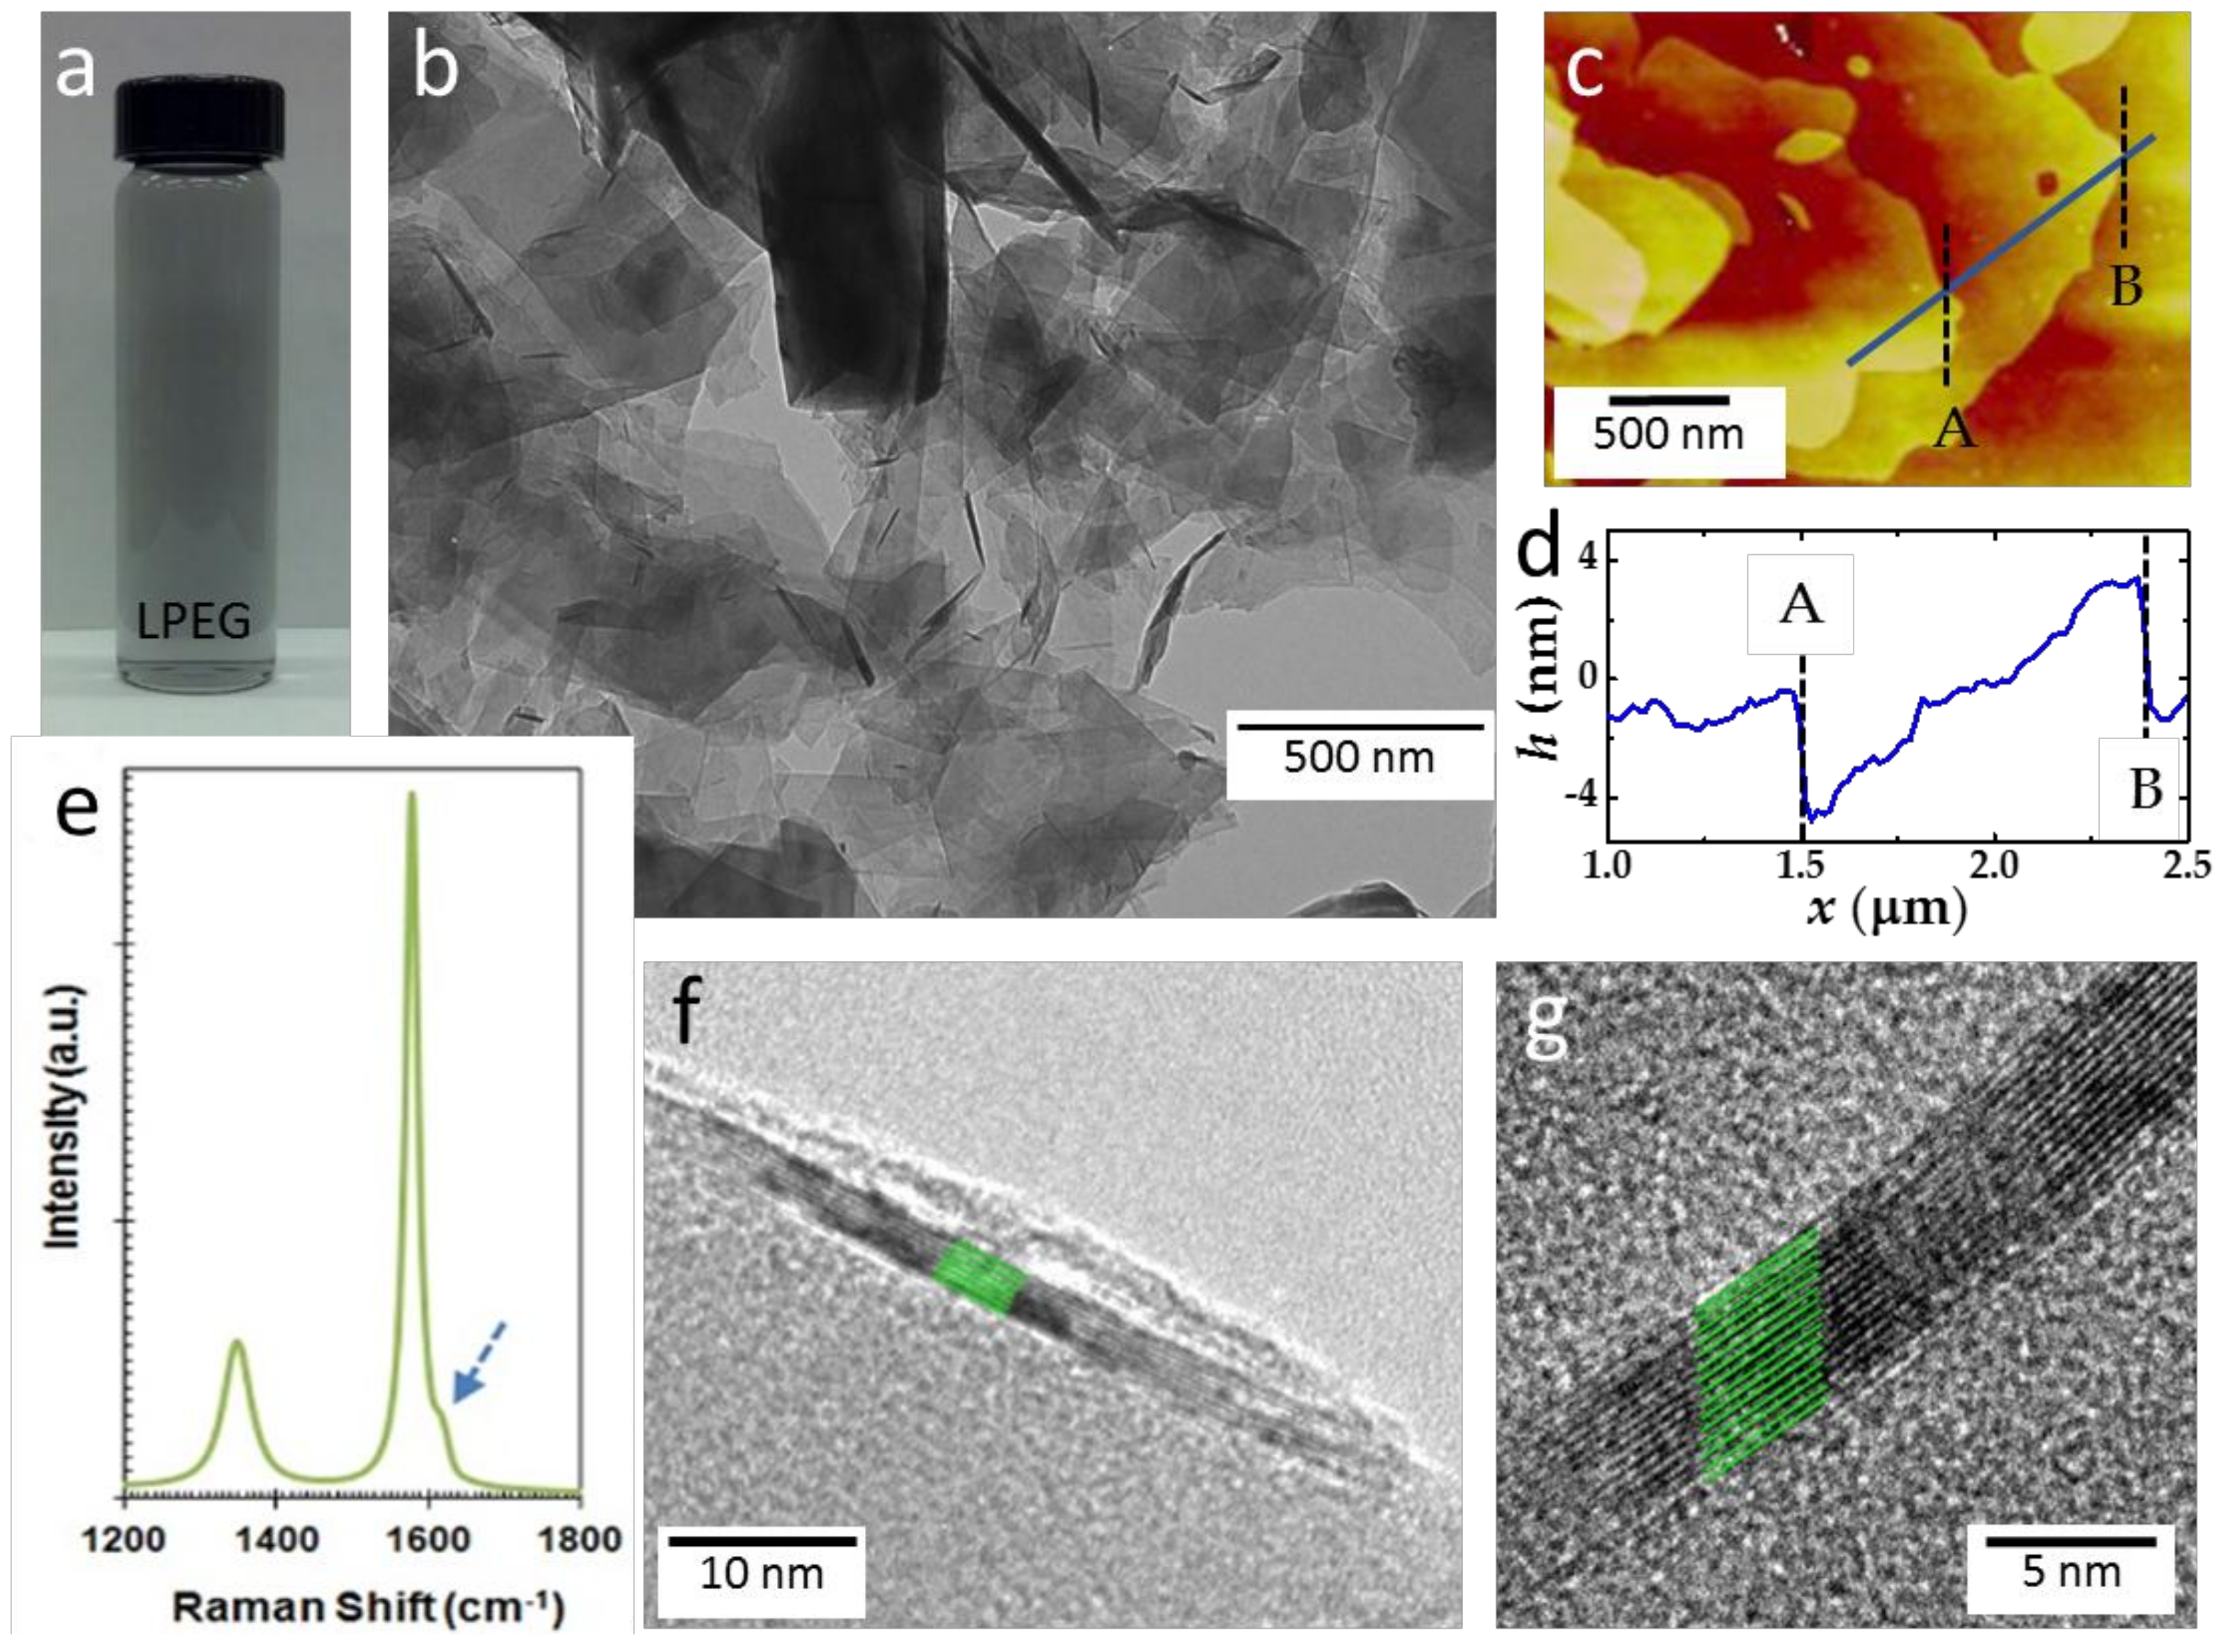
2.1. Structural Characterizations

The graphene samples for preparing the EDLC electrodes were obtained using a liquid-phase exfoliation technique, described in detail in the Supplementary Materials. In Figure 1, typical structural and spectroscopic characterization of the LPEG is shown. In Figure 1a, a digital image of a well-dispersed vial of LPEG in isopropyl alcohol (IPA) is shown. Figure 1b shows a typical transmission electron microscopy (TEM) image of a collection of few-layer graphene flakes. In Figure 1c, an atomic force microscopy (AFM) image of a thin film of the LPEG flakes (prepared on SiO2 wafers via spin-coating) is shown. Detailed scans of various portions of this film showed that the flake step heights ranged from ≈2.7 nm to ≈5.2 nm (Figure 1d), which correspond approximately to ≈8–15 layers of graphene flakes assuming the van der Waals separation to be ≈0.335 nm for graphite [30]. This correlates well with the high resolution-transmission electron microscopy (HR-TEM) data in Figure 1f,g where 7 and 15 layers can be clearly identified. In Figure 1e, Raman measurement performed on films of LPEG is shown. Raman spectra serves as a useful tool for analyzing different carbon-based materials and can give significant insights about the quality of the samples. Samples for Raman measurements were also prepared using a spin-coating method onto SiO2 wafers. Raman measurements were performed using 12 mW laser power at 532 nm, with five scans of 60 s being averaged for the LPEG samples. The D peak at 1356 cm−1 corresponding to the defect band of graphite, as well as a strong graphitic (E2g) G peak at 1578 cm−1, was observed in the LPEG samples. Additionally, a D’ peak at 1620 cm−1 was also observed in the LPEG samples (Note: this peak was absent in the un-exfoliated graphite powder, data not shown) perhaps due to edge defects generated by the sonication process used for exfoliation [31].

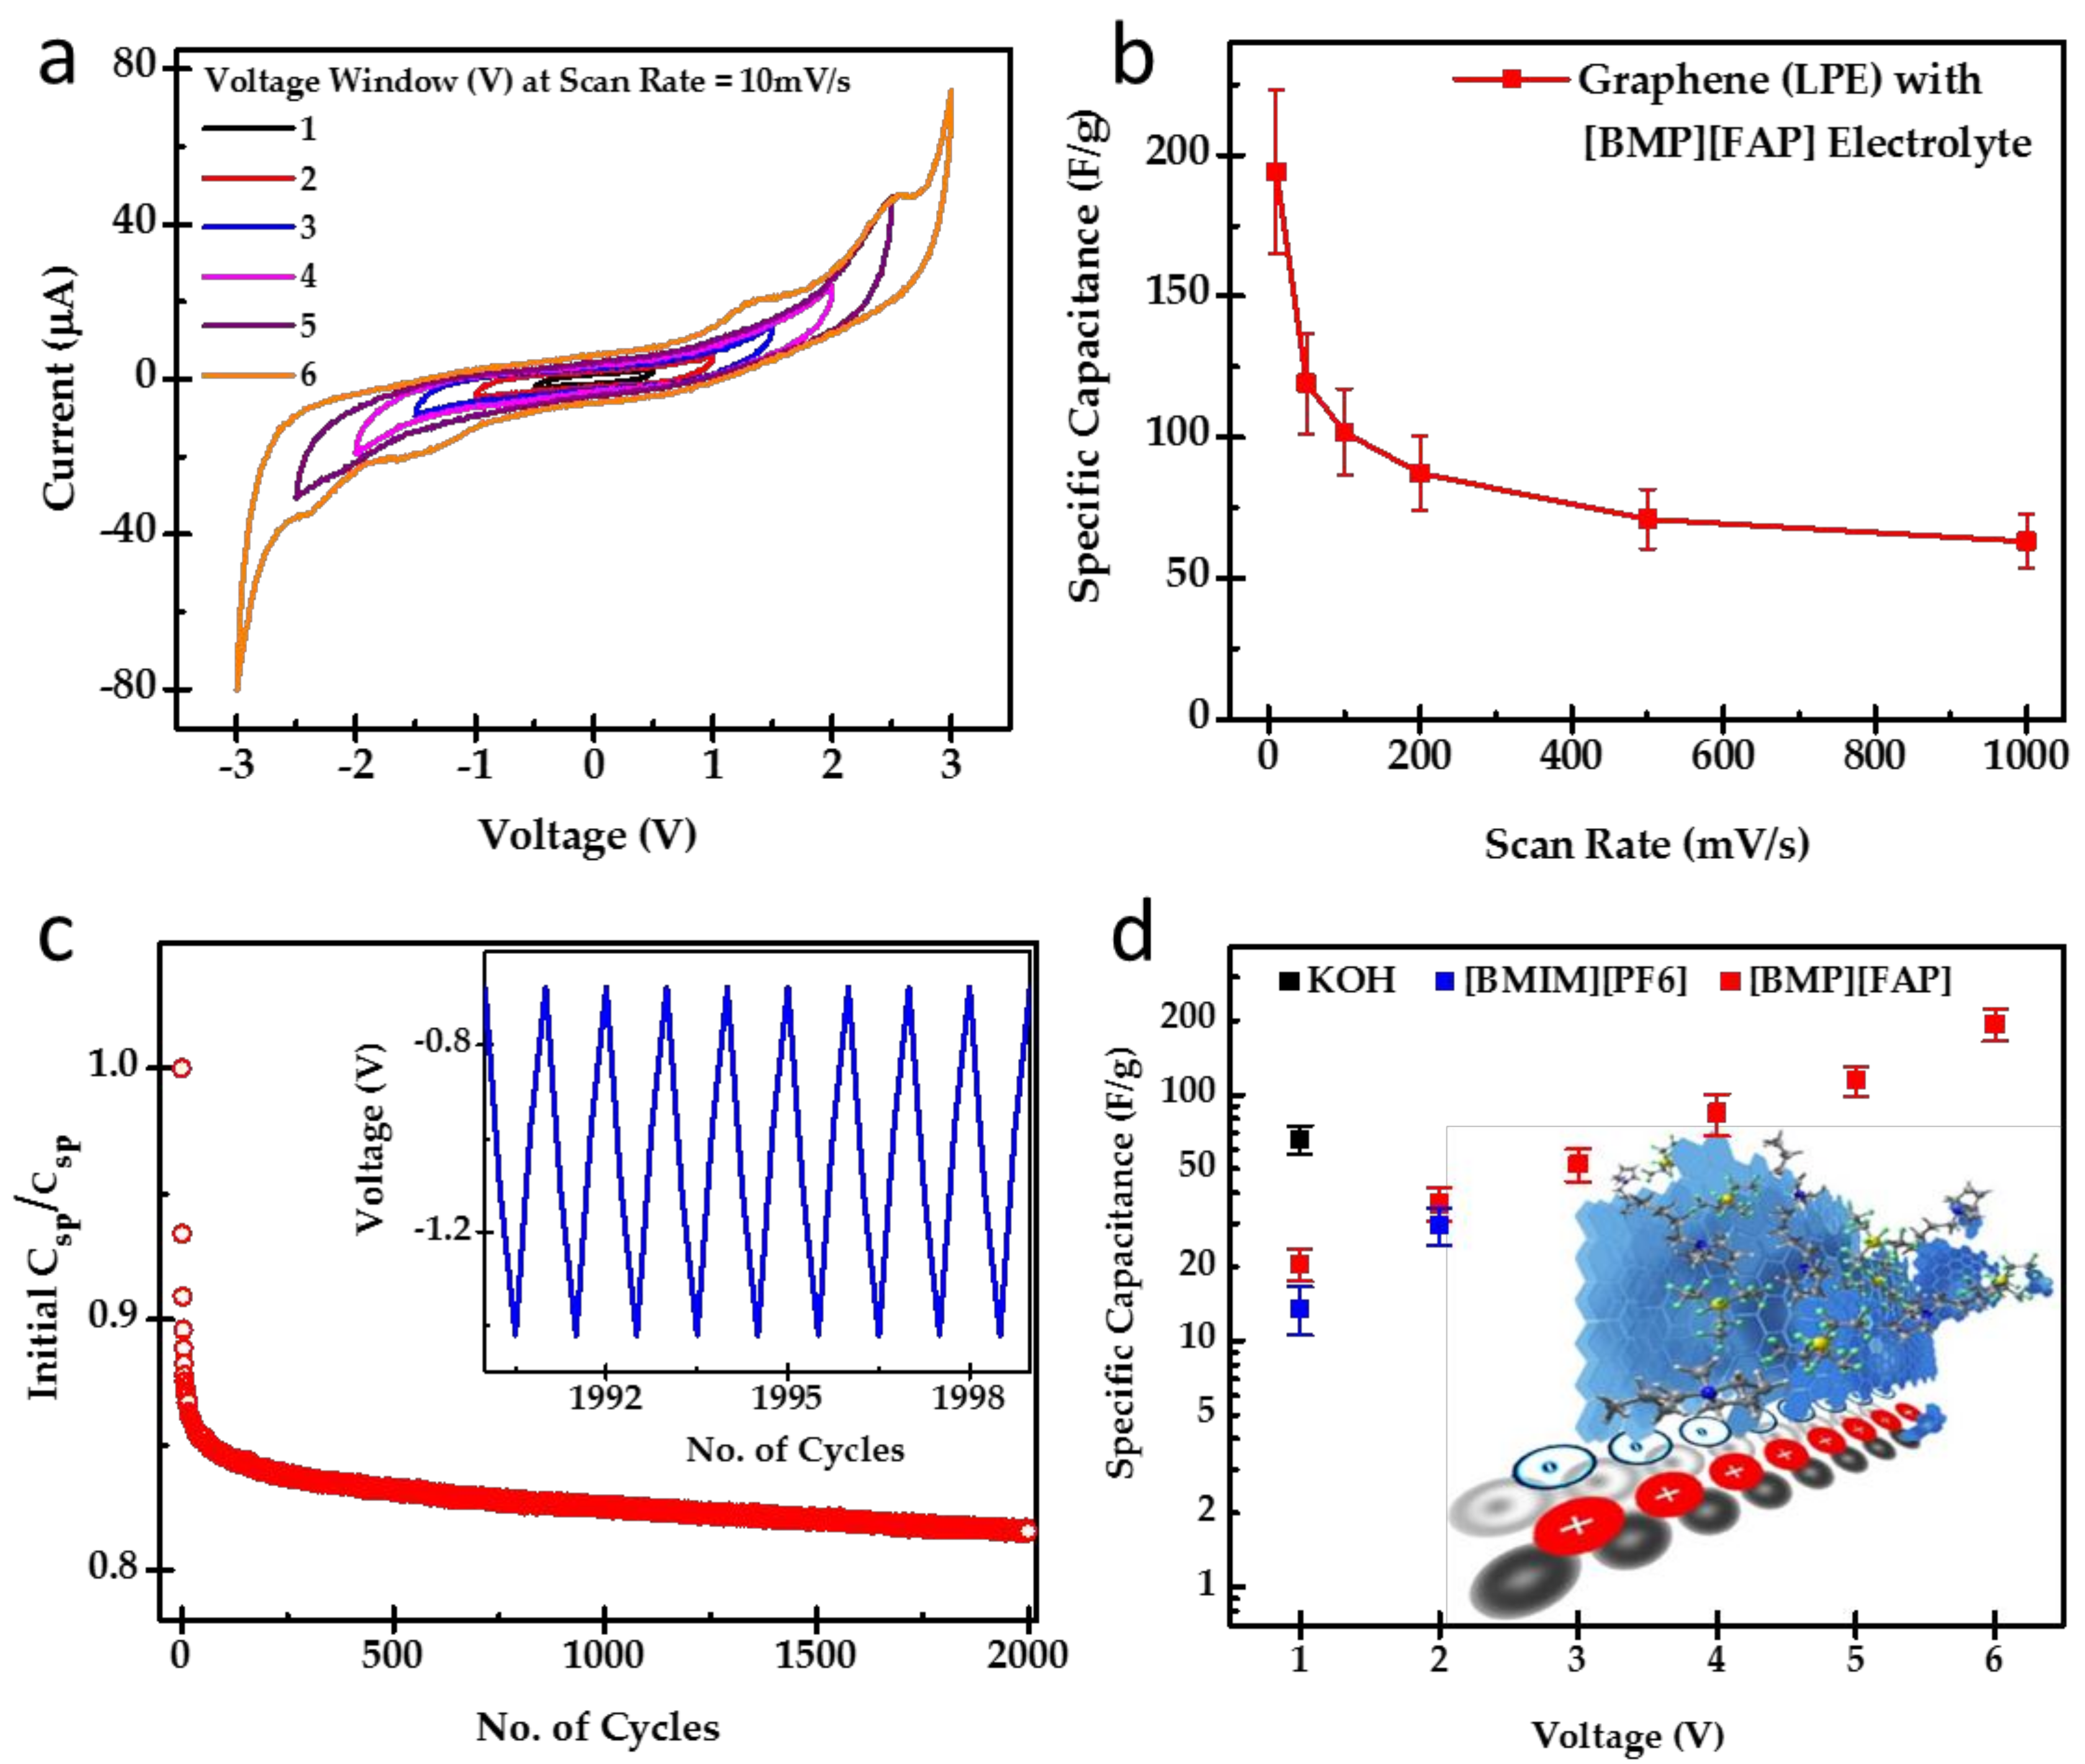
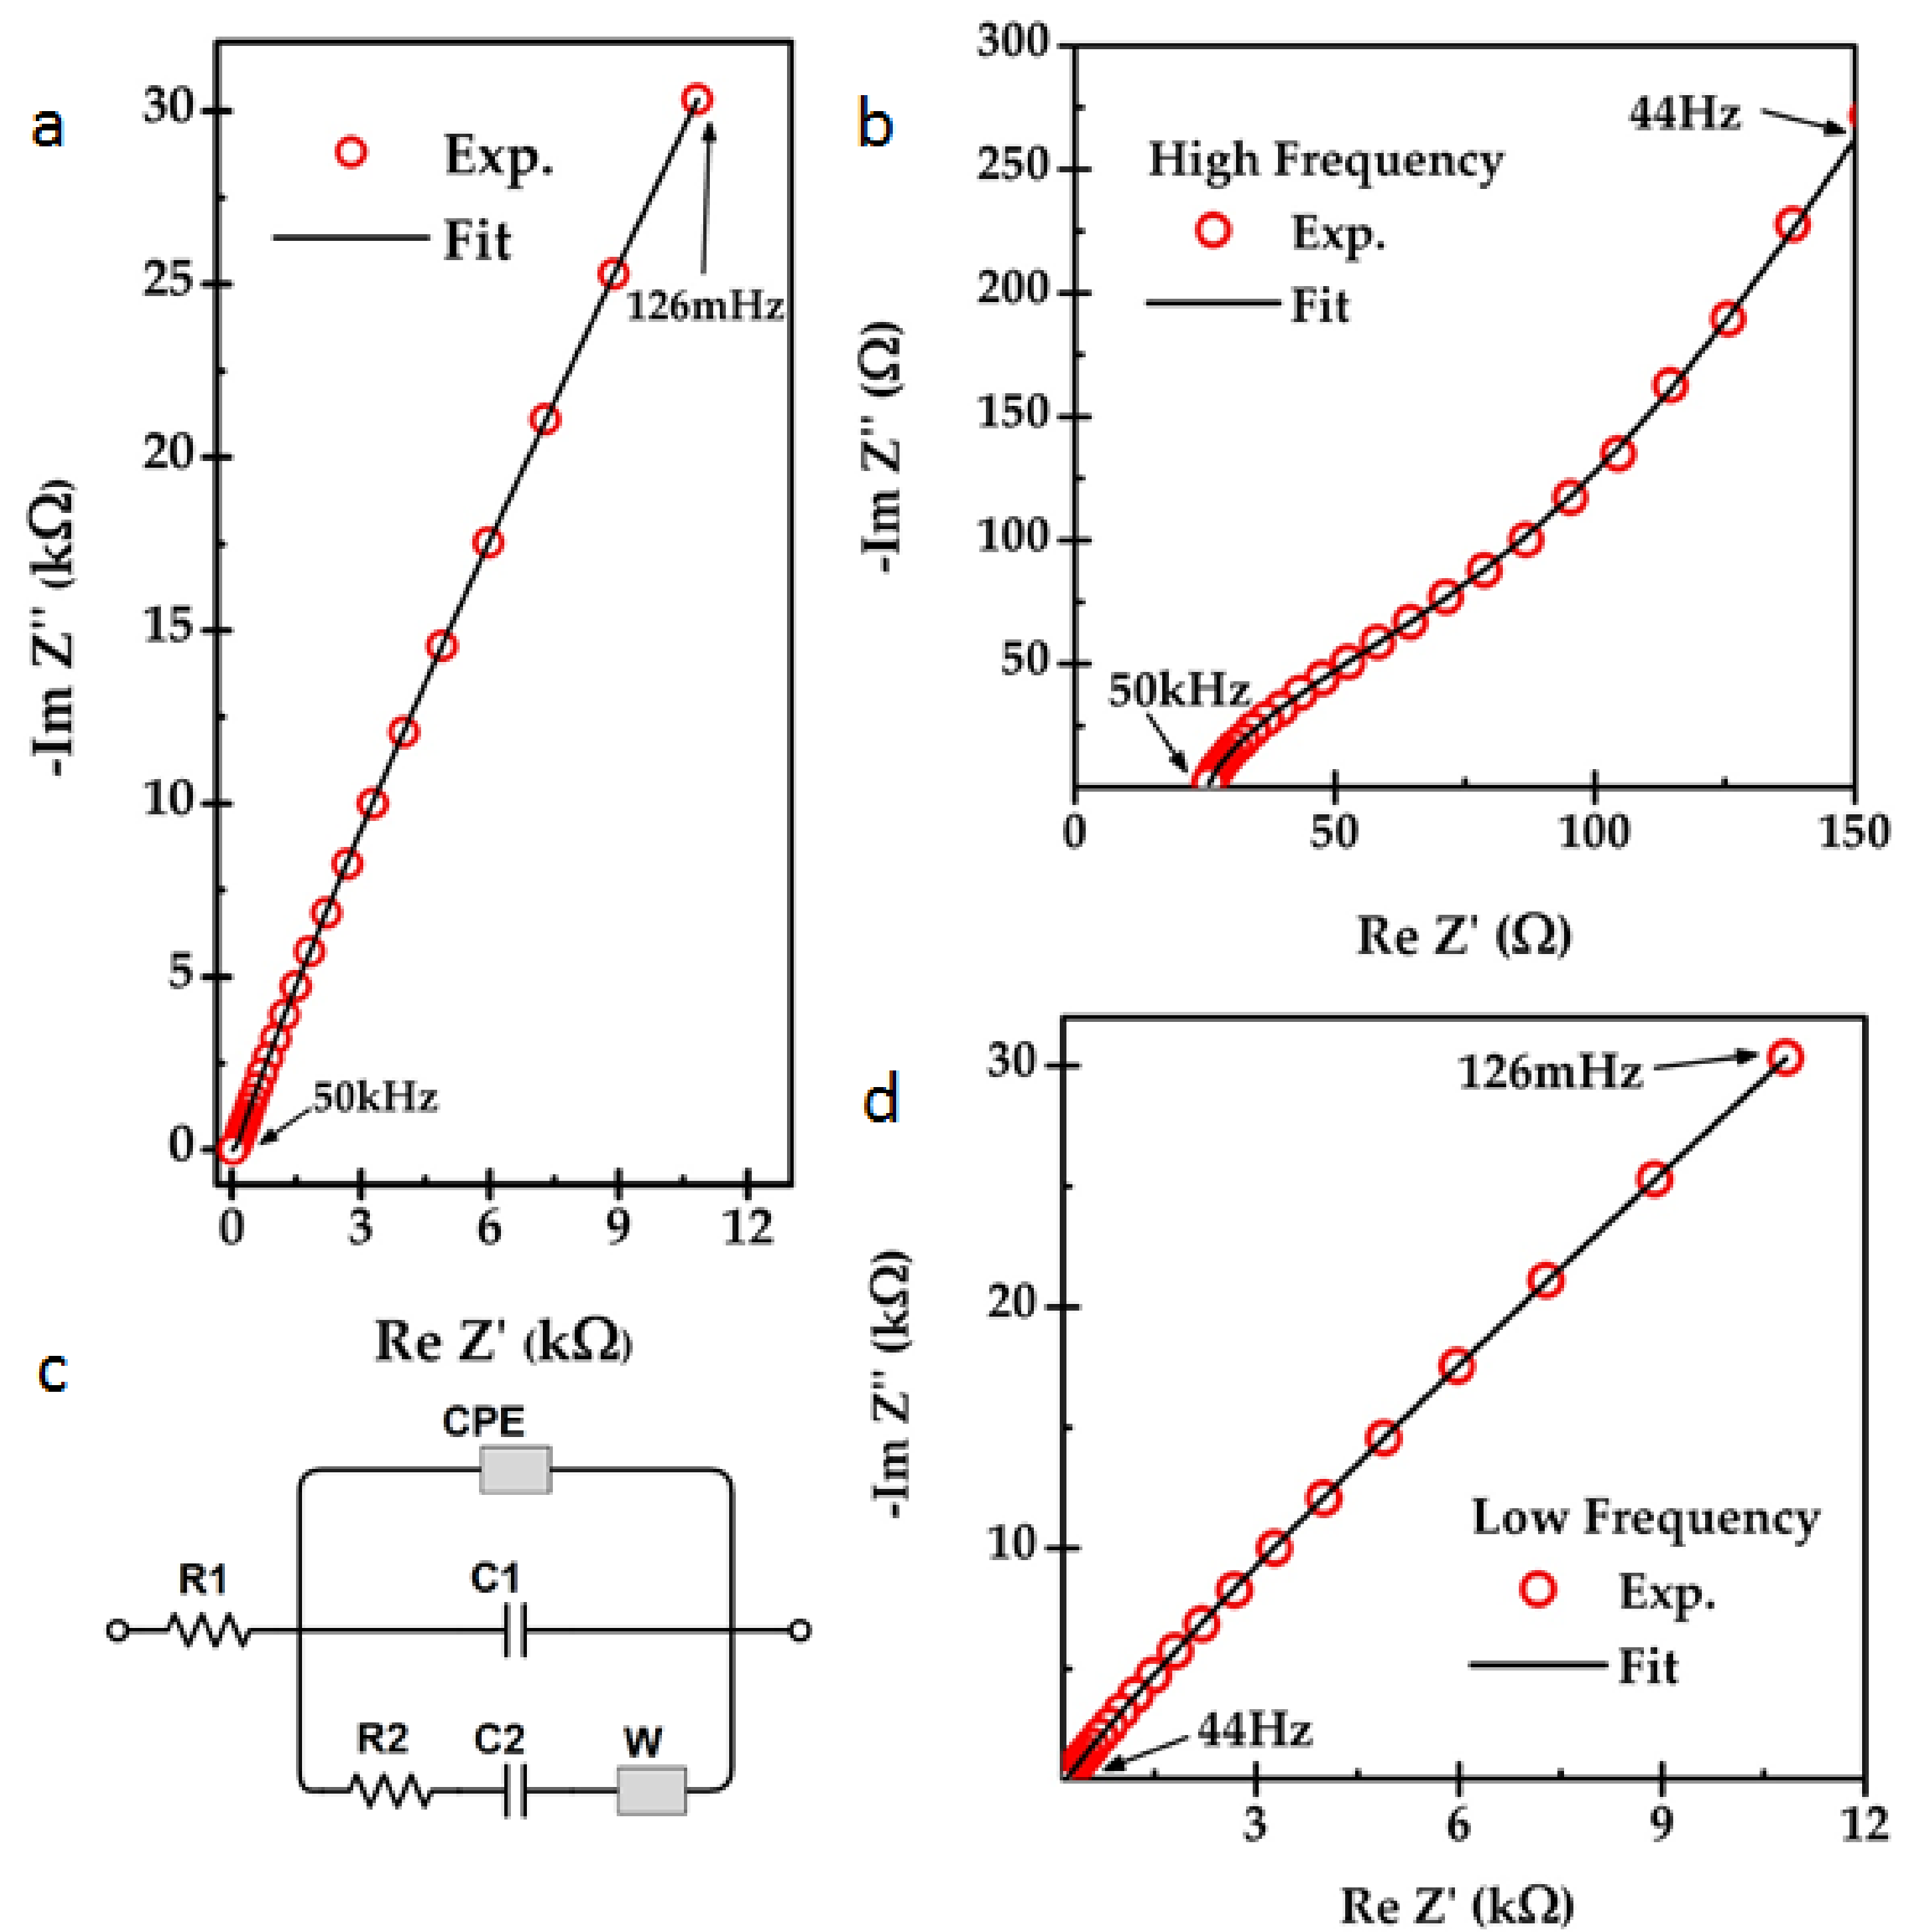
2.2. Electrochemical Characterizations

In order to characterize the electrochemical behavior of the sample produced, the samples were diluted to one-fourth of the concentration and vacuum-filtrated through a porous Teflon membrane filter (0.1 μm). The coated filter was then heated at 60 °C for fifteen minutes in order to evaporate any remaining IPA. The filter was weighed before and after the coating process in order to determine the weight of LPEG deposited. These filters were used for fabricating the EDLC electrodes. To prepare an EDLC using the filter, two square pieces of nearly equal size were cut from the filter containing LPEG samples to act as the electrode material. These two electrodes were separated with a larger square of filter paper, which acted as the porous separator. The stacked assembly was then transferred to a sealed stainless steel cell containing the electrolyte for electrochemical characterization.
We have tested three different electrolytes: 6 M KOH, BMIM-PF6 and BMP-FAP. Two-electrode cyclic voltammetry (CV) was performed at room temperature for all electrolytes over a broad range of scan rates. For example, for all samples tested with 6M KOH as the electrolyte, a baseline study was conducted in order to establish the behavior of the electrode material. This study consisted of a series of scans from –0.5 V to 0.5 V at scan rates of 1000 mV/s, 500 mV/s, 200 mV/s, 100 mV/s, 50 mV/s, 10 mV/s, and 1 mV/s at room temperature. Initial cell purge and equilibration times were kept at 10 s and 5 s for all CV testing. Similar protocol was also followed for measurements performed using BMIM-PF6. The data obtained from both these measurements are presented in Supplementary Material (Figure S3).
For all the samples tested with BMP-FAP as the electrolyte, different scan rates were again used with a variety of potential voltage windows in order to demonstrate the increased performance when the full range of this particular ionic liquid is utilized. Scans were taken about the origin with voltage windows taken in increasing 1 V steps. Measurements at 1 V, 2 V, 3 V, 4 V, 5 V and 6 V were taken in all. For each voltage window, scan rates of 1000 mV/s, 500 mV/s, 200 mV/s, 100 mV/s, 50 mV/s and 10 mV/s were taken at room temperature. Galvanostatic charge–discharge (CD) was also performed with ±1 mA of current alternated every 1 s for 200 cycles to 2000 cycles in order to evaluate the longevity and stability of the devices prepared. The electrochemical measurements performed with BMP-FAP are shown in Figure 2.

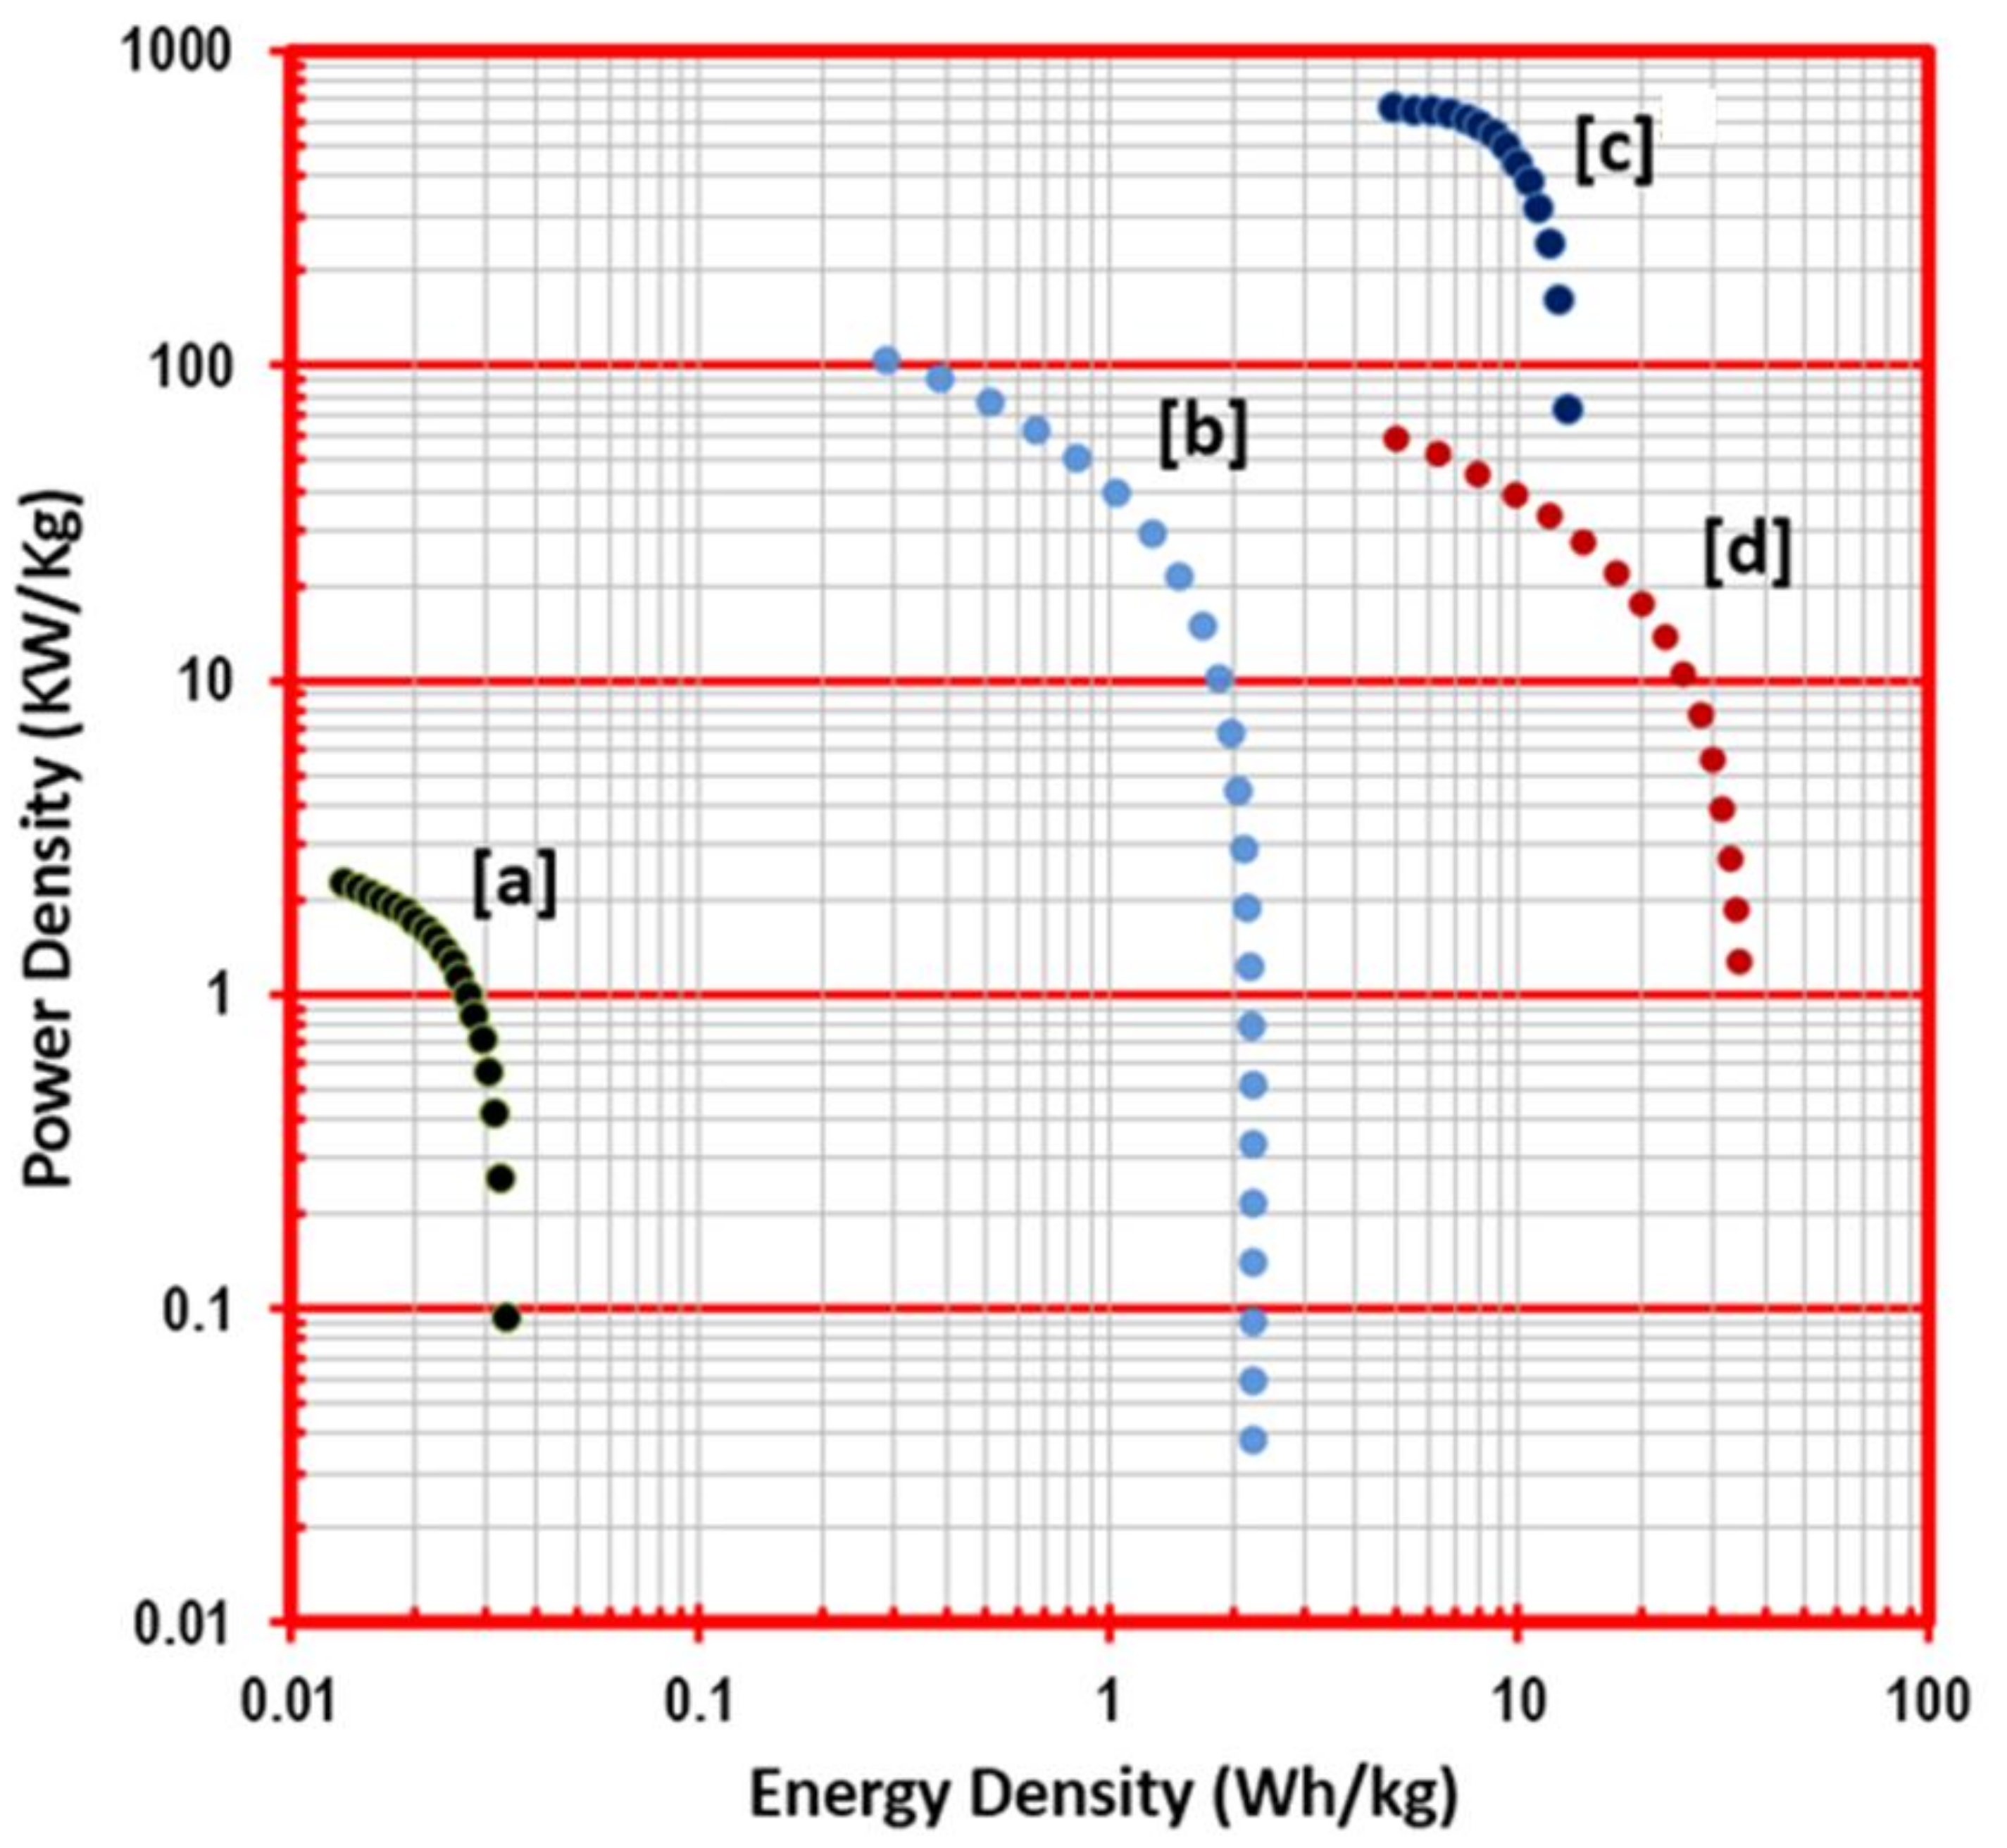
3. Results and Discussion

The CV plots shown in Figure 2a demonstrated good reversibility and charge return, with little Faradaic (non-reversible) response aside from the 6 V scan voltage windows. The 5 V BMP-FAP scan window in particular demonstrated symmetric charge return and little to no Faradaic response when compared with its relative performance. The 6 V scan voltage window did demonstrate some Faradaic peaks, suggesting that while the 6 V window could be used to expand the device performance even further, where some device degradation would be seen over continued use. In Figure 2b, the specific capacitance (F/g) of the devices is plotted against the scan rate. The 10 mV/s scan rate test of the BMP-FAP device demonstrated a significant improvement upon the corresponding result from the 6 M KOH device (Figure 2d). For the 6 V window average, an over two-fold performance increase was observed, while the average of the 5 V window results still presented roughly a 64% increase in capacitive response. The stability and longevity of the device is presented over the course of 2000 cycles in Figure 2c. Once the initial cycling had occurred, the devices swiftly reach a stable response, demonstrating little variability across hundreds to thousands of cycles, with the resulting retention maintaining 82% of the initial performance. We believe that the capacitance drop with the increasing number of cycles is perhaps due to the adsorption of the electrolyte ions on defect sites and/or edges of the exfoliated graphene flakes. The process of exfoliation can produce structural defects in the form of dangling bonds on the edges, carbon vacancies, etc., on the graphene material. These structural defects are highly reactive and oftentimes acts as sites where electrolyte ions can get adsorbed strongly during the charging cycle and are not readily desorbed during the discharging. The overall effect is loss of active surface area of the electrode materials for some of the initial charge–discharge cycles, which manifests as loss of specific capacitance. Finally, Figure 2d presents the corresponding 10 mV/s CVs from each prepared device in terms of specific capacitance and the voltage window. From this plot, it is observed that EDLC performance of LPEG with BMP-FAP as an electrolyte was significantly better compared to other electrolytes used in this study. One of the key reasons for such an observation is perhaps due to the fact that the adsorption potentials for ionic liquid ions are extremely strong in the presence of flat graphene surfaces as suggested through detailed theoretical calculations [32]. Therefore, these ions are attracted closer to the flat electrode surface. This in turn makes the charge separation distance in the formed double layer smaller. A smaller charge separation distance (in parallel plate geometry) is perhaps one of the main causes of improved capacitance performance as seen in this investigation. A simple schematic showing an artist’s rendition of formation of a double layer on a flat graphene surface is shown in the inset of Figure 2d.
To further characterize the EDLC system, electrochemical impedance spectroscopy (EIS) was used. The impedance spectrum was obtained within the frequency range of 126 mHz to 50 kHz with 10 mV root-mean-squared (RMS) voltage without a DC bias voltage. The resulting Nyquist plot of the real and the imaginary parts of the impedance is shown in Figure 3. By taking the intercept with the real axis of the impedance in the high frequency curve, the equivalent series resistance (ESR) of the system can be estimated. In order to understand the physical processes, such as the electrochemical kinetic reaction mechanism, double layer capacitance, pseudo-capacitance, etc., the impedance spectrum can be fit in to an equivalent circuit model [2,33,34,35]. Then the model can be understood in an analytical way by considering the different circuit elements and the parameters that are associated with those components.
Figure 3a shows experimental and fitted Nyquist plots for the BMP-FAP ionic electrolyte and the Figure 3c shows the equivalent circuit model for the fitted data. From the high-frequency range (50 kHz–44 Hz) experimental data (Figure 3b), the system’s ESR was estimated to be 25.57 Ω. In the circuit model, the R1 resistance corresponded to the ESR of the system, which mainly arose due to the series resistance of the electrolyte, filter papers and charge barriers between the stainless steel current collectors and the graphene electrode material. Presence of a constant phase element (CPE) corresponds to the non-ideal nature of the capacitor, which also represents the system behavior due to effects such as surface disorder, electrode porosity, and adsorption processes [33,34]. The impedance corresponding to a CPE ( Z C P E ) can be written as:
Z C P E = 1 ( j ω ) n   Y 0
where Y 0 is the numerical value of the admittance, n is the CPE parameter, and ω ( ω = 2 π f ) is the angular frequency at the lowest frequency ( f ) measured in the impedance spectrum. Capacitance associated with CPE ( C C P E ) can be evaluated using the following equation:
C C P E = Y 0 ω 1 n sin ( n π 2 )
Capacitance corresponding to the CPE has a major contribution to the total device capacitance of the system (Table 1). We believe that the presence of C1 and C2 pseudo-capacitances parallel to the CPE also indicate the presence of processes such as the adsorption of ions onto the electrodes. However, these pseudo-capacitances attribute only a small contribution to the total device capacitance [35]. The R2 resistor element is most likely due to a charge transfer barrier in the system. The Warburg element (W) in the circuit model represents the Warburg impedance, which arose due to the diffusion of ions.
The efficacy of this exfoliation method is made readily apparent in the comparison shown in Figure 4, where a nearly two order of magnitude difference in energy and power densities is observed between a bulk graphite sample prepared and tested in the same manner as the LPEG samples. Several devices were prepared, and the relative variance in performance is shown to be small, indicating that while the nanoscale results can be somewhat chaotic, the macroscopic final product was relatively consistent in response.
When comparing current supercapacitor technologies gravimetrically, it becomes apparent that there is certainly growth and parameterization to be had through variation of the structure and composition of the electrodes used; however, the electrolyte used has a demonstrative effect on the performance of the prepared devices that can be combined with these efforts to produce even further advances in the technology. More complex fabrication methods [36,37] have produced supercapacitors with good energy densities in aqueous solutions, 78.8 Wh/kg and 73 Wh/kg, respectively, that exhibited lower power densities when compared with other supercapacitor configurations. In the past, it was shown that innovative electrode materials [28,38,39,40] could be used to tailor balanced performance in terms of both energy and power. In these cases, as is often seen when attempting to optimize performance, a tradeoff exists between the two (Table 2). These results almost mirror one another, one with 27 Wh/kg and 17 kW/kg and another with 14 Wh/kg and 25 kW/kg. Thus, current technologies are seemingly held back by varying degrees of cost, feasibility, and scalability when limited to aqueous electrolytes.
To be able to further expand performance without complicating fabrication is an important possibility in need of exploration. Sahu et al. [29] demonstrate the viability of this approach quite well with their Ragone measurements for lacey-reduced graphene oxide nanoribbons (LRGONR) using 2M H2SO4, N,N,N,N-tetraethylammonium tetrafluoroborate (TEA-BF4), and 1-butyl-1-methylimidazolium tetrafluoroborate (BMIM-BF4). This work demonstrates the general electrochemical performance advances between 6M KOH, BMIM-PF6, and BMP-FAP, as well as the energy and power density results for BMP-FAP. Sahu et al. demonstrate a particular jump in energy density, going from an aqueous maximum of 15.1 Wh/kg to 90 Wh/kg and 181.5 Wh/kg with each change in electrolyte.

4. Conclusions

The results of this work have shown strong improvements in general capacitive behavior from the addition of this ionic liquid and when compared to other supercapacitor electrode research, a stronger balanced performance in terms of energy and power is observed as well. The simple introduction of an ionic liquid into pre-existing device electrode architecture allows for an increase in energy density normally only achieved through more complex fabrication procedures or for even further optimization of heterostructures or tailored electrode materials. This allows for devices of various compositions and structures to be further improved by a change in electrolyte without a significant impact upon device reversibility or longevity and for simpler, scalable procedures to potentially demonstrate commercial viability due to increased yields or reduced production costs.

Supplementary Materials

The following are available online at https://www.mdpi.com/2079-9292/7/10/229/s1, Figure S1: (a) UV-VIS absorbance spectroscopy of LPEG, (b) XPS analysis survey scan, (c) O 1s scan, and (d) C 1s scan. Figure S2: (a) Cyclic voltammetric plot for bulk graphite powder in BMP-FAP, and (b) the resulting specific capacitance vs scan rate used. Figure S3: (a) Cyclic voltammetric plot of LPEG in 6M KOH aqueous electrolyte, and (b) the resulting specific capacitance vs scan rate used. (c) Cyclic voltammetric plot of LPEG in BMIM-PF6 ionic liquid electrolyte and (d) the resulting specific capacitance vs. scan rate used. Table S1: Specific capacitance (Csp) (in F/g) for all scan rates and voltage windows that were taken for LPEG.

Author Contributions

Conceptualization, S.T.; Methodology, J.H., M.W., A.W., and S.G.; Validation, J.R. and J.B.; Formal Analysis, J.H. and M.W.; Investigation, J.H., M.W., J.R., and J.B.; Resources, A.W., S.G., C.Y., and W.X.; Data Curation, M.W.; Writing-Original Draft Preparation, J.H. and M.W.; Writing-Review & Editing, S.T., L.S., and S.K.; Visualization, J.H. and M.W.; Supervision, S.T.; Project Administration, M.W. and J.H.; Funding Acquisition, S.T. and L.S.

Funding

J.H. was funded by NSF EAPSI program Award ID #1414819, and L.S. acknowledges the funding support through NSF of China (U1232131, U1532112, 11375198, 11574280).

Acknowledgments

M.W. acknowledges the DRA funding support through SIU Graduate School. MaSK [41] (Molecular Modeling and Simulation Kit http://ccmsi.us/mask) was used in the creation of the Figure 2d inset.

Conflicts of Interest

The authors declare no conflicts of interest.

References

  1. Bard, A.J.; Faulkner, L.R. Electrochemical Methods: Fundamentals and Applications, 2nd ed.; John Wiley & Sons: Hoboken, NJ, USA, 2007. [Google Scholar]
  2. Conway, B.E. Electrochemical Supercapacitors: Scientific Fundamentals and Technological Applications; Kluwer Acad.: New York, NY, USA, 2009; ISBN 978-1-4757-3058-6. [Google Scholar]
  3. Goodenough, J.B.; Abruna, H.D.; Buchanan, M.V. Basic Research Needs for Electrical Energy Storage; Technical Report of the basic energy sciences workshop on electrical energy storage; DOESC (USDOE Office of Science (SC)): Washington, DC, USA, 2–4 April 2007. [Google Scholar] [CrossRef]
  4. Rufer, A.; Barrade, P. A supercapacitor-based energy-storage system for elevators with soft commutated interface. IEEE Trans. Ind. Appl. 2002, 38, 1151–1159. [Google Scholar] [CrossRef]
  5. Christen, T.; Carlen, M.W. Theory of ragone plots. J. Power Sources 2000, 91, 210–216. [Google Scholar] [CrossRef]
  6. Borenstein, A.; Hanna, O.; Attias, R.; Luski, S.; Brousse, T.; Aurbach, D. Carbon-based composite materials for supercapacitor electrodes: A review. J. Mater. Chem. A 2017, 5, 12653–12672. [Google Scholar] [CrossRef]
  7. Khan, A.H.; Ghosh, S.; Pradhan, B.; Dalui, A.; Shrestha, L.K.; Acharya, S.; Ariga, K. Two-dimensional (2d) nanomaterials towards electrochemical nanoarchitectonics in energy-related applications. Bull. Chem. Soc. Jpn. 2017, 90, 627–648. [Google Scholar] [CrossRef]
  8. Wang, Y.; Mayorga-Martinez, C.C.; Pumera, M. Polyaniline/mosx supercapacitor by electrodeposition. Bull. Chem. Soc. Jpn. 2017, 90, 847–853. [Google Scholar] [CrossRef]
  9. Sheberla, D.; Bachman, J.C.; Elias, J.S.; Sun, C.-J.; Shao-Horn, Y.; Dincă, M. Conductive mof electrodes for stable supercapacitors with high areal capacitance. Nat. Mater. 2016, 16, 220. [Google Scholar] [CrossRef] [PubMed]
  10. Kim, J.; Kim, J.H.; Ariga, K. Redox-active polymers for energy storage nanoarchitectonics. Joule 2017, 1, 739–768. [Google Scholar] [CrossRef]
  11. Frackowiak, E.; Béguin, F. Electrochemical storage of energy in carbon nanotubes and nanostructured carbons. Carbon 2002, 40, 1775–1787. [Google Scholar] [CrossRef]
  12. Hu, S.; Rajamani, R.; Yu, X. Flexible solid-state paper based carbon nanotube supercapacitor. Appl. Phys. Lett. 2012, 100, 104103. [Google Scholar] [CrossRef]
  13. Pandey, S.; Maiti, U.N.; Palanisamy, K.; Nikolaev, P.; Arepalli, S. Ultrasonicated double wall carbon nanotubes for enhanced electric double layer capacitance. Appl. Phys. Lett. 2014, 104, 233902. [Google Scholar] [CrossRef]
  14. Rakesh, S.; Xianfeng, Z.; Saikat, T. Electrochemical double layer capacitor electrodes using aligned carbon nanotubes grown directly on metals. Nanotechnology 2009, 20, 395202. [Google Scholar]
  15. Gao, Y.; Zhou, Y.S.; Xiong, W.; Jiang, L.J.; Mahjouri-samani, M.; Thirugnanam, P.; Huang, X.; Wang, M.M.; Jiang, L.; Lu, Y.F. Transparent, flexible, and solid-state supercapacitors based on graphene electrodes. APL Mater. 2013, 1, 012101. [Google Scholar] [CrossRef] [Green Version]
  16. Mishra, A.K.; Ramaprabhu, S. Ultrahigh arsenic sorption using iron oxide-graphene nanocomposite supercapacitor assembly. J. Appl. Phys. 2012, 112, 104315. [Google Scholar] [CrossRef]
  17. Wang, Y.; Shi, Z.; Huang, Y.; Ma, Y.; Wang, C.; Chen, M.; Chen, Y. Supercapacitor devices based on graphene materials. J. Phys. Chem. C 2009, 113, 13103–13107. [Google Scholar] [CrossRef]
  18. Wu, Q.; Xu, Y.; Yao, Z.; Liu, A.; Shi, G. Supercapacitors based on flexible graphene/polyaniline nanofiber composite films. ACS Nano 2010, 4, 1963–1970. [Google Scholar] [CrossRef] [PubMed]
  19. Yu, A.; Roes, I.; Davies, A.; Chen, Z. Ultrathin, transparent, and flexible graphene films for supercapacitor application. Appl. Phys. Lett. 2010, 96, 253105. [Google Scholar] [CrossRef]
  20. Zang, X.; Li, P.; Chen, Q.; Wang, K.; Wei, J.; Wu, D.; Zhu, H. Evaluation of layer-by-layer graphene structures as supercapacitor electrode materials. J. Appl. Phys. 2014, 115, 024305. [Google Scholar] [CrossRef]
  21. Zhang, L.L.; Zhou, R.; Zhao, X.S. Graphene-based materials as supercapacitor electrodes. J. Mater. Chem. 2010, 20, 5983–5992. [Google Scholar] [CrossRef]
  22. Prabaharan, S.R.S.; Vimala, R.; Zainal, Z. Nanostructured mesoporous carbon as electrodes for supercapacitors. J. Power Sources 2006, 161, 730–736. [Google Scholar] [CrossRef]
  23. Al-Asadi, A.S.; Henley, L.A.; Wasala, M.; Muchharla, B.; Perea-Lopez, N.; Carozo, V.; Lin, Z.; Terrones, M.; Mondal, K.; Kordas, K.; et al. Aligned carbon nanotube/zinc oxide nanowire hybrids as high performance electrodes for supercapacitor applications. J. Appl. Phys. 2017, 121, 124303. [Google Scholar] [CrossRef]
  24. Gong, W.; Fugetsu, B.; Wang, Z.; Sakata, I.; Su, L.; Zhang, X.; Ogata, H.; Li, M.; Wang, C.; Li, J.; et al. Carbon nanotubes and manganese oxide hybrid nanostructures as high performance fiber supercapacitors. Commun. Chem. 2018, 1, 16. [Google Scholar] [CrossRef]
  25. Cakici, M.; Kakarla, R.R.; Alonso-Marroquin, F. Advanced electrochemical energy storage supercapacitors based on the flexible carbon fiber fabric-coated with uniform coral-like mno2 structured electrodes. Chem. Eng. J. 2017, 309, 151–158. [Google Scholar] [CrossRef]
  26. Fletcher, S.I.; Sillars, F.B.; Hudson, N.E.; Hall, P.J. Physical properties of selected ionic liquids for use as electrolytes and other industrial applications. J.Chem. Eng. Data 2010, 55, 778–782. [Google Scholar] [CrossRef]
  27. Ignat’ev, N.V.; Welz-Biermann, U.; Kucheryna, A.; Bissky, G.; Willner, H. New ionic liquids with tris(perfluoroalkyl)trifluorophosphate (fap) anions. J. Fluorine Chem. 2005, 126, 1150–1159. [Google Scholar] [CrossRef]
  28. Aboutalebi, S.H.; Jalili, R.; Esrafilzadeh, D.; Salari, M.; Gholamvand, Z.; Aminorroaya Yamini, S.; Konstantinov, K.; Shepherd, R.L.; Chen, J.; Moulton, S.E.; et al. High-performance multifunctional graphene yarns: Toward wearable all-carbon energy storage textiles. ACS Nano 2014, 8, 2456–2466. [Google Scholar] [CrossRef] [PubMed]
  29. Sahu, V.; Shekhar, S.; Sharma, R.K.; Singh, G. Ultrahigh performance supercapacitor from lacey reduced graphene oxide nanoribbons. ACS Appl. Mater. Interfaces 2015, 7, 3110–3116. [Google Scholar] [CrossRef] [PubMed]
  30. Albrektsen, O.; Eriksen, R.L.; Novikov, S.M.; Schall, D.; Karl, M.; Bozhevolnyi, S.I.; Simonsen, A.C. High resolution imaging of few-layer graphene. J. Appl. Phys. 2012, 111, 064305. [Google Scholar] [CrossRef]
  31. Wu, J.X.; Xu, H.; Zhang, J. Raman spectroscopy of graphene. Acta Chim. Sin. 2014, 72, 301–318. [Google Scholar] [CrossRef]
  32. Pensado, A.S.; Malberg, F.; Gomes, M.F.C.; Pádua, A.A.H.; Fernández, J.; Kirchner, B. Interactions and structure of ionic liquids on graphene and carbon nanotubes surfaces. RSC Adv. 2014, 4, 18017–18024. [Google Scholar] [CrossRef]
  33. Jorcin, J.-B.; Orazem, M.E.; Pébère, N.; Tribollet, B. Cpe analysis by local electrochemical impedance spectroscopy. Electrochim. Acta. 2006, 51, 1473–1479. [Google Scholar] [CrossRef] [Green Version]
  34. Kötz, R.; Hahn, M.; Gallay, R. Temperature behavior and impedance fundamentals of supercapacitors. J. Power Sources 2006, 154, 550–555. [Google Scholar] [CrossRef]
  35. Macdonald, J.R. Impedance spectroscopy. Ann. Biomed. Eng. 1992, 20, 289–305. [Google Scholar] [CrossRef] [PubMed]
  36. Qu, L.; Zhao, Y.; Khan, A.M.; Han, C.; Hercule, K.M.; Yan, M.; Liu, X.; Chen, W.; Wang, D.; Cai, Z.; et al. Interwoven three-dimensional architecture of cobalt oxide nanobrush-graphene@nixco2x(oh)6x for high-performance supercapacitors. Nano Lett. 2015, 15, 2037–2044. [Google Scholar] [CrossRef] [PubMed]
  37. Cho, S.; Kim, M.; Jang, J. Screen-printable and flexible ruo2 nanoparticle-decorated pedot:Pss/graphene nanocomposite with enhanced electrical and electrochemical performances for high-capacity supercapacitor. ACS Appl. Mater. Interfaces 2015, 7, 10213–10227. [Google Scholar] [CrossRef] [PubMed]
  38. Yan, J.; Wang, Q.; Wei, T.; Jiang, L.; Zhang, M.; Jing, X.; Fan, Z. Template-assisted low temperature synthesis of functionalized graphene for ultrahigh volumetric performance supercapacitors. ACS Nano 2014, 8, 4720–4729. [Google Scholar] [CrossRef] [PubMed]
  39. Ghosh, S.; An, X.; Shah, R.; Rawat, D.; Dave, B.; Kar, S.; Talapatra, S. Effect of 1- pyrene carboxylic-acid functionalization of graphene on its capacitive energy storage. J. Phys. Chem. C 2012, 116, 20688–20693. [Google Scholar] [CrossRef]
  40. Ghosh, D.; Das, C.K. Hydrothermal growth of hierarchical ni3s2 and co3s4 on a reduced graphene oxide hydrogel@ni foam: A high-energy-density aqueous asymmetric supercapacitor. ACS Appl. Mater. Interfaces 2015, 7, 1122–1131. [Google Scholar] [CrossRef] [PubMed]
  41. Podolyan, Y.; Leszczynski, J. Mask: A visualization tool for teaching and research in computational chemistry. Int. J. Quantum Chem. 2009, 109, 8–16. [Google Scholar] [CrossRef]
Figure 1. Optical characterization of the prepared liquid-phase exfoliated graphene (LPEG) sample. (a) Resulting LPEG solution following decanting of the supernatant liquid after centrifugation. (b) Transmission electron microscopy (TEM) image of dispersed few-layer flakes of prepared solution. (c) AFM image of an LPEG flake. (d) AFM height profile along the blue line shown in Figure 1c. (e) Raman spectroscopy results of LPEG. (f) HR-TEM image showing ≈8 layers at the edge of LPEG. (g) HR-TEM image showing ≈14 layers at the edge of the LPEG.
Electronics 07 00229 g001
Figure 2. Electrochemical data for LPEG in BMP-FAP. (a) Cyclic voltammetry results for all voltage windows taken. (b) Specific capacitance vs scan rate for the 6 V window. (c) Capacitance retention taken over 2000 cycles of charging and discharging. (c inset) Sample capacitor charging and discharging curves. (d) Comparative results of specific capacitance at 10 mV/s scan rate for each electrolyte and voltage window. (d inset) Schematic diagram of formation of double layer.
Electronics 07 00229 g002
Figure 3. Electrochemical impedance spectroscopy (EIS) analysis results for LPEG in the BMP-FAP electrolyte. (a) Full-frequency fitted Nyquist data. (b) Prepared equivalent circuit. (c) High-frequency fitted Nyquist data. (d) Low-frequency fitted Nyquist data.
Electronics 07 00229 g003
Figure 4. Ragone (power density vs energy density) performance plot of devices with graphite powder (a), LPEG with KOH as the electrolyte (b), 1-pyrene carboxylic-acid functionalized graphene with KOH as the electrolyte (c) [39], and LPEG with BMP-FAP as electrolyte devices (d).
Electronics 07 00229 g004
Table 1. The individual circuit component characteristic values prepared from the electrochemical impedance spectroscopy (EIS) analysis.
ParametersValue
Pseudo-capacitance (C1)/F1.5959 × 10−6
Pseudo-capacitance (C2)/F9.5812 × 10−6
Equivalent series resistance (ESR) (R1)/Ω25.605
Faradaic resistance (R2)/Ω155.17
Warburg component (W)3029
Constant phase element (CPE) factor (Y0)2.7059 × 10⁻⁵
CPE exponent (n)0.70632
ESR (experimental)/Ω25.57
Double layer capacitance (at lowest frequency)/F3.273 × 10−5
Total device capacitance/F (from the model)4.391 × 10⁻⁵
Total device capacitance/F/g3.0699
Experimental capacitance (1000 mV/s)/F/g4.13
Table 2. A comparison of a variety of graphene-based device electrochemical power and energy performance.
SourceMethodMeasurementElectrolyteED (Wh/kg)PD (kW/kg)
[36]CNG@NCHThree-electrodeAqueous (1 M LiOH)78.88.4
[37]RuO2/PEDOT-G30Three-electrodeAqueous (0.5 M H2SO4)731.1
[38]Graphene w/Mg(OH)2 templateThree-electrode & Two-electrodeAqueous (6 M KOH)≈27≈17
[28]Graphene YarnsTwo-electrodeAqueous (1 M H2SO4)1425
[40]NI3S2 & Co3S4 on RGO Hydrogel @Ni FoamAsymmetrical Two-electrodeAqueous (6 M KOH)55.213
[29]LRGONRTwo-electrodeAqueous (2 M H2SO4)15.1≈10
IL ([TEA][BF4])902.0 a
IL ([BMIM][BF4])181.52.3 a
This workLPEGTwo-electrodeIL ([BMP][FAP])24.947.5
a Indicates simultaneous results rather than respective maximums.

