Article

Automatic Fault Diagnostic System for Induction Motors under Transient Regime Optimized with Expert Systems

by
Jordi Burriel-Valencia
,
Ruben Puche-Panadero
,
Javier Martinez-Roman
,
Angel Sapena-Bano
*,
Manuel Pineda-Sanchez
,
Juan Perez-Cruz
and
Martin Riera-Guasp
Institute for Energy Engineering, Universitat Politècnica de València, 46022 Valencia, Spain
*
Author to whom correspondence should be addressed.
Electronics 2019, 8(1), 6; https://doi.org/10.3390/electronics8010006
Submission received: 31 October 2018 / Revised: 4 December 2018 / Accepted: 19 December 2018 / Published: 21 December 2018
(This article belongs to the Special Issue Applications of Power Electronics)

Abstract

:
Induction machines (IMs) power most modern industrial processes (induction motors) and generate an increasing portion of our electricity (doubly fed induction generators). A continuous monitoring of the machine’s condition can identify faults at an early stage, and it can avoid costly, unexpected shutdowns of production processes, with economic losses well beyond the cost of the machine itself. Machine current signature analysis (MCSA), has become a prominent technique for condition-based maintenance, because, in its basic approach, it is non-invasive, requires just a current sensor, and can process the current signal using a standard fast Fourier transform (FFT). Nevertheless, the industrial application of MCSA requires well-trained maintenance personnel, able to interpret the current spectra and to avoid false diagnostics that can appear due to electrical noise in harsh industrial environments. This task faces increasing difficulties, especially when dealing with machines that work under non-stationary conditions, such as wind generators under variable wind regime, or motors fed from variable speed drives. In these cases, the resulting spectra are no longer simple one-dimensional plots in the time domain; instead, they become two-dimensional images in the joint time-frequency domain, requiring highly specialized personnel to evaluate the machine condition. To alleviate these problems, supporting the maintenance staff in their decision process, and simplifying the correct use of fault diagnosis systems, expert systems based on neural networks have been proposed for automatic fault diagnosis. However, all these systems, up to the best knowledge of the authors, operate under steady-state conditions, and are not applicable in a transient regime. To solve this problem, this paper presents an automatic system for generating optimized expert diagnostic systems for fault detection when the machine works under transient conditions. The proposed method is first theoretically introduced, and then it is applied to the experimental diagnosis of broken bars in a commercial cage induction motor.

1. Introduction

Induction machines (IMs) power most modern industrial processes (induction motors) and generate an increasing portion of our electricity (doubly fed induction generators). Therefore, fault diagnosis of IMs has become an important area of condition-based maintenance (CBM) programs, to avoid the high economic losses generated by unexpected breakdowns of IMs and sudden stoppages of the production lines that they drive. Specifically, fault diagnosis techniques based on the analysis of the MCSA [1,2,3,4,5,6] have gained a wide industrial deployment, due to their simplicity, low requirements of hardware and software, and capability for on-line simultaneous detection of a wide range of machine faults. Despite its advantages, industrial application of MCSA in harsh industrial environments, under real working conditions, is challenging. The spectral lines, whose amplitude signals the presence of a fault, can be difficult to evaluate under the myriad of spectral lines in the spectrum of the machine current, especially in case of incipient faults, where the fault harmonics have small amplitudes, or in case of low slip working conditions, where the leakage of the fundamental can bury the fault harmonics appearing at very close frequencies. To deal with these difficulties, several ongoing research works [7,8] propose the development of expert systems that can improve the diagnostic hit ratio, mostly where the fault features information obtained to detect these faults is scarce or unrepresentative. Nevertheless, developing and combining expert systems with fault diagnostic methods to improve hit ratio it is not trivial at all. An optimum combination of both elements can lead to a significant hit ratio improvement in fault detection, but an inadequate combination can even result in a misdiagnose. In the scientific literature, some works such as [9,10,11,12,13] are focused on the analysis, explanation, and development of recommendations, techniques, and methodologies to achieve a correct expert system implementation with optimal problem resolution. Following these recommendations, two main aspects are relevant to build an accurate expert system for the diagnosis of a faulty IM: on the one hand it is necessary to use a method able to detect and obtain features of the motor that can characterize a given type of fault; on the other hand, some algorithm or methodology able to interpret these features to discern about fault existence must be developed.
The design of an expert system for fault detection of IMs, taking into account both aspects, is a complex task, with many design variables that can influence the performance of such a diagnostic system. In this context, this paper proposes the automation of this design stage, through the development an automated system (the supra-system) which automatically generates custom fault diagnostic systems with high precision rate for fault detection. The proposed, so called supra-system is based on the exhaustive comparison of different combinations of fault diagnostic methods and optimized expert systems. It has been applied with success to the generation of an expert system for the detection of broken bars in a squirrel cage IM, both in steady-state regime and in transient state. The application to the detection of other types of fault is straightforward.
The paper is structured as follows: Section 2 introduces methods to detect faults in the induction machine under transient conditions. Section 3 describes the expert systems more commonly used in this field. Section 4 describes the development of the supra-system to generate optimized diagnostic systems. Section 5 is devoted to the experimental results and validation, and finally, in Section 6 the conclusions are presented.

2. Components of the Generator of Expert Systems for Fault Diagnosis of IMs

The three main components of an expert system for fault diagnosis of IMs, to be generated by the proposed supra- system, are the following ones:
  • The quantity measured in the IM.
  • The method used for extracting fault representative features from the measured quantities.
  • The type of expert system used to perform the fault diagnosis from the selected IM features.
These three characteristics are analyzed in the following sections.

2.1. Quantities Measured in the IM

Fault diagnostic methods for IMs can obtain representative fault features from different motor quantities, like phase currents or voltages, acoustic, temperature, vibrations, etc. Using these features, these methods must able to detect the presence or absence of failures like broken rotor bars, winding short circuits, bearing damages, eccentricities, etc. In addition, these methods must work under any machine operation regimes (standstill, start-up, steady-state or transient regime). In this paper, the selected quantity is the machine stator current, because it is non-invasive (a Hall sensor or a current transformer placed in the line feeding the machine can acquire the current), can be acquired on-line, without disturbing the machine work, and can identify a wide range of simultaneous machine faults. Each type of fault generates a characteristic signature in the stator current, and, thus, it is possible to detect different type of faults by the on-line analysis of the machine current. Furthermore, it is easy to adapt this approach to other IM quantities.

2.2. Methods to Obtain Fault Representative Features

Under steady-state regime, the stator current analysis is performed using the frequency spectrum of the stator current, via the FFT [14]. Nevertheless, in many modern industrial processes, IMs operate under transient conditions (due to varying loads, action of controllers, etc.). The methods used for obtaining fault representative features and analyzing them in steady-state regime are usually not valid in transient state (for example, the FFT cannot be used under varying speed conditions). On the contrary, most methods designed for transient state diagnosis are also valid for the detection of failures in steady-state condition, but at the cost of a higher computational complexity both of the set of diagnostic features and of the analysis algorithms. For these reasons, this research focuses on the fault diagnosis both in steady-state regime and in transient state.
Recently, the development of diagnostic techniques focused on machines working in transient regimes have attracted the attention of many researches, giving raise to works as [15,16,17] dealing with this subject. In [15] the empirical mode decomposition (EMD) is used to obtain the fault features. The proposed approach, to obtain the fault features not only needs to compute the consecutive intrinsic mode functions (IMFs) containing the fault related components, but also the average value and the zero crossing of the sum of the IMFs. This process adds disturbances losing information about the fault evolution. In [16] the discrete wavelet transform (DWT) is used to decompose the Park vector of the stator currents in 12 levels; this approach implies a dyadic decomposition of the frequency bands and a computation of the energy contained in each range. Therefore, the information used (the energy of frequency band) is not only related to the fault features but also to other components or effects such as the spectral leakage that can significantly influence on the results. In a second step, the standard deviation of this data is used as fault features being less precise. Therefore, the use of a self-organizing map (SOM) network is proposed to detect the presence or absence of a given fault.
In [17] the time-frequency plane is used to detect the fault. Nevertheless, the proposed method is only valid for the detection of the rotor broken bar fault in induction motors and only for the start-up transient. The fault feature is a complex representation of the characteristic V-shape pattern (with specific width and angle) for this fault (rotor broken bar) and this regime (start-up transient). It requires complex image treatment (dilatations, erosions, thresholds, subtraction of images, etc.) to obtain the fault features and implies a loss of fault information and a very limited field of application. Therefore, although these techniques can be also applied to obtain the fault features in steady-state regimes theses fault features would be more complex and less precise than the specific methods for steady state regimes.
A recent development in fault diagnosis of IMs allows to apply the same tool for analyzing the spectral content of the motor current in both regimes. This technique, known as harmonic order tracking analysis (HOTA) [4,5,18] allows to design a unique expert system for both regimes. Therefore, it is chosen as the basis of the diagnostic system generator proposed in this paper.

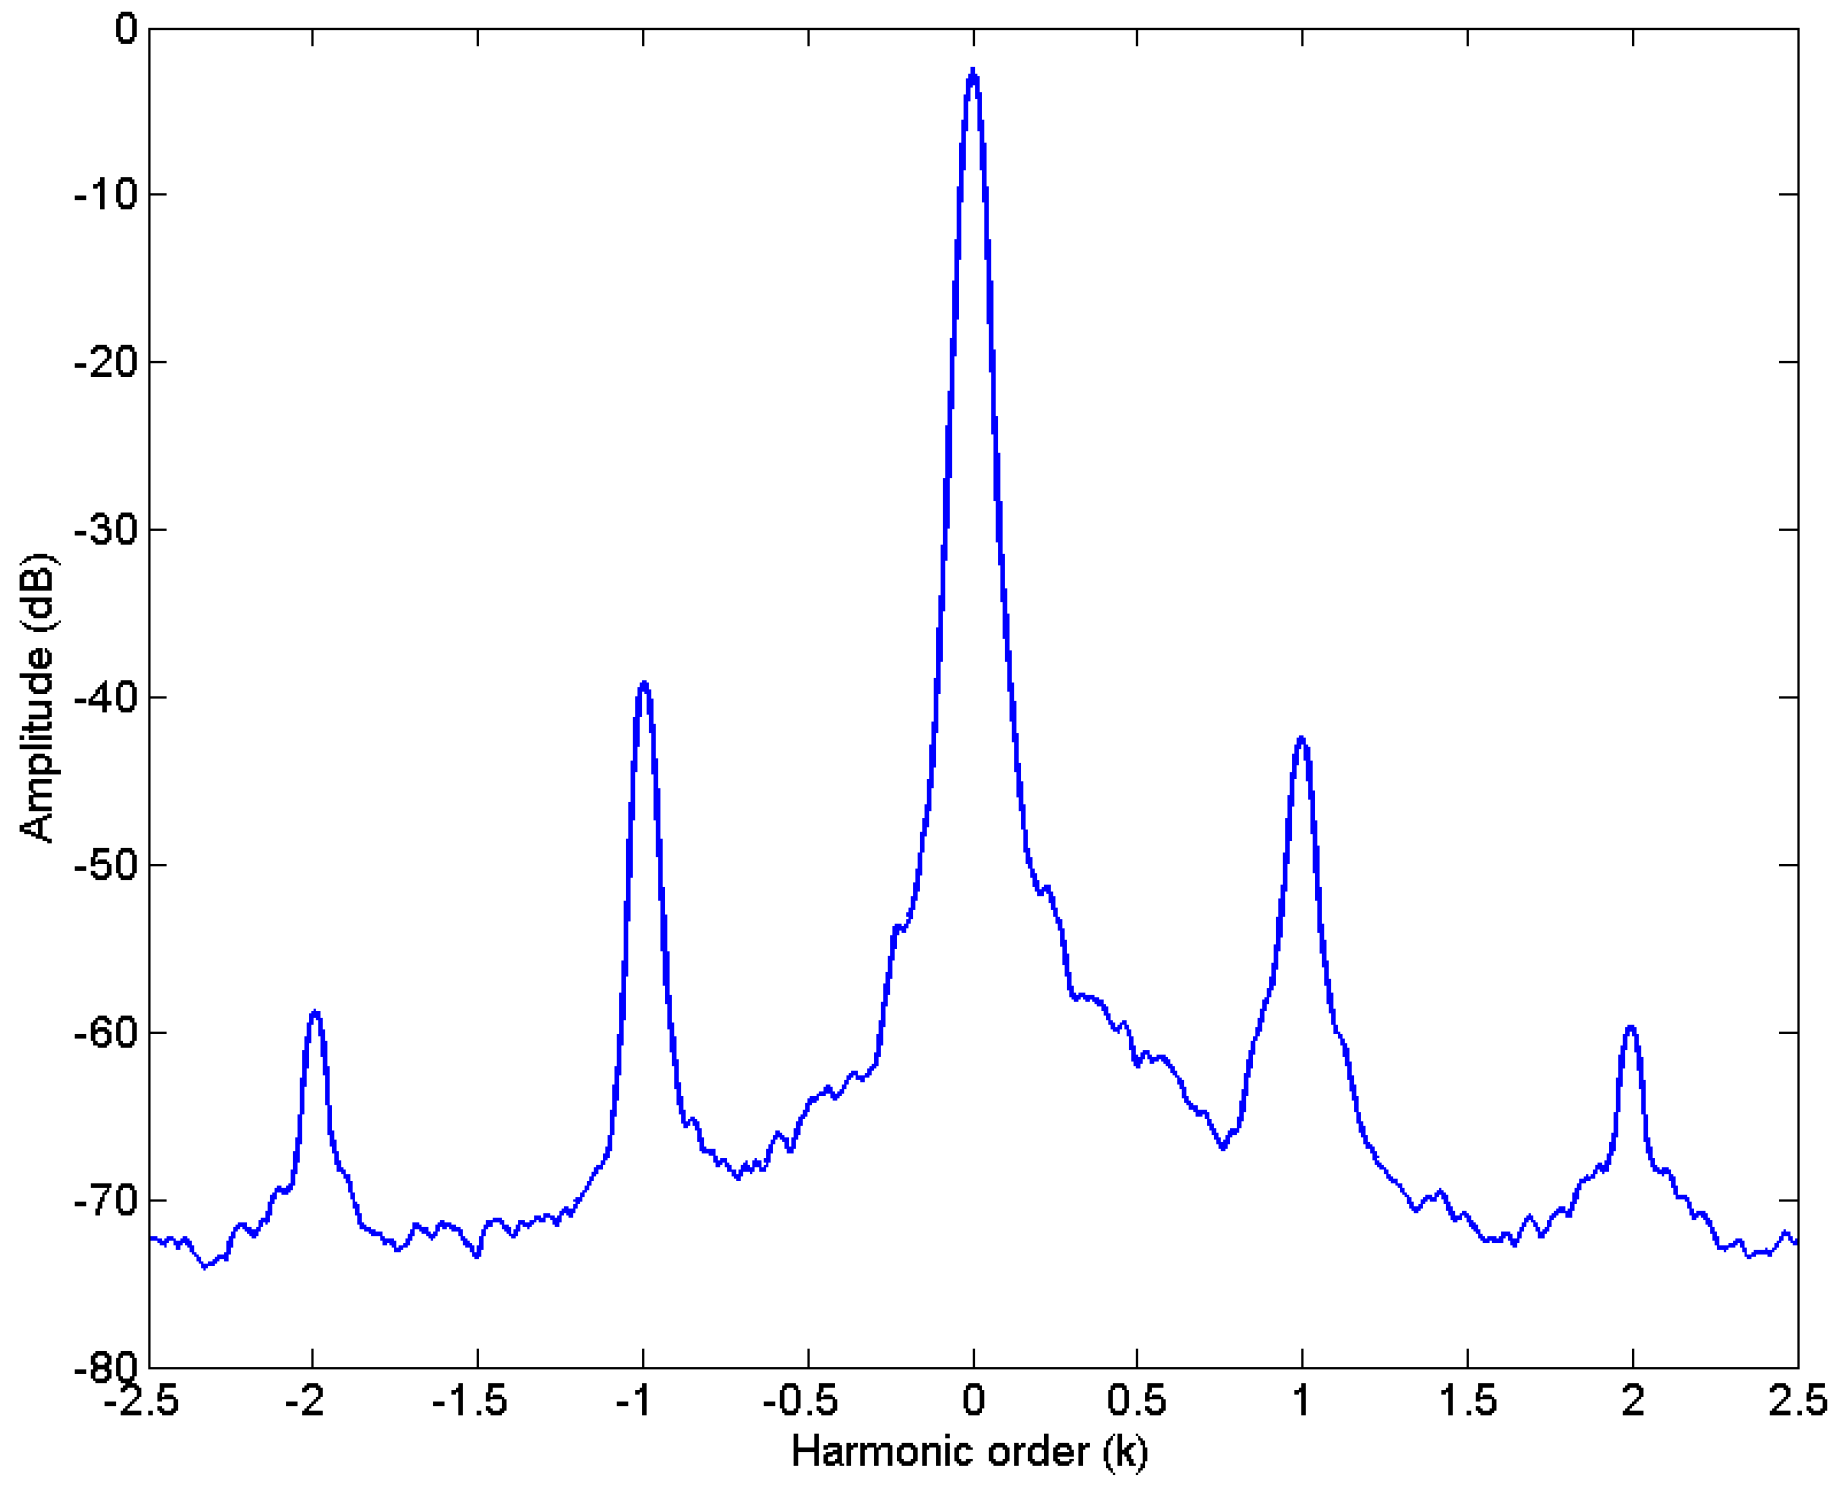
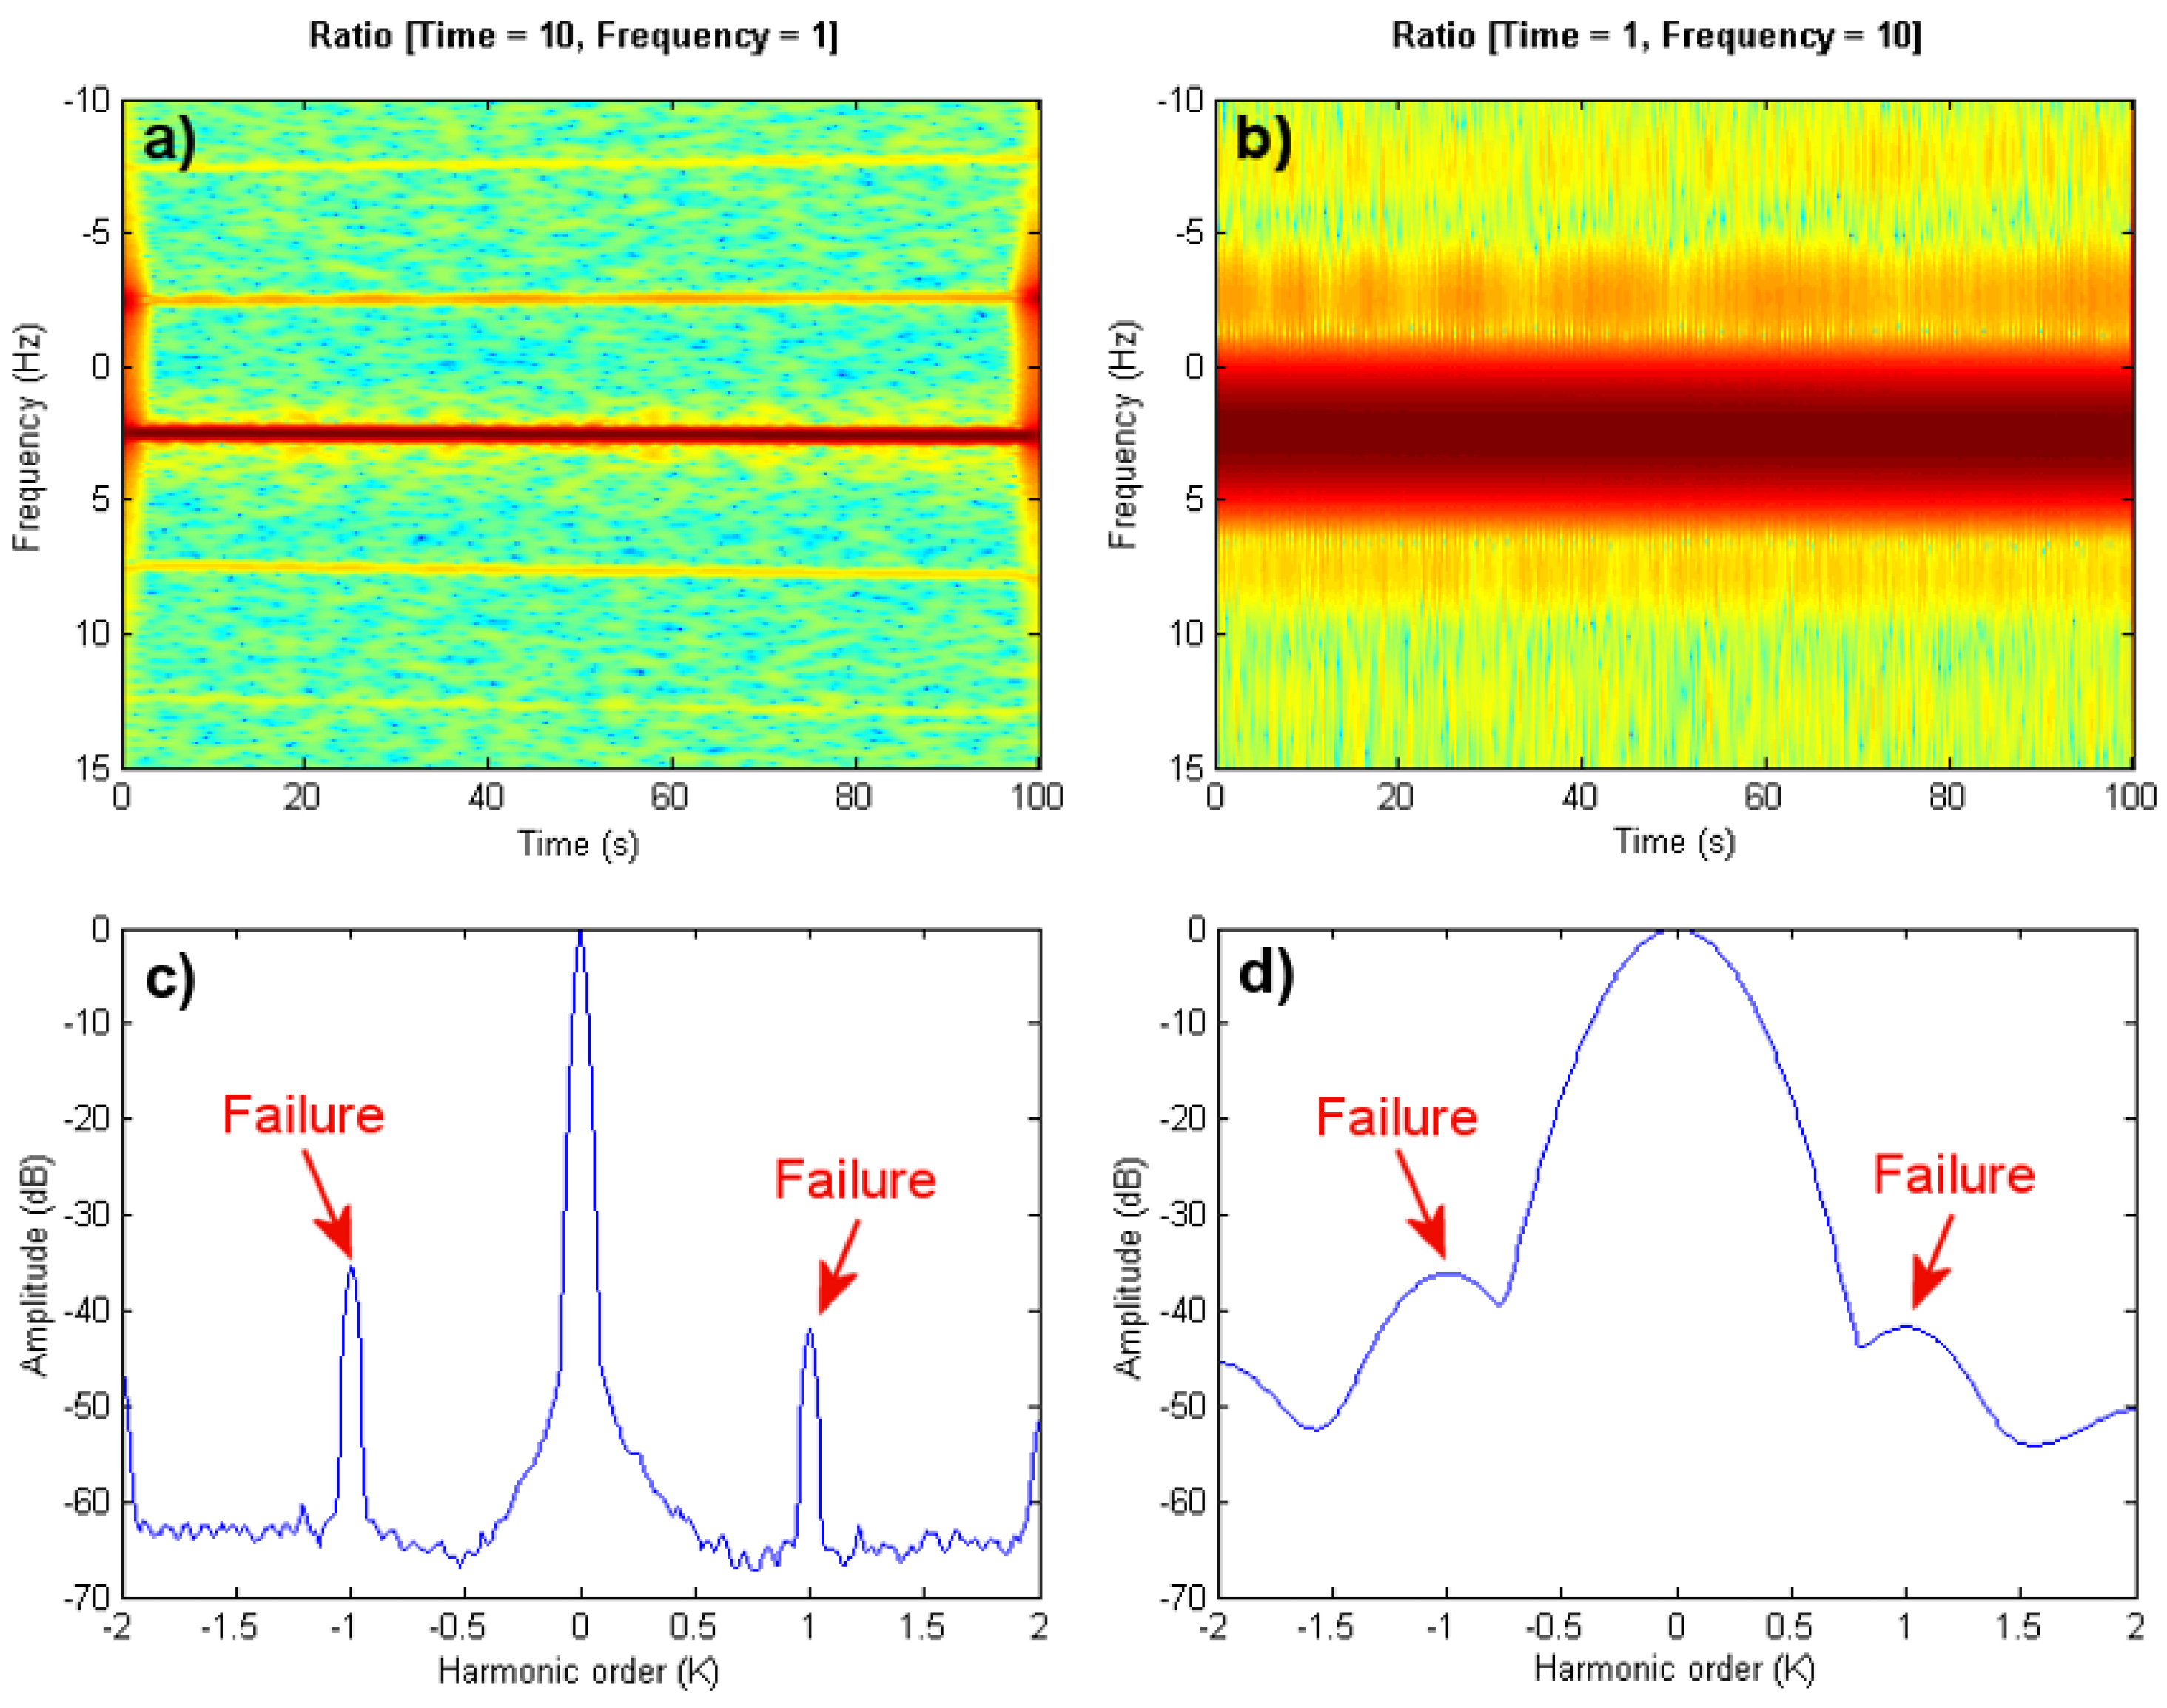
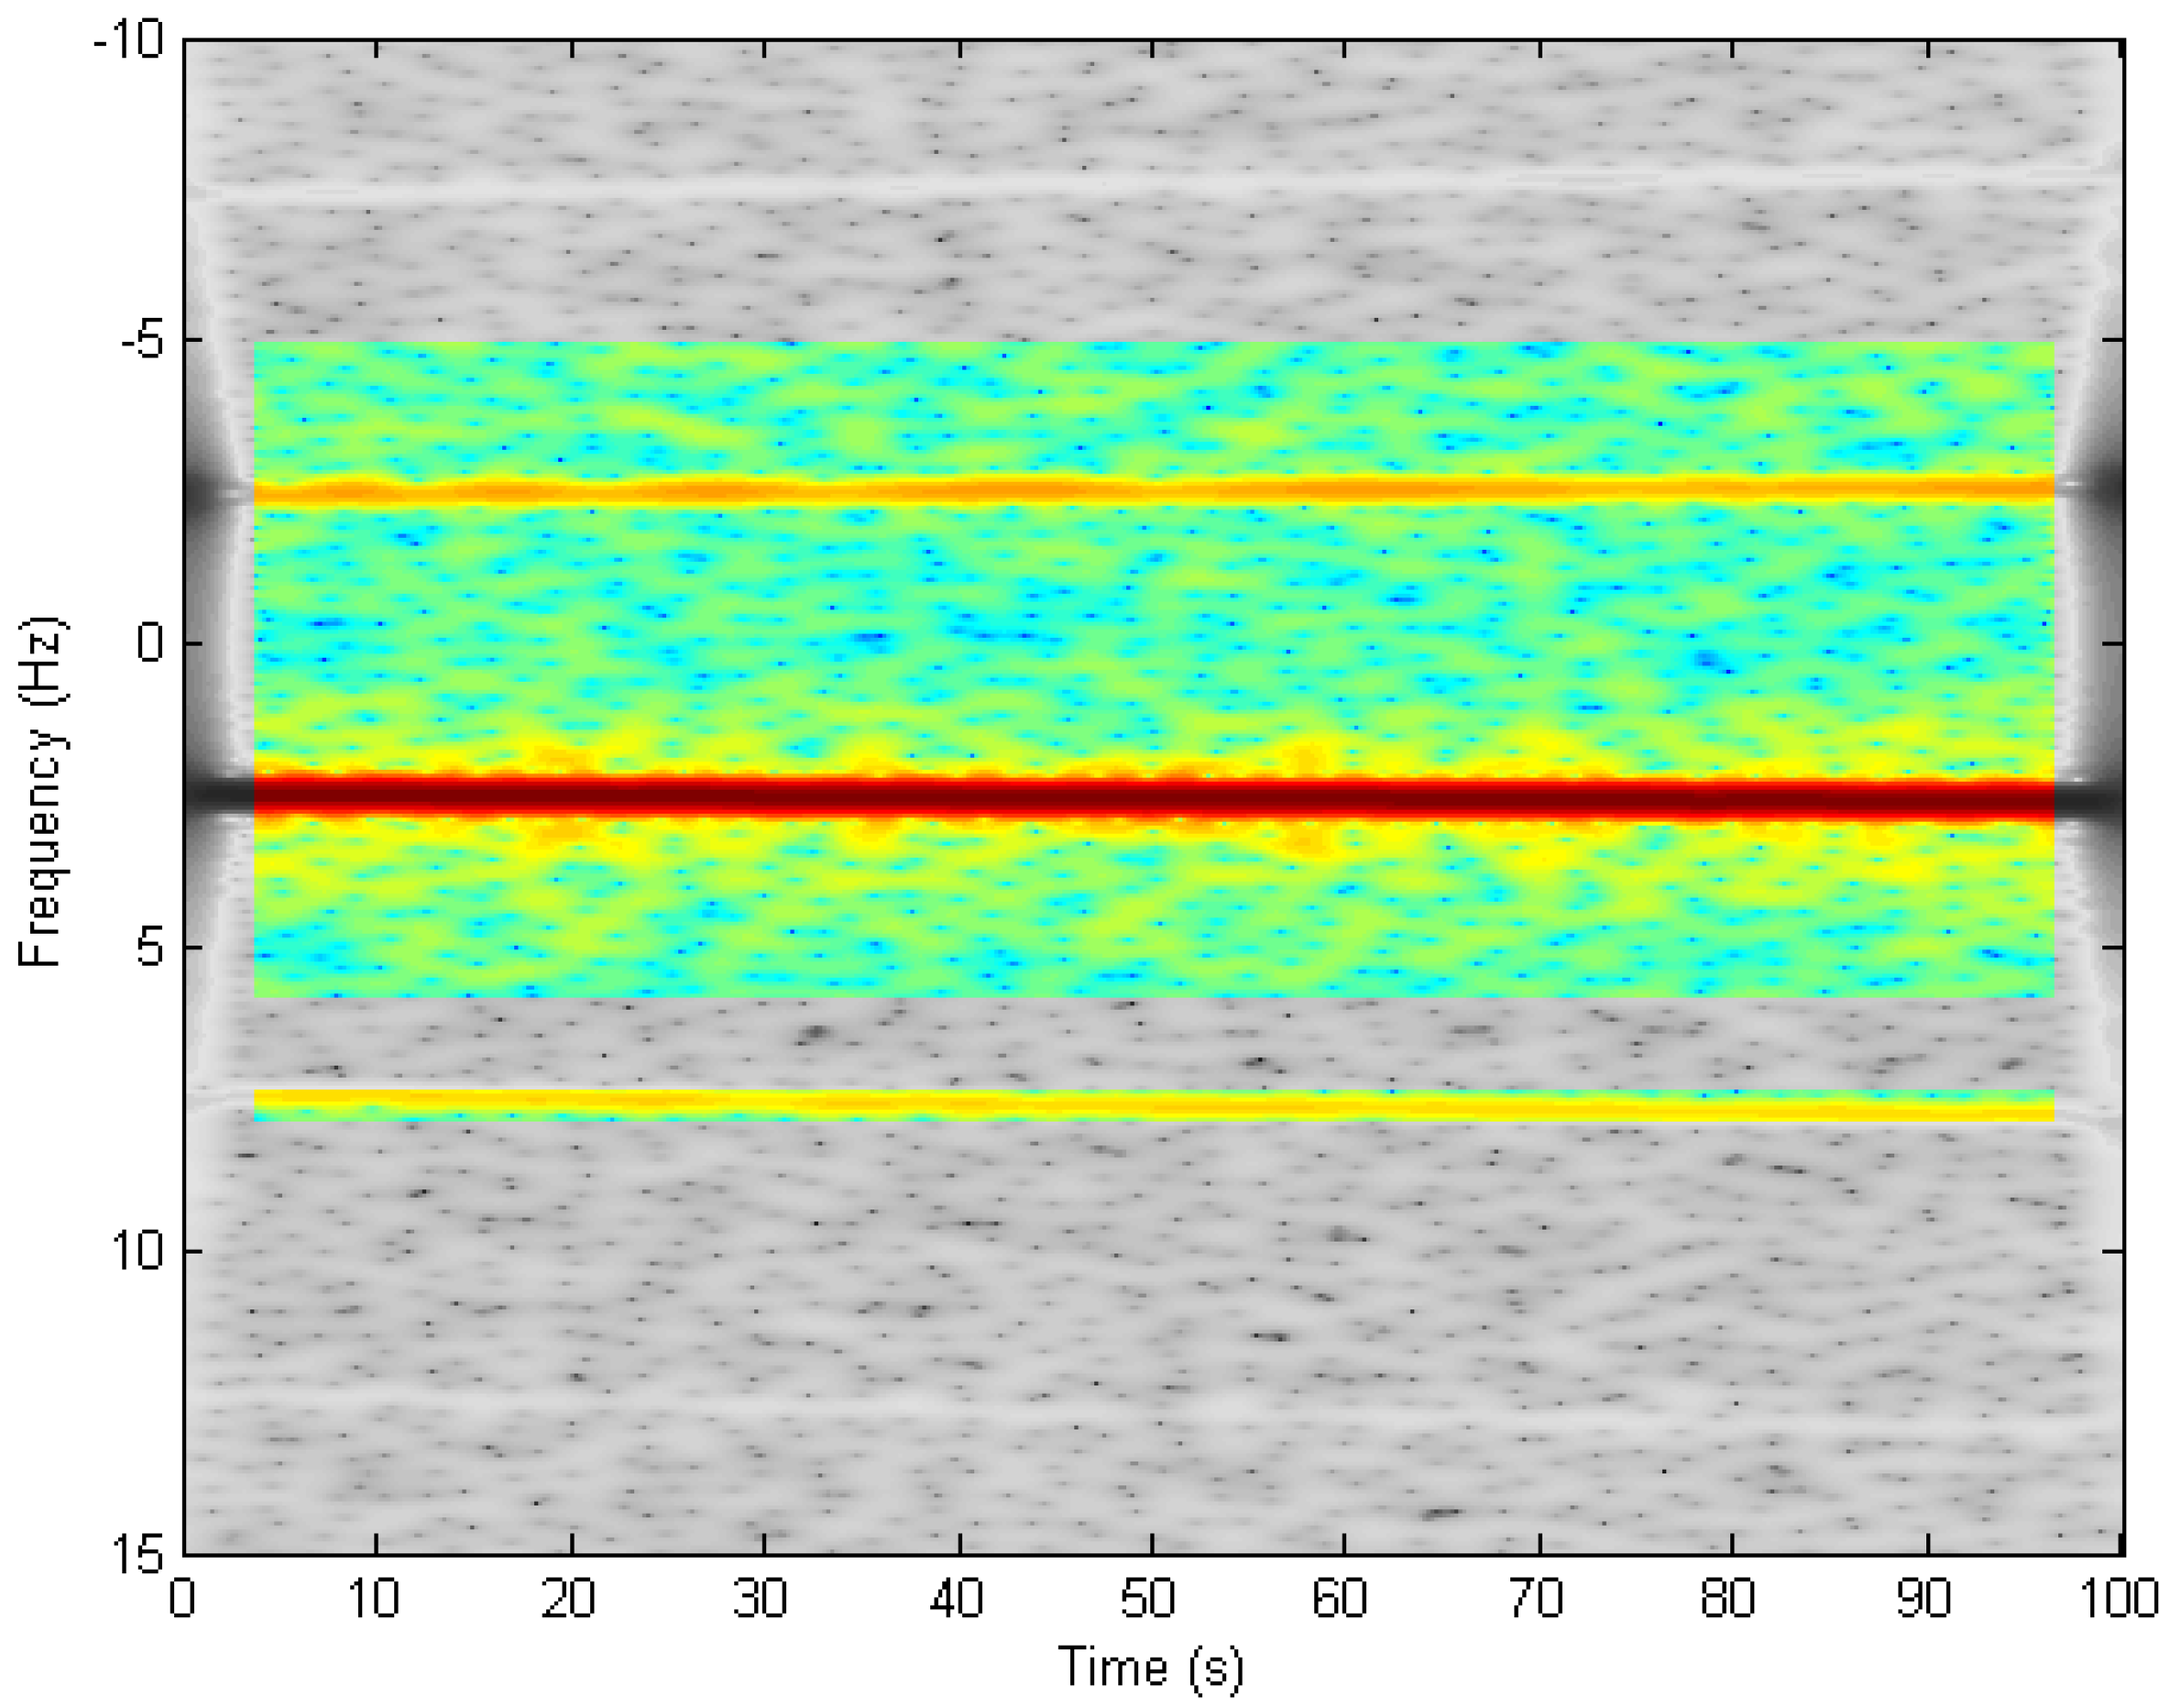
2.3. The Harmonic Order Tracking Analysis (HOTA) Method

In this section, the HOTA method, introduced in [4,5,18], is briefly described. Unlike other methods where the frequency position of fault features (obtained from the current or its envelope) depend on other variables, in the HOTA method the fault frequencies are normalized to an integer, harmonic k-order scale, which is independent of the motor supply frequency and of the motor slip. This further simplifies and accelerates the procedure of conditioning the current signal prior to its processing by the expert system.
HOTA method for transient state is a method based on reducing the 2D time-frequency content of the fault harmonics of the motor current to a much simpler 1D harmonic k-order domain. As explained in [5], this simplification process is implemented using a Gaussian window and a short time Fourier transform (STFT), by iteratively moving the Gaussian window along the time domain and performing the frequency axis re-scaling at each step (see an example in Figure 1).
An alternative option is to replace the STFT transform in HOTA by the short-frequency Fourier transform (SFFT), as in [6]. SFFT generates a time-frequency Gaussian window which is displaced along the frequency axis, instead of the time axis (Figure 1). Both the STFT and the SFFT transform generate the same time/frequency representations, although the SFFT has speed computing advantages when applied to fault diagnosis of IMs, as will be shown in Section 4.1.
In the last step of HOTA algorithm, once the time/frequency space is generated, a conversion into the harmonic k-order domain is made, obtaining as a result a single vector. Inside this vector each fault component is clearly shown through its k component number, as shown in Figure 2. This figure shows an example of the final result generated from the time-harmonic k-order space example shown in Figure 1. This graphic shows a fault k component within the harmonic k-order domain corresponding to a rotor broken bar fault.

3. Expert Systems for Features Classification

Expert systems implementation to automate decision-making process are applied to interpret complex data or correlation features with some degree of uncertainty. Although diverse types of expert systems are used to resolve problems with different origins, in the field of IMs fault diagnosis the classification expert systems prevail. Classification expert systems generate discriminant results (decisions made regarding features), precluding the generation of ambiguous results.
As shown in [7,8,19], the support vector machine (SVM) expert system and artificial neural network (ANN) expert system are the most commonly used expert systems to solve features classification problems, due to their high learning coefficient of the problem. With a failure representative features database, obtained via fault diagnostic methods, these expert systems analyze and interpret the data to assess the presence or absence of an IM fault.
SVM and ANN expert systems have an input interface to the system where fault features are inserted. With these features, the expert system deduces a solution for the fault diagnosis problem. The internal part of the system is then adjusted to perform the interpretation of input data, and an output of one or more results is finally generated. Every solution is related to its respective input data.
However, in a different way about procedural programs, an expert system is not an execution of a sequence of commands that finally generate a result. Both SVM and ANN systems need to develop a previous training of the expert system to “learn” the mechanics of the problem to find the optimal solution. Adjusting the properties and parameters of the expert system to obtain a good training and good failure rates is a highly complex task, which in many cases is carried on by a manual trial and error procedure.

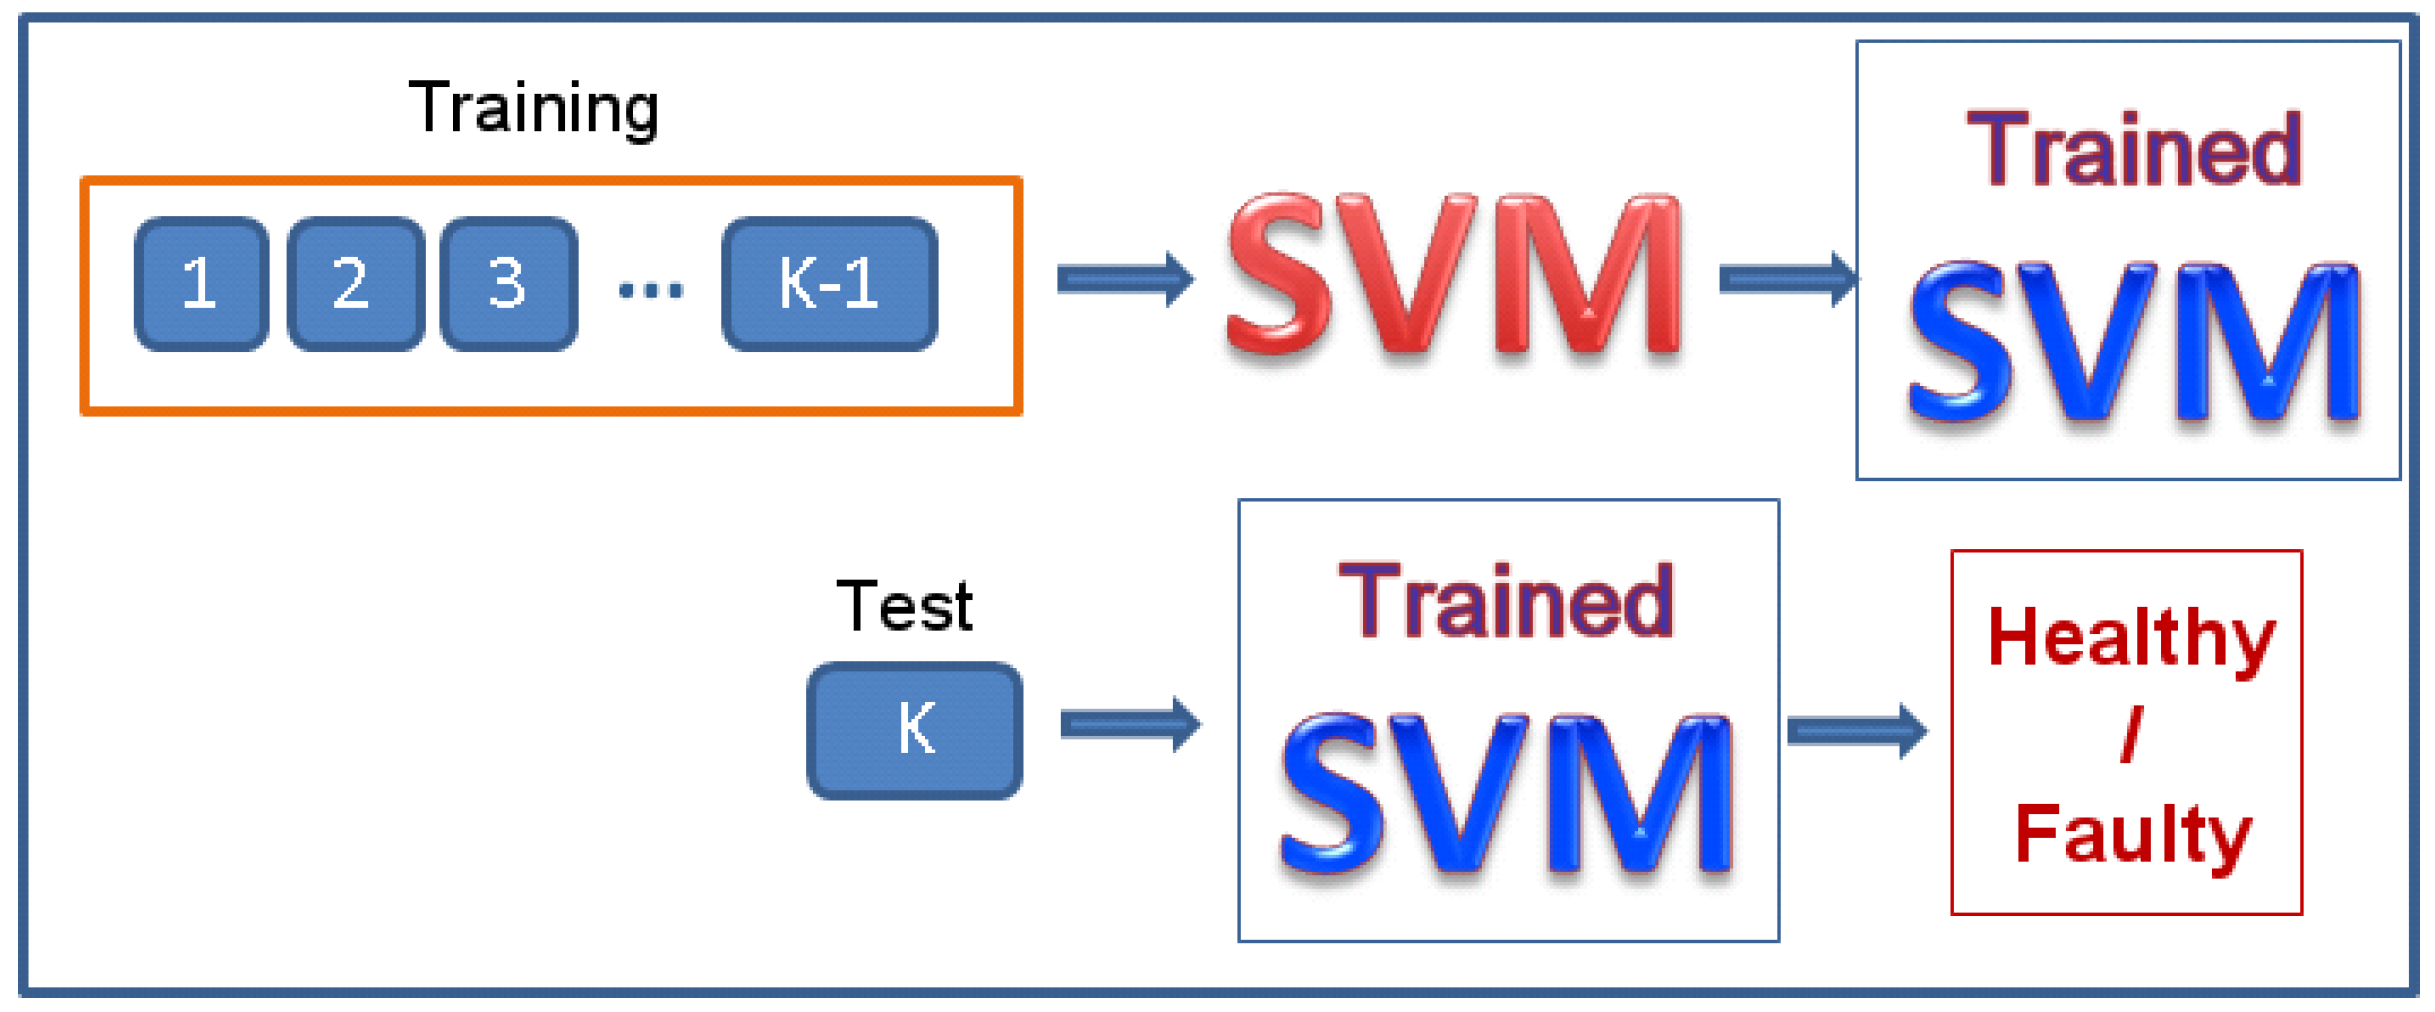
3.1. Support Vector Machine

SVM is an expert system based on n-dimensional spaces where each n parameter of the feature corresponds to the n dimension of the space (n feature parameters = n dimensions of the space). The learning stage is based on the generation of a (n−1) hyperplane that divides the n-dimensional space into two subspaces where each one represents one solution of the problem, which is sufficient to discern the occurrence or absence of fault.
In Figure 3 it is shown an example of a 2-dimensional space divided by a hyperplane generated with previous training. This SVM space has been generated with the supra-system during the experimental test described in Section 5.1.
The SVM optimization for obtaining the best system for analysis and diagnosis of failures depends on configuring the best kernel method, on the proper parameter fitting, and on the development of an optimal learning of the problem.

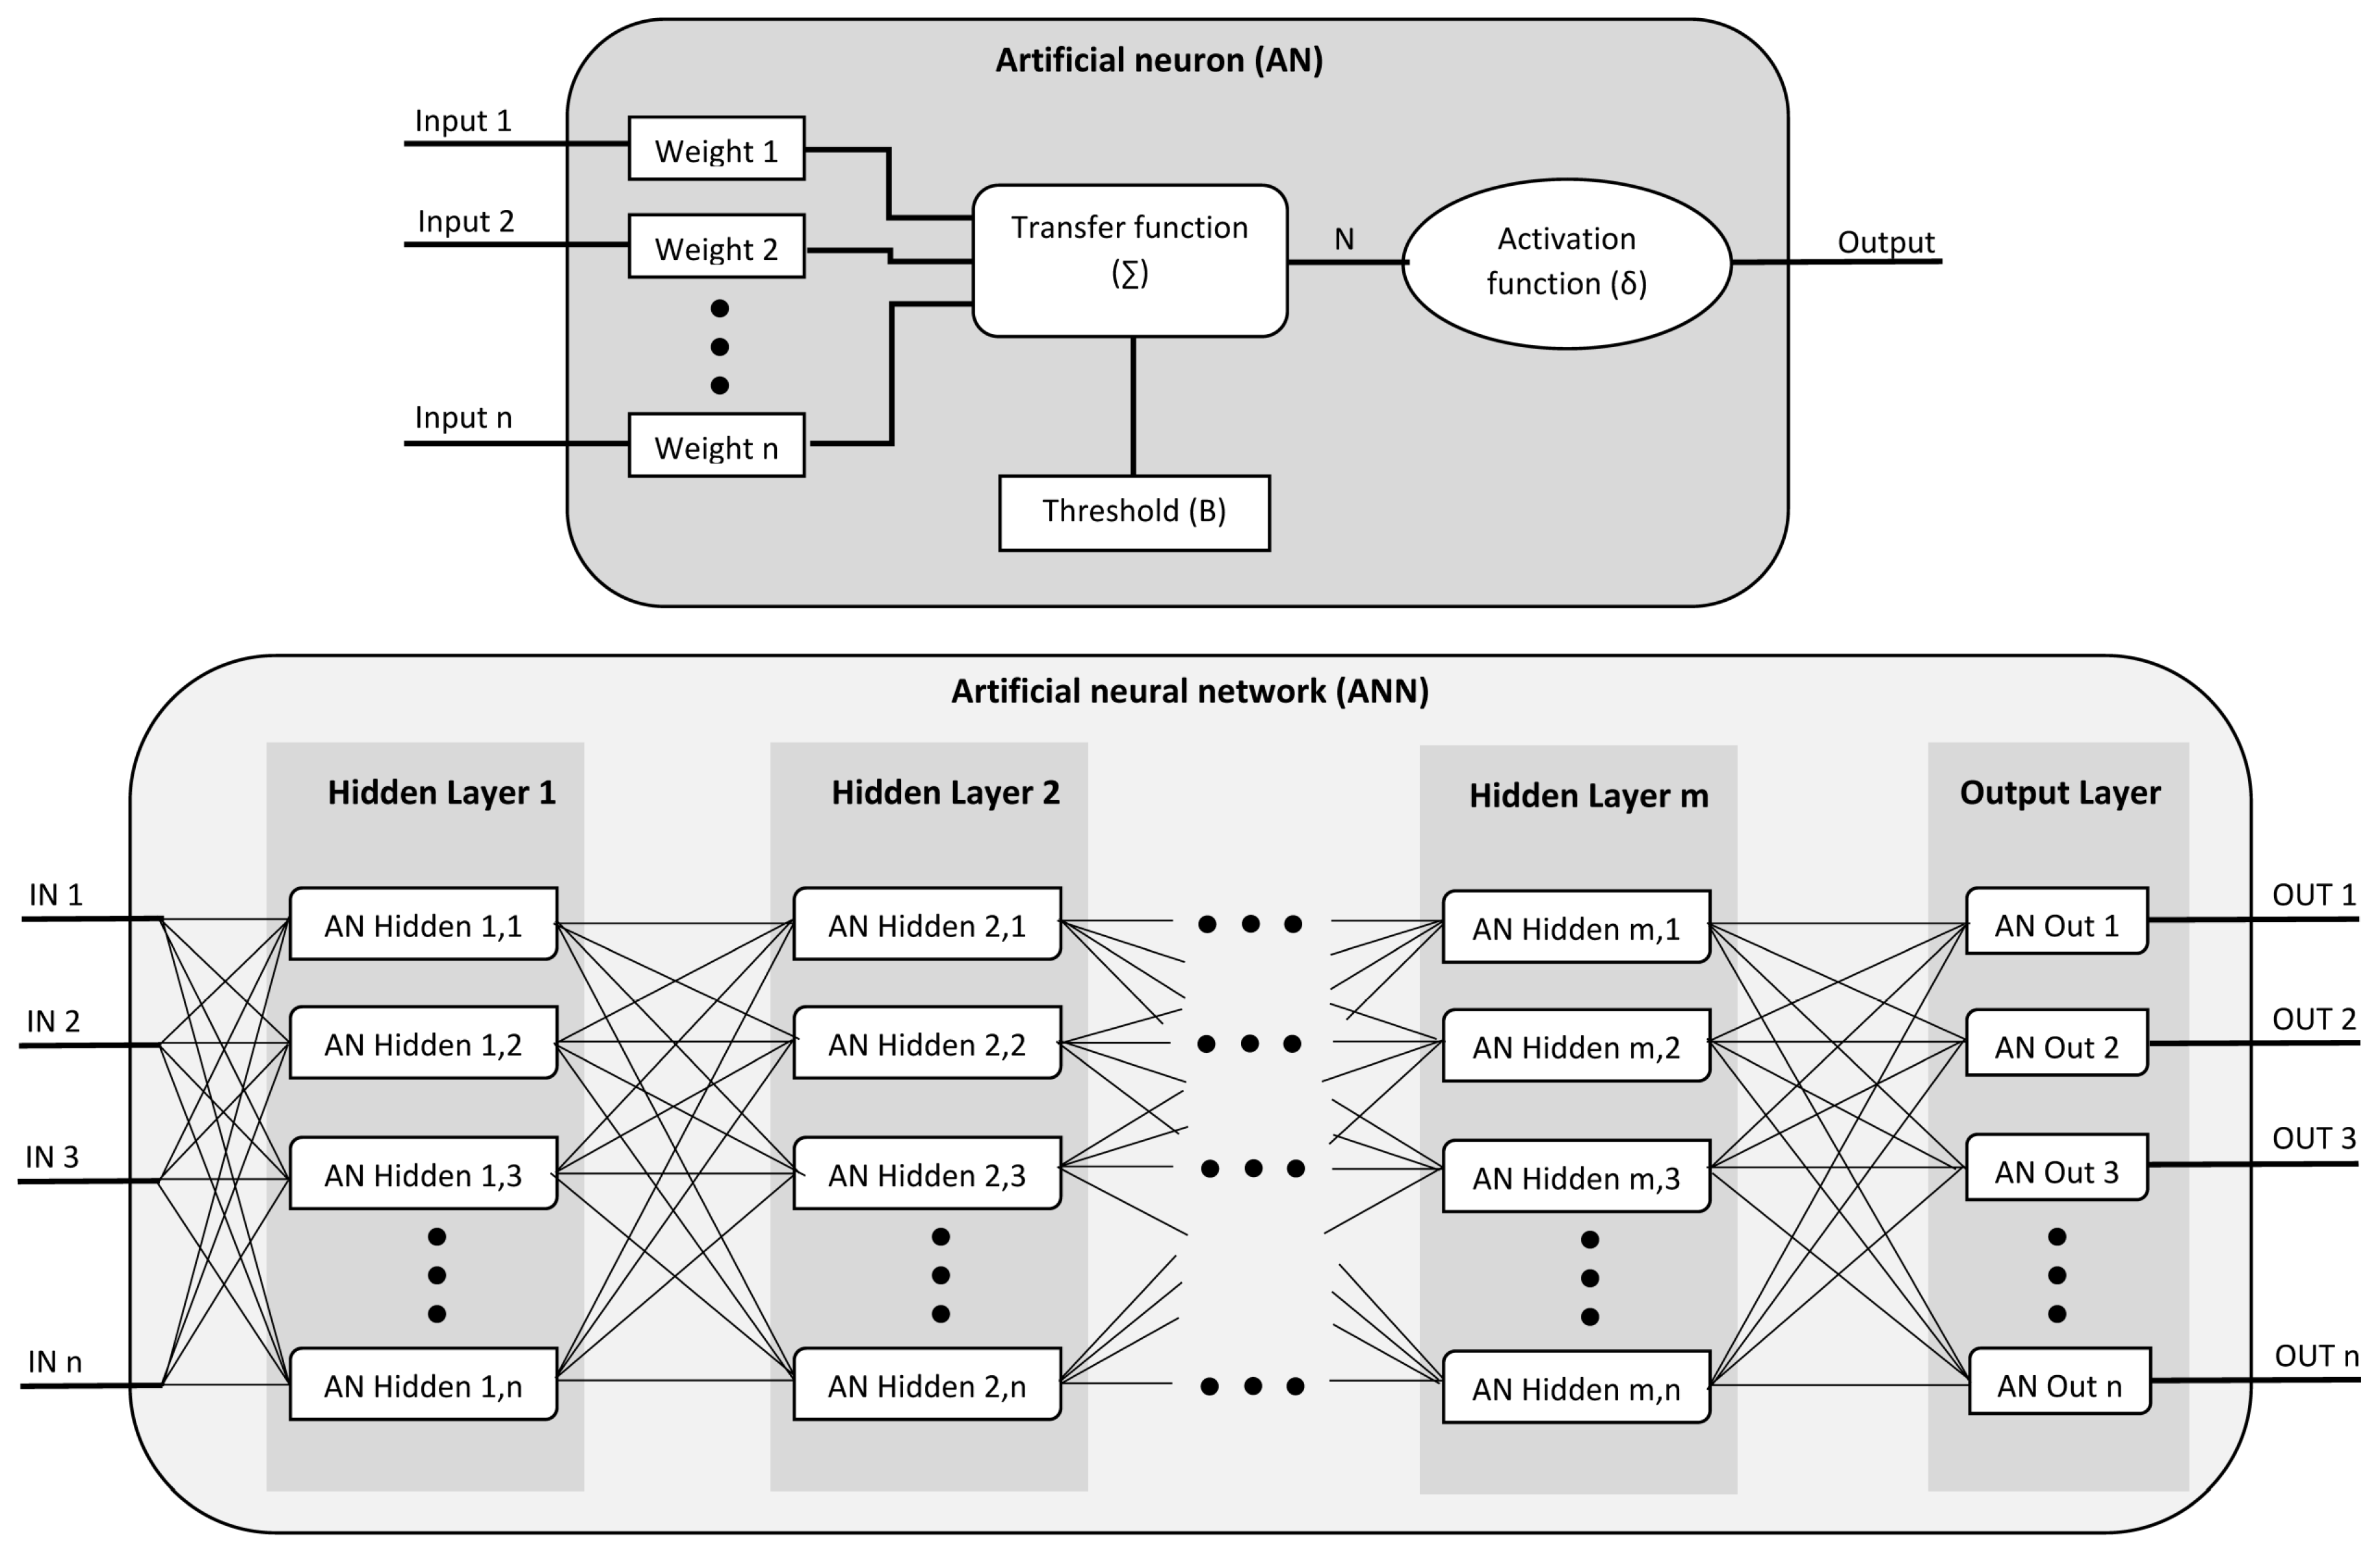
3.2. Artificial Neural Network

ANN expert systems are based on the emulation of biological neuronal networks. An ANN is composed by a set of “neurons” distributed in several interconnected layers. Although there are several types of neural networks structures and configurations, the most used for features classification is the Multilayer Perceptron. Figure 4 shows the layer structure of a Multilayer Perceptron, with an input data terminal, no or some hidden layers, and one output layer.
ANNs also must be trained before being able to correctly solve the problem. On ANN optimization, this learning is based on finding the best structure for a given problem (number of layers and number of neurons per layer) as well as the correct weight for each neuron within this network.

4. Development of the Supra-System, a System Able to Generate and Optimize Failure Diagnostic Systems Improved with Expert Systems

As presented in the previous sections, fault representative features finding methods and expert systems need to be optimized to obtain an acceptable diagnostic system. Finding the best fitting is not a trivial task since the accuracy of the expert system depends critically on the selection of its parameters. Therefore, to perform these tasks, in this paper, an autonomous system (the supra-system) is proposed. It is able not only of generating fault diagnostic systems, but also to optimize them through a set of fault representative features finding methods (Figure 5).

4.1. Optimization of HOTA Method for IMs Fault Diagnosis

In HOTA method, as in the other methods that develop time/frequency spaces, it is essential to adjust the proportion of window filter to maximize the resolution of the space and the desired frequencies. Depending on the proportion applied to the Gaussian window filter, the space resolution can be improved (Figure 6a,c) or be worsened (Figure 6b,d), hindering the fault detection.
Figure 6 shows an example of a motor with a broken bar fault, with the fault components at k = 1 and k = - 1 ; To detect properly these components in the joint time-frequency domain (t-f domain) is a challenging task, because their amplitude is much smaller than the main component amplitude. The performance of the fault diagnostic system depends critically on the analyzing window used for obtaining the t-f spectrum of the stator current. In this work, the Gaussian window has been selected, because it achieves the highest power density in the t-f domain. Nevertheless, different width to height ratios of a Gaussian window with the same minimum area in the t-f domain can alter substantially the shape of the fault harmonics. For each fault component, it can be observed that exists a specific window whose width to height ratio gives the sharpest fault components in the t-f spectrum [20], and consequently the fault components on HOTA result are also maximal (most representative fault features). Moving away from this ideal window size ratio, either in time or frequency, the resulting fault components on HOTA are less representatives for the fault. One of the goals of the supra-system presented in this paper is precisely to obtain this optimal window ratio, for generating the best t-f spectrum and the best fault representatives features in HOTA result.
The sharpness of the fault components is calculated with the mean value of the amplitude in the frequency range between the fault components ( k = 1 and k = - 1 ) and the main component. In the proposed system, the search for the best window size ratio has been optimized using a binary search algorithm [21], which is more specialized than a linear search algorithm.
As discussed above, the t-f spectrum is generated with a STFT transform. Nevertheless, as explained in [6], a SFFT transform can be used instead STFT, obtaining the same t-f spectrum. It is remarkable that the use of the SFFT in diagnostic applications reduces greatly the required computational power, regarding the STFT. This is due to the fact that the fault frequencies to be analyzed are known and the SFFT is able to generate the t-f spectrum by moving the Gaussian window in the frequency domain within a limited range close to the desired frequencies. This can be seen in Figure 7, where the results of the SFFT are shown in color, whereas the gray zone shows the results of the t-f spectrogram as obtained with the traditional STFT.

4.2. Optimization of the Learning Process of the SVM Expert System for IMs Fault Diagnosis

The SVM expert system is quite optimal in solving problems that show a poorly linear distribution in its solutions. Nevertheless, its flexibility implies that it is necessary to adjust several coefficients during the training process to obtain a satisfactory learning of the expert system. The goal of the supra-system presented in this paper is also to optimize the value of such coefficients in an automatic way.
SVM allows different kernels to transform the space form to improve the discrimination of different features with the use of a hyperplane. In [10] several common kernels are discussed. In particular, with the Polynomial Kernel (1) and Radial Basis Function (RBF) kernel (2), it is possible to solve almost all cases where the solution distribution of the problem goes from totally linear to scarcely linear.
K ( x i , x j ) = ( 1 + x i T x j ) d
K ( x i , x j ) = e x p - x i - x j 2 σ 2
To use one of these two kernels one must set two parameters in order to obtain an optimum learning SVM. If a Polynomial Kernel is used, it is necessary to set the pair of parameters δ ( C , d ) , where C is the box limit parameter for the search box during training and d is the polynomial order. If a RBF kernel is used, the pair of parameters that must be set are δ ( C , σ ) , where C is the box limit parameter and σ is the scale factor of the Gaussian function.
In [10] it is explained how to fit these parameters by a mesh search method. Although this fitting method is less optimal than others with lower execution time, it guarantees a good approximation to the global solution avoiding local solutions that can be found by other heuristic fitting methods.
Like the scheme in Figure 8, the mesh search method divides each parameter reachable range into subsets (similar to a mesh). On each subset an SVM is trained with the parameters of this subset, obtaining an estimation of its hit rate. Finally, the subset with the trained SVM with highest hit rate is selected and the described process is iterated in a depth search until the subset with the highest hit rate (without over-training) is obtained.
It is relevant that all these trained SVM, generated during the mesh search, have had an optimal training to obtain a good approximation to the real hit rate. Achieving an optimal training for each SVM is another issue that is addressed in the supra-system presented in this paper.
An expert system cannot be trained directly with the whole training set of fault features to obtain its hit ratio. Otherwise, the hit ratio would be erroneous. There are several methods to train and validate an SVM, but the most reliable for obtaining the best hit ratio approximation for SVM is the ‘leave one out cross validation’ method. With this method, the number of SVMs trained are equal to the number of fault features. In the particular field of IMs fault diagnosis, the number of fault features are not very high and therefore the computational complexity is acceptable.
As described the scheme for the ‘leave one out cross validation’ (Figure 9), for each feature k, a trained SVM is generated with the remaining features, that is, excluding k feature. Once the SVM has been trained, then the k feature is validated. Repeating this process for the whole set of fault features, it yields finally an approximate hit ratio quite close to the actual hit ratio.

4.3. Optimization of the Learning Process of ANN Expert System for IMs Fault Diagnosis

ANN expert systems are quite optimal in problem solving and may even be better than SVM when the distribution of problem solutions is highly non-linear. In contrast, the complexity to train and optimize an ANN expert system that solves the problem is greater than in the case of an SVM system.
The optimization of the structure of an ANN expert system implies the selection of the number of neurons per layer and the number of layers. These choices are relevant, since they influence the quality of learning and the accuracy of the results. For each concrete problem to solve, there is an optimal structural configuration. Training an unoptimized structure may lead to under-training or over-training the problem.
As of today, there is not a well defined method to find an optimal structural network in a direct way. However, in the case of neural networks for classification, several methodological rules have been published that discuss the structural limits of the network [10,11]. For classification problems these researches recommend a hidden layer range in the network between one and two layers, a heuristic search algorithm for fitting optimal network structure, and the best internal configuration for each neuron [9].
A stochastic search with heuristic optimization using the pyramid rule has been chosen to search the optimal structural network for IMs fault diagnosis. In the pyramid rule it is assumed that the best initial structure for searching optimal network has a trapezoidal pyramid shape where the network base are the inputs and the top are the outputs.
In the case of classification problems for ANN developed in the artificial intelligence field, as shown in Table 1, for each hidden layer’s neuron is assigned a “hyperbolic tangent Sigmoid” transfer function. On the other hand, on the output layer, for each neuron a ‘Competitive SoftMax’ transfer function is used, whose output acquires the maximum value while the other outputs are cancelled.
It must be emphasized that both optimizing methods for ANN network structure and configuration used in this work are only valid and optimal when the ANN is used to solve classification problems. Therefore, these methods are valid for IMs fault diagnosis since it is a classification problem (healthy/faulty).
In each step of this ANN structural optimization algorithm, a specific network structure is generated (specific number of layers and number of neurons per layer). For each generated structure an optimal training and validation must be carried out to obtain a valid approximation hit rate for this ANN structure. The highest hit rate when the ANN structural optimization algorithm has finished is declared as the best approximation hit rate and its structure is the optimum one to solve the IMs classification problem.
For ANN, the ‘leave one out cross validation’ method is not optimal to obtain a good approximation of the hit ratio, due to the operative of the algorithms used to train ANN expert systems. Accordingly, in this research, it has been implemented for training the ANN a ‘training/validation/test cross validation’ method. This method, shown in the scheme of Figure 10, iterates in a loop of 100 iterations (100 basic trainings) where the fault characteristics are distributed in each iteration between the training, validation, and test sets. Between 60 and 80 percent of features are assigned to the training set, between 10 and 20 percent features for the test set, and the rest is assigned to the validation set.
In the ‘training/validation/test cross validation’ method, it is important that the features selected on each set are representative of the whole range of values that the fault features can reach. In this research, this issue has been solved with the generation of a features space and its segmentation in a random sequence.
As analyzed in [12], there are several learning algorithms based on a gradient back-propagation, where each one has its advantages and disadvantages. The scaled conjugate gradient back-propagation algorithm has been chosen in this work as it guarantees a global optimal learning for classification problems with a moderate computational complexity, and without over-training locally (for the specific ANN structure trained).
The cost function used to minimize the gradient error is the ‘cross entropy’ formulated as:
F C = - 1 n · i = 1 n y i · l n ( a i ) + ( 1 - y i ) · l n ( 1 - y i )
where the variable n denotes the total number of features for training, variable a stands for actual outputs and variable y stands for desired outputs.

5. Experimental Validation
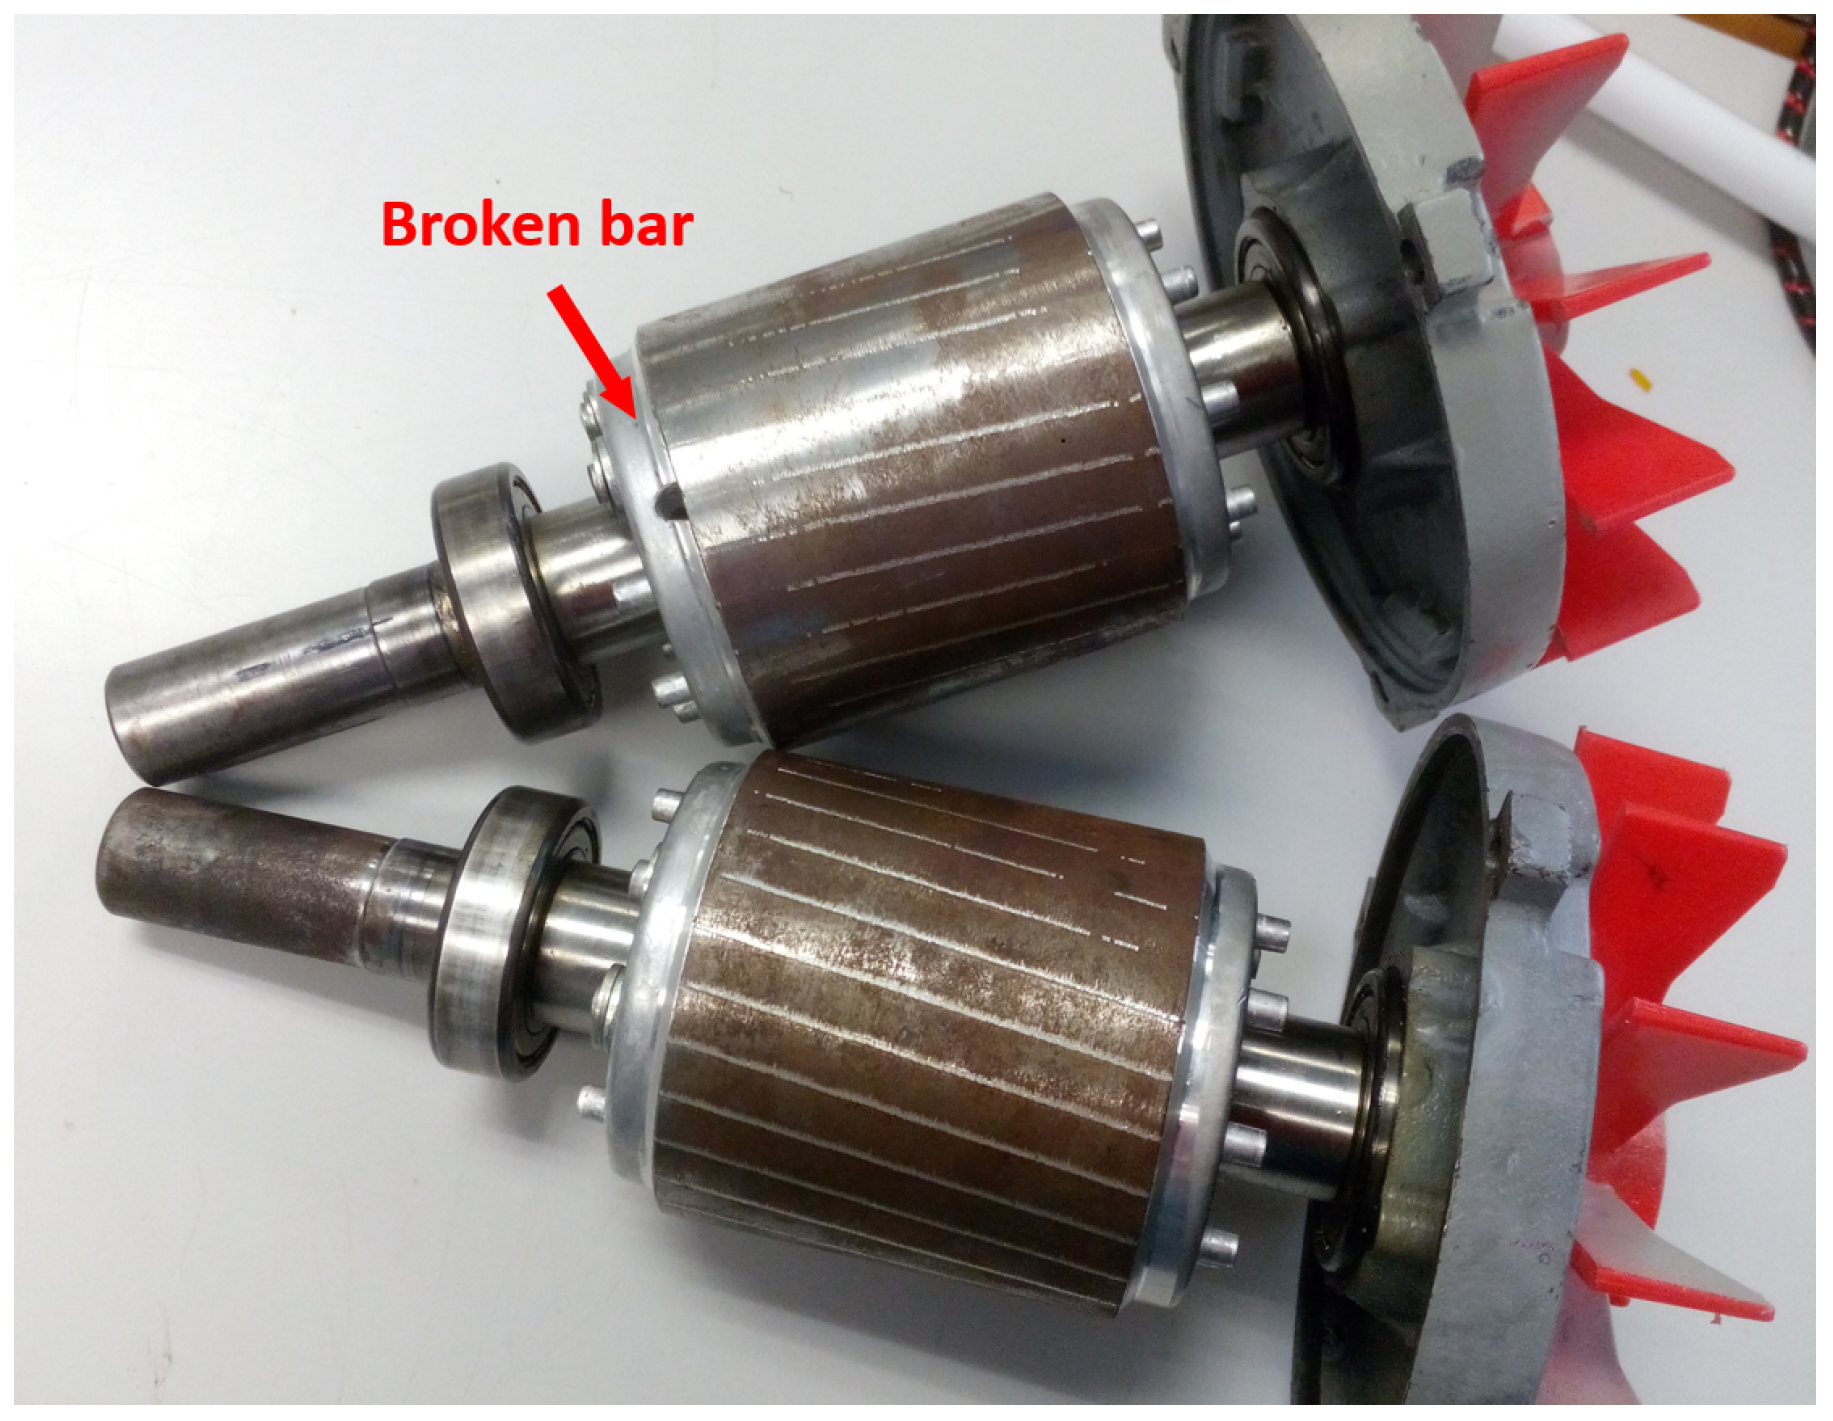
The experimental validation of the supra-system has been carried out to detect rotor broken bars as in [1,3,22]. Nonetheless, this supra-system can be easily adapted to detect other types of faults such as eccentricity, stator inter-turn short circuits and bearing faults.

5.1. Test Bed

Figure 11 shows the test bed used in this paper. Two squirrel cage IMs whose main characteristics are given in Appendix A were tested, one in healthy conditions the other with a rotor broken bar fault. The broken bar fault was created by drilling a hole in one bar, in the junction of the bar with the end ring, as can be seen in Figure 12. This way to produce the bar breakage avoids damaging the magnetic circuit of the rotor and enables an easy verification of the complete disconnection between the bar and the end ring. To cover a wide scenario of industrial situation, the motor under test has been feed, alternatively, through variable speed drives (VSDs) of two different brands (ABB model ACS800 and Siemens model M440) with up to four different control strategies (scalar, scalar with slip compensation, field oriented control (FOC) and direct torque control (DTC)) and direct on-line (DOL) through an autotransformer. A permanent magnet synchronous machine (PMSM) is used as a mechanical load controlled by a drive ABB model ACSM1-04AS-024A-4. The test bed is controlled using a programmable logic controller (PLC) and a system control and data acquisition (SCADA) system which allows to perform the test in an automatic way and to repeat accurately the same conditions with different motors under test. A digital oscilloscope model Yokogawa DL750 has been used to acquire the currents during the different performed tests.
In this case, the test bed has been used for detecting broken bars fault, as in [1,3,22], but it can be easily adapted to detect other faults such as inter-turn short circuits, bearing damages or eccentricities. Indeed, other IMs with different faults can be coupled in the test bed and the tests set can be performed automatically.

5.2. Experimental Results

The supra-system generator has been implemented in MATLAB R2014 platform for evaluating its feasibility, the supra-system generator is applied to a large set of experimental current samples, obtained through the test bed described in the previous section, testing healthy and faulty IMs under different conditions (supply conditions, load conditions).
The samples database generated in this research comprises 726 phase current samples, with 369 healthy rotor samples and 357 faulty rotor samples. During the sampling process the frequency and load torque has been changed to obtain also transient regime samples. Table 2 summarizes the conditions under which the tests were conducted.
The supra-system developed in this work has explored and optimized a search space given by all the possible combinations of the following diagnostic systems options:
  • two HOTA implementations (with STFT or SFFT).
  • two SVM expert system variants (with Polynomial or RBF Kernel).
  • two ANN expert system variants (one or two hidden layers)
By an optimized search in this search space, applying the techniques introduced in Section 4.1, the global optimum result (the best fault diagnostic system) is obtained, that is, the optimized expert system for IMs fault diagnosis which has the highest diagnosis hit rate.

5.3. Time Required by the Supra-System to Generate Locals and Global Optimized IMs Fault Diagnostic Systems

In this experimental test, 286044 SVM expert systems and 252000 ANN expert systems have been analyzed in the process of finding the final optimum fault diagnostic system by the supra-system. The total time used for training (Table 3) and for classification of the IM condition (Table 4) shows that the fastest approach is to use the SFFT technique for implementing the HOTA method.

5.4. Hit Rates Obtained by the Expert Systems for IMs Fault Diagnosis Generated by the Supra-System

The hit rates obtained by the expert systems generated by the supra-system Table 5, are very high, giving a very efficient IM fault diagnostic system. It is relevant that, although SVM and ANN expert systems have different implementations, in both cases the hit rates are very similar. This similarity means that:
  • In both expert systems the maximum hits ratio has been reached (the optimal diagnostic system).
  • None of these local diagnostic system shows over-training. Otherwise it would show a higher hit ratio much closer to 100% and hit ratios values would be more different between local diagnosis systems.
HOTA implementing SFFT with SVM with Polynomial Kernel and HOTA implementing SFFT with ANN with 2 hidden layers lead to the same result. In both cases a global optimum diagnostic system is obtained, with the best hit ratio and with the lowest diagnosis time. Therefore the use of one or another for diagnosis would be only a user decision.
Even so, the others diagnostic systems (optimal local but not optimal global) also show an excellent hit ratio with a low diagnostic time. All of them are very well optimized and could be used alike.

6. Conclusions

In this research a supra-system implementation has been proposed to generate an optimized fault diagnostic system. This supra-system has shown the following advantages regarding to traditional expert systems:
  • All the diagnostic systems generated are suitable to be used in transient regime operation.
  • The generation process is totally automated. That is, starting on the samples input until finishing the generation of optimum diagnostic system no user intervention is required at all.
  • The generation process is totally autonomous. That is, it is not necessary to carry out any control or adjustment task on the supra-system for a successful development of the optimum diagnostic system.
This supra-system has been experimentally tested and validated, confirming that it achieves the proposed goals. The supra-system approach solves a practical industrial problem in the field of IMs fault diagnosis area, especially in transient regime, where the generation of a conventional expert diagnostic system must be manually customized for each specific motor structure.
The application of the supra-system approach to the design of IMs fault diagnostic systems addressing other types of faults (bearings faults, eccentricity, etc.) is straightforward by using the fault features of this types of fault which can be extracted with the same methods as those proposed in this paper.

Author Contributions

Conceptualization, J.M.-R. and M.R.-G.; Data curation, J.B.-V. and J.M.-R.; Formal analysis, J.B.-V. and R.P.-P.; Investigation, A.S.-B. and J.P.-C.; Methodology, J.B.-V., R.P.-P. and J.P.-C.; Project administration, M.P.-S.; Resources, M.P.-S.; Supervision, R.P.-P., M.P.-S. and M.R.-G.; Validation, J.B.-V., J.M.-R., A.S.-B., J.P.-C. and M.R.-G.; Writing—original draft, J.B.-V. and M.P.-S.; Writing—review and editing, A.S.-B., M.P.-S. and M.R.-G. These authors contributed equally to this work.

Funding

This research received no external funding.

Conflicts of Interest

The authors declare no conflict of interest.

Appendix A

Squirrel Cage Induction Motor Three-phase squirrel cage induction motor, star connection. Rated characteristics: P = 1.5 kW, f = 50 Hz, U = 400 V, I = 3.25 A, n = 2860 rpm and cos φ = 0.85.

References

  1. Puche-Panadero, R.; Pineda-Sanchez, M.; Riera-Guasp, M.; Roger-Folch, J.; Hurtado-Perez, E.; Perez-Cruz, J. Improved resolution of the MCSA method via Hilbert transform, enabling the diagnosis of rotor asymmetries at very low slip. IEEE Trans. Energy Convers. 2009, 24, 52–59. [Google Scholar] [CrossRef]
  2. Abd-el Malek, M.; Abdelsalam, A.K.; Hassan, O.E. Induction motor broken rotor bar fault location detection through envelope analysis of start-up current using Hilbert transform. Mech. Syst. Signal Process. 2017, 93, 332–350. [Google Scholar] [CrossRef]
  3. Martinez, J.; Belahcen, A.; Muetze, A. Analysis of the vibration magnitude of an induction motor with different numbers of broken bars. IEEE Trans. Ind. Appl. 2017, 53, 2711–2720. [Google Scholar] [CrossRef]
  4. Sapena-Bano, A.; Pineda-Sanchez, M.; Puche-Panadero, R.; Perez-Cruz, J.; Roger-Folch, J.; Riera-Guasp, M.; Martinez-Roman, J. Harmonic order tracking analysis: A novel method for fault diagnosis in induction machines. IEEE Trans. Energy Convers. 2015, 30, 833–841. [Google Scholar] [CrossRef]
  5. Sapena-Bano, A.; Burriel-Valencia, J.; Pineda-Sanchez, M.; Puche-Panadero, R.; Riera-Guasp, M. The Harmonic Order Tracking Analysis Method for the Fault Diagnosis in Induction Motors Under Time-Varying Conditions. IEEE Trans. Energy Convers. 2017, 32, 244–256. [Google Scholar] [CrossRef]
  6. Burriel-Valencia, J.; Puche-Panadero, R.; Martinez-Roman, J.; Sapena-Bano, A.; Pineda-Sanchez, M. Short-Frequency Fourier Transform for Fault Diagnosis of Induction Machines Working in Transient Regime. IEEE Trans. Instrum. Meas. 2017, 66, 432–440. [Google Scholar] [CrossRef] [Green Version]
  7. Yin, Z.; Hou, J. Recent advances on SVM-based fault diagnosis and process monitoring in complicated industrial processes. Neurocomputing 2016, 174, 643–650. [Google Scholar] [CrossRef]
  8. Bazan, G.H.; Scalassara, P.R.; Endo, W.; Goedtel, A.; Godoy, W.F.; Palácios, R.H.C. Stator fault analysis of three-phase induction motors using information measures and artificial neural networks. Electr. Power Syst. Res. 2017, 143, 347–356. [Google Scholar] [CrossRef]
  9. Beale, M.H.; Hagan, M.T.; Demuth, H.B. Neural network toolbox 7. In User’s Guide; MathWorks: Natick, MA, USA, 2010. [Google Scholar]
  10. Hsu, C.W.; Chang, C.-C.; Lin, C.-J. A Practical Guide to Support Vector Classification; Technical Report; Department of Computer Science, National Taiwan University: Taipei City, Taiwan, 2013. [Google Scholar]
  11. Bishop, C.M. Neural Networks for Pattern Recognition; Oxford University Press: Oxford, UK, 1995. [Google Scholar]
  12. Mustafidah, H.; Hartati, S.; Wardoyo, R.; Harjoko, A. Selection of Most Appropriate Backpropagation Training Algorithm in Data Pattern Recognition. Int. J. Comput. Trends Technol. 2014, 2, 92–95. [Google Scholar] [CrossRef]
  13. Godoy, W.F.; da Silva, I.N.; Goedtel, A.; Palácios, R.H.C.; Lopes, T.D. Application of intelligent tools to detect and classify broken rotor bars in three-phase induction motors fed by an inverter. IET Electr. Power Appl. 2016, 10, 430–439. [Google Scholar] [CrossRef]
  14. Ghorbanian, V.; Faiz, J. A survey on time and frequency characteristics of induction motors with broken rotor bars in line-start and inverter-fed modes. Mech. Syst. Signal Process. 2015, 54, 427–456. [Google Scholar] [CrossRef]
  15. Valles-Novo, R.; de Jesus Rangel-Magdaleno, J.; Ramirez-Cortes, J.M.; Peregrina-Barreto, H.; Morales-Caporal, R. Empirical mode decomposition analysis for broken-bar detection on squirrel cage induction motors. IEEE Trans. Instrum. Meas. 2015, 64, 1118–1128. [Google Scholar] [CrossRef]
  16. Vitor, A.L.; Scalassara, P.R.; Endo, W.; Goedtel, A. Induction motor fault diagnosis using wavelets and coordinate transformations. In Proceedings of the 2016 12th IEEE International Conference on Industry Applications (INDUSCON), Curitiba, Brazil, 20–23 November 2016; pp. 1–8. [Google Scholar]
  17. De Santiago-Perez, J.J.; Rivera-Guillen, J.R.; Amezquita-Sanchez, J.P.; Valtierra-Rodriguez, M.; Romero-Troncoso, R.J.; Dominguez-Gonzalez, A. Fourier transform and image processing for automatic detection of broken rotor bars in induction motors. Meas. Sci. Technol. 2018, 29, 095008. [Google Scholar] [CrossRef]
  18. Perez-Cruz, J.; Perez-Vazquez, M.; Pineda-Sanchez, M.; Puche-Panadero, R.; Sapena-Bano, A. The Harmonic Order Tracking Analysis (HOTA) for the Diagnosis of Induction Generators Working Under Steady State Regime. In Proceedings of the 2017 Asia-Pacific Engineering and Technology Conference (APETC 2017), Kuala Lumpur, Malaysia, 25–27 May 2017; pp. 1864–1869. [Google Scholar]
  19. Merabet, H.; Bahi, T.; Drici, D.; Halam, N.; Bedoud, K. Diagnosis of rotor fault using neuro-fuzzy inference system. J. Fundam. Appl. Sci. 2017, 9, 170–182. [Google Scholar] [CrossRef]
  20. Riera-Guasp, M.; Pineda-Sanchez, M.; Pérez-Cruz, J.; Puche-Panadero, R.; Roger-Folch, J.; Antonino-Daviu, J.A. Diagnosis of induction motor faults via Gabor analysis of the current in transient regime. IEEE Trans. Instrum. Measur. 2012, 61, 1583–1596. [Google Scholar] [CrossRef]
  21. Gambhir, A.; Vijarania, M.; Gupta, S. Implementation and Application of Binary Search in 2-D Array. Int. J. Inst. Ind. Res. 2016, 1, 30–31. [Google Scholar]
  22. Gyftakis, K.N.; Cardoso, A.J.M.; Antonino-Daviu, J.A. Introducing the Filtered Park’s and Filtered Extended Park’s Vector Approach to detect broken rotor bars in induction motors independently from the rotor slots number. Mech. Syst. Signal Process. 2017, 93, 30–50. [Google Scholar] [CrossRef]
Figure 1. Example of time/harmonic k-order space generated with HOTA method for induction motors fault diagnosis in transient state.
Electronics 08 00006 g001
Figure 2. Final result vector in harmonic k-order domain obtained with HOTA method.
Electronics 08 00006 g002
Figure 3. Space of a 2-dimensional SVM (2 parameters on each failure representative feature) where a hyperplane is splitting the space in subspaces of healthy features and failure features.
Electronics 08 00006 g003
Figure 4. Scheme of Multilayer Perceptron neural network.
Electronics 08 00006 g004
Figure 5. General scheme of the supra-system, the system generator of optimized fault diagnostic system.
Electronics 08 00006 g005
Figure 6. Examples of the time/frequency space generated with a phase current using a Gaussian window of ratio 10/1 (a) and its HOTA solution (c). The time/frequency space obtained with the same current but using a Gaussian window of ratio 1/10 is shown in (b), and its HOTA solution is shown in (d).
Electronics 08 00006 g006
Figure 7. Example of t-f spectrum where the range of frequencies that would be necessary to obtain broken bar fault features has been marked.
Electronics 08 00006 g007
Figure 8. Schematic example of setting a parameter with the mesh search method.
Electronics 08 00006 g008
Figure 9. Scheme about training and classification for the iteration of k feature in the ’leave one out cross validation’ training algorithm.
Electronics 08 00006 g009
Figure 10. Scheme about training and classification for X iteration in the ‘training/validation/test cross validation’ training algorithm.
Electronics 08 00006 g010
Figure 11. Test Bed used to obtain the experimental signals.
Electronics 08 00006 g011
Figure 12. Top rotor with an artificially rotor broken bar fault and bottom rotor in healthy conditions.
Electronics 08 00006 g012
Table 1. Transfer functions used to solve classification problems with ANN expert systems for IMs fault diagnosis.
Layer TypeTransfer FunctionIn(i)/Out(o) Tie
Hidden LayerHyperbolic Tangent Sigmoid o = i n - i - n i n + i - n
Output LayerCompetitive Softmax o = 1 , n max
o = 0 , the others
Table 2. Summary of the tests performed for the experimental validation.
RegimeSupplyLoadTests
SteadyDOL50 HzConstant12
VSD25 HzConstant24
50 HzConstant24
TransientDOL50 HzPulse8
Ramps11
VSD25 HzPulse15
Ramps19
50 HzPulse15
Ramps19
RampsConstant60
Pulse33
Ramps12
Table 3. Time needed by the supra-system to generate each local optimal diagnostic system (hours).
Optimization Time (hours)HOTA + STFTHOTA + SFFT
SVM with Polynomial Kernel13.812.70
SVM with RBF Kernel12.571.83
ANN with 1 hidden layer13.583.03
ANN with 2 hidden layers34.0220.16
Table 4. Time used by the diagnostic system generated by the supra-system to classify the IM condition (seconds).
Classification Time (seconds)HOTA + STFTHOTA + SFFT
SVM with Polynomial Kernel36.645.60
SVM with RBF Kernel36.645.60
ANN with 1 hidden layer36.655.60
ANN with 2 hidden layers36.655.60
Table 5. Hit rates obtained in each of the local optimal diagnostic systems generated by the supra-system.
Hit Rate (%)HOTA + STFTHOTA + SFFT
SVM with Polynomial Kernel98.6298.89
SVM with RBF Kernel97.2497.38
ANN with 1 hidden layer97.1097.38
ANN with 2 hidden layers98.8998.89

