Proton Induced Single Event Effect Characterization on a Highly Integrated RF-Transceiver


1
Avionic Systems, German Aerospace Center (DLR), Institute of Space Systems, 28359 Bremen, Germany
2
Mechanics and Thermal Systems, German Aerospace Center (DLR), Institute of Space Systems, 28359 Bremen, Germany
*
Author to whom correspondence should be addressed.
Electronics 2019, 8(5), 519; https://doi.org/10.3390/electronics8050519
Submission received: 12 April 2019
/
Revised: 5 May 2019
/
Accepted: 7 May 2019
/
Published: 9 May 2019
(This article belongs to the Special Issue Radiation Tolerant Electronics)
Abstract
:Radio frequency (RF) systems in space applications are usually designed for a single task and its requirements. Flexibility is mostly limited to software-defined adaption of the signal processing in digital signal processors (DSP) or field-programmable gate arrays (FPGA). RF specifications, such as frequency band selection or RF filter bandwidth are thereby restricted to the specific application requirements. New radio frequency integrated circuit (RFIC) devices also allow the software-based reconfiguration of various RF specifications. A transfer of this RFIC technology to space systems would have a massive impact to future radio systems for space applications. The benefit of this RFIC technology allows a selection of different RF radio applications, independent of their RF parameters, to be executed on a single unit and, thus, reduces the size and weight of the whole system. Since most RF application sin space system require a high level of reliability and the RFIC is not designed for the harsh environment in space, a characterization under these special environmental conditions is mandatory. In this paper, we present the single event effect (SEE) characterization of a selected RFIC device under proton irradiation. The RFIC being tested is immune to proton induced single event latch-up and other destructive events and shows a very low response to single failure interrupts. Thus, the device is defined as a good candidate for future, highly integrated radio system in space applications.
1. Introduction
The German Aerospace Center (DLR), Institute of Space System, is currently working on the development of a highly integrated multi-band software-defined radio (SDR) platform for space application [1,2]. Compared to state-of-the-art SDR systems, the design shall allow the reconfiguration of relevant radio frequency (RF) parameters, such as the RF bandwidth, mixing frequency or the sample rate for analog to digital conversion (and vice versa). Usually, most of the RF parameters depend on the executed application and only the digital signal processing is adjustable by software. For this reason, the RF front-end is typically designed with discrete components to the specific application requirements. Some radio systems allow multiplexing between different RF front-end modules, such as that presented in [3,4], but will increase the overall size and weight of the system. To allow a software-based reconfiguration on RF front-end related parameters, a new radio frequency integrated circuit (RFIC) technology must be used and needs to be investigated, particularly the performance in a radiation environment for the utilization in space applications.
In this paper, we present the single event effect (SEE) characterization of an RFIC device for the multi-band radio platform purpose under proton irradiation. In Section 2, the device under test (DUT) and the general test method is presented. The test requirements and test site are presented in Section 3 and the test setup and procedures are presented in Section 4. The test results of this SEE characterization are described in Section 5 and are later discussed in Section 6. Finally, the conclusion is made in Section 7.
2. Device Under Test
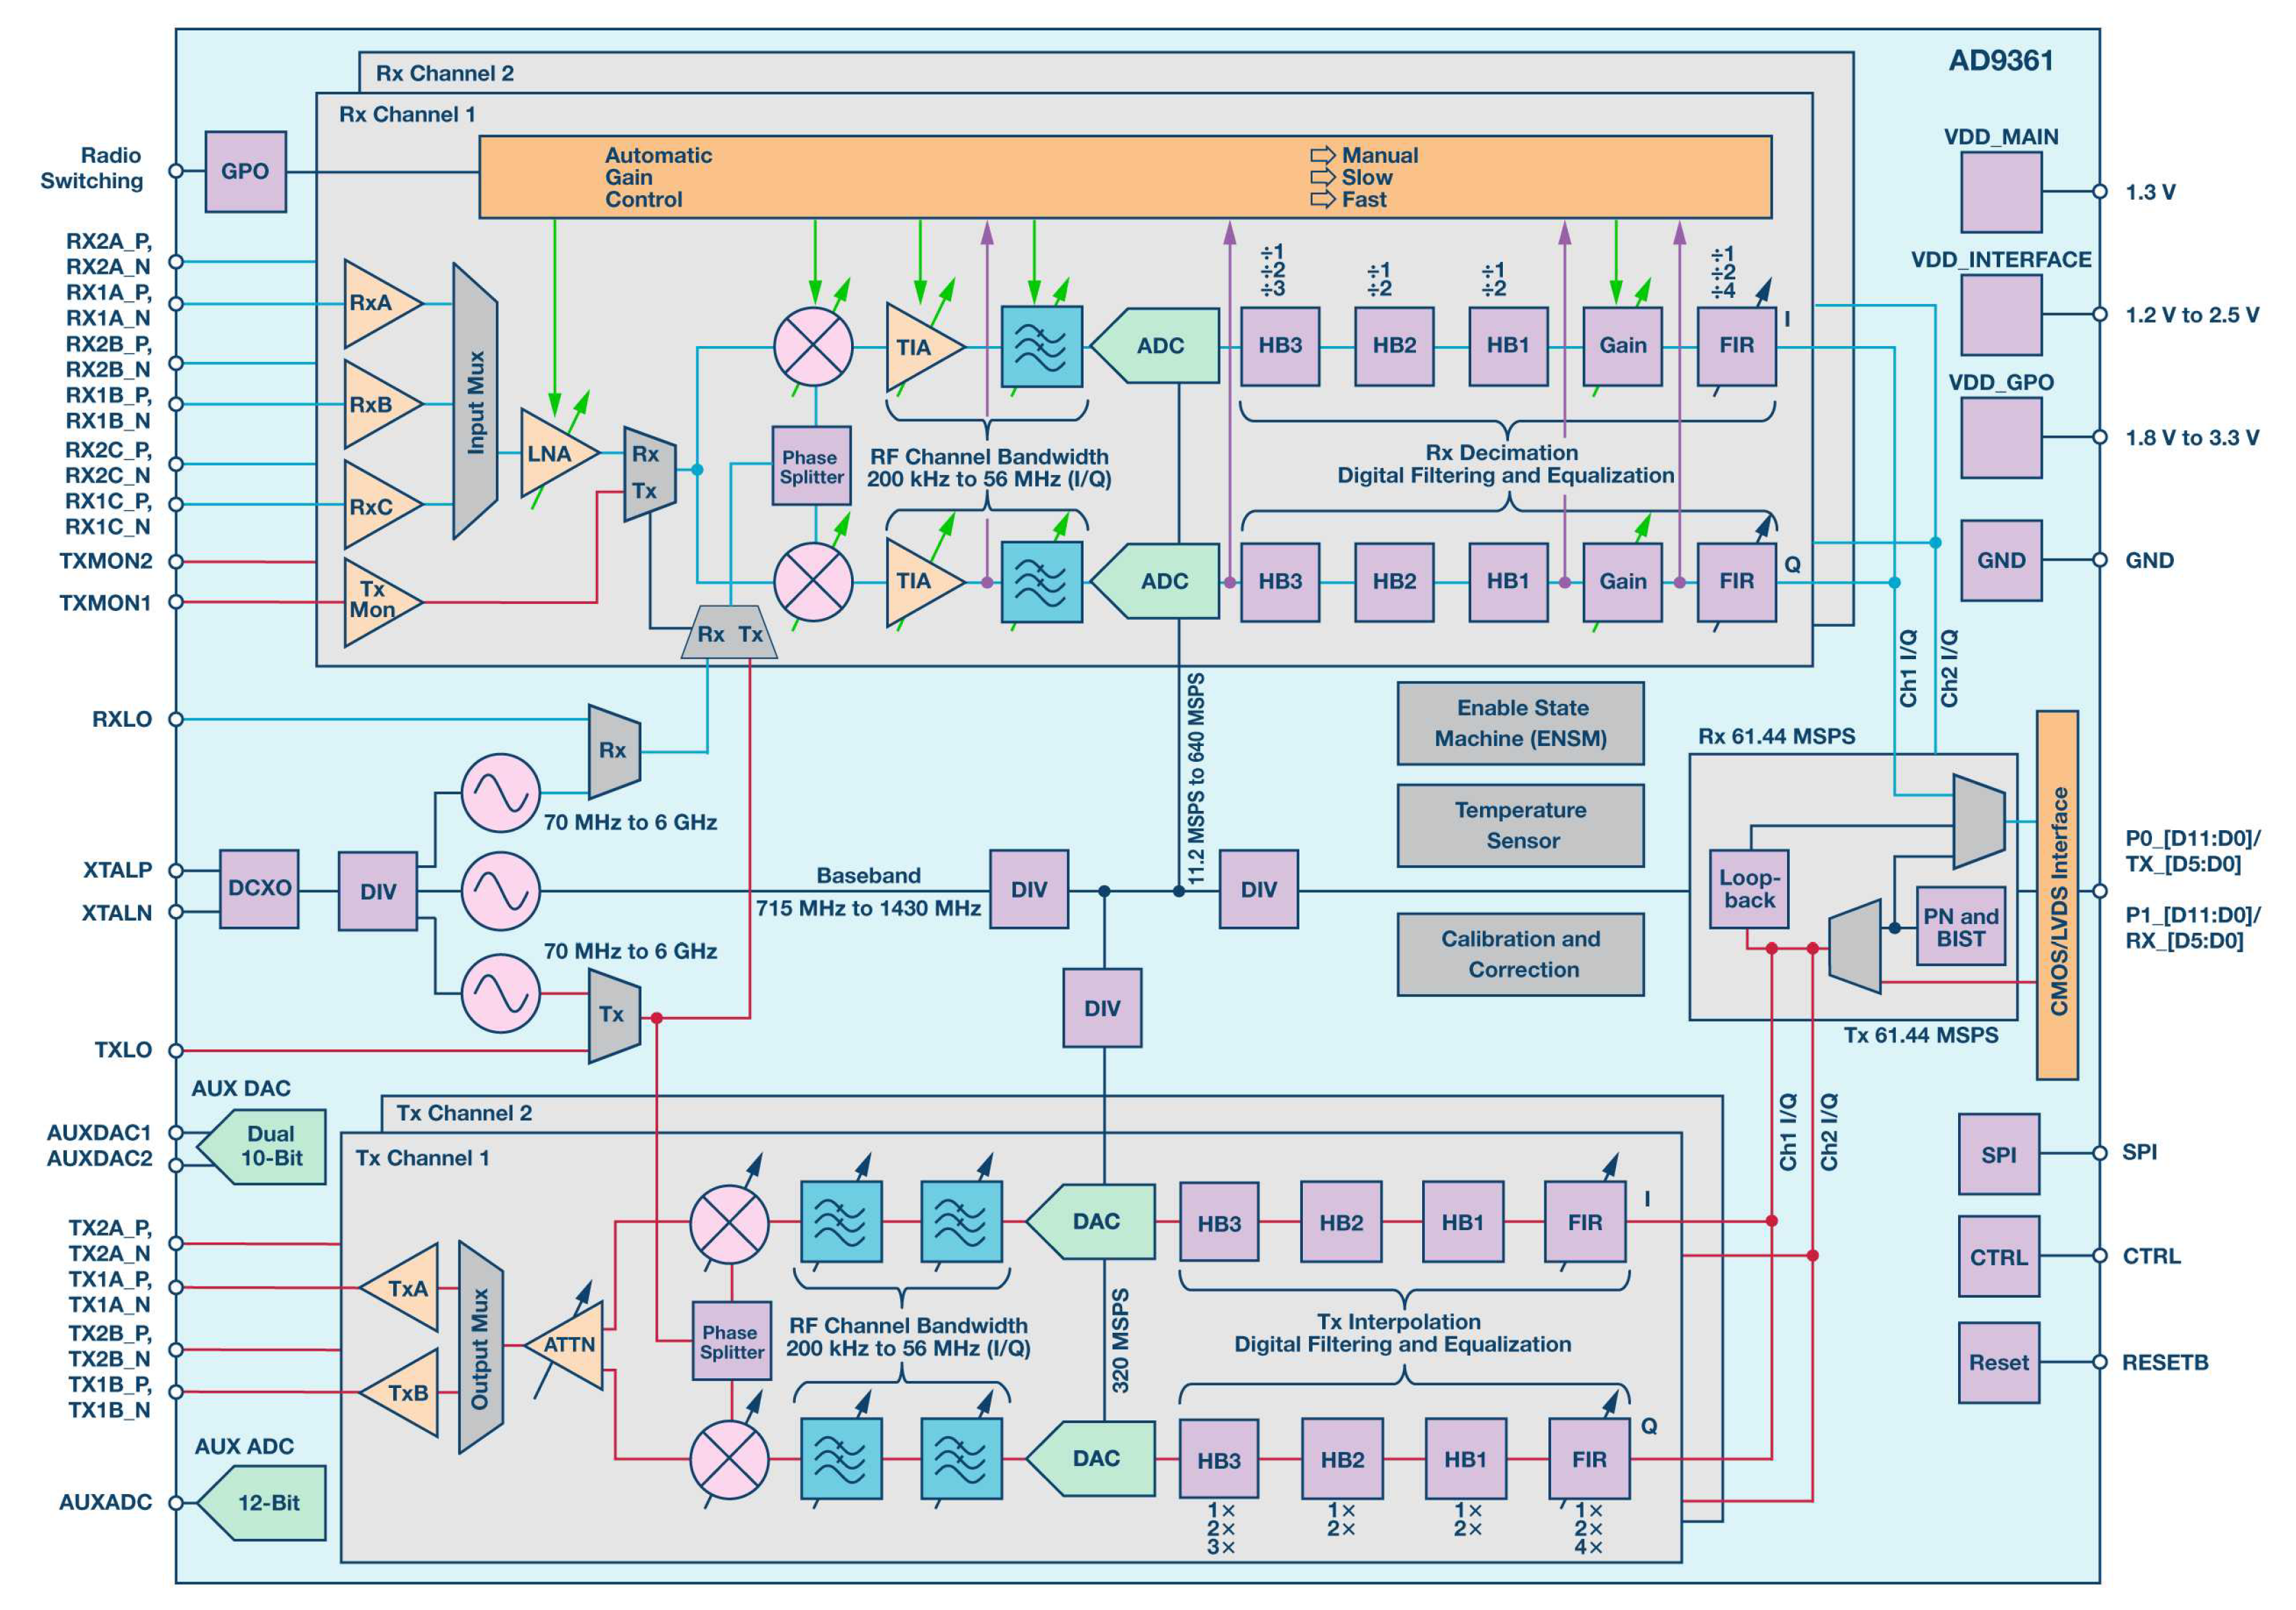
The selected RFIC as a demonstrator for the implementation into the highly integrated multi-band SDR platform is the AD9361 agile RF Transceiver from Analoge Devices [5]. The integrated circuit (IC) device is a 2 × 2 RF transmitter and receiver (transceiver) including individual RF front-ends, a mixed-signal baseband (BB) unit with an integrated frequency synthesizer and a selectable low voltage differential signaling (LVDS) or complementary metal-oxide-semiconductor (CMOS) digital interface. Any functionality, whether its RF or BB related, can be configured by software over a serial peripheral interface (SPI). A block diagram of the device is presented in Figure 1.
Besides plenty of configurations, another major advantage of the device is the automatic self-calibration sequences invoking each time the RFIC is reconfigured to a new BB setting or power-cycled/reset. The device can be operated in time division duplex (TDD) mode, where only transmission or reception is possible, or in frequency division duplex (FDD) mode, where transmission and reception are both enabled. The different functions of the DUT are described in more detail in the following sections.
2.1. RF Front-End
The AD9361 includes two independent transmit and receive paths. Each transmitter has two multiplexable outputs (four in total) and each receiver chain consist of three selectable inputs (six in total). Thus, multiple band selection is possible by the design of individual front-ends, consisting of additional application specific filters, mixers, low noise amplifiers (LNA) or power amplifiers (PA). Each transmitter and receiver chain includes series of filters (analog and digital) and amplifiers, where the gain can be selected manually or controlled by an automatic gain control (AGC). The RF front-end calibration includes RF DC-offset calibration, a quadrature calibration for the receive and transmission chain and the calibration of the RF clock synthesizer charge pump and voltage controlled oscillator (VCO).
2.2. Control System
All configurations of the RFIC can be programmed via an SPI interface to its 8-bit register map (0x000 to 0x3F6). In addition to the automatic self-calibration and correction procedures, the AD9361 consists of an enable state machine (ENSM), which allows the user to select between different operation modes (e.g., TDD or FDD). The available ENSM modes are:
- Sleep mode: Clocks and BB phased-locked loop (PLL) disabled
- TX: Transmitter enabled (only on TDD)
- RX: Receiver enabled (only on TDD)
- FDD: Transmitter and receiver enabled
- Alert: Synthesizer enabled only
- Wait: Synthesizer disabled (power saving mode)
2.3. Direct Baseband Conversion
The RFIC supports a direct BB conversion for the receive and transmit chain, without using any intermediate frequencies. The mixing frequency can be selected individually for transmission and reception. The AD9361 uses a quadrature demodulation for the direct down-conversion to the BB and a vice versa for the transmission. Thus, a complex pair (I and Q) is processed individually (e.g., filtered and amplified) in the BB and is also digitized by separated analog digital converters (ADCs). The ADC and digital to analog converters (DACs) are adjustable in their sample rate and controlled by the BB synthesizer.
2.4. Clocking
The AD9361 requires a crystal or oscillator clocking source to generate the clock frequencies inside of the RFIC. The RF clocks are derived via a local VCO that is controlled by an internal low-drop out (LDO) voltage regulator. The BB frequencies are also generated by a PLL synthesizer. The BB PLL synthesizer and the RF synthesizer are calibrated at the same time.
2.5. Power Application
The power supply of the AD9361 is separated into two 1.3 V power domains for the main function of the device and one 1.8 V rail for the interface voltage (e.g., LVDS). A third domain of 3.3 V can be supplied for the device general purpose output (GPO) if they are required to be used. The 1.3 V power domain requires a stability of less than ±30 mV and an ultra low phase noise conducted by the selected LDO voltage regulator to enhance the RF performance of the device.
2.6. Device Packaging and Chip Technology
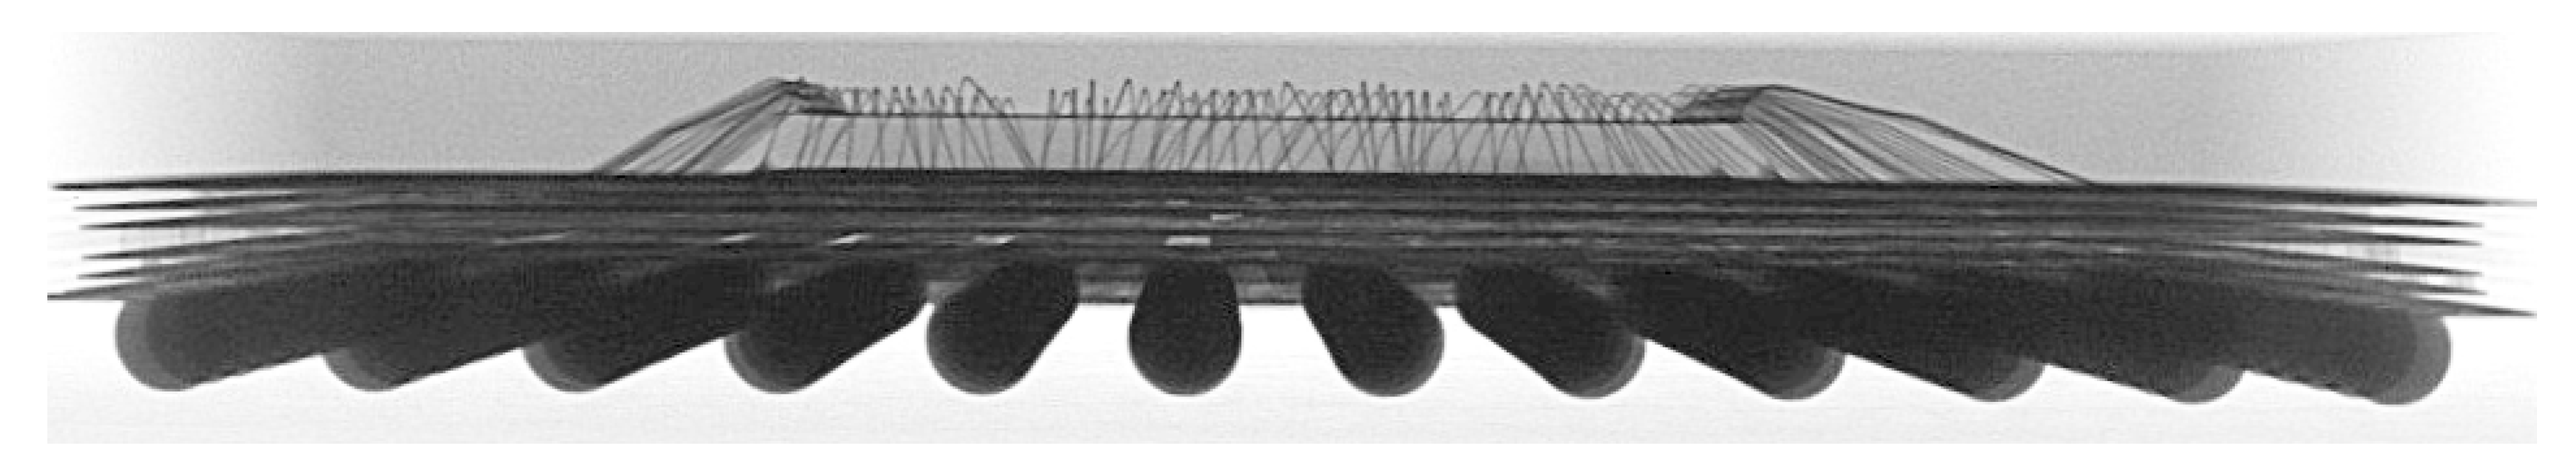
The RFIC is encapsulated in a 144-pin chip scale package ball grid array housing. The size of the device is given with 10 × 10 × 1.7 mm. The semiconductor die is based on a 65 nm silicon on insulator (SOI) CMOS process. An X-ray picture of the device is presented in Figure 2 and shows that the die is located on a printed circuit board (PCB) stack.
The die is assembled faced-up with pads connected to the redistribution layers by wire-bonds. The die has a size of approximately 500 × 500 × 220 m. The molding compound is based on silica (86.20%), epoxy resin (6.00%), phenol resin (6.00%), metal hydroxide (1.50%) and carbon black (0.30%) [6]. The encapsulation thickness on top of the die is calculated to 280 m, which is an important value, since the DUT is not going to be encapsulated to expose the die for the proton test.
3. Test Requirements and Conditions
In this section, the test requirements, firstly derived from previous DLR missions and which are typically desired for radio applications in space, are presented. In the second part of this section, the test site is presented as well as calibration results for the selected proton energies are given.
3.1. Test Requirements
For this test purpose, we firstly limited our radiation environment to proton irradiation. The reason for this is that many applications for the DUT are suitable for earth observation missions, primarily in low earth orbit (LEO). For LEO, the population of charged particles stably trapped by the Earth magnetic field is high, mainly consisting of protons (100 keV to hundreds of MeV) and electrons (few tens of keV to 10 MeV) is high. There are models available (e.g., NASA AP-8 and AE-8) predicting the proton flux for given attitude profiles and depending on the solar activities [7,8]. Thus, we decided to take several reference missions in LEO for the test requirements in terms of proton energies and the total fluence.
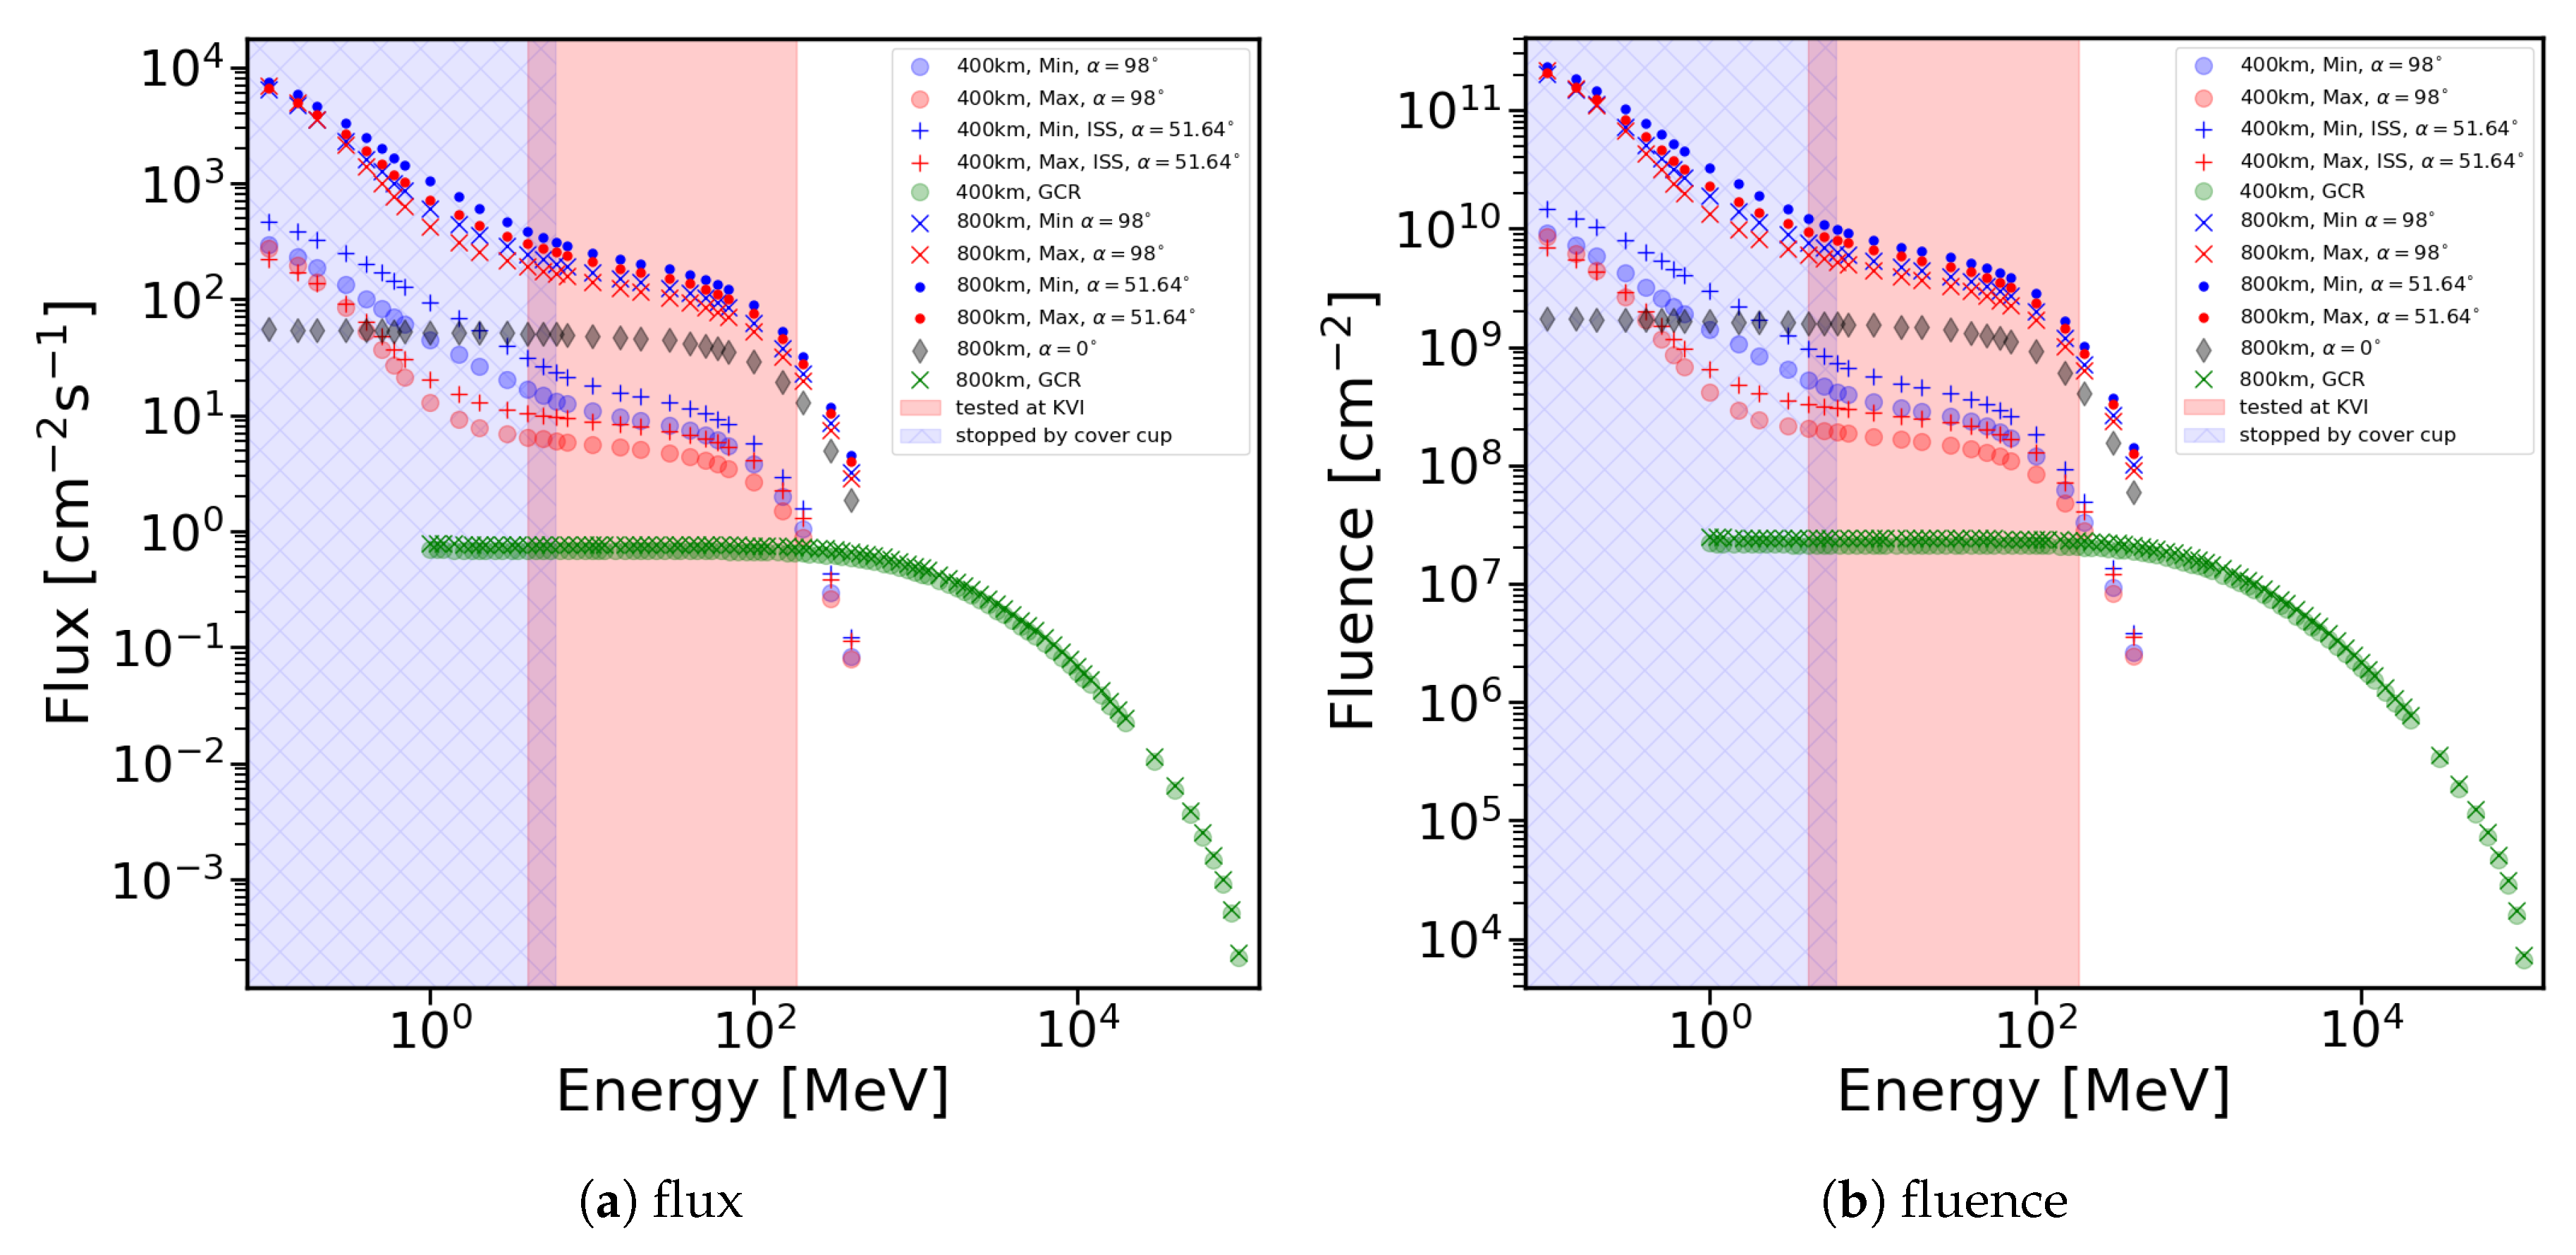
To estimate the proton fluxes at the LEO environment, two altitudes (400 km and 800 km) and three different inclination angles were taken into account. In addition, solar maximum and minimum activities were considered. The AP-8 model was used for estimating the flux of trapped protons [9] and the CREME-96 model for the galactic cosmic rays (GCR) [10]. The analysis results are presented in Figure 3. The proton fluence (see Figure 3b) is a product of the flux and the time. Here, a one-year period was considered. The proton flux magnitude (see Figure 3a) at the altitude of 800 km is approximately two orders of magnitude larger than at 400 km.
It is strictly related to the strength of the magnetic field and topology of the trapped proton belt that plays a dominant role. Proton fluxes for two inclination angles of are comparable. In both cases, a satellite would pass the so-called South Atlantic anomaly (SAA) [11] and for the inclination of also the Earth’s polar regions. Influence of the SAA and the Earth’s polar regions can be easily examined by looking at the proton flux for an inclination angle of . Here, a satellite would rotate the Earth only along the equator and would not pass through the mentioned high radiation regions. Solar activity counted in 11-year cycle results with variation of number of particles sent throughout the interplanetary space, and, therefore, trapped by the Earth’s magnetic field. As one can see, the proton flux for minimum Sun activity is actually higher than at its maximum state because, at solar maximum, the increased UV irradiation causes the atmosphere to expand. The thicker is the atmosphere, the more collision events there are with the incident protons at the high altitudes, and, therefore, fewer protons can reach the low altitudes. The GCR flux level for two considered altitudes is comparable and it is up to four orders of magnitude lower than for the trapped solar protons. However, the energy range of the GCRs expands almost up to MeV. The shape of the GCR-flux curve is unaffected by a satellite orbit and its inclination because the GCR origin is the Galaxy and beyond, thus the particles are coming from all possible directions. It is then easier to compute equivalent fluence for any number of years. The DUT was exposed to a discrete set of proton energies from 4 MeV up to 184 MeV. The range, in both figures, is marked by the light red area. In space, the DUT is nominally covered with 280 m thick silica cup, which results in stopping of the protons with energies lower than ≈6.1 MeV [12].
In addition to the reference missions derived test requirements, we worked according the European space component coordination (ESCC) single event effects test method and guidelines, ESCC basic Specification No. 25100 [13]. The ESCC No. 25100 requires a total fluence of protons/cm on five different energies in a range of 20–200 MeV. Depending on the DUT SEE response, we expanded the proton irradiation to protons/cm if the numbers of event was not too high for the target fluence of the reference missions.
3.2. Test Site
The selected test site for the proton irradiation was the Kernfysisch Versneller Instituut (KVI), located on the Zernike Campus of the University of Groningen, Netherlands. To test again a wide range of proton energies, we decided to split the test purpose into two test campaigns to avoid high degrading of the primary beam energy.
3.2.1. Beam Energies
In the first configuration, we selected a primary beam energy of 190 MeV. The irradiation field was produced by scattering the primary proton beam using a double scatter foil method (1.44 mm Pb foil and a 0.9 mm W inhomogeneous scatter foil) located 3 m up stream of the irradiation position. The scatter foils together with beam optics and a 100 mm diameter collimator and the KVI-degraders determined the field at the DUT.
A 20 × 20 mm rectangular collimator was inserted to protect sensitive equipment. Due to energy loss in air, beam intensity monitor and scatter foil, the maximum beam energy at the DUT position was 184 MeV. Lower energies were produced by inserting an amount of degrader material (Aluminum), as given in Table 1. In a second beam configuration, we used a proton beam with a primary energy of 66.5 MeV. Due to energy loss in the scatter foils, air, and beam ionization device, the maximum beam energy at the DUT was 59.5 MeV based on calculations with SRIM 2013 [14]. This energy is denoted as 60 MeV. By inserting a degrader material (Table 2), the beam energy at the DUT could be reduced. At low proton energies, the beam could hardly considered as mono-energetic, as it had have a very large energy spread. The field was produced using a 0.3 mm homogeneous lead scatter foil at 3 m from the DUT position. The field size was limited by a 50 mm diameter field collimator and a 30 × 30 mm collimator in front of the DUT.
KVI establishes that one can measure the flux using a small plastic scintillation detector of 1 cm diameter placed at the position of the DUT.
Flux calibrations were measured for both the 20 × 20 mm and the 30 × 30 mm square collimator. The flux calibration values are listed in Table 1 and Table 2. The statistical accuracy of these values was better than 1%. The systematic errors were estimated to be smaller than 10% on the basis of dose measurements, earlier measurements for different collimator sizes and aluminum activation analysis.
3.2.2. Field Size and Homogeneity
The field uniformity was measured using a LANEX scintillation screen that was placed at the position of the DUT. The intensity of the scintillation light had a linear correlation to the fluence that was applied.
In general, a homogeneity of minimum 10% was desired for the collimator field size on 20 × 20 mm, or 30 mm × 30 mm, respectively. For high energy degradation (e.g., down to 10 MeV), 10% was not perfectly achieved. Assuming that the die of the DUT had a dimension of 500 × 500 m (half the collimator size), this issue was determined to be negligible.
4. Test Setup And Procedures
In this section, firstly the test setup at the test site is presented. Secondly, the test procedures are discussed in detail, with the prioritization of different type of SEE and the required actions for functional recovery and to prevent permanent damages of the DUT and the test setup.
4.1. Test Setup
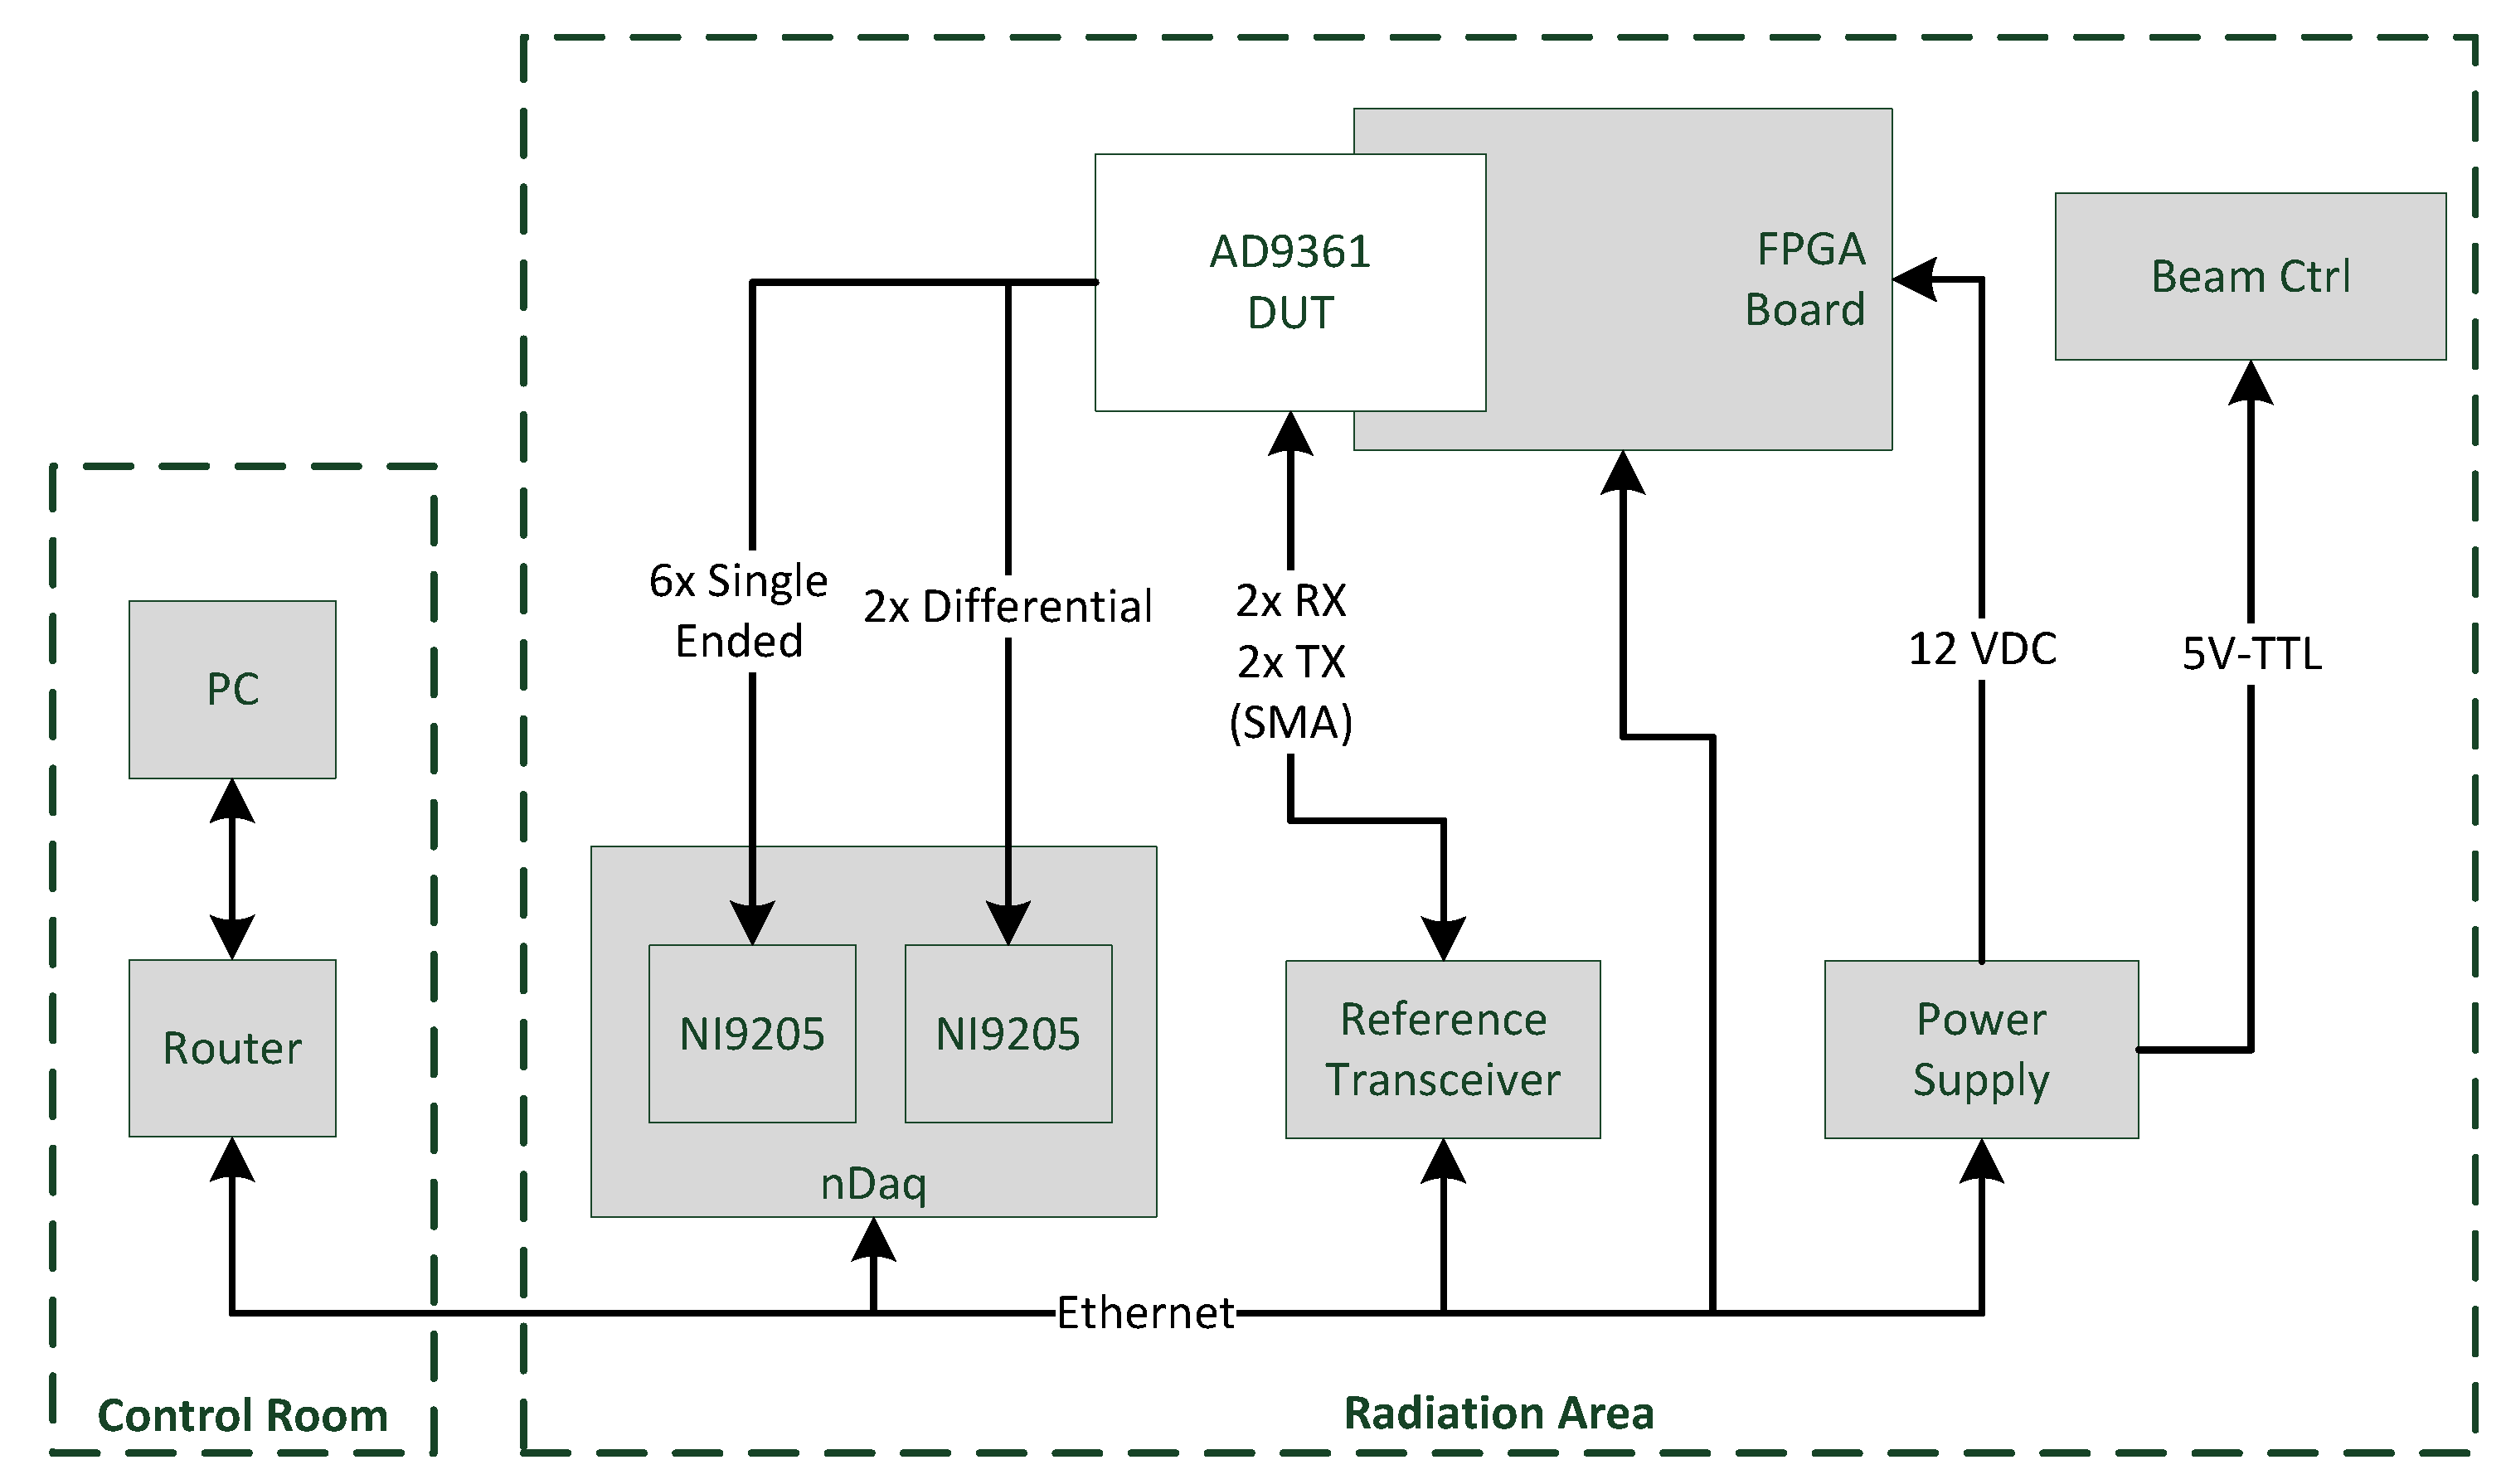
The schematic of the test setup is presented in Figure 4. An Ethernet connection was used from the control room to interface the DUT and the test equipment, which needed to be placed in the radiation area, close to the DUT to reduce cable losses and mismatch effects in the setup. On the other hand, due to scattering effects, the test equipment inside of the radiation area needed to be located as far away as possible from the beam line and the DUT.
Additional shielding with lead and paraffin blocks would improve the test equipment safety. The distance from the DUT and the test equipment was approximately 12 m. The test setup consisted of the DUT, a FPGA board, a power supply and control unit (PCU), a reference transceiver, a voltage monitoring device (nDaq) and a control PC inside of the control room. The DUT itself was mounted on a test PCB, which interfaced with the FPGA board for data processing and power supply purposes. The FPGA in the setup was a system on chip from Xilinx (San José, USA) (Zynq-7000), which combines a FPGA fabric and a dual-core ARM processor [15]. The processor was used for the operating system (OS) and executed the test software. The FPGA board used a FMC (FPGA Mezzanine Card) connector to interface the DUT and provides an Ethernet interface to connect the DUT setup to the control equipment.
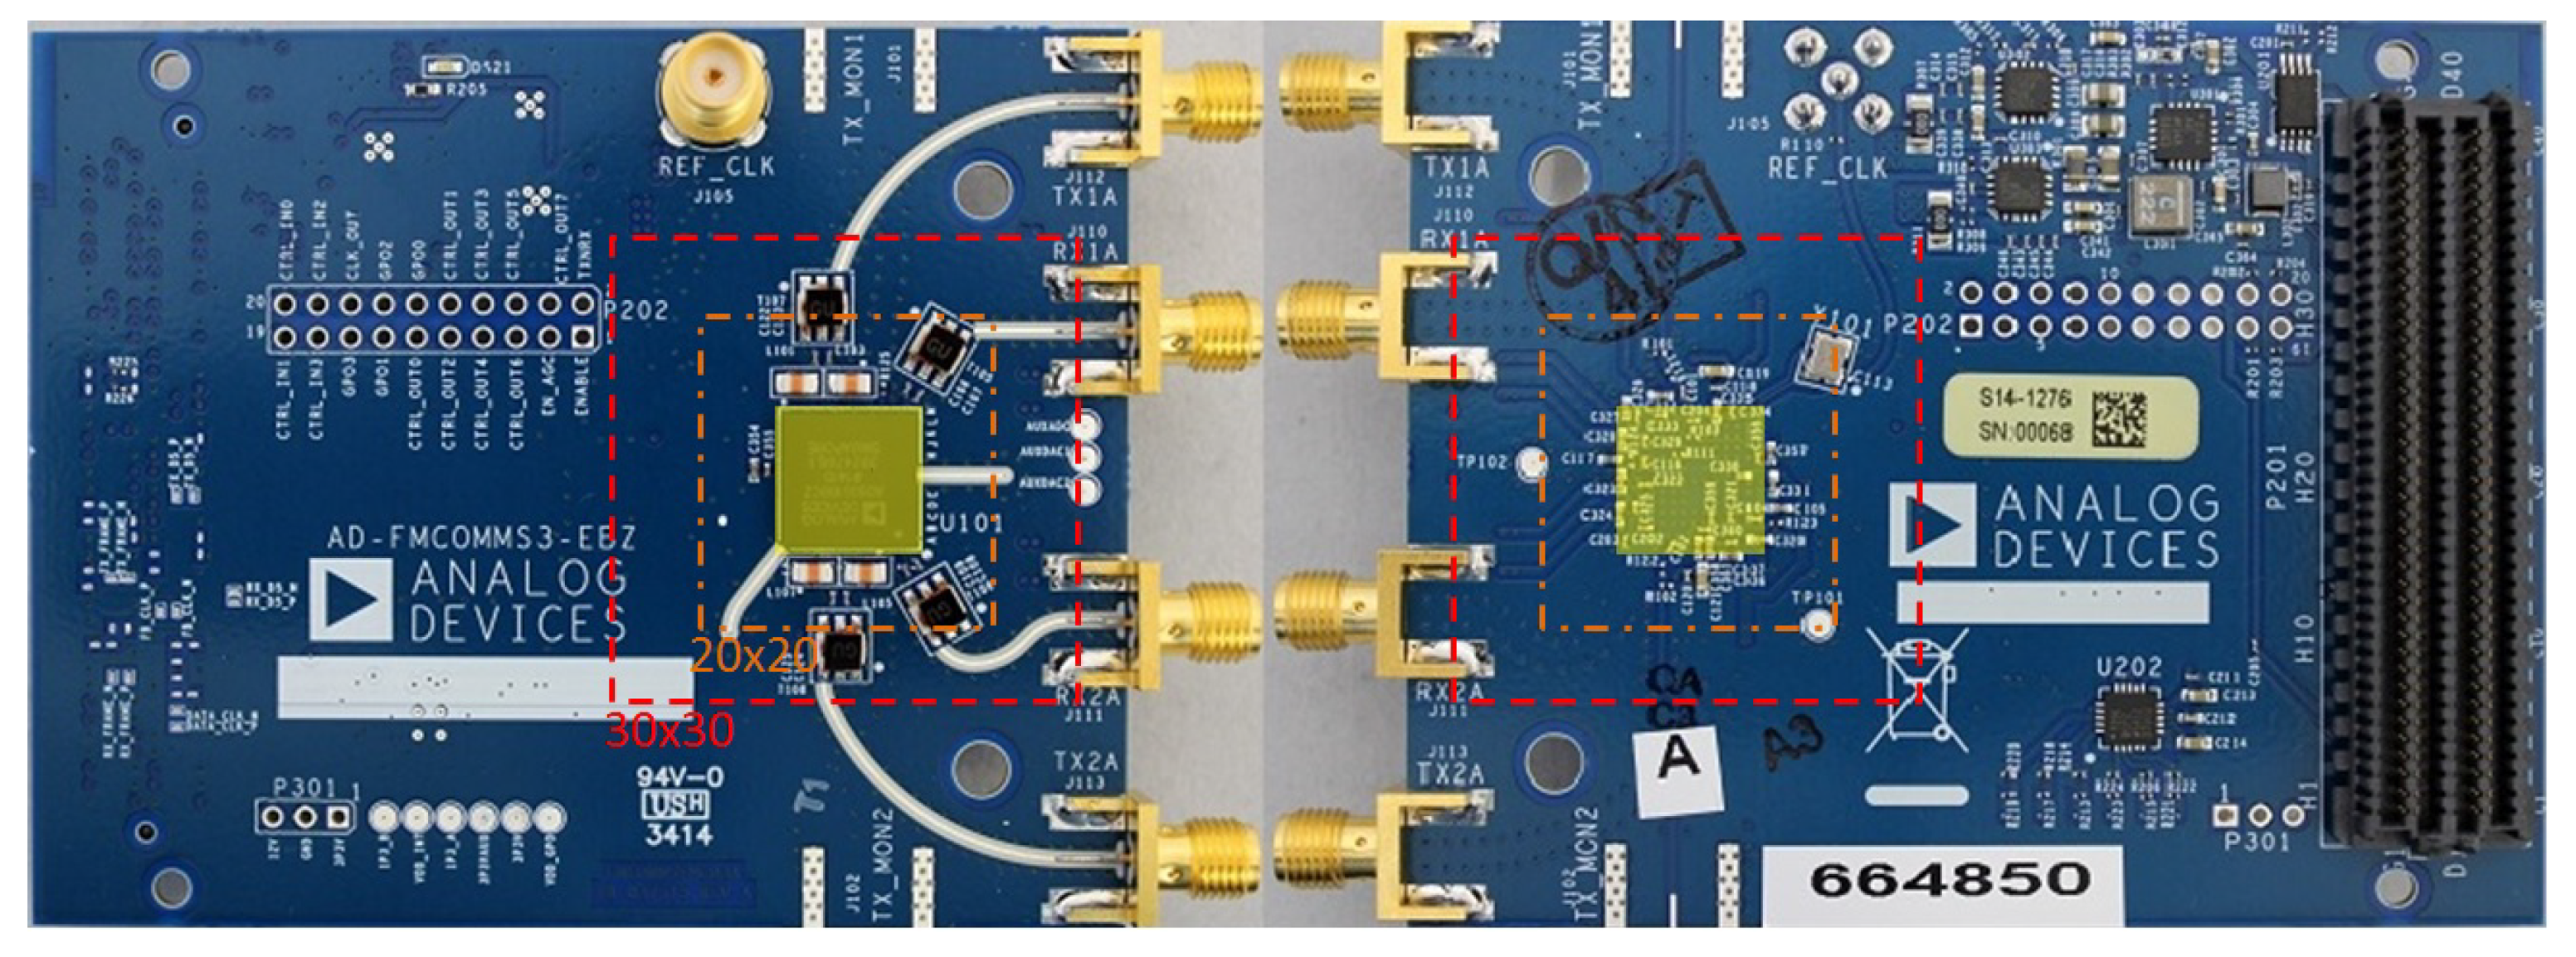
A picture of the top (Figure 5, left) and bottom (Figure 5, right) view of the test PCB, including the DUT (yellow box), is given in Figure 5. A major advantage of this PCB was the separated and isolated location of the DUT from other, known to be radiation sensitive devices (e.g., power supply devices). The radiation exposed area is highlighted with red (30 × 30 mm) and orange (20 × 20 mm) frames.
4.2. Test Procedures
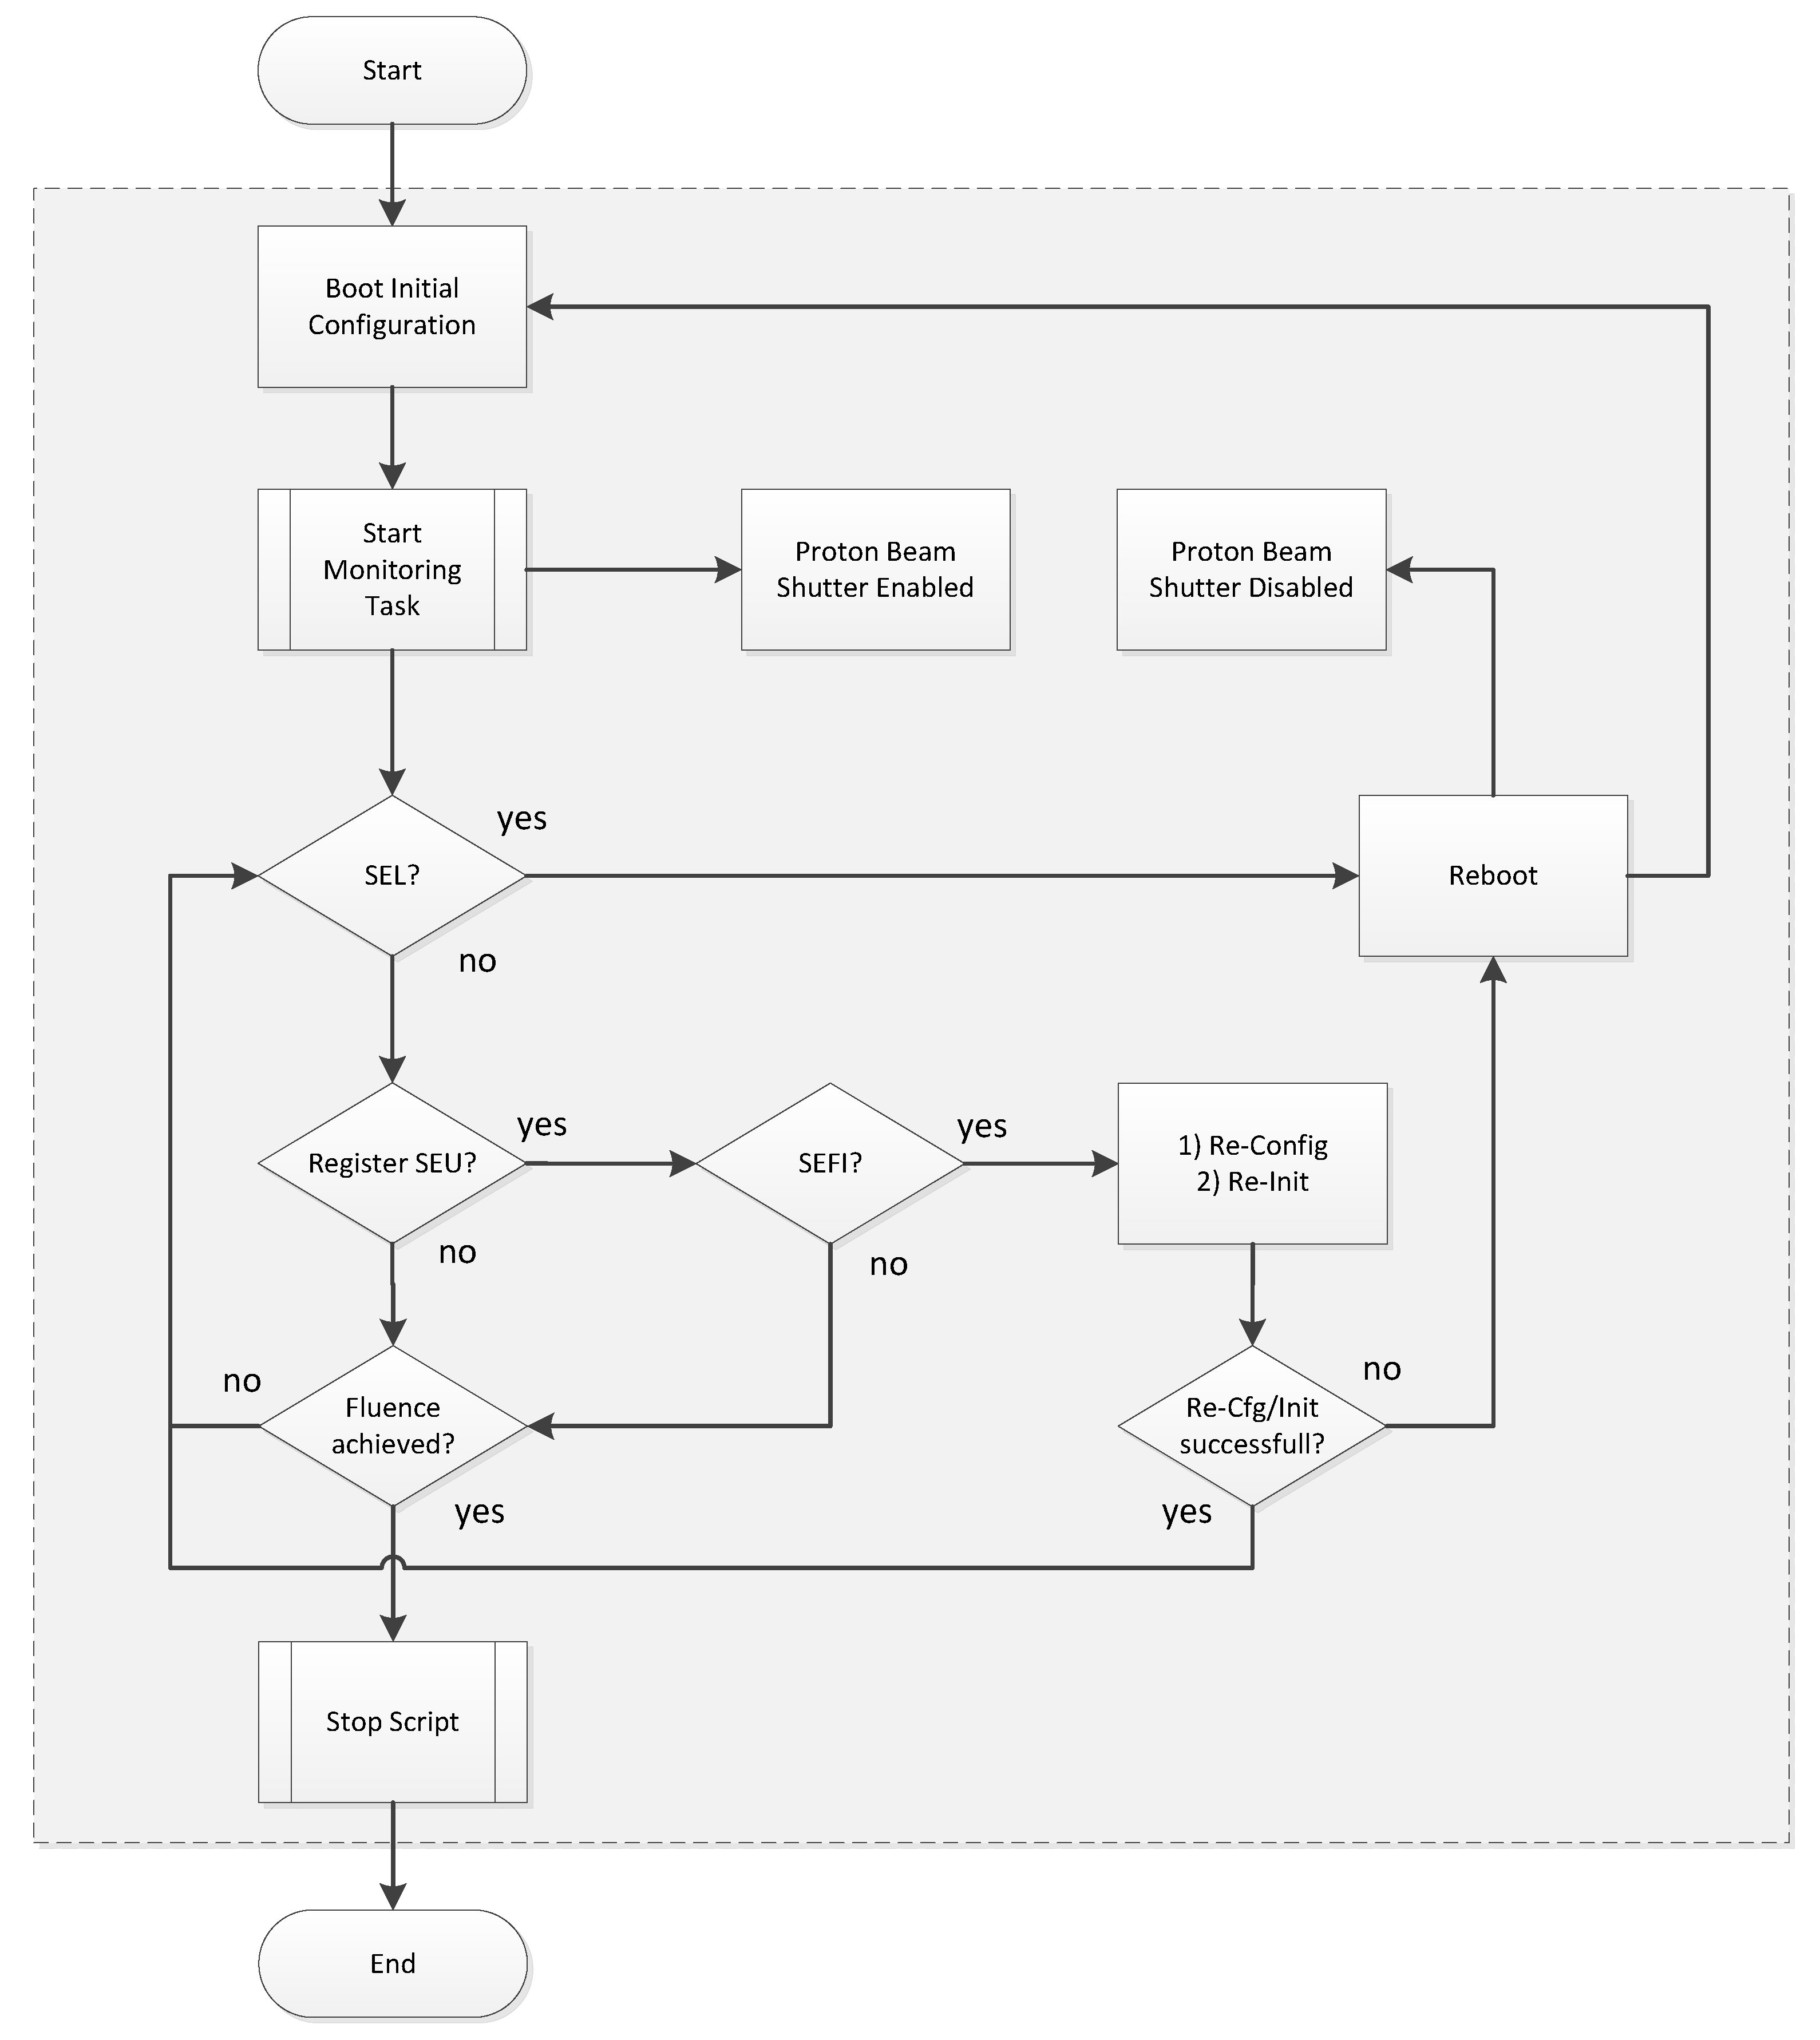
The automatic test procedure for each test run is illustrated in the flow chart in Figure 6. In the beginning of each test run, the DUT was initialized and configured. A test bench was running, which captured the data from DUT. A register scrubbing and functional verification was performed in terms of soft SEE detection and to enable certain recovery processes. The signal processing and SEE monitoring were executed by a tailored OS, running on the FPGA board. Firstly, the DUT register configuration was scrubbed and then compared with the initial generated register values. Thus, register-based single event upset (SEU) or multiple bit upsets (MBU) could be detected. When a SEU or MBU occurred, the verification of the DUT functionality (by reading out the driver-depending configurations) was performed. If there was also an incongruity detected, the system tried to rewrite the function (by the driver) in a first step. If this reconfiguration failed, a re-initialization was triggered by a dedicated pin of the DUT. In summary, two types of single event failure interrupts (SEFI) were categorized: (a) SEFIs, which are recovered by reconfiguration; and (b) a recovering by re-initialization. A reconfiguration required a simple SPI commanding, while a re-initialization required also a recalibration procedure of the DUT (≈10× longer). The test was observed for different types of SEE. The most critical ones were single event latch-ups (SEL), which might lead to a destructive damage of the device. Thus, a shutdown or reboot was required in the case of an SEL event. The numbers of SEL events were counted by the control program in LabView. SELs were monitored by the voltage drop-off on a shunt resistor placed on each 1.3 V power rail of the DUT. The voltage was captured by an ADC module (NI9205/nDAQ—100,000 samples per second), which was analyzing the levels and performed a hard shutdown of the PCU output when a level was running out of the limit boundary.
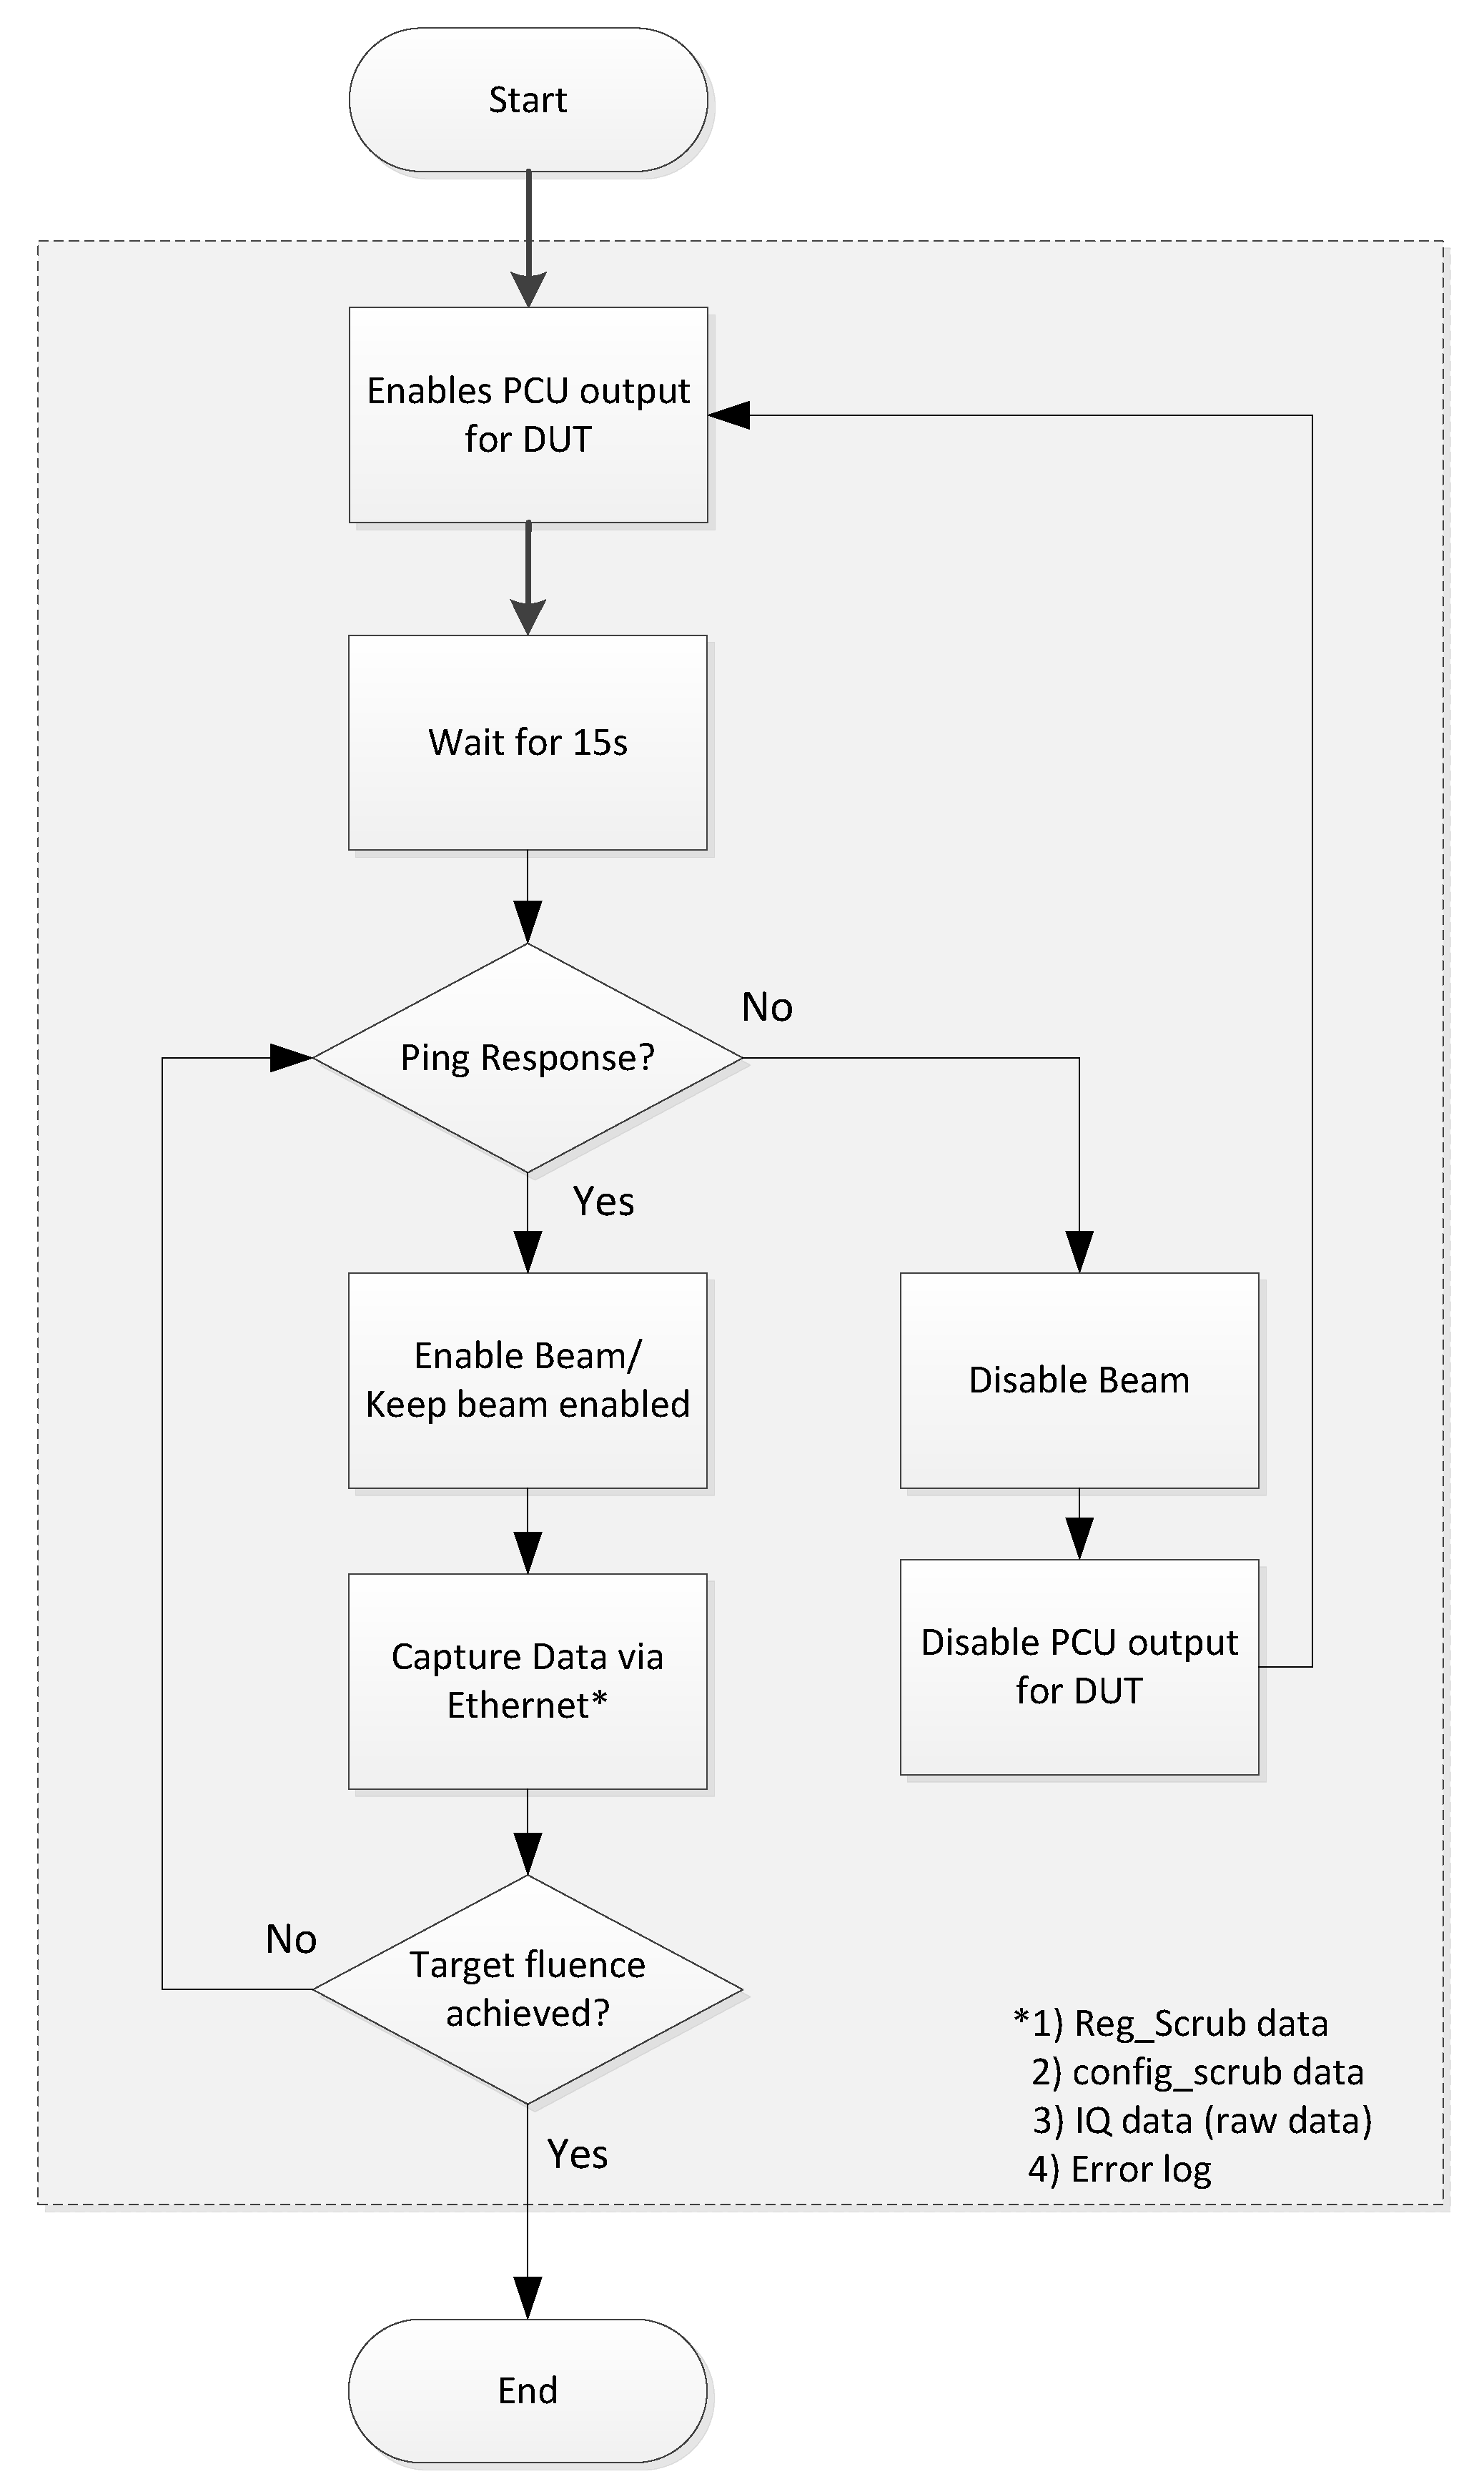
After one second, the PCU enabled its output again and the system started rebooting. The beam stayed turned off during a SEL detection and was automatically enabled when the setup was functional again. The current limitation for the SEL detection was set to twice the nominal value (0.9 A) in a hold time for one second. SEUs, MBUs and SEFIs had second priority. The general software control architecture and flow is presented in Figure 7. A start script on the control PC enabled the power supply output for the DUT and controlled the beam shut down mechanism.
A ping command to the DUT via Ethernet verified the connection and operational status. When the DUT was operational (10–15 s after power on), it responded to the ping request of the PC and the beam was enabled. The ping was then triggered every second and, if the response was interrupted, it was assumed that the OS crashed and the DUT was then power cycled. During the reboot process, the proton beam was disabled.
5. Experimental Results
In this section, the radiation test results are presented. Two samples, according to the recommendation of the ESCC test guideline No. 25100 [13], were exposed to proton irradiation at room temperature (19.5 °C) in air. The sample information, e.g., device code, serial numbers (SN) of the DUT board and the DUT itself, are given in Table 3.
Since the DUT is only manufactured on a single fabrication site and no changes in the fabrication process have been announced (public service by Analog Devices), it was assumed that the SEE response for both samples would be similar. As described in the test procedure in Section 4.2, different kinds of SEE were investigated with different categories and priority. The cross sections for SELs, SEUs, MBUs and SEFIs are presented in the following sections.
5.1. Single Event Latchup
Neither destructive nor non-destructive events of SELs were observed during the test with a proton energy of maximum 184 MeV.
5.2. Single Event Upset and Multiple Bit Upsets
In Table 4 and Table 5, the SEU and MBU cross sections for both DUTs are presented. The cross sections () are given for all tested energies in a range from 4 MeV to 184 MeV.
The target fluence for each energy was set to 10 protons/cm, since the SEE response was too low for the selected reference mission parameters in Figure 3.
Depending on the selected proton beam energy, the flux was between 6.8 × 10 and 1 × 10 protons/cm/s. The numbers of SEU counted ranged 4–36 bit-flips of the 8-bit configuration registers. The event rate did not monotonically increase with energy in the studied range. Thus, a threshold or saturation energy could not be determined. MBUs were counted if multiple bit-flips of a DUT configuration register were detected. The numbers of events were independent of the numbers of bits-flips (at least two bits). The MBUs counted for both DUTs were in the range from 0 to 10. A detailed evaluation of the cross sections for the SEUs and MBUs is given in Section 6.
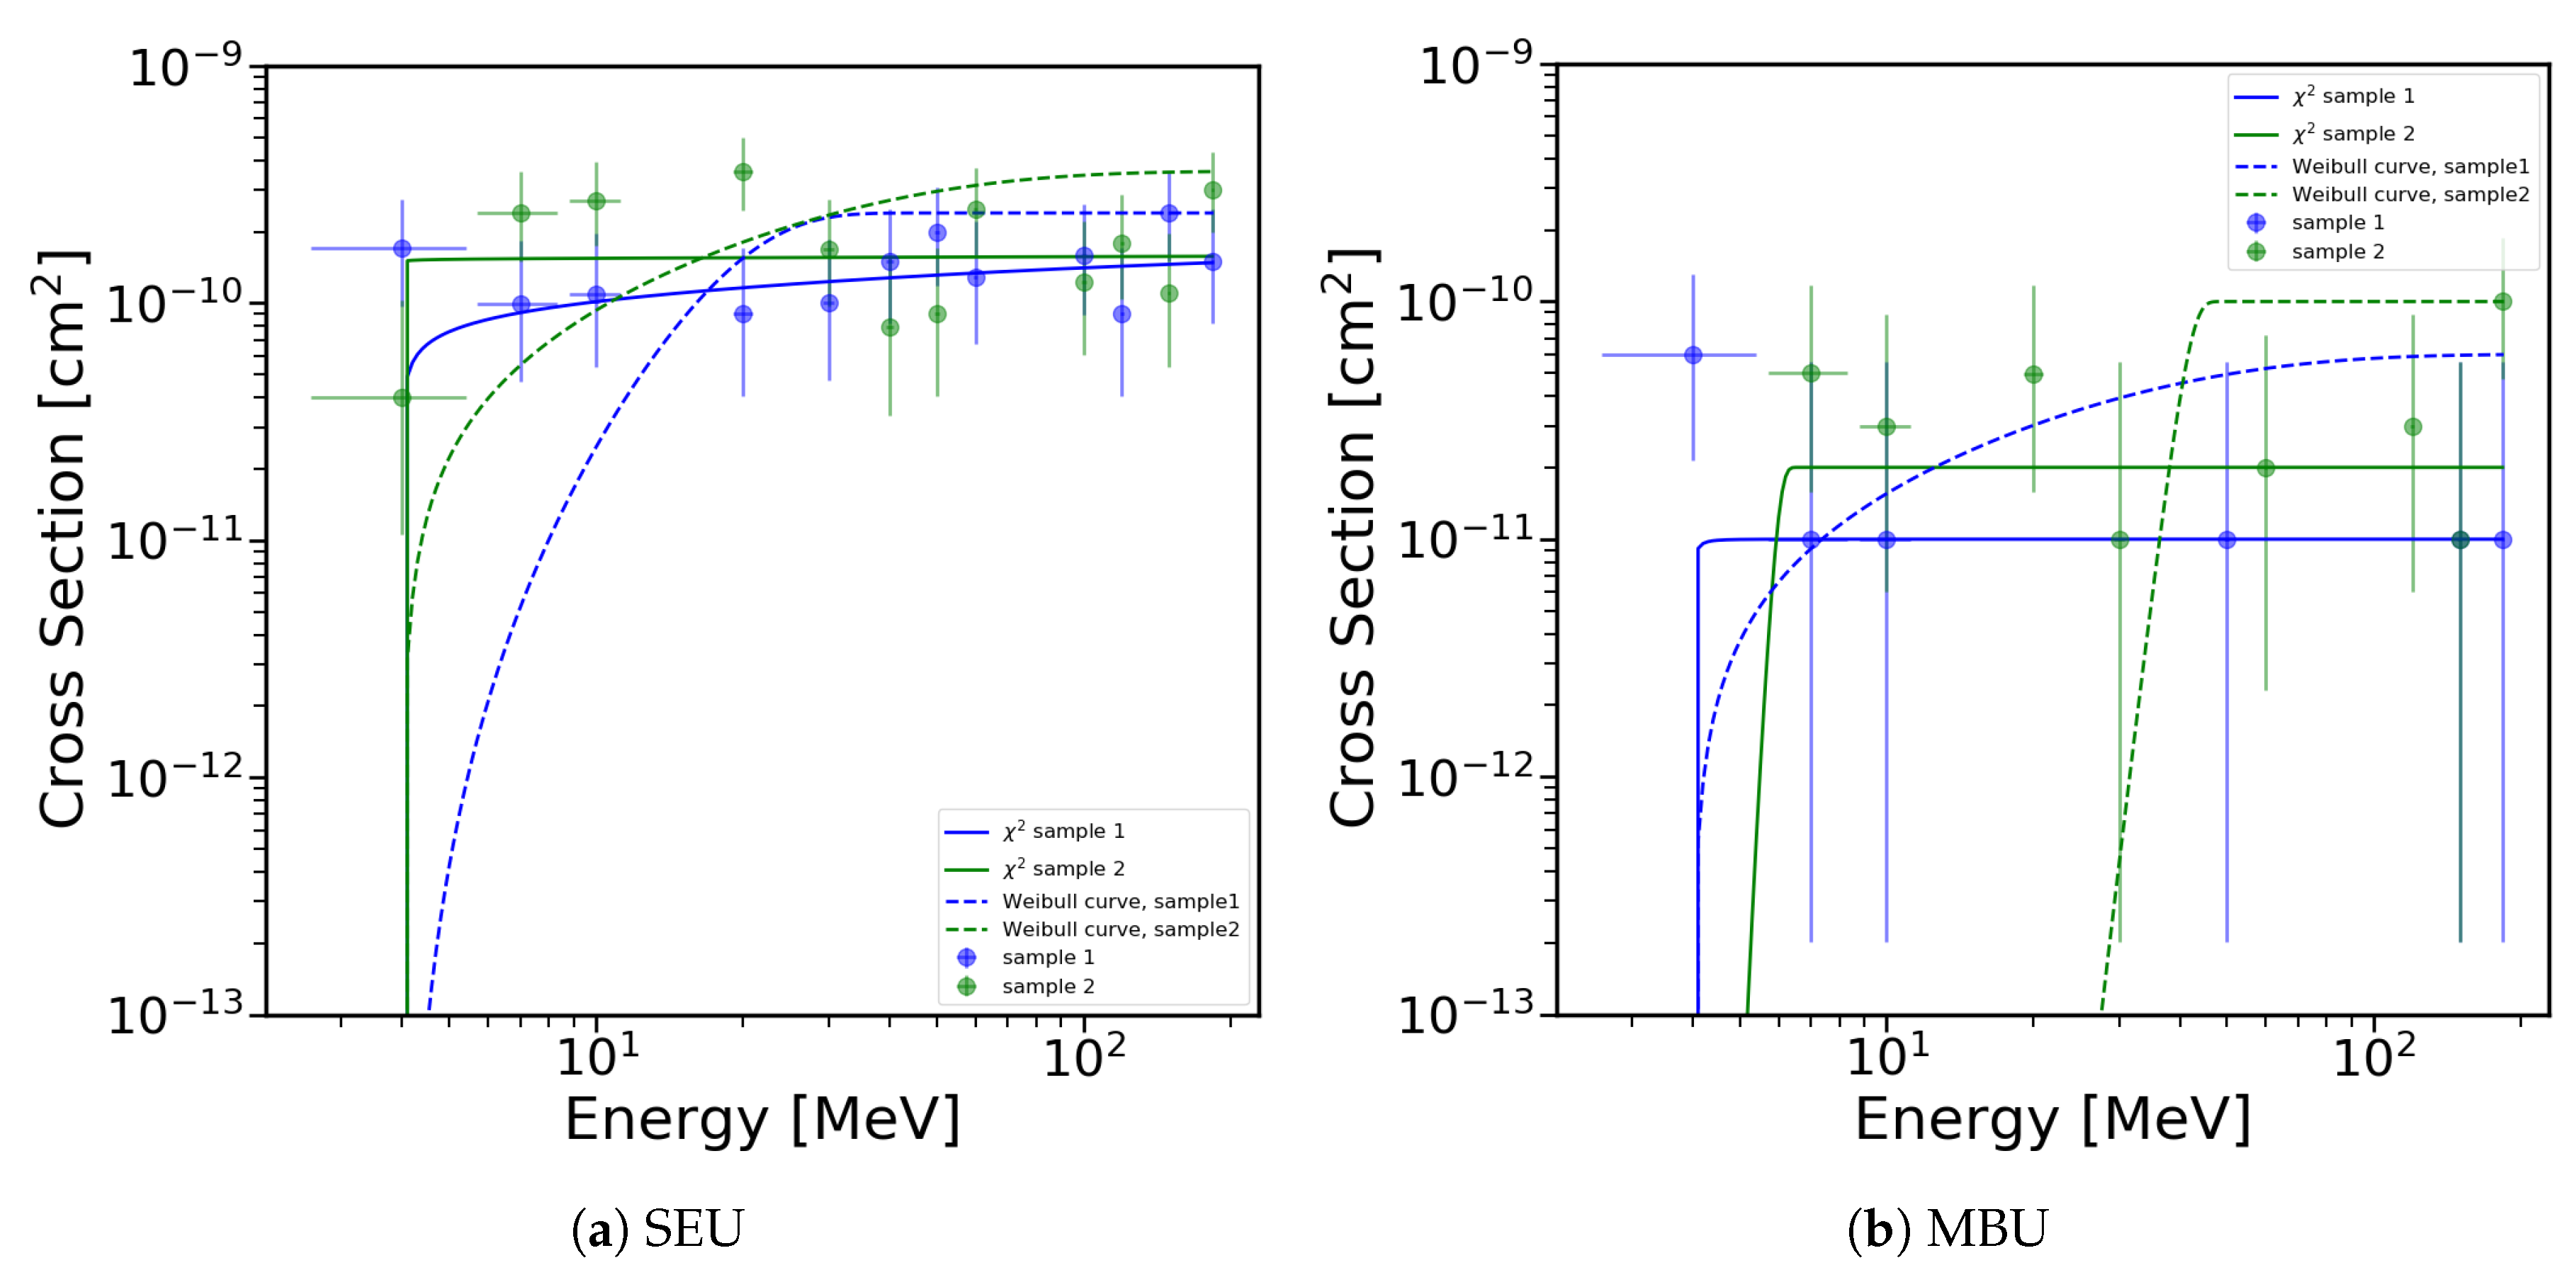
The cross section values for both SEU and MBU events as a function of the incident proton energy is presented in Figure 8. The SEU events are presented in Figure 8a and the MBU events in Figure 8b. Sample 1 is in blue while Sample 2 is represented in green.
Standard deviation of the proton energy at the DUT site was provided by the facility and the values depended on the energy of the primary beam, thickness of the degrader, and the distance of the degrader to the DUT. The values are presented in Table 6. The two primary beams of energy 60 MeV and 184 MeV are marked by bold font.
Uncertainty of the cross section was calculated according to recommendations given in the ESCC standard [13]. It is a product of uncertainty of number of events and proton fluence:
The facility states that the fluence uncertainty is better than 10% and this number was used for calculations. Deviation in the number of events were calculated using the chi-square distribution function for a given confidence level, which, as recommended by the ESCC standard, was taken as 95%. Accordingly, the left-tailed and the right-tailed part of the function were used to determine the lower and the upper number of the events. Then, the lower and upper deviation of number of events was calculated by subtraction of the lower and upper events number and number of events measured during the irradiation test, i.e.,
Then, both numbers, and , were used together with Equation (1) to calculate the and .
The cross section values were then used to fit the so-called Weibull function into the data:
where is a saturation cross section, x states for the proton energy, is the proton energy threshold, W is the so-called width parameter given in a units of MeV, and S is the unit-less exponent parameter.
The proton energy threshold for all of the curve fit calculations was taken as the lowest proton energy which returns at least one event effect. The remaining three Weibull function parameters were used to fit the curve to the data. A test was used for fitting procedure [16]:
Here, Model represents the described by the Weibull function, represents the ith cross section value for examined event type, and N represents number of cross sections taken into account. The smaller is the value, the better does the Model represent the experimental data. Table 7 contains all four parameters together with the values:
An alternative method to fit the Weibull curve, Equation (3), was used for the dataset. OMERE software (in version 5.2.4) has an algorithm that can determine the W and S parameters of the curve [17]. They are presented by dashed lines in Figure 8. Table 8 contains the fit parameters.
Both methods gave slightly different results. The method fit the curve more according to the data while the OMERE software algorithm seemed to omit cross sections for the lowest tested energies.
5.3. Single Event Failure Interrupt
Compared to the SEU and MBU events, SEFIs are more important, since the device loses its initial functionality and a recovery process needs to be performed. For SEFIs, two categories were defined, as already described in Section 4.2: (1) reconfiguration (SEFI); and (2) re-initialization (SEFI). The cross sections and SEFI event counts are presented in Table 9 for DUT Sample 1 and Table 10 for DUT Sample 2.
SEFIs emerge quite rarely compared to SEUs. We observed that SEFIs were only caused by a SEU or MBU event and never occurred randomly. In most cases, the DUTs were reconfigurable and no re-initialization was required. The SEFI rates for reconfiguration ranged 0–6 events.
Only three re-initializations were required over the full energy range and on both DUTs. A more detailed discussion about the SEFI rate and their interpretation is presented in Section 6.
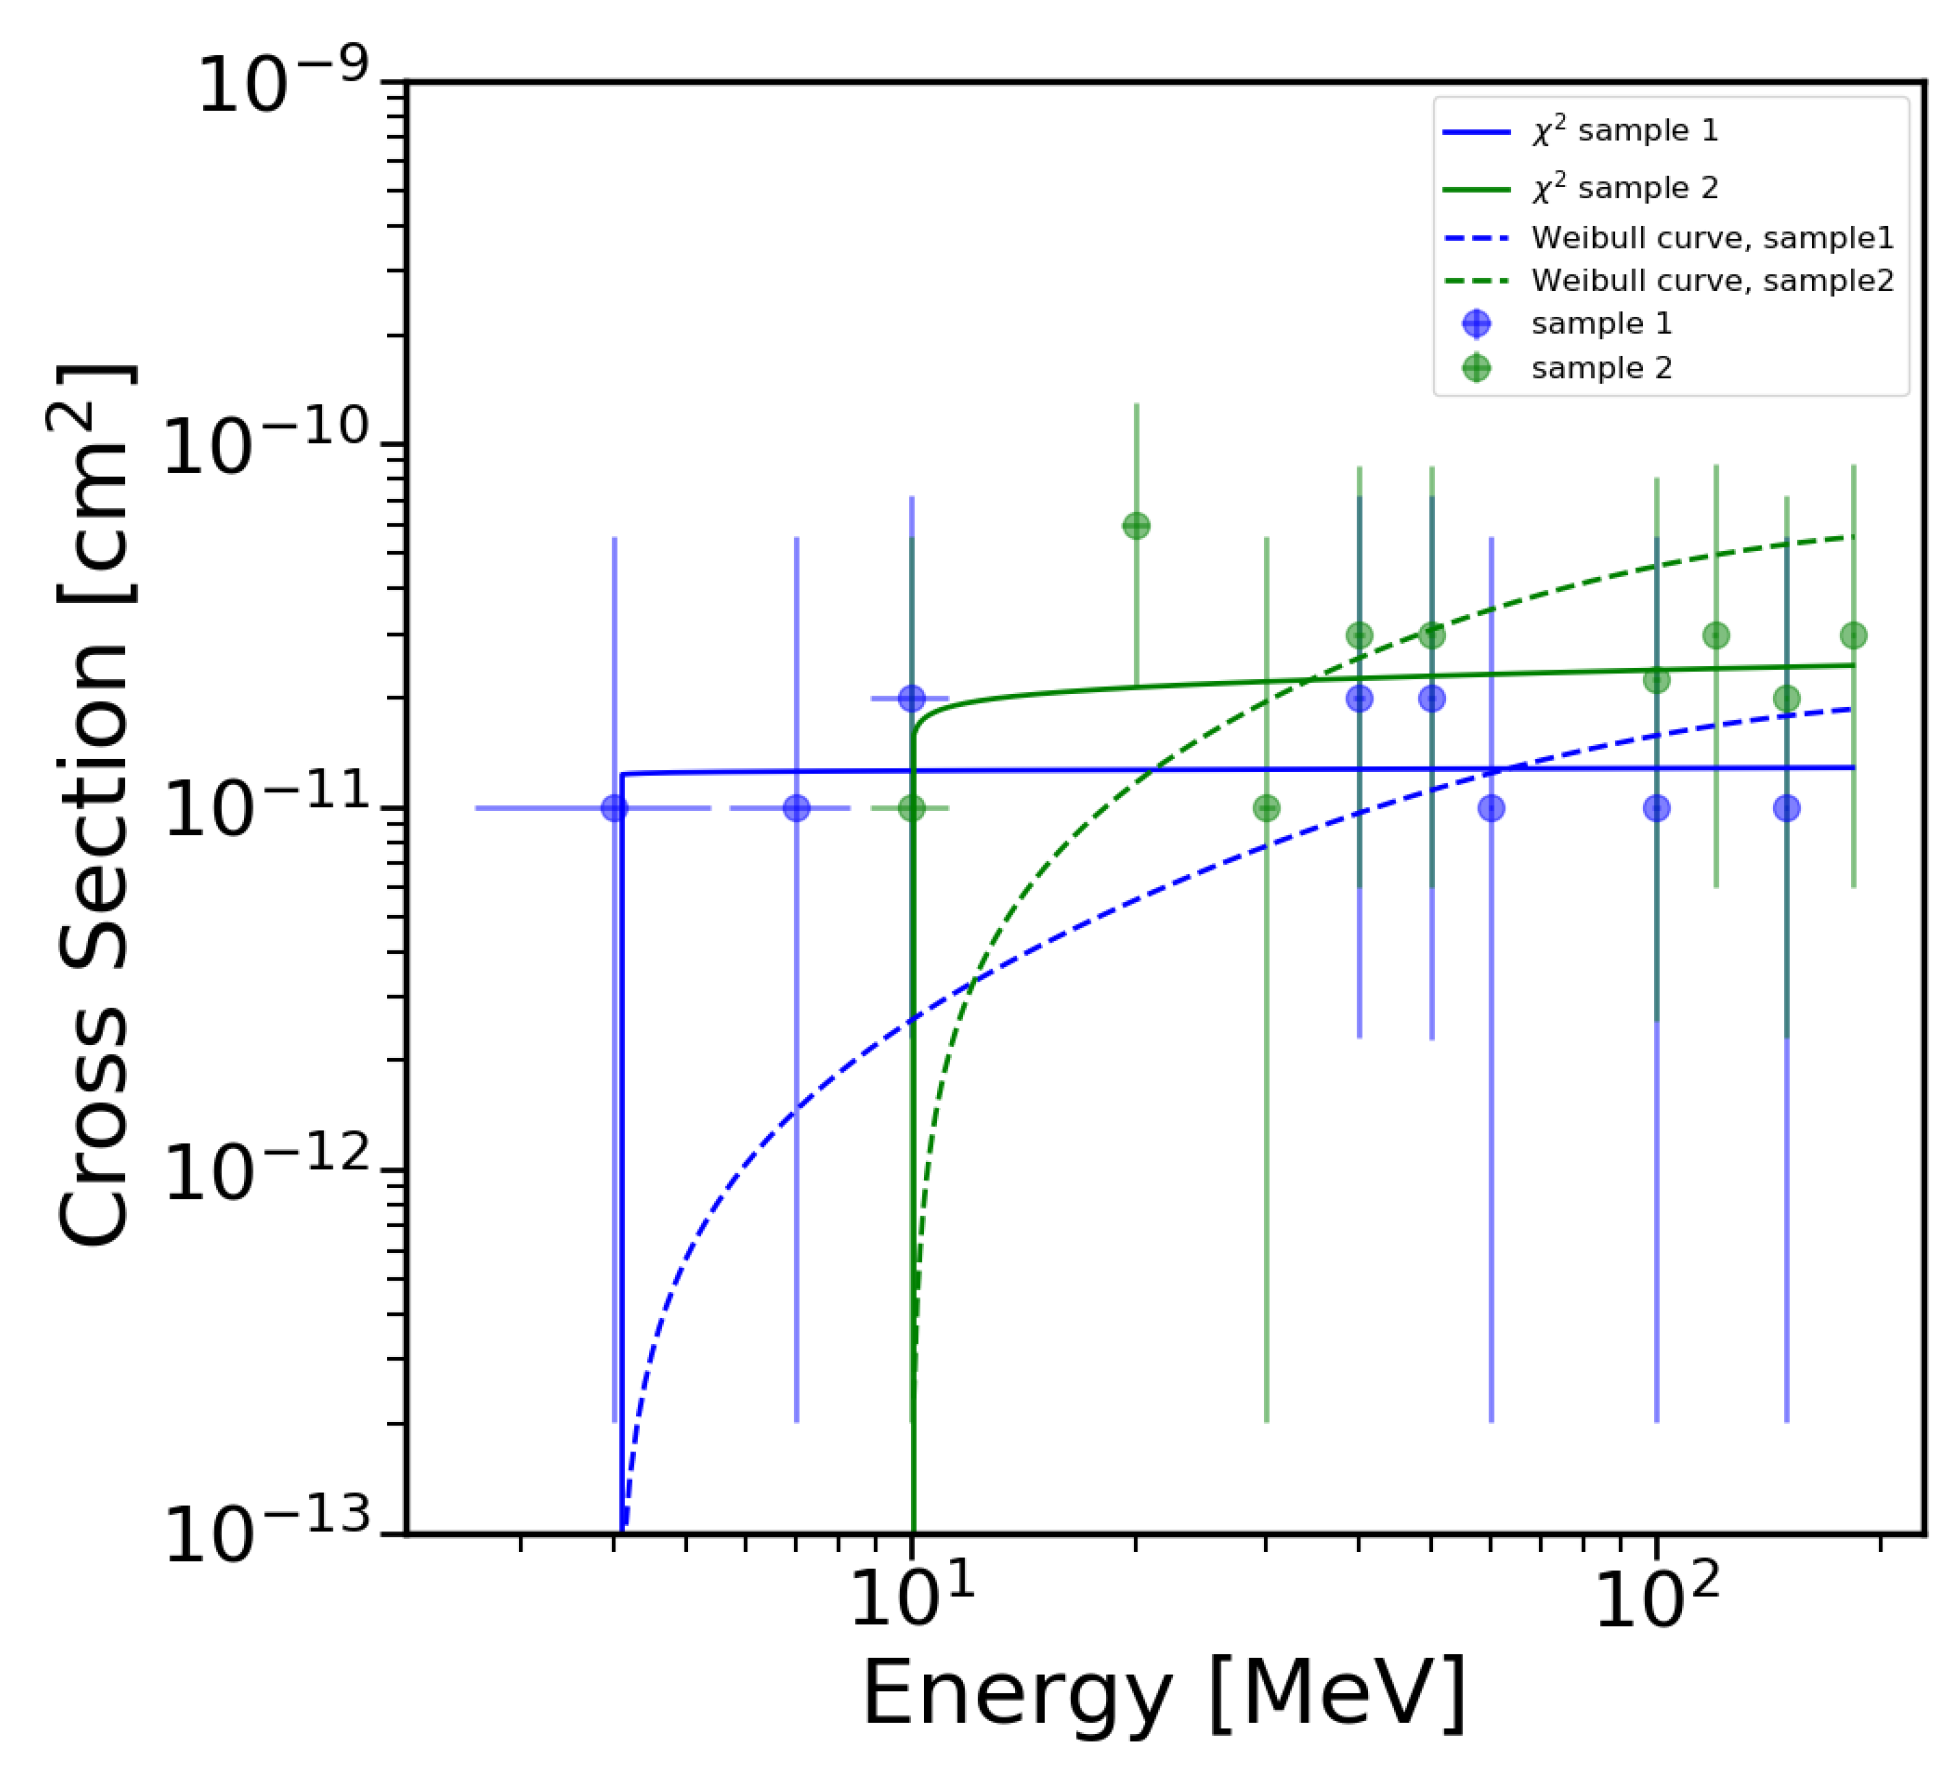
The cross section of the as a function of proton energy for both samples is shown in Figure 9. The cross sections are not plotted, since Sample 1 indicates two and Sample 2 one event throughout the whole energy range. The Weibull function was fitted to the data using the same -test procedure as presented for the SEU and MBU events.
Table 11 contains the Weibull function parameters and values. In addition, as for the SEU and MBU event type, the OMERE software was used to fit the curve into the dataset. Table 12 contains the curve fit parameters. The curves for both of the samples are plotted using the dashed lines.
As for the SEU and the MBU event types, the fit of the OMERE function made by the OMERE software algorithm seemed to omit the cross sections recorded for the low energy protons.
6. Analysis of The Results
In this section, we discuss the SEE test results presented in Section 5. Additionally, the SEE cross sections are correlated to dedicated space missions, which are usually intended to be the reference missions for the test requirements. The corresponding SEE event rates are presented.
6.1. See Test Result Interpretation
Different kinds of SEE events are discussed and interpreted. We observed several SEUs, MBUs and rare SEFIs during the test campaign. Below, error logs for different kinds of events are presented.
Listing 1: Error log (SEU/MBU) cutout for Sample 1, run 10
- SNIP -
Time: 1514764812 Register: 250 New Value: e2 Old Value: ea Reg Counter: 1 SEU Counter: 1
Time: 1514764821 Register: 481 New Value: 19 Old Value: 8 Reg Counter: 2 SEU Counter: 3
- SNIP -
Time: 1514764838 Register: 583 New Value: 82 Old Value: 2 Reg Counter: 3 SEU Counter: 5
Time: 1514764838 Register: 566 New Value: 18 Old Value: 58 Reg Counter: 4 SEU Counter: 6
- SNIP -
In Listing 1, a cutout of the console output for a SEU and a MBU event is presented. As mentioned above, a MBU was counted if at least two bits inside of the 8-bit configuration registers were flipped. In the above error log (Listing 1), cutout (Sample 1, Run 10) at Time: 1514764812, firstly, one SEU occurred and afterwards (Time: 1514764821) we observed that on register 481 the value changed from 8 (0000 1000) to 19 (0001 1001). Thus, two bit-flips were detected and clarified as one MBU. In Listing 2, an error log cutout (Sample 1, Run 12) for a reconfiguration SEFI is presented.
Listing 2: Error Log (SEFI - Re-Config)
- SNIP -
Time: 1514764831 Register: 562 New Value: 4 Old Value: 0 Reg Counter: 2 SEU Counter: 2
Error in Register Function
out\_altvoltage0 RX LO frequency Old Line: 2450000000
New Line: 8589934590
** Re-Configuration successful ***
- SNIP -
Firstly, a SEU in register 562 (part of the RX synthesizer registers) occurred, which caused a change in the receiver local oscillator frequency (RX LO frequency). This SEFI could be recovered by a simple reconfiguration, commanding the initial RX LO frequency to the device. In some minor cases, we observed that even a reconfiguration was not successful to recover the DUT initial functionality. A snip of the error log, including a re-initialization required SEFI, is presented in Listing 3.
Listing 3: SEFI - Re-Init
- SNIP -
Time: 1514764849 Register: 347 New Value: 20 Old Value: 0 Reg Counter: 9 SEU Counter: 9
Time: 1514764849 Register: 410 New Value: 0 Old Value: 1 Reg Counter: 10 SEU Counter: 10
Error in Register Function
out\_altvoltage1 TX LO fastlock save Old Line: 0 87,247,119,52,23,39,23,23,70,255,159,3,127,29,31,63
New Line: 0 87,247,119,52,23,39,23,23,70,255,159,3,127,29,27,63
Error in Register Function
out\_altvoltage1 TX LO fastlock save Old Line: 0 87,247,119,52,23,39,23,23,70,255,159,3,127,29,31,63
New Line: 0 87,247,119,52,23,39,23,23,70,255,159,3,127,29,27,63
*** Re-Configuration failed, performing Re-Initialization ***
*** Re-Initialization successful ***
- SNIP -
Firstly, two SEUs were detected in register 347 and 410. Register 347 is an open register for the receive signal strength indicator (RSSI) measurement and is not declared to be responsible for the following SEFI. Register 410 is part of the Rx BB DC Offset register configuration and its SEU changed the function of the TX LO fastlock saving. The TX LO fastlock saving stores the parameters for the TX synthesizer. After detection of the SEFI, a reconfiguration was performed. At this specific event, a re-initialization was required after the reconfiguration attempt failed. The initial setting were restored successfully and the DUT was functional again.
6.2. Event Rate Calculation
The worst case event rate is defined as a product of maximum calculated cross section of examined event type and proton flux which corresponds to minimum proton energy for at least one event. It is the co-called threshold energy . The flux, however, was taken from radiation analysis of reference missions. A calculation was made to estimate maximum number of possible events per year. Schematically, the rate can be represented as:
For SEU events, the highest cross section was recorded for the second sample at 3.6 × 10 . The threshold energy was 4.0 MeV. Table 13 contains a short reference mission description, the corresponding flux of trapped protons and GCR for the mentioned and the SEU rate given in number of failures per device per year. For the trapped protons, the highest rate of 4.4 can be expected for a reference mission scenario at 800 km altitude, minimum Sun activity, and orbit inclination angle of 51.64. The lowest rate of ≈0.1 can be expected at 400 km altitude, maximum Sun activity and inclinations angle of . Therefore, at ISS orbit and maximum Sun activity, one could expect ≈1 SEU event after 10 years of mission period. The GCR input to the SEU events is expected to be negligibly small, only one SEU event caused by the GCRs would happen after 100 years of DUT operation in the LEO environment.
The highest cross section for the MBU andr the events was 6.0 × 10 and it was recorded for the first and the second sample, respectively. It was six times smaller than the SEU events. Therefore, the corresponding number of event rates was lowered by the same factor. The energy threshold for the MBU events was 4.0 MeV. Table 14 contains, as for the SEU events, reference mission description, flux of trapped protons and GCR for the , and the corresponding event rate. For the trapped protons, the highest event rate of 0.73 per year can be expected for a reference mission of 800 km altitude, minimum Sun activity, and inclination angle of 51.64. Only one MBU and one event per 100 years can be expected at 800 km altitude, maximum Sun activity and inclination angle of 98. For the ISS orbit, the DUT would indicate 2–6 MBU and events per 100 years.
Only three events were recorded for two test samples and within the whole considered energy range. The single event corresponded to a cross section of 1.0 × 10 . Energy threshold for the events was 20.0 MeV. Since was much larger than for the other event types, the corresponding flux of trapped protons and GCR was also much lower (see Table 15). For all of the considered reference missions, a time period of at least 50 years would result with recognizable number of events. For the GCR, a time period of 3000 years would be needed to generate one event.
6.3. Further Detected Abnormalities
During the test, we observed some abnormalities, which are described in this section. These abnormalities include SEU-based current condition changes of the DUT and SEUs in masked registers, which are changing their value continuously without any radiation-based event.
6.3.1. Influence of a SEU to the DUT Current Conditions
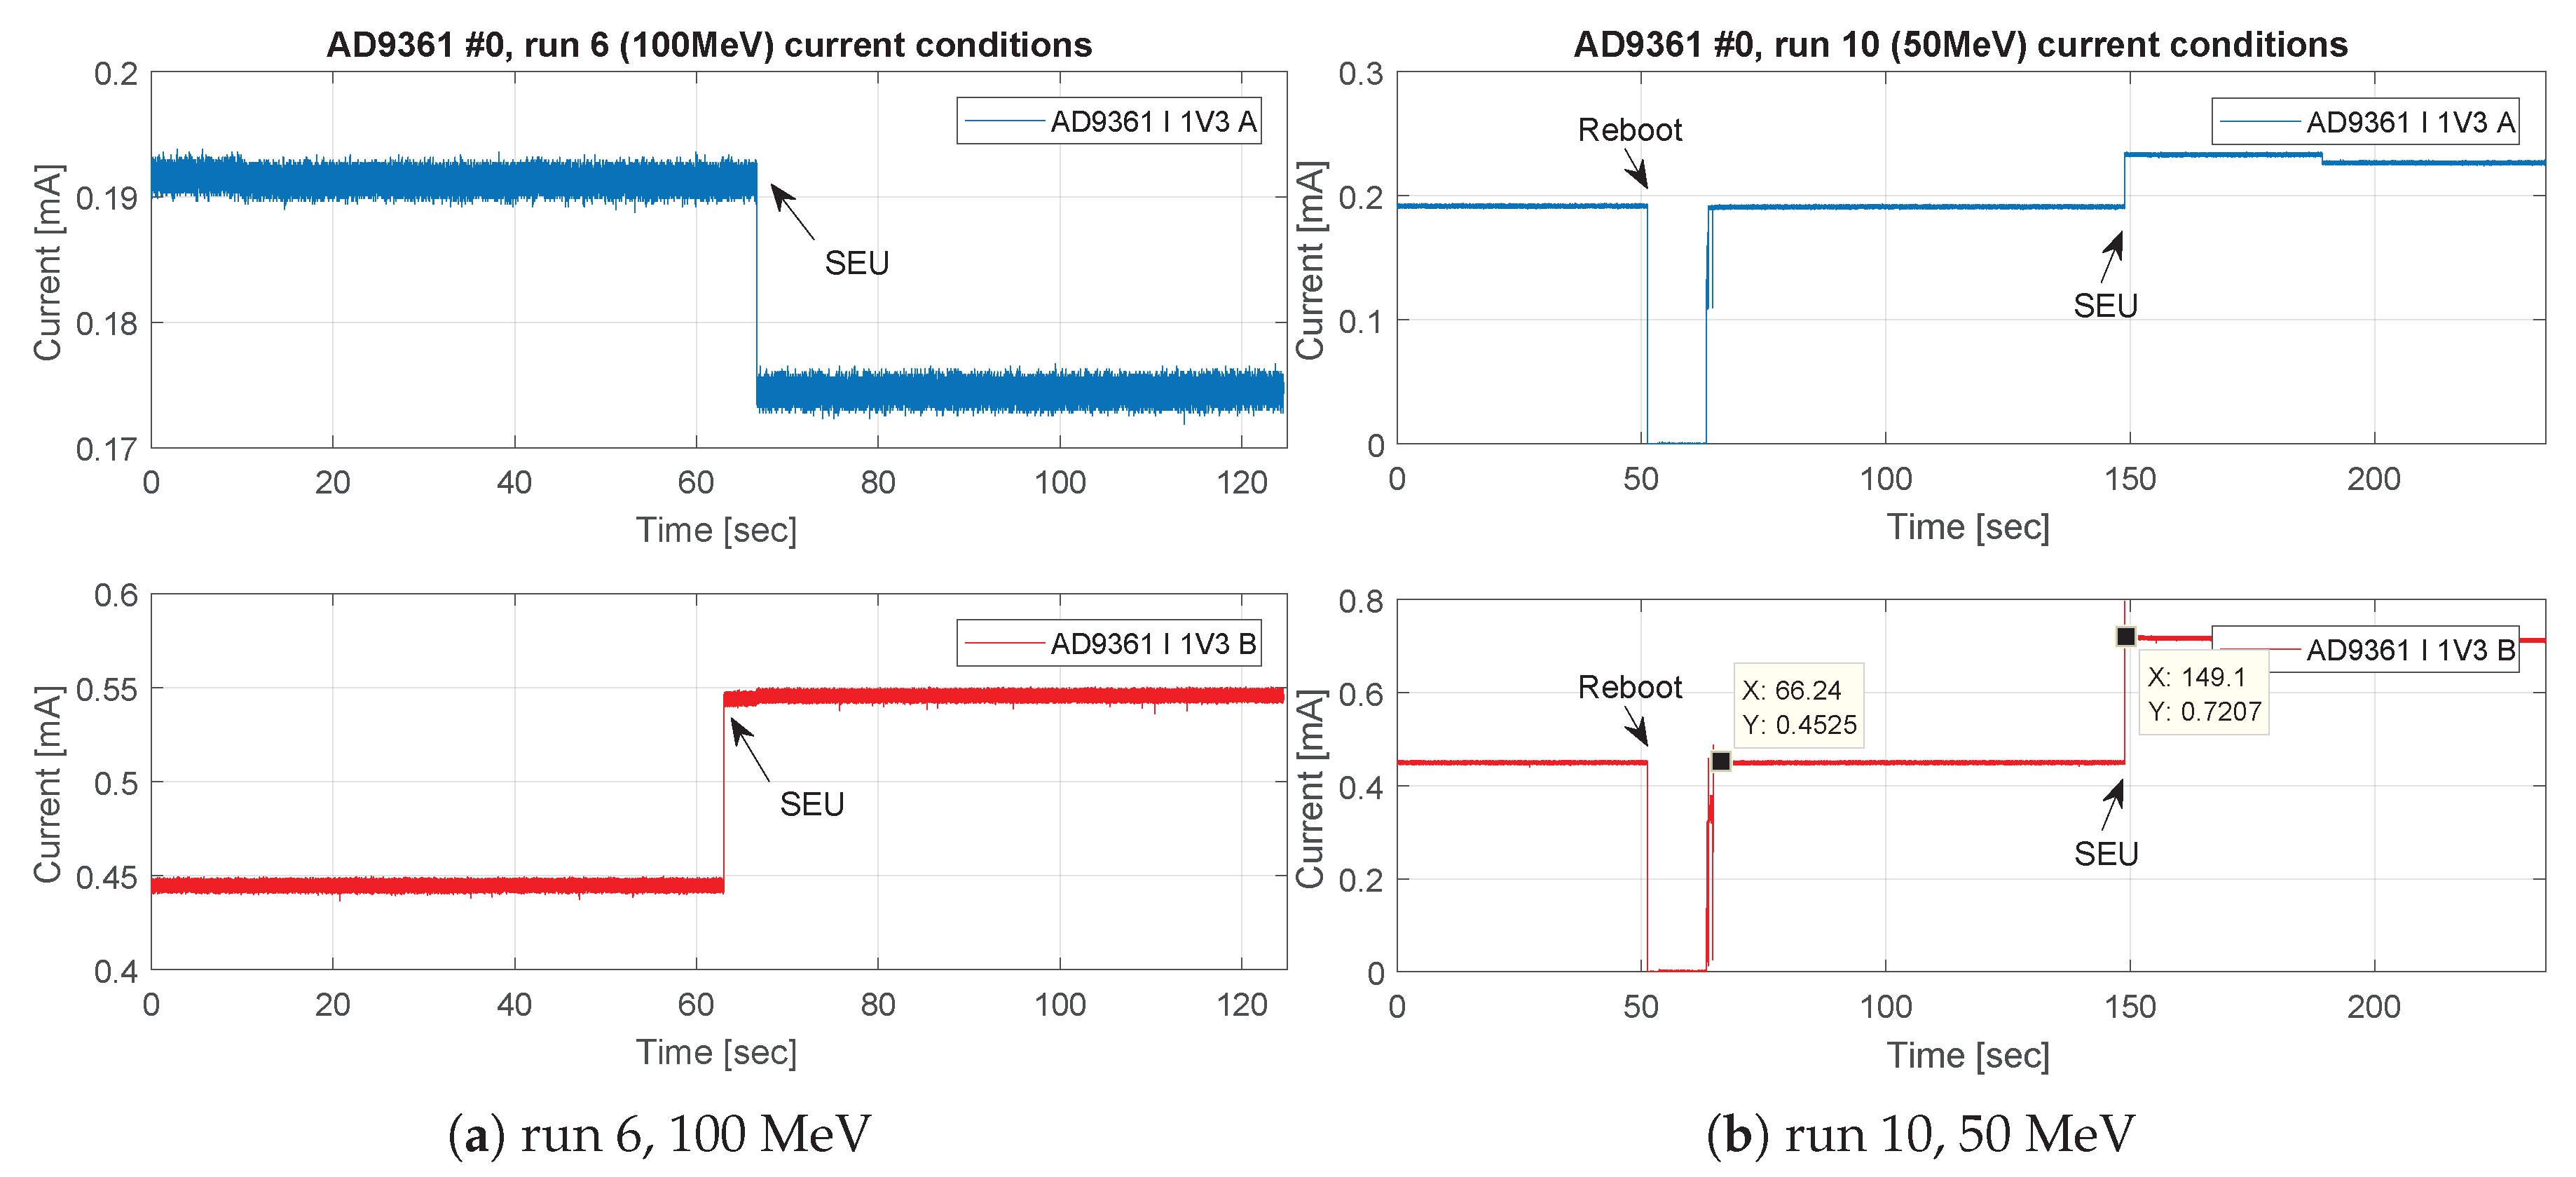
Even though we did not observed SELs or other destructive events, there were some abnormalities in the supply voltage domain that should be discussed. As expected, we observed some changes in the current condition of the DUT when a SEE occurred. We observed that conducted current could change with a single SEU, without triggering a SEFI of the DUT. An example for such an event, a SEU-based current change, is presented in Figure 10a for Sample 1 on the sixth test run with 100 MeV. The current on power rail A dropped marginally, whereas the current on power rail B increased by 100 mA. This was not declared as critical, but somehow interesting, since no obvious malfunctions were observed.
As shown in Figure 10b, we recorded the current condition of both power rails on a SEU event for Run 10 at 50 MeV. The initial current for power rail B was 450 mA. The SEU event, which also did not force a SEFI, led to an increased current of 720 mA. This current boost was also observed for power rail A. This phenomenon was not classified as a SEL, since we assumed that an SEL would have a longer rise time instead of the observed jump on the current value. Even though the device was specified to a maximum current of 1 A, we would recommend performing a reconfiguration or even a reboot, to avoid thermal stress of the DUT, particularly in vacuum. Figure 10b also presents a power cycle, performed on the FPGA board. We observed that, even with the use of collimator and additional lead brick in front of the FPGA board, the OS running on the FPGA board crashed and needed to be power cycled. The numbers of power cycles of the FPGA board were observed to increase as the proton beam energy became more degraded. We assumed that, by the degrading and the collimator, generated particles such as neutrons were hitting the FPGA through the shielding and forces a system crash. Since we were controlling the beam activity with the OS functionality on the FPGA, a correct total achieved fluence on the DUT could be ensured.
6.3.2. SEU in Masked/Non-Scrubbed Configuration Registers
During test preparation, we recognized that several configuration registers were changing their values independently of a radiation effect. These registers are so-called masked-registers. As an example, the register values/status over time for the RX phase and gain correction is presented in Figure 11.
Since there is no periodical behavior visible, and no short range of the register values to define an upper and lower threshold was found, it was almost impossible to determine an SEU inside of these registers.
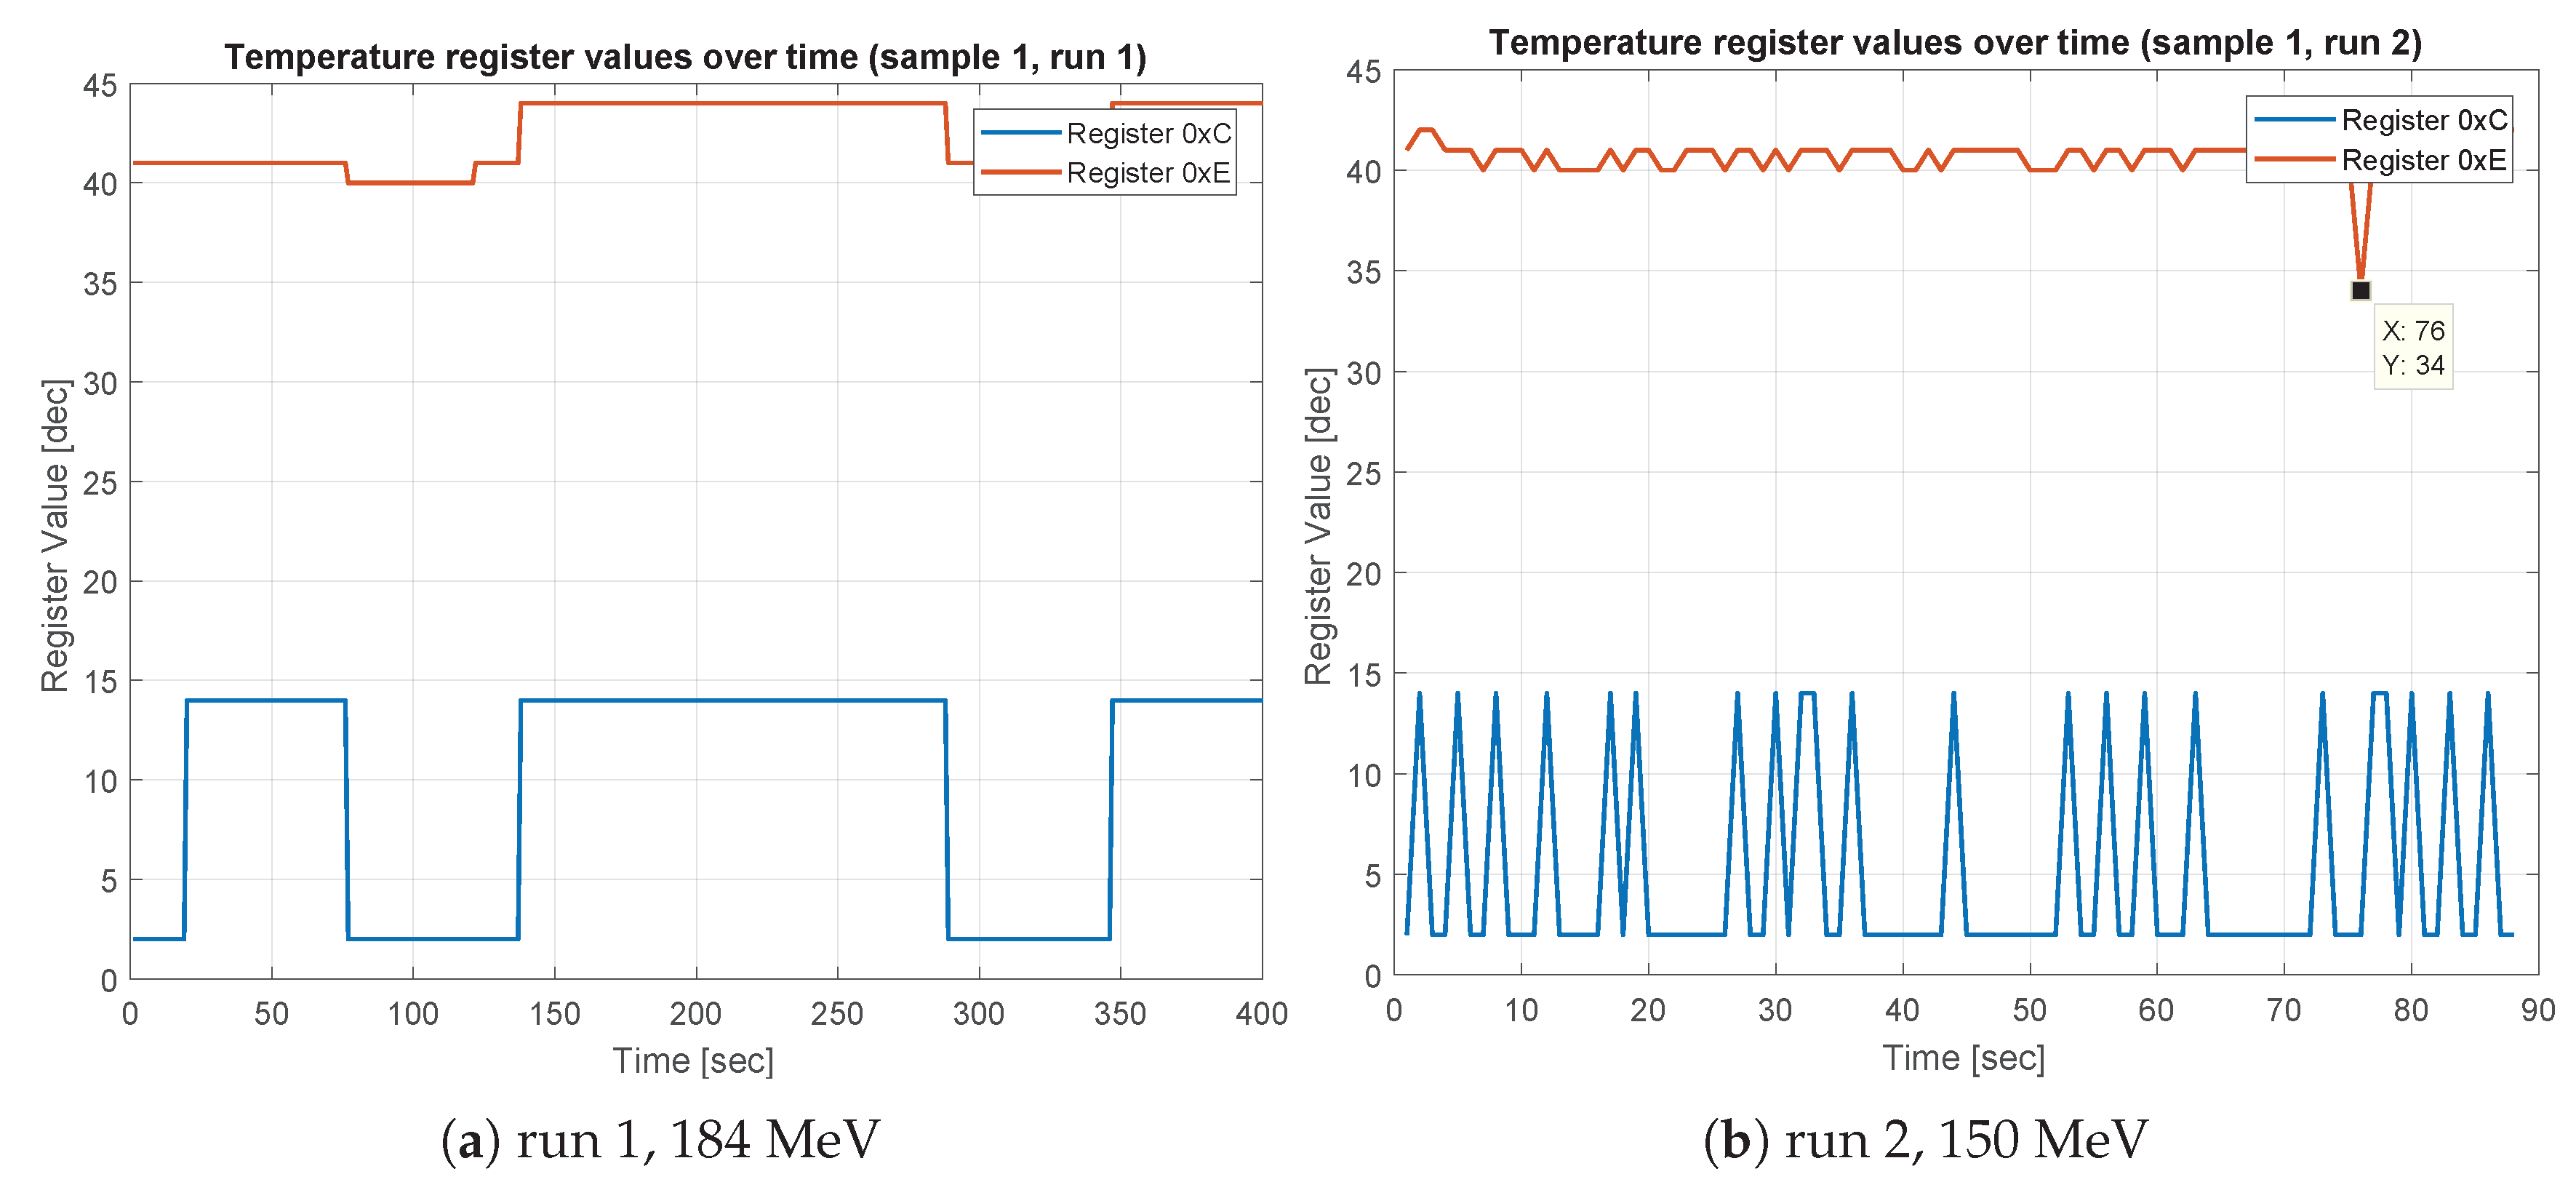
Another example for continuous alternation of the values is the configuration register responsible for an internal temperature sensor. In Figure 12a, the nominal behavior for the temperature registers of the DUT is shown (Sample 1, Run 1). In Run 2 for Sample 1, we observed a drop from 41 to 34, as presented in Figure 12b. Such a temperature drop was unlikely for the DUT and was thus declared as a SEU in the masked-register 0xE.
7. Conclusions
In this paper, we present the proton induced SEE characterization of a highly integrated RF transceiver (AD9361). The DUT was fabricated on a 65 nm CMOS process and was therefore categorized to be sensitive of proton irradiation. Due to the DUT complexity, a special test approach/method was required to classify different kinds of events. The exposed proton energies were split into two test campaigns, to induce high energy protons (up to 184 MeV) and low energy protons down to 4 MeV. The results show a very low response to proton irradiation, independent of the proton energy. The total fluence of 1.00 × 10 #·cm, however, was not enough to achieve a number of failures for desirable error statistic (≥100 failures). Two DUTs was tested and the results show a similar behavior. The worst case event rate calculations show that, depending on different type of reference missions/orbits, a SEU or MBU is expected to occur once in 10 years and a SEFI around every 100 years in LEO. Further activity will involve the SEE characterization of the DUT on heavy ion irradiation. Additionally, we also focus on the evaluation of the transceivers integrated ADCs and DACs, which also might be affected by radiation (SEUs, single event effects transients and SEFIs) and has not been taken into account during this test campaign.
Author Contributions
Main idea, J.B.; conceptualization, J.B. and M.P.J.; test requirements, J.B. and M.S.; test method and procedures, J.B. and M.P.J.; testing and results, J.B., M.S. and M.P.J.; event rate calculation, M.S.; and writing, review and editing, J.B., M.P.J. and M.S.
Funding
This research received no external funding.
Conflicts of Interest
The authors declare no conflict of interest.
References
- Budroweit, J. Design of a Highly Integrated and Reliable SDR Platform for Multiple RF Applications on Spacecrafts. In Proceedings of the GLOBECOM 2017—2017 IEEE Global Communications Conference, Singapore, 4–8 December 2017; pp. 1–6. [Google Scholar] [CrossRef]
- Budroweit, J.; Koelpin, A. Design challenges of a highly integrated SDR platform for multiband spacecraft applications in radiation enviroments. In Proceedings of the 2018 IEEE Topical Workshop on Internet of Space (TWIOS), Anaheim, CA, USA, 14–17 January 2018; pp. 9–12. [Google Scholar] [CrossRef]
- Crowne, M.J.; Haskins, C.B.; Wallis, R.E.; Royster, D.W. Demonstrating TRL-6 on the JHU/APL Frontier Radio for the Radiation Belt Storm Probe mission. In Proceedings of the 2011 Aerospace Conference, Big Sky, MT, USA, 5–12 March 2011; pp. 1–8. [Google Scholar] [CrossRef]
- O’Neill, M.B.; Millard, W.P.; Bubnash, B.M.; Mitch, R.H.; Boye, J.A. Frontier Radio Lite: A Single-Board Software-Defined Radio for Demanding Small Satellite Missions. In Proceedings of the 30th Annual AIAA/USU Conference on Small Satellites, SSC16-VII-2, Logan, UT, USA, 8–13 August 2016. [Google Scholar]
- Pu, D.; Cozma, A.; Hill, T. Four Quick Steps to Production: Using Model-Based Design for Software-Defined Radio. Analog. Dialogue 2015, 49, 1–5. [Google Scholar]
- AD9361 Material Declaration. Available online: https://www.analog.com/media/en/package-pcb-resources/material-declaration/cspbga/cspbga_10x10(bc-144-7).pdf (accessed on 25 April 2019).
- Vettel, J.I. The AE-8 Trapped Electron Model Environment; NSSDC/WDC-A-R&S, 91-24; NASA: Greenbelt, MD, USA, 1991. [Google Scholar]
- Vettel, J.I. The NASA/National Space Science Data Center Trapped Radiation Environment Model Program (1964–1991); NSSDC/WDC-A-R&S 91-29; NASA: Greenbelt, MD, USA, 1991. [Google Scholar]
- Jordan, C.E. NASA Radiation Belt Models AP-8 and AE-8. Sci. Rep. 1986, 1, 1–20. [Google Scholar]
- Tylka, A.J.; Adams, J.H.; Boberg, P.R.; Brownstein, B.; Dietrich, W.F.; Flueckiger, E.O.; Petersen, E.L.; Shea, M.A.; Smart, D.F.; Smith, E.C. CREME96: A Revision of the Cosmic Ray Effects on Micro-Electronics Code. IEEE Trans. Nucl. Sci. 1997, 44, 2150–2160. [Google Scholar] [CrossRef]
- Holmes-Siedle, A.; Adams, L. Radiation environments. In Handbook of Radiation Effects; Oxford University Press: Oxford, UK, 2007; pp. 18–19. [Google Scholar]
- Ziegler, J.F.; Ziegler, M.D.; Biersack, J.P. SRIM—The stopping and range of ions in matter (2010). Nucl. Instrum. Methods Phys. Res. Sect. B Beam Interact. Mater. Atoms. 2010, 268, 1818–1823. [Google Scholar] [CrossRef]
- ESA. Single Event Effects Test Method and Guidelines, ESCC Basic Specification No. 25100; Issue 2; ESA: Paris, France, 2014. [Google Scholar]
- The Stopping and Range of Ions in Matter (SRIM). Available online: http://www.srim.org/index.htmSRIMMENU (accessed on 15 March 2019).
- Zynq-7000 SoC Product Advantages. Available online: https://www.xilinx.com/products/silicon-devices/soc/zynq-7000.html (accessed on 25 April 2019).
- Brandt, S. The chi2-Test for Goodness-of-Fit. In Data Analysis. Statistical and Computational Methods for Scientists and Engineers; Springer International Publishing: London, UK, 2014; pp. 199–200. [Google Scholar]
- The OMERE Software. Available online: http://www.trad.fr/en/space/omere-software/ (accessed on 25 April 2019).
Figure 1.
AD9361 block diagram [5].
Figure 1.
AD9361 block diagram [5].

Figure 2.
Side view: X-ray image of the AD9361.

Figure 3.
Integral flux and fluence spectra.

Figure 4.
Schematic of the SEE test setup.

Figure 5.
Top (left); and bottom (right) view of the DUT test board.

Figure 6.
SEE test procedure flow chart.

Figure 7.
SEE software control flow chart.
Figure 8.
SEU and MBU cross section plots together with the Weibull fit function.

Figure 9.
SEFI cross section together with the Weibull fit function.

Figure 10.
Current conditions on the DUT 1.3V power rails (a,b), after SEU events (Sample 1, Runs 6 and 10).
Figure 10.
Current conditions on the DUT 1.3V power rails (a,b), after SEU events (Sample 1, Runs 6 and 10).

Figure 11.
Masked configuration register (0x170 and 0x171) for gain and phase correction.
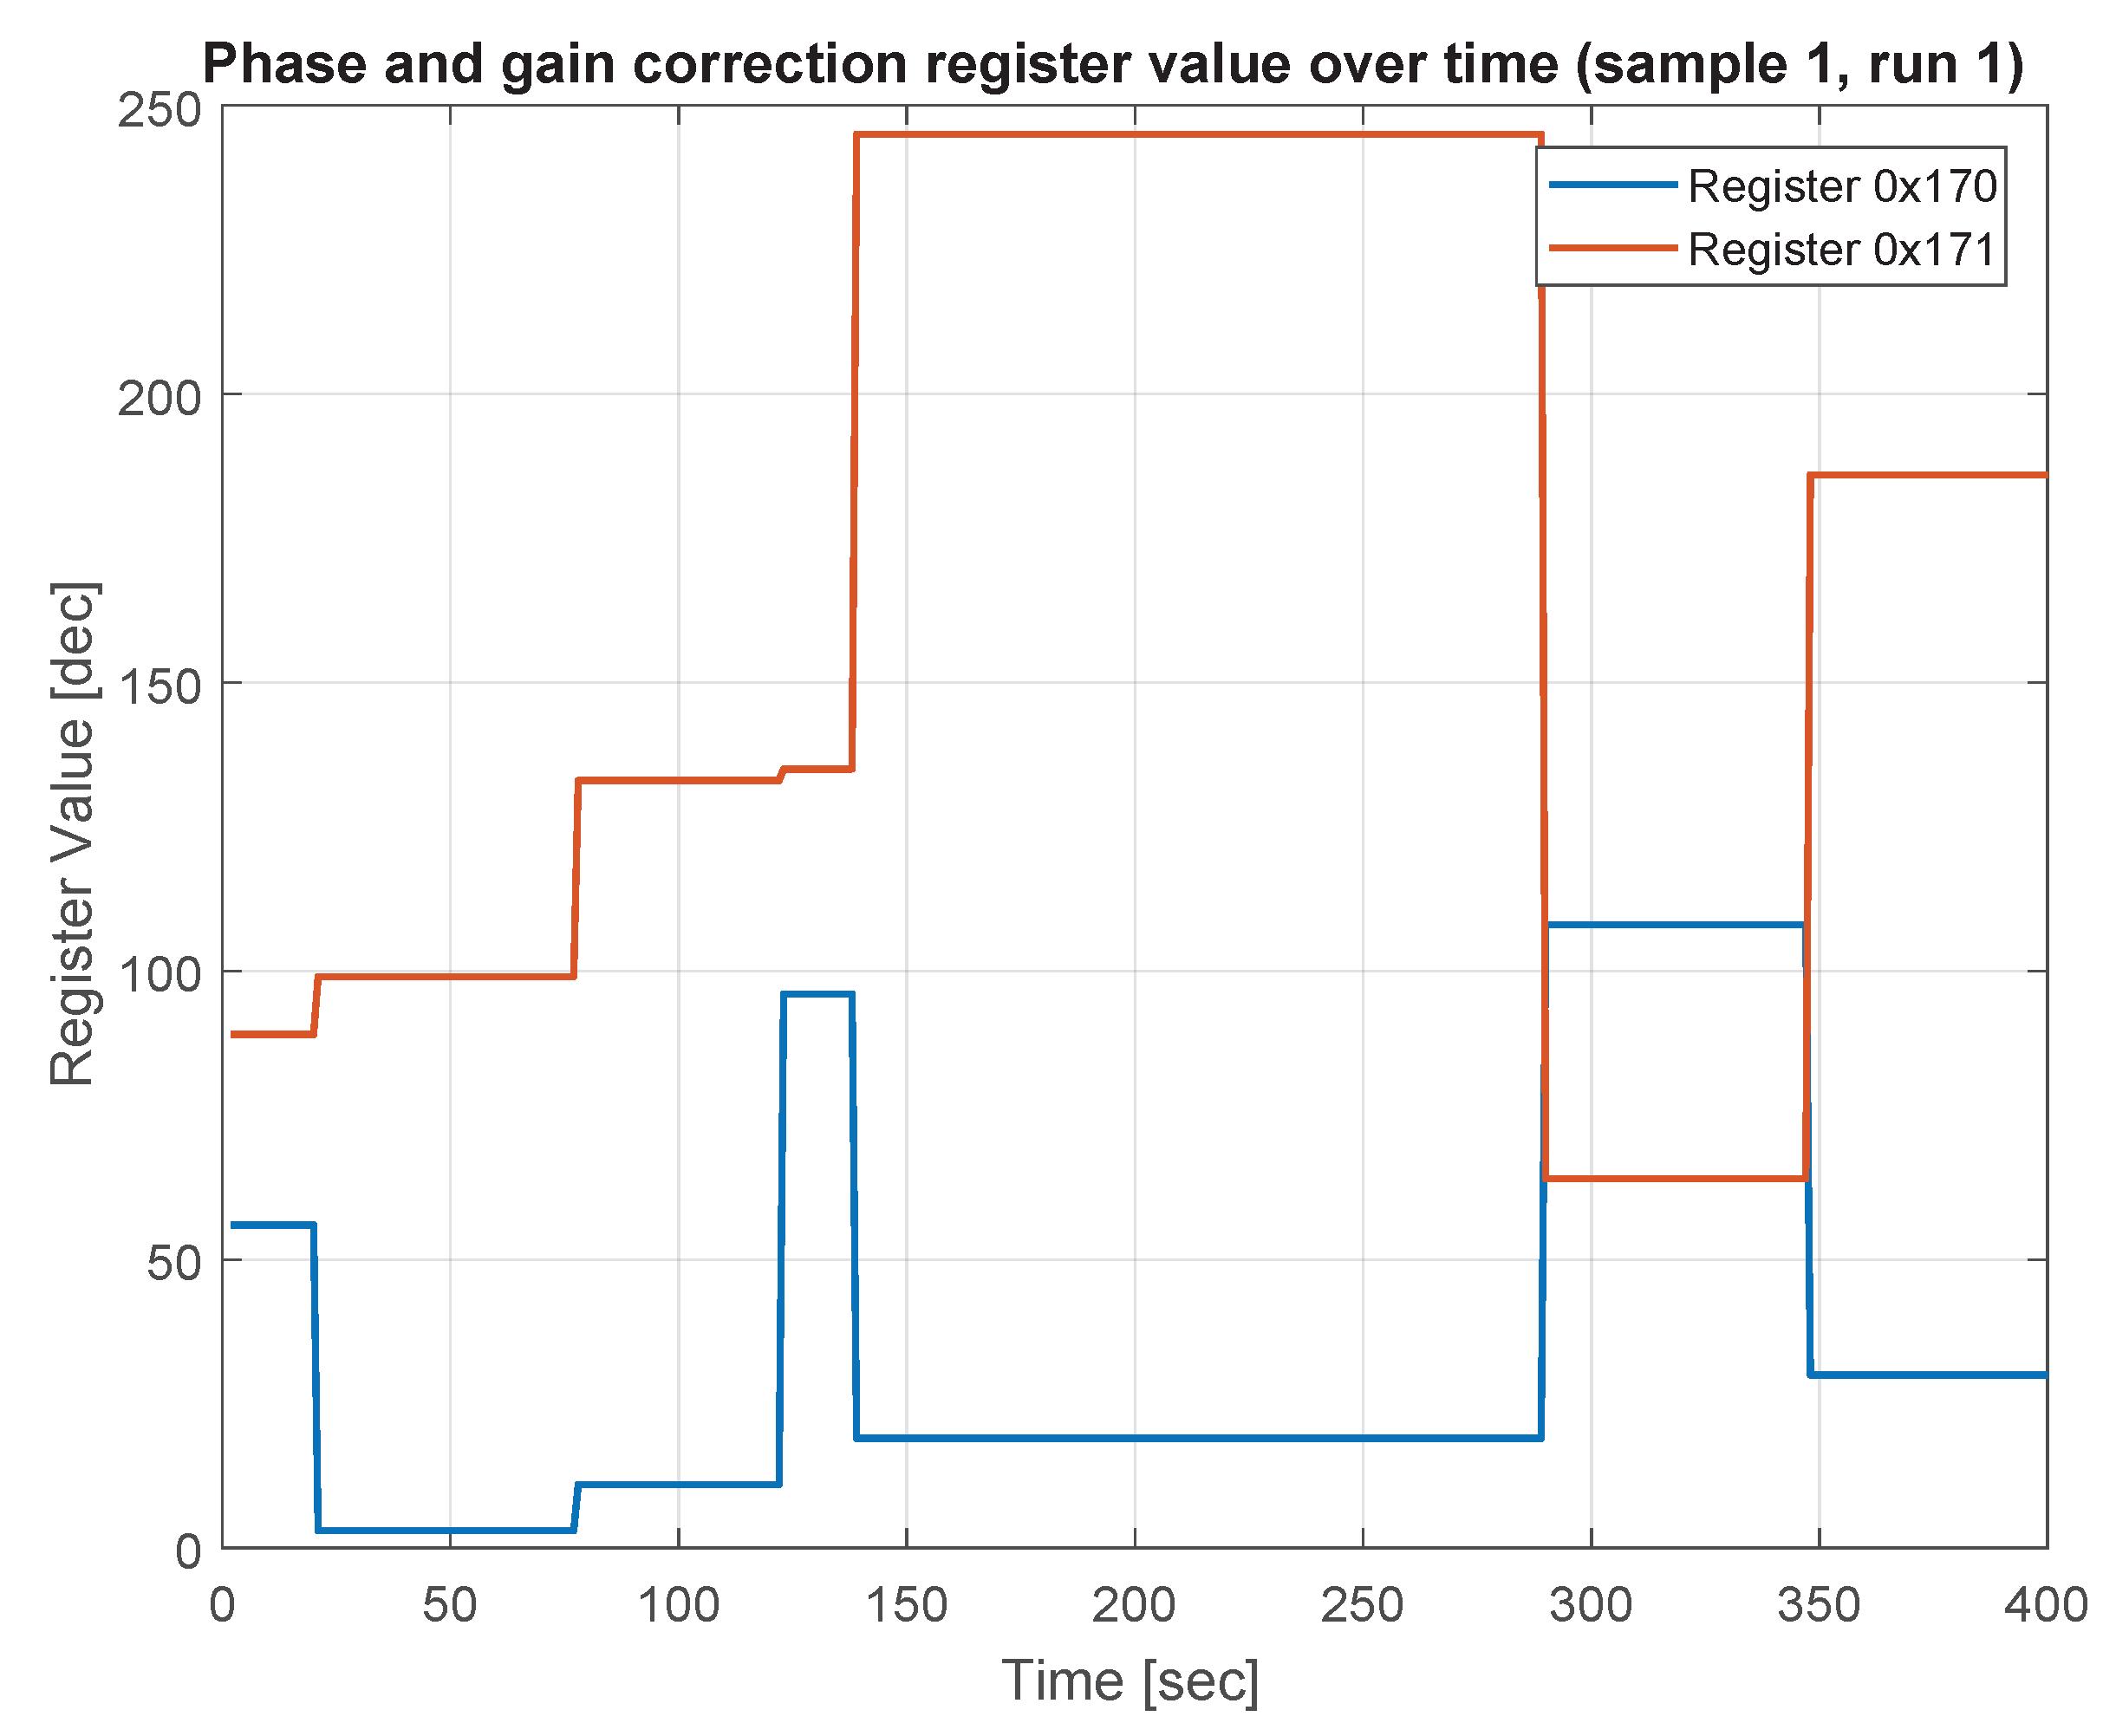
Figure 12.
Temperature register values nominal (a); and with bit-flip event (b) (Sample 1, Runs 1 and 2).
Figure 12.
Temperature register values nominal (a); and with bit-flip event (b) (Sample 1, Runs 1 and 2).

Table 1.
Specification of the high energies at the DUT position (MeV) and resulting calibration factor (protons per cm per monitor unit (MU) ) for the desired configuration and the amount of degrader material (mm Aluminum) that needs to be used.
Table 1.
Specification of the high energies at the DUT position (MeV) and resulting calibration factor (protons per cm per monitor unit (MU) ) for the desired configuration and the amount of degrader material (mm Aluminum) that needs to be used.
| Nominal Energy [MeV] | Al Degrader [mm] | Calibration [Protons/cm/MU] |
|---|---|---|
| 184 | 0 | 218.57 |
| 150 | 31.5 | 191.07 |
| 120 | 55.5 | 162.11 |
| 100 | 69.5 | 134.57 |
| 70 | 86.5 | 98.79 |
Table 2.
Specification of the low energies at the DUT position (MeV) and resulting calibration factor (protons per cm per MU) for the desired configuration and the amount of degrader material (mm Aluminum) that needed to be used.
Table 2.
Specification of the low energies at the DUT position (MeV) and resulting calibration factor (protons per cm per MU) for the desired configuration and the amount of degrader material (mm Aluminum) that needed to be used.
| Nominal Energy [MeV] | Al Degrader [mm] | Calibration [Protons/cm/MU] |
|---|---|---|
| 60 | 0 | 97.55 |
| 50 | 4.0 | 93.68 |
| 40 | 7.5 | 89.17 |
| 30 | 10.5 | 80.10 |
| 25 | 11.7 | 75.34 |
| 20 | 12.7 | 63.85 |
| 15 | 13.5 | 56.46 |
| 10 | 14.2 | 55.67 |
| 7 | 14.5 | 53.56 |
| 4 | 14.7 | 50.94 |
Table 3.
DUT sample information.
| Sample # | DUT | Board SN# | DUT Lot# | DUT SN# | Fabricated in |
|---|---|---|---|---|---|
| 1 | AD9361BBCZ | 00095 | #1350 | 2769606.1 | Singapore |
| 2 | AD9361BBCZ | 733353 | #1446 | 3014880.1 | Singapore |
Table 4.
SEU and MBU rate for DUT Sample 1.
| Energy | LET | Avg. Flux | Fluence | SEU | MBU | ||
|---|---|---|---|---|---|---|---|
| [MeV] | [MeV·cm·mg] | [#·cm·s] | [#·cm] | [#] | [cm] | [#] | [cm] |
| 184 | 3.83 × 10 | 9.11 × 10 | 1.00× 10 | 15 | 1.50 × 10 | 1 | 1.00 × 10 |
| 150 | 4.38 × 10 | 9.48 × 10 | 1.00 × 10 | 24 | 2.40 × 10 | 1 | 1.00 × 10 |
| 120 | 5.84 × 10 | 6.85 × 10 | 1.00 × 10 | 9 | 9.00 × 10 | 0 | 0 |
| 100 | 7.61 × 10 | 6.80 × 10 | 1.00 × 10 | 16 | 1.60 × 10 | 0 | 0 |
| 60 | 8.56 × 10 | 9.94 × 10 | 1.00 × 10 | 13 | 1.30 × 10 | 0 | 0 |
| 50 | 9.85 × 10 | 9.56 × 10 | 1.00 × 10 | 20 | 2.00 × 10 | 1 | 1.00 × 10 |
| 40 | 1.17 × 10 | 9.09 × 10 | 1.00 × 10 | 15 | 1.50 × 10 | 0 | 0 |
| 30 | 1.47 × 10 | 8.47 × 10 | 1.00 × 10 | 10 | 1.00 × 10 | 0 | 0 |
| 20 | 2.02 × 10 | 7.81 × 10 | 1.00 × 10 | 9 | 9.00 × 10 | 0 | 0 |
| 10 | 3.46 × 10 | 6.00 × 10 | 1.00 × 10 | 11 | 1.10 × 10 | 1 | 1.00 × 10 |
| 7 | 4.53 × 10 | 5.41 × 10 | 1.00 × 10 | 10 | 1.10 × 10 | 1 | 1.00 × 10 |
| 4 | 6.86 × 10 | 5.50 × 10 | 1.00 × 10 | 17 | 1.70 × 10 | 6 | 6.00 × 10 |
Table 5.
SEU and MBU rate for DUT Sample 2.
| Energy | LET | Avg. Flux | Fluence | SEU | MBU | ||
|---|---|---|---|---|---|---|---|
| [MeV] | [MeV·cm·mg] | [#·cm·s] | [#·cm] | [#] | [cm] | [#] | [cm] |
| 184 | 3.83 × 10 | 1.08 × 10 | 1.00 × 10 | 30 | 3.00 × 10 | 10 | 1.00 × 10 |
| 150 | 4.38 × 10 | 8.76 × 10 | 1.00 × 10 | 11 | 1.10 × 10 | 1 | 1.00 × 10 |
| 120 | 5.84 × 10 | 8.73 × 10 | 1.00 × 10 | 18 | 1.80 × 10 | 3 | 3.00 × 10 |
| 100 | 7.61 × 10 | 5.00 × 10 | 1.00 × 10 | 11 | 1.10 × 10 | 0 | 0 |
| 60 | 8.56 × 10 | 9.88 × 10 | 1.00 × 10 | 25 | 2.50 × 10 | 2 | 2.00 × 10 |
| 50 | 9.85 × 10 | 1.01 × 10 | 1.00 × 10 | 9 | 9.00 × 10 | 0 | 0 |
| 40 | 1.17 × 10 | 9.54 × 10 | 1.00 × 10 | 8 | 8.00 × 10 | 0 | 0 |
| 30 | 1.47 × 10 | 8.57 × 10 | 1.00 × 10 | 17 | 1.70 × 10 | 1 | 1.00 × 10 |
| 20 | 2.02 × 10 | 6.87 × 10 | 1.00 × 10 | 36 | 3.60 × 10 | 5 | 5.00 × 10 |
| 10 | 3.46 × 10 | 5.81 × 10 | 1.00 × 10 | 27 | 2.70 × 10 | 3 | 3.00 × 10 |
| 7 | 4.53 × 10 | 5.38 × 10 | 1.00 × 10 | 24 | 2.40 × 10 | 5 | 5.00 × 10 |
| 4 | 6.86 × 10 | 5.19 × 10 | 1.00 × 10 | 4 | 4.00 × 10 | 0 | 0 |
Table 6.
Proton energy deviation E at the DUT site.
| Energy | Degrader (Al) Thickness | E |
|---|---|---|
| [MeV] | [mm] | [MeV] |
| 184 | 0 | 0.58 |
| 150 | 31.5 | 0.90 |
| 120 | 55.6 | 1.00 |
| 100 | 69.5 | 1.18 |
| 60 | 0 | 0.44 |
| 50 | 4.0 | 0.57 |
| 40 | 7.5 | 0.66 |
| 30 | 10.5 | 0.77 |
| 20 | 12.7 | 0.90 |
| 10 | 14.2 | 1.2 |
| 7 | 14.5 | 1.3 |
| 4 | 14.7 | 1.4 |
Table 7.
Weibull function parameters for SEU and MBU event types based on the method.
| Sample No. | Type of Events | [] | [MeV] | W | S | |
|---|---|---|---|---|---|---|
| 1 | SEU | 1.70 × 10 | 4.0 | 8.91 | 0.24 | 2.81 × 10 |
| 2 | SEU | 2.40 × 10 | 4.0 | 0.21 | 0.01 | 4.94 × 10 |
| 1 | MBU | 1.00 × 10 | 4.0 | 0.39 | 0.01 | 0.60 × 10 |
| 2 | MBU | 2.00 × 10 | 7.0 | 9.91 | 2.01 | 1.59 × 10 |
Table 8.
Weibull function parameters for SEU and MBU event types based on the OMERE software algorithm.
Table 8.
Weibull function parameters for SEU and MBU event types based on the OMERE software algorithm.
| Sample No. | Type of Events | [] | [MeV] | W | S |
|---|---|---|---|---|---|
| 1 | SEU | 2.40 × 10 | 4.0 | 15.78 | 2.295 |
| 2 | SEU | 3.60 × 10 | 4.0 | 24.33 | 0.86 |
| 1 | MBU | 6.00 × 10 | 4.0 | 24.33 | 0.86 |
| 2 | MBU | 1.00 × 10 | 7.0 | 34.85 | 13.12 |
Table 9.
SEFI rate for DUT Sample 1.
| Energy | LET | Avg. Flux | Fluence | SEFI | SEFI | ||
|---|---|---|---|---|---|---|---|
| [MeV] | [MeV·cm·mg] | [#·cm·s] | [#·cm] | [#] | [cm] | [#] | [cm] |
| 184 | 3.83 × 10 | 9.11 × 10 | 1.00 × 10 | 0 | 0 | 0 | 0 |
| 150 | 4.38 × 10 | 9.48 × 10 | 1.00 × 10 | 1 | 1.00 × 10 | 0 | 0 |
| 120 | 5.84 × 10 | 6.85 × 10 | 1.00 × 10 | 0 | 0 | 1 | 1.00 × 10 |
| 100 | 7.61 × 10 | 6.80 × 10 | 1.00 × 10 | 1 | 1.00 × 10 | 0 | 0 |
| 60 | 8.56 × 10 | 9.94 × 10 | 1.00 × 10 | 1 | 1.00 × 10 | 0 | 0 |
| 50 | 9.85 × 10 | 9.56 × 10 | 1.00 × 10 | 2 | 2.00 × 10 | 0 | 0 |
| 40 | 1.17 × 10 | 9.09 × 10 | 1.00 × 10 | 2 | 2.00 × 10 | 1 | 1.00 × 10 |
| 30 | 1.47 × 10 | 8.47 × 10 | 1.00 × 10 | 0 | 0 | 0 | 0 |
| 20 | 2.02 × 10 | 7.81 × 10 | 1.00 × 10 | 0 | 0 | 0 | 0 |
| 10 | 3.46 × 10 | 6.00 × 10 | 1.00 × 10 | 2 | 2.00 × 10 | 0 | 0 |
| 7 | 4.53 × 10 | 5.41 × 10 | 1.00 × 10 | 1 | 1.00 × 10 | 0 | 0 |
| 4 | 6.86 × 10 | 5.50 × 10 | 1.00 × 10 | 1 | 1.00 × 10 | 0 | 0 |
Table 10.
SEFI rate for DUT Sample 2.
| Energy | LET | Avg. Flux | Fluence | SEFI | SEFI | ||
|---|---|---|---|---|---|---|---|
| [MeV] | [MeV·cm·mg] | [#·cm·s] | [#·cm] | [#] | [cm] | [#] | [cm] |
| 184 | 3.83 × 10 | 1.08 × 10 | 1.00 × 10 | 3 | 3.00 × 10 | 0 | 0 |
| 150 | 4.38 × 10 | 8.76 × 10 | 1.00 × 10 | 2 | 2.00 × 10 | 0 | 0 |
| 120 | 5.84 × 10 | 8.73 × 10 | 1.00 × 10 | 3 | 3.00 × 10 | 1 | 1.00 × 10 |
| 100 | 7.61 × 10 | 5.00 × 10 | 1.00 × 10 | 2 | 2.00 × 10 | 0 | 0 |
| 60 | 8.56 × 10 | 9.88 × 10 | 1.00 × 10 | 0 | 0 | 0 | 0 |
| 50 | 9.85 × 10 | 1.01 × 10 | 1.00 × 10 | 3 | 3.00 × 10 | 0 | 0 |
| 40 | 1.17 × 10 | 9.54 × 10 | 1.00 × 10 | 3 | 3.00 × 10 | 0 | 0 |
| 30 | 1.47 × 10 | 8.57 × 10 | 1.00 × 10 | 1 | 1.00 × 10 | 0 | 0 |
| 20 | 2.02 × 10 | 6.87 × 10 | 1.00 × 10 | 6 | 6.00 × 10 | 0 | 0 |
| 10 | 3.46 × 10 | 5.81 × 10 | 1.00 × 10 | 1 | 1.00 × 10 | 0 | 0 |
| 7 | 4.53 × 10 | 5.38 × 10 | 1.00 × 10 | 0 | 0 | 0 | 0 |
| 4 | 6.86 × 10 | 5.19 × 10 | 1.00 × 10 | 0 | 0 | 0 | 0 |
Table 11.
Weibull function parameters for event type based on the method.
| Sample No. | Type of Events | [] | [MeV] | W | S | |
|---|---|---|---|---|---|---|
| 1 | 1.99 × 10 | 4.0 | 7.01 | 0.01 | 0.21 × 10 | |
| 2 | 3.00 × 10 | 10.0 | 1.41 | 0.11 | 0.56 × 10 |
Table 12.
Weibull function parameters for event type fit by the OMERE software algorithm.
| Sample No. | Type of Events | [] | [MeV] | W | S |
|---|---|---|---|---|---|
| 1 | 2.00 × 10 | 4.0 | 58.40 | 0.87 | |
| 2 | 6.00 × 10 | 10.0 | 58.40 | 0.87 |
Table 13.
SEU event rates for considered reference missions.
| Reference Mission | Proton Flux [] | SEU Rate [Failure/Device/Year] |
|---|---|---|
| 400 km, Min, | 17 | 0.19 |
| 400 km, Max, | 7 | 0.08 |
| 400 km, Min, ISS, | 31 | 0.35 |
| 400 km, Max, ISS, | 10 | 0.11 |
| 800 km, Min, | 243 | 2.76 |
| 800 km, Max, | 190 | 2.16 |
| 800 km, Min, | 388 | 4.40 |
| 800 km, Max, | 301 | 3.42 |
| 800 km, | 50 | 0.57 |
| GCR | 1 | 0.01 |
Table 14.
MBU and event rates for considered reference missions.
| Reference Mission | Proton Flux | MBU and Rate |
|---|---|---|
| [] | [Failure/Device/Year] | |
| 400 km, Min, | 17 | 0.03 |
| 400 km, Max, | 7 | 0.01 |
| 400 km, Min, ISS, | 31 | 0.06 |
| 400 km, Max, ISS, | 10 | 0.02 |
| 800 km, Min, | 243 | 0.46 |
| 800 km, Max, | 190 | 0.36 |
| 800 km, Min, | 388 | 0.73 |
| 800 km, Max, | 301 | 0.57 |
| 800 km, | 50 | 0.09 |
| GCR | 1 | 0.002 |
Table 15.
event rates for considered reference missions.
| Reference Mission | Proton Flux [] | Rate [Failure/Device/Year] |
|---|---|---|
| 400 km, Min, | 7 | 0.002 |
| 400 km, Max, | 4 | 0.001 |
| 400 km, Min, ISS, | 10 | 0.003 |
| 400 km, Max, ISS, | 6 | 0.002 |
| 800 km, Min, | 104 | 0.032 |
| 800 km, Max, | 86 | 0.027 |
| 800 km, Min, | 149 | 0.047 |
| 800 km, Max, | 123 | 0.039 |
| 800 km, | 40 | 0.013 |
| GCR | 1 | 0.0003 |
© 2019 by the authors. Licensee MDPI, Basel, Switzerland. This article is an open access article distributed under the terms and conditions of the Creative Commons Attribution (CC BY) license (http://creativecommons.org/licenses/by/4.0/).
Share and Cite
MDPI and ACS Style
Budroweit, J.; Jaksch, M.P.; Sznajder, M. Proton Induced Single Event Effect Characterization on a Highly Integrated RF-Transceiver. Electronics 2019, 8, 519. https://doi.org/10.3390/electronics8050519
AMA Style
Budroweit J, Jaksch MP, Sznajder M. Proton Induced Single Event Effect Characterization on a Highly Integrated RF-Transceiver. Electronics. 2019; 8(5):519. https://doi.org/10.3390/electronics8050519
Chicago/Turabian StyleBudroweit, Jan, Mattis Paul Jaksch, and Maciej Sznajder. 2019. "Proton Induced Single Event Effect Characterization on a Highly Integrated RF-Transceiver" Electronics 8, no. 5: 519. https://doi.org/10.3390/electronics8050519
Note that from the first issue of 2016, this journal uses article numbers instead of page numbers. See further details here.