Lower-Limb Electromyography Signal Analysis of Distinct Muscle Fitness Norms under Graded Exercise Intensity

1
Department of Automatic Control Engineering, Feng Chia University, Taichung 40724, Taiwan
2
Office of Physical Education and Sports Affairs, Feng Chia University, Taichung 40724, Taiwan
3
Center for Quality Management, Taichung Veterans General Hospital, Taichung 40705, Taiwan
*
Author to whom correspondence should be addressed.
Electronics 2020, 9(12), 2147; https://doi.org/10.3390/electronics9122147
Submission received: 12 November 2020
/
Revised: 11 December 2020
/
Accepted: 11 December 2020
/
Published: 15 December 2020
(This article belongs to the Special Issue Application of Electronic Devices on Intelligent System)
Abstract
:Physical fitness is the overall ability of the body to adapt to the working environment and perform sporting and daily activities. The aim of this study was to analyze the correlation between muscle fitness and the electromyography (EMG) signals of lower limbs under varying exercise intensity. The standing long jump was used as a test task for assessing the power of the lower limb muscles. Participants were university freshmen who belonged to the top 20%, middle 20%, and bottom 20% groups in terms of physical fitness norms. The EMG signals of the participants’ lower limbs while they performed squats were collected under four exercise intensities of repetitions maximum (RM): no load, 8RM, 18RM, and 28RM; the features of the signals were extracted using time-domain and frequency-domain analysis. Statistical analysis was also performed. The top and bottom groups exhibited significant differences time-domain indicators mean absolute value (MAV) and average amplitude change (AAC) in the low-intensity exercise (28RM). The MAV, variance of EMG (VAR), root mean square (RMS), and AAC were significantly different between the top and bottom groups in the three graded intensities (8RM, 18RM, and 28RM). The mean frequency (MNF) and median frequency (MDF), which are frequency-domain indicators, were significantly different between the top and bottom groups in the low-intensity (28RM) and moderate-intensity (18RM) exercises.
1. Introduction
Physical fitness is a state of health and well-being and, more specifically, it is the ability to perform aspects of sporting and daily activities. Physical fitness is generally achieved through proper nutrition, moderate to vigorous physical exercise, and sufficient rest. Percentile norms for physical fitness tests have recently been employed for the assessment of physical fitness. A repetition maximum (RM) is the most weight you can lift for a defined number of exercise movements. Repetition maximum is often expressed as 1RM, which indicates the heaviest weight you can lift with maximum effort in a single repetition, which is also your personal weightlifting record for a squat or any other weightlifting exercise. For example, an 8RM would be the heaviest weight you could lift for eight consecutive exercise repetitions. The same principle of 18RM and 28RM are the heaviest weights you can perform 18 and 28 repetitive exercises, respectively.
Electromyography (EMG) is an electrodiagnostic medical technique for evaluating and recording the electrical activity produced by skeletal muscles [1,2]. EMG is performed using an electromyograph, which produces a record called an electromyogram. Then, the signals are analyzed to detect medical abnormalities, the activation level, or the muscle recruitment patterns. The signals can also be used to analyze the biomechanics of human or animal movement [3,4]. Many factors affect the collection of EMG signal, including extrinsic factors and intrinsic factors [5,6]. Extrinsic factors are those that can be influenced by the experimenter, such as the distance between electrodes; electrode placement with respect to the motor points in the muscle, the lateral edge of the muscle, and the orientation to the muscle fibers; skin preparation; impedance; and temperature. Intrinsic factors include physiological, anatomical, and biochemical characteristics of the muscle, such as the number of active motor units, fiber composition of the muscle, blood flow in the muscle, muscle fiber, EMG electrode placement, and the amount of tissue between the surface of the muscle and the electrode. Since many factors influence EMG signals, the voltage level recorded from a muscle is difficult to describe without a reference value to which it can be compared. Therefore, a normalization procedure must be performed to aid interpretation of the amplitude of the raw EMG signal. Although many methods for normalizing EMG signals have been proposed, there is no consensus as to which method is the most appropriate. The use of raw EMG data for limited comparisons is generally acceptable if data collection is performed under constant temperature and humidity conditions and within a short period of time. For frequency analysis, the power spectrum of the EMG signal is obtained by applying a fast Fourier transform to the EMG signal. Since the shape of the power spectrum is important, the amplitude of the EMG signal is not critical, and therefore, EMG normalization is not required [7]. The EMG signals must be normalized when comparing the EMG activity of the same muscle on different days or in different individuals or comparing the EMG activity between different muscles. EMG signals are usually normalized by dividing the EMG signals obtained from a muscle during a task by a reference EMG value obtained from the same muscle. The most common normalized EMG signals are “maximum activation levels during maximum contractions” and peak or mean activation levels obtained during the task under investigation [8,9].
Previously, studies on muscular power and muscle endurance were mainly conducted using EMG signals collected during jumping and weightlifting. EMG signals contain considerable information, such as that on muscle contraction, the intention of movement, and fatigue [10,11,12,13,14,15,16]. Bilodeau et al. [10] proposed the effect of gender on changes in EMG signal characteristics of the quadriceps muscles, such as root mean square (RMS), mean power frequency (MPF), and median frequency (MDF) with increasing force and with fatigue. Yamada et al. [12] evaluated the neuromuscular adaptation that occurred with aging by comparing young and aged subjects with respect to changes in surface EMG from the tibialis anterior muscle during fatiguing contractions. Moritani et al. [13] indicated that both MPF and RMS of the EMG fell significantly together with a progressive reduction in during sustained maximal voluntary contraction (MVC). Sarker et al. [14] explored the cumulative effects of multiple bouts of an isometric fatiguing exertion when inter-bout rest periods were provided. Crenshaw et al. [15] investigated changes in intramuscular pressure and EMG parameters (MPF, RMS) during contractions to fatigue at 25 and 70% of maximal voluntary contraction (MVC). Oliveira et al. [16] evaluated the effect of a resistance training program based on the electromyographic fatigue threshold (defined as the highest exercise intensity performed without EMG alterations), on the EMG amplitude (RMS) and frequency (MDF) values. Therefore, time-domain analysis, frequency-domain analysis, and time–frequency analysis of EMG signals can be used to effectively understand muscle contraction. In this study, EMG signals collected from the lower limbs of university freshmen with various levels of muscular fitness were analyzed; the time-domain and frequency-domain analyses of features were performed for different exercise intensities and fatigue periods.
The organization of this paper is as follows: Section 2 describes the experiments, signal acquisition, and data analysis process. Section 3 presents the detailed statistical analysis results of EMG features in the proposed experiments. Section 4 addresses limitations of the study and provides a detailed discussion compared with related research results. Finally, the contribution of this research will be summarized in Section 5.
2. Materials and Methods
Figure 1 shows a flowchart of the experiment undertaken in this study. The experiment involved participants (three groups), exercises (no load, 8RM, 18RM, and 28RM), force plate experiments (no load, 8RM, 18RM, and 28RM), EMG signal acquisition, and data analysis (signal and statistic). Each subject performed the exercise experiment and force plate experiment at no load, 8RM, 18RM, and 28RM activity levels on a Smith machine. After each exercise, the participant was given 3 min of rest. The exercise experiment and force plate experiment included the following steps:
- Step 1:
- The procedure, functioning of the equipment, and purpose of the experiments were explained to the participants.
- Step 2:
- No load experiment—The participants were asked to squat on the Smith machine without bearing any load, during which EMG signals were collected. Then, resistance was added until they could no longer perform the lift. The participants were asked to give maximum effort when lifting the barbell on the force plate while EMG signals and force plate signals were collected.
- Step 3:
- 1RM experiment—An initial weight that was within the subject’s perceived capacity (50% of capacity) was selected. Resistance was gradually increased by 2.5 kg to 20 kg until the subject was unable to complete the selected repetition(s). All repetitions were to be performed at the same speed of movement and range of motion.
- Step 4:
- 8RM experiment—The participants were asked to squat with 8RM on the Smith machine, during which EMG signals were collected. Then, the resistance was increased until they could no longer perform the lift.
- Step 5:
- 18RM experiment—The participants were asked to squat with 18RM on the Smith machine, during which EMG signals were collected. Then, the resistance was increased until they could no longer perform the lift. They were asked to give maximum effort when lifting the barbell on the force plate while EMG signals and force plate signals were collected.
- Step 6:
- 28RM experiment—The participants were asked to squat with 28RM on the Smith machine, during which EMG signals were collected. Then, the resistance was increased until they could no longer perform the lift. They were asked to give maximum effort when lifting the barbell on the force plate while EMG signals and force plate signals were collected.
Force plate are tools used for the measurement of ground reaction forces during walking, jumping, or any other type of movement. In this study, the force plate (Vernier FP BTA) was used to measure the force changes of the quadriceps in the force plate experiment. The participants’ EMG signals were collected using a Vernier EKG Sensor (EKG-BTA) and were collected using LabQuest 2 on an NI ELVIS II engineering laboratory workstation. The signal processing unit and analyzed in a MATLAB environment.
2.1. Subjects and Ethical Approval
The current study conformed to the standards set by the latest revision of the Declaration of Helsinki with the approval from the Research Ethics Committee of the National Changhua University of Education (Taiwan, NCUEREC-104-073). Feng Chia University (Taichung, Taiwan) 2017 freshmen, as was illustrated in Table 1, were recruited for this study on the basis of their muscular power fitness in the standing long jump. The subjects were categorized into 3 groups, which were in the best 20% (top group: 10 participants); in the middle 20% (middle group: 11 participants); and in the lowest 20% (bottom group: 8 participants).
2.2. Exercise Intensities
Exercise intensity refers to how hard the body works during physical activity. Exercise intensity was defined as 8RM, 18RM, or 28RM, which were calculated using the estimated exercise intensity percentage of the 1RM, as expressed in Equation (1) [17].
where RM is the repetitions maximum, W is the barbell load, and R is the number of repetitions.
- Heavy load experiment (8RM) ≈ 80%HRmax
- Moderate load experiment (18RM) ≈ 55%HRmax
- Light load experiment (28RM) ≈ 30%HRmax
2.3. Normalized EMG
The EMG obtained during the task (which was performed with maximum effort) under investigation was taken as the normalization value to minimize the possibility of obtaining normalized EMG levels greater than 100%.
2.4. EMG Features
Two methods were employed to investigate the EMG signals: time-domain analysis and frequency-domain analysis. The time-domain features were the mean absolute value (MAV), variance of EMG (VAR), root mean square (RMS), and average amplitude change (AAC). The frequency-domain features were the median frequency (MDF) and mean frequency (MNF).
- The MAV was used for determining the level of muscle contraction.
- The VAR expresses the power of the EMG signal as a useable feature.
- The RMS is related to the constant force and nonfatiguing contractions of the muscles.
- The AAC is intuitively the cumulative length of the waveform over a segment.
- The mean frequency (MNF) is the average frequency, which is calculated as the sum of the product of the EMG power spectrum and the frequency divided by the total sum of the spectrum intensity.
- The median frequency (MDF) is the frequency at which the spectrum is divided into two regions with equal amplitude.
2.5. Statistical Analysis
Continuous variables are described as mean ± standard deviation (SD). Analysis of variance was conducted using SPSS to compare the three groups, and post hoc Scheffé’s test was used for multiple comparison analysis with p = 0.05 as the significance level.
3. Results
3.1. Results of Exercise Experiment
Table 2 and Figure 2 show the results of MAV, VAR, RMS, AAC, MNF, and MDF and statistical analysis in no load, 8RM, 18RM, and 28RM exercise experiment. As seen in the upper left panel of Figure 2, the mean MAV exhibited a similar pattern for all groups (T > M > B) in all exercise experiments. No significant MAV differences were discovered between the groups in the no load, 8RM, and 18RM exercise experiments; however, significant differences were found between all groups in the 28RM exercise experiment (p = 0.018). As seen in the upper right panel of Figure 2, the mean VAR exhibited a similar pattern for all groups (T > M > B) in all exercise experiments. No significant VAR differences were found between any groups in the no load, 8RM, 18RM, and 28RM exercise experiments. As shown by the left middle panel of Figure 2, the mean RMS exhibited a similar pattern for all groups (T > M > B) in all exercise experiments. No significant RMS differences were discovered between any groups in the no load, 8RM, 18RM, and 28RM exercise experiments. The right middle panel of Figure 2 indicates that the mean AAC exhibited a similar pattern for all groups (T > M > B) in all exercise experiments. No significant AAC differences were obtained between any groups in the no load, 8RM, and 18RM exercise experiments; however, a significant intergroup difference was found in the 28RM exercise experiment (p = 0.021). As indicated in the lower left panel of Figure 2, the mean MNF differed between groups in all exercise experiments. No significant MNF differences were found between the groups in the no load, 8RM, 18RM, and 28RM exercise experiments. The lower right panel of Figure 2 shows that the mean MDF differed between groups in all exercise experiments. No significant differences were discovered between any groups in the 8RM, 18RM, and 28RM exercise experiments; however, a significant difference was performed in the no load exercise experiment (p = 0.039).
3.2. Results of Force Plate Experiment
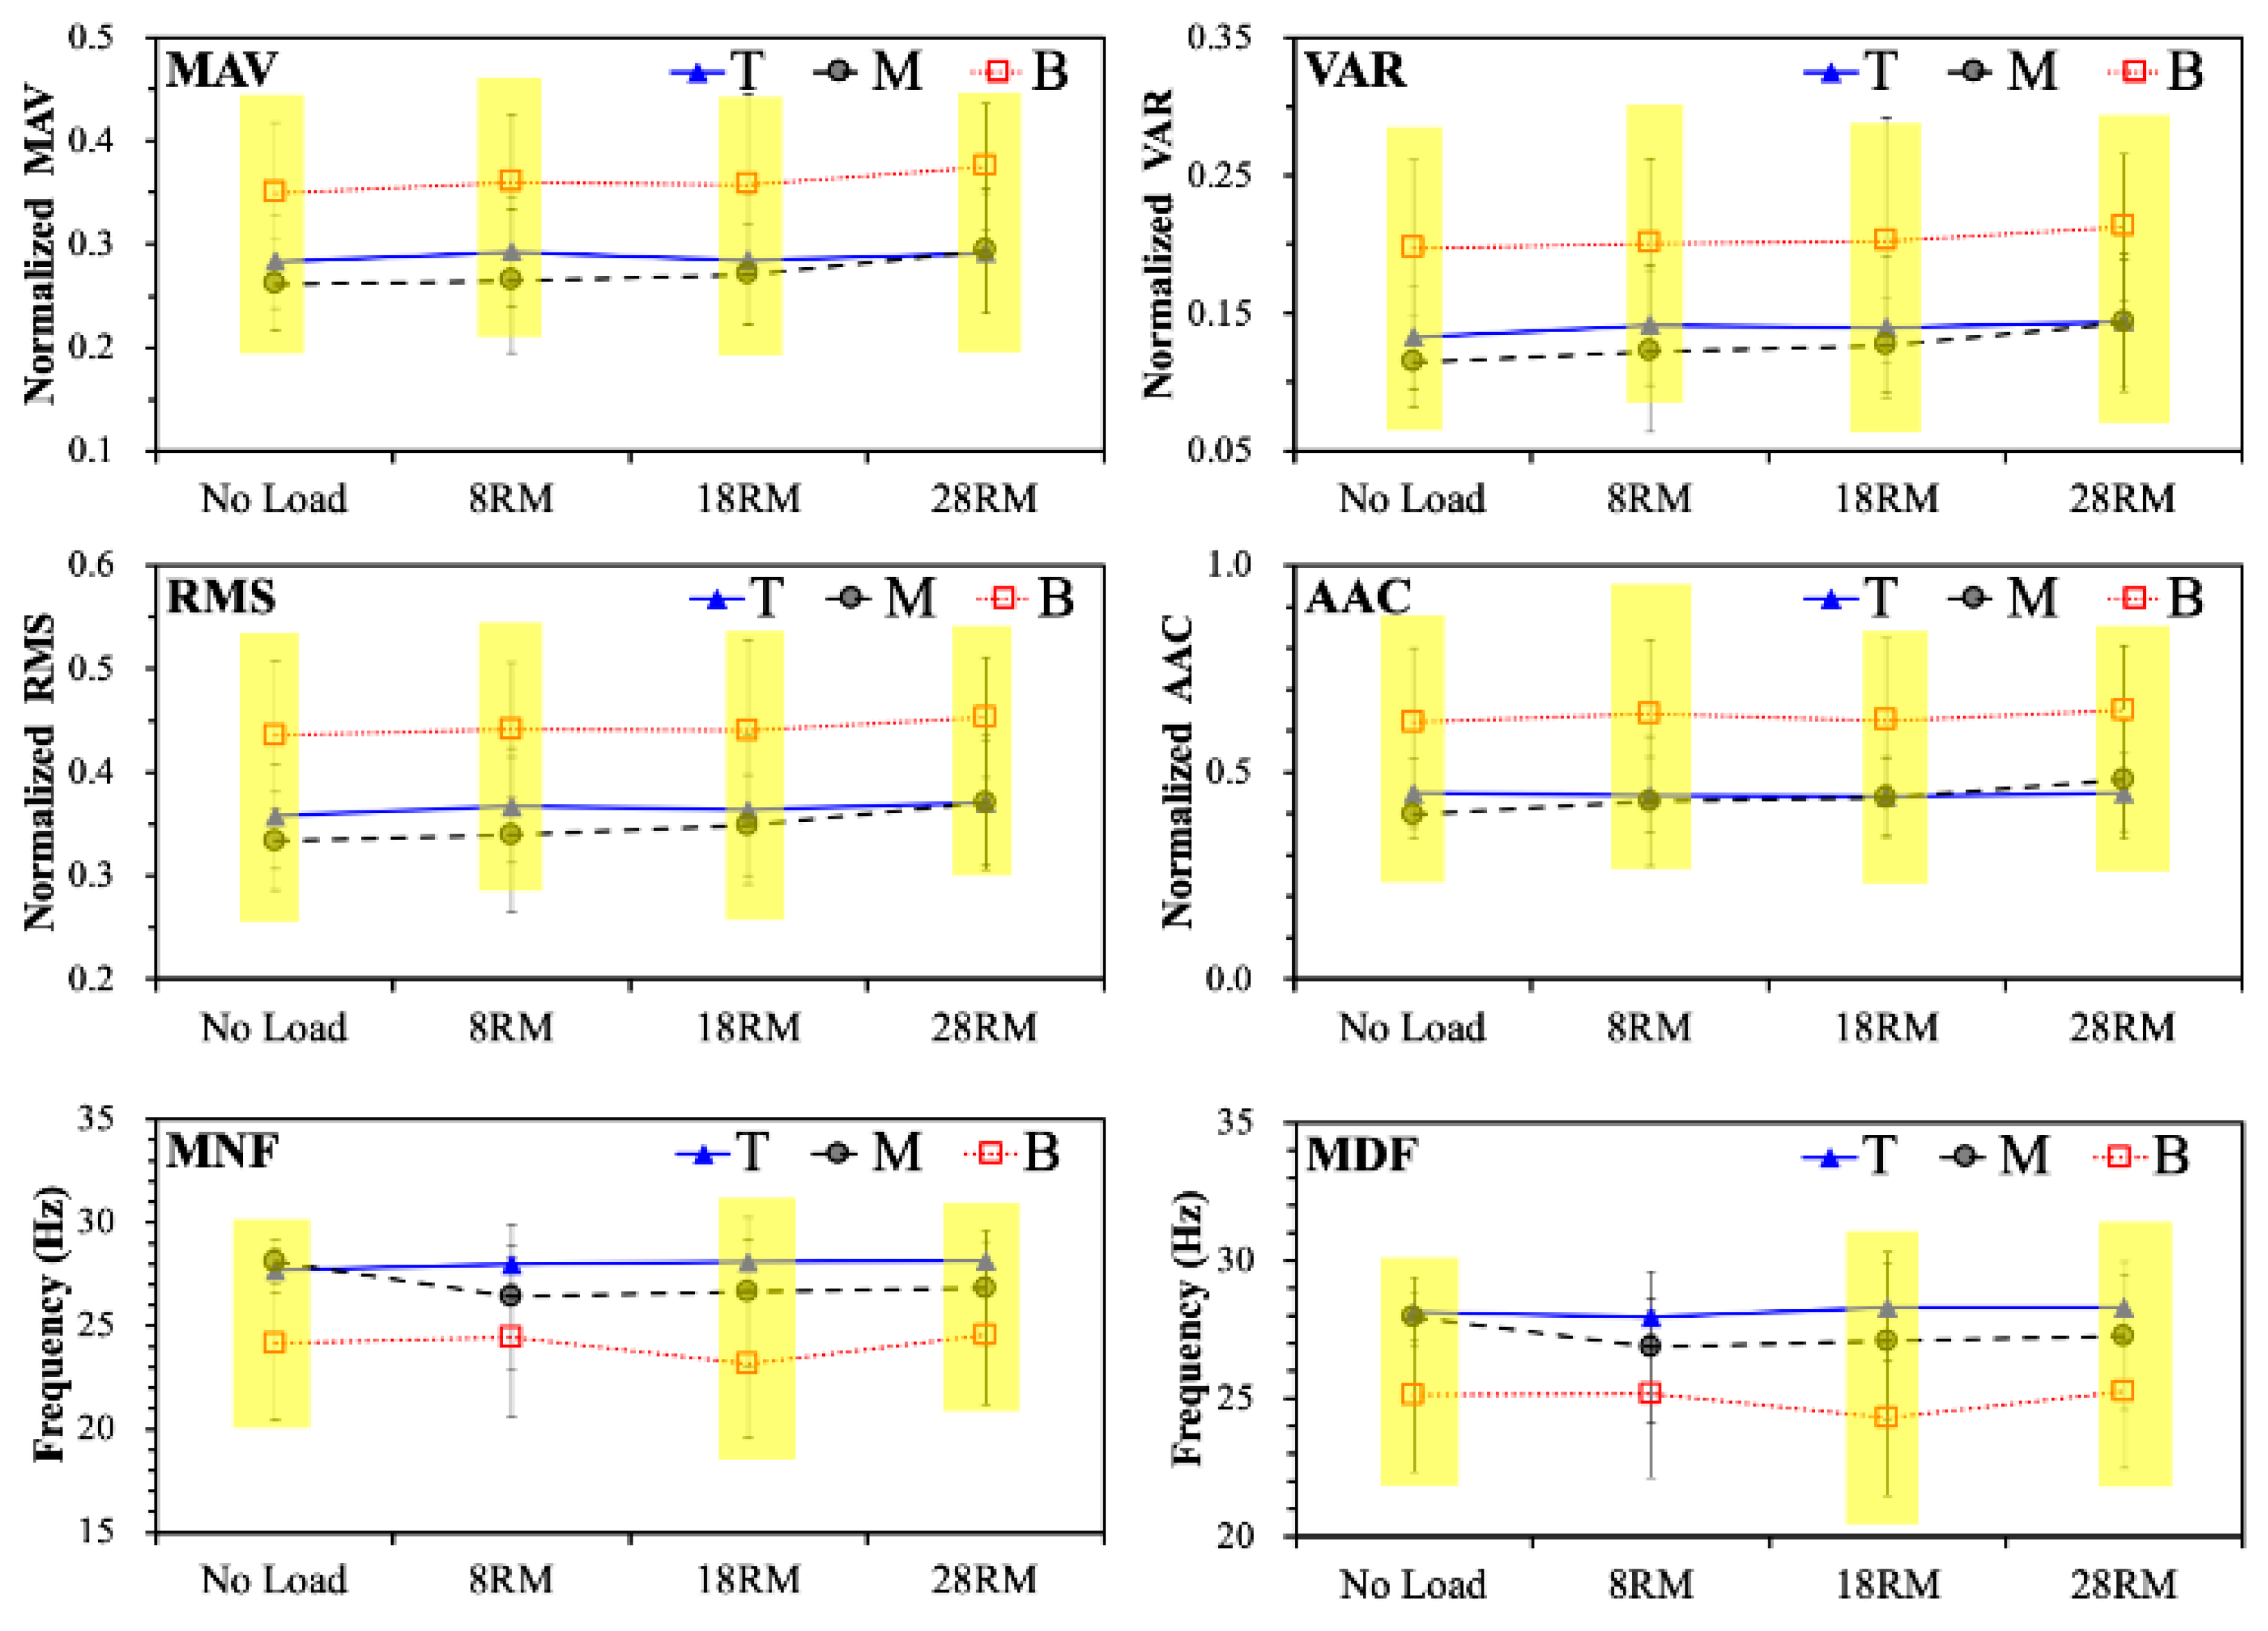
Table 3 and Figure 3 show the MAV, VAR, RMS, AAC, MNF, MDF, and statistical analysis results obtained for the no load, 8RM, 18RM, and 28RM force plate experiments. As shown in the upper left panel of Figure 3, the mean MAV exhibited a similar pattern for all groups (B > T > M) in all force plate experiments except the 28RM force plate experiment (M > T). Significant MAV differences were discovered between all groups in all force plate experiments (no load: p = 0.006; 8RM: 0.017; 18RM: 0.031; 28RM: 0.016). As seen in the upper right panel of Figure 3, the mean VAR exhibited a similar pattern for all groups (B > T > M) in all force plate experiments except for the 28RM force plate experiment (M > T). Significant VAR differences were found between all groups in all force plate experiments (no load: p = 0.003; 8RM: 0.022; 18RM: 0.038; 28RM: 0.014). The left middle panel of Figure 3 indicates that the mean RMS exhibited a similar pattern for all groups (B > T > M) in all force plate experiments except for the 28RM force plate experiment (M > T). Significant RMS differences were obtained between all groups in all force plate experiments (no load: p = 0.003; 8RM: 0.014; 18RM: 0.032; 28RM: 0.019). As revealed in the right middle panel of Figure 3, the mean AAC exhibited a similar pattern for all groups (B > T > M) in all force plate experiments except the 28RM force plate experiment (M > T). Significant AAC differences were discovered between all groups in all force plate experiments (no load: p = 0.002; 8RM: 0.012; 18RM: 0.013; 28RM: 0.014). The lower left panel of Figure 3 shows that the mean MNF exhibited a similar pattern for all groups (T > M > B) in all force plate experiments except the no load force plate experiment, (M > T). No significant MNF differences were found between any groups in the 8RM exercise experiment; however, significant differences were obtained in the no load, 18RM, and 28RM force plate experiments (no load: p = 0.002; 18RM: 0.009; 28RM: 0.026). As shown in the lower right panel of Figure 3, the mean MDF exhibited a similar pattern for all groups (T > M > B) in all force plate experiments. No significant MDF differences were found between the groups in the 8RM exercise experiment; however, significant differences were identified in the no load, 18RM, and 28RM force plate experiments (no load: p = 0.003; 18RM: 0.015; 28RM: 0.043).
4. Discussion
The empirical results reported herein should be considered in the light of some limitations. The first is the participants were recruited freshmen in Feng Chia University, Taichung, Taiwan (enrolled in 2017). Their muscular power fitness was measured in the standing long jump, and they were grouped according to the best 20%, middle 20%, and lowest 20%, respectively. However, it is not possible to confirm the physical condition of the participants and whether they performed the test as best as possible. The second limitation is that the number of participants is very limited and unable to represent all youth groups.
Bilodeau et al. [10] found that the RMS value was significantly lower for women than men, who had a higher MVC than women, while the MPF and MDF values for men who had a higher MVC were lower than those for women. These results may reflect the relatively small difference in fiber composition/size between men and women for the quadriceps muscle complex. In the no load, 8RM, 18RM, and 28RM exercise experiments of this study, the time-domain features MAV, VAR, RMS, and AAC of the T group were higher than those of the M and B groups, and the MAV, VAR, RMS, and AAC values of the M group were higher than those of the B group. However, no significant differences were found between any two groups except in 28RM. No significant differences were discovered in the frequency-domain features MNF and MDF between any two groups, and there were no apparent trends. Most of the time-domain and frequency-domain features are not statistically significant in the exercise experiment of this study, and it is speculated that they may be affected by the rest time [18].
The RMS value increase during sustained MVC [10,13]. In other words, the EMG amplitude increases continually during constant-force voluntary isometric contractions. Since the slope of the EMG signal amplitude of unfit individuals was higher than the slope of the EMG signal amplitude of fit individuals [16], the MAV, VAR, RMS, and AAC values obtained for the T and M groups in the force plate experiment were lower than those obtained for the B group. However, the frequency features of EMG signals continually decrease during sustained MVC [12,13,14,15], while the MNF and MDF values obtained for the T group in the force plate experiment were higher than those obtained for the B group. Nonetheless, these results with the limitations should be kept in mind.
5. Conclusions
For three university freshmen groups with distinct levels of physical fitness, time-domain and frequency-domain analyses were performed based on EMGs recorded in exercise and force plate experiments under different exercise intensities (no load, 8RM, 18RM, and 28RM). The results show that the time domain indicators MAV and AAC have significant differences between the top and bottom groups in 28RM of exercise experiments, and it should be inferred that people with better muscle power will have larger MAV and AAC characteristic values in low-intensity exercise. The MAV, VAR, RMS, and AAC are significantly different between the top and bottom groups in all graded intensities of force plate experiments, and it should be inferred that people with better muscle power will have smaller time-domain characteristic values. The frequency domain indicators MNF and MDF have significant differences between the top and bottom groups in no load, 28RM, and 18RM exercise of force plate experiment, and it should be inferred people with better muscle power will have larger frequency domain characteristic values in low-intensity and moderate-intensity exercise.
Author Contributions
Conceptualization, C.-K.C. and S.-L.L.; Data curation, T.-C.W.; Formal analysis, C.-K.C., S.-L.L. and Y.-J.L.; Methodology, C.-K.C. and S.-L.L.; Project administration, C.-K.C.; Resources, T.-C.W.; Software, Y.-J.L.; Supervision, C.-K.C., S.-L.L., and C.-L.W.; Validation, C.-L.W.; Visualization, Y.-J.L.; Writing—original draft, C.-K.C.; All authors have read and agreed to the published version of the manuscript.
Funding
This research received no external funding.
Acknowledgments
This study was supported by the Ministry of Science and Technology (MOST 105-2221-E-035-095-MY2), Taiwan.
Conflicts of Interest
The authors declare no conflict of interest.
References
- Toledo-Pérez, D.C.; Martínez-Prado, M.-A.; Gómez-Loenzo, R.A.; Paredes-García, W.J.; Rodríguez-Reséndiz, J. A study of movement classification of the lower limb based on up to 4-EMG channels. Electronics 2019, 8, 259. [Google Scholar] [CrossRef] [Green Version]
- Schimmack, M.; Hand, A.; Mercorelli, P.; Georgiadis, A. Using a seminorm for wavelet denoising of sEMG signals for monitoring during rehabilitation with embedded orthosis system. In Proceedings of the 2015 IEEE International Symposium on Medical Measurements and Applications (MeMeA), Turin, Italy, 7–9 May 2015; pp. 467–472. [Google Scholar]
- Slater, L.V.; Hart, J.M. Muscle activation patterns during different squat techniques. J. Strength Cond. Res. 2017, 31, 667–676. [Google Scholar] [CrossRef] [PubMed]
- Valentin, S.; Zsoldos, R.R. Surface electromyography in animal biomechanics: A systematic review. J. Electromyogr. Kinesiol. 2016, 28, 167–183. [Google Scholar] [CrossRef] [PubMed] [Green Version]
- Cram, J.R.; Rommen, D. Effects of skin preparation on data collected using an EMG muscle-scanning procedure. Biofeedback Self-Regul. 1989, 14, 75–82. [Google Scholar] [CrossRef] [PubMed]
- Cram, J.R.; Lloyd, J.; Cahn, T.S. The reliability of EMG muscle scanning. Int. J. Psychosom. 1994, 41, 41–45. [Google Scholar] [PubMed]
- Altın, C.; Er, O. Comparison of different time and frequency domain feature extraction methods on elbow gesture’s EMG. Eur. J. Interdiscip. 2016, 2, 35–44. [Google Scholar] [CrossRef] [Green Version]
- Chuang, T.D.; Acker, S.M. Comparing functional dynamic normalization methods to maximal voluntary isometric contractions for lower limb EMG from walking, cycling and running. J. Electromyogr. Kinesiol. 2019, 44, 86–93. [Google Scholar] [CrossRef] [PubMed] [Green Version]
- Tabard-Fougère, A.; Rose-Dulcina, K.; Pittet, V.; Dayer, R.O.P.; Vuillerme, N.; Armand, S. EMG normalization method based on grade 3 of manual muscle testing: Within- and between-day reliability of normalization tasks and application to gait analysis. Gait Posture 2018, 60, 6–12. [Google Scholar] [CrossRef] [PubMed]
- Bilodeau, M.; Schindler-Ivens, S.; Williams, D.; Chandran, R.; Sharma, S. EMG frequency content changes with increasing force and during fatigue in the quadriceps femoris muscle of men and women. J. Electromyogr. Kinesiol. 2003, 13, 83–92. [Google Scholar] [CrossRef]
- Watanabe, K.; Kouzaki, M.; Ogawa, M.; Akima, H.; Moritani, T. Relationships between muscle strength and multi-channel surface EMG parameters in eighty-eight elderly. Eur. Rev. Aging Phys. Act. 2018, 15, 3. [Google Scholar] [CrossRef] [PubMed] [Green Version]
- Yamada, H.; Okada, M.; Oda, T.; Nemoto, S.; Shiozaki, T.; Kizuka, T.; Kuno, S.; Masuda, T. Effects of aging on EMG variables during fatiguing isometric contractions. J. Hum. Ergol. 2000, 29, 7–14. [Google Scholar]
- Moritani, T.; Muro, M.; Nagata, A. Intramuscular and surface electromyogram changes during muscle fatigue. J. Appl. Physiol. 1986, 60, 1179–1185. [Google Scholar] [CrossRef] [PubMed]
- Sarker, P.; Mirka, G.A. The effects of repetitive bouts of a fatiguing exertion (with breaks) on the slope of EMG measures of localized muscle fatigue. J. Electromyogr. Kinesiol. 2020, 51, 1179–1185. [Google Scholar] [CrossRef] [PubMed]
- Crenshaw, A.; Karlsson, S.; Gerdle, B.; Fridén, J. Differential responses in intramuscular pressure and EMG fatigue indicators during low- vs. high-level isometric contractions to fatigue. Acta Physiol. Scand. 1997, 160, 353–361. [Google Scholar] [CrossRef] [PubMed]
- Oliveira, A.S.; Gonçalves, M. EMG amplitude and frequency parameters of muscular activity: Effect of resistance training based on electromyographic fatigue threshold. J. Electromyogr. Kinesiol. 2009, 19, 295–303. [Google Scholar] [CrossRef] [PubMed]
- Mayhew, J.L.; Ware, J.R.; Prinster, J.L. Test & measurement: Using lift repetitions to predict muscular strength in adolescent males. Natl. Strength Cond. Assoc. J. 1993, 15, 35–38. [Google Scholar] [CrossRef]
- Willardson, J.M.; Burkett, L.N. The effect of rest interval length on bench press performance with heavy vs. light load. J. Strength Cond. Res. 2006, 20, 396–399. [Google Scholar] [CrossRef] [PubMed]
Figure 1.
Schematic illustration of experiments, signal acquisition, and data analysis process.
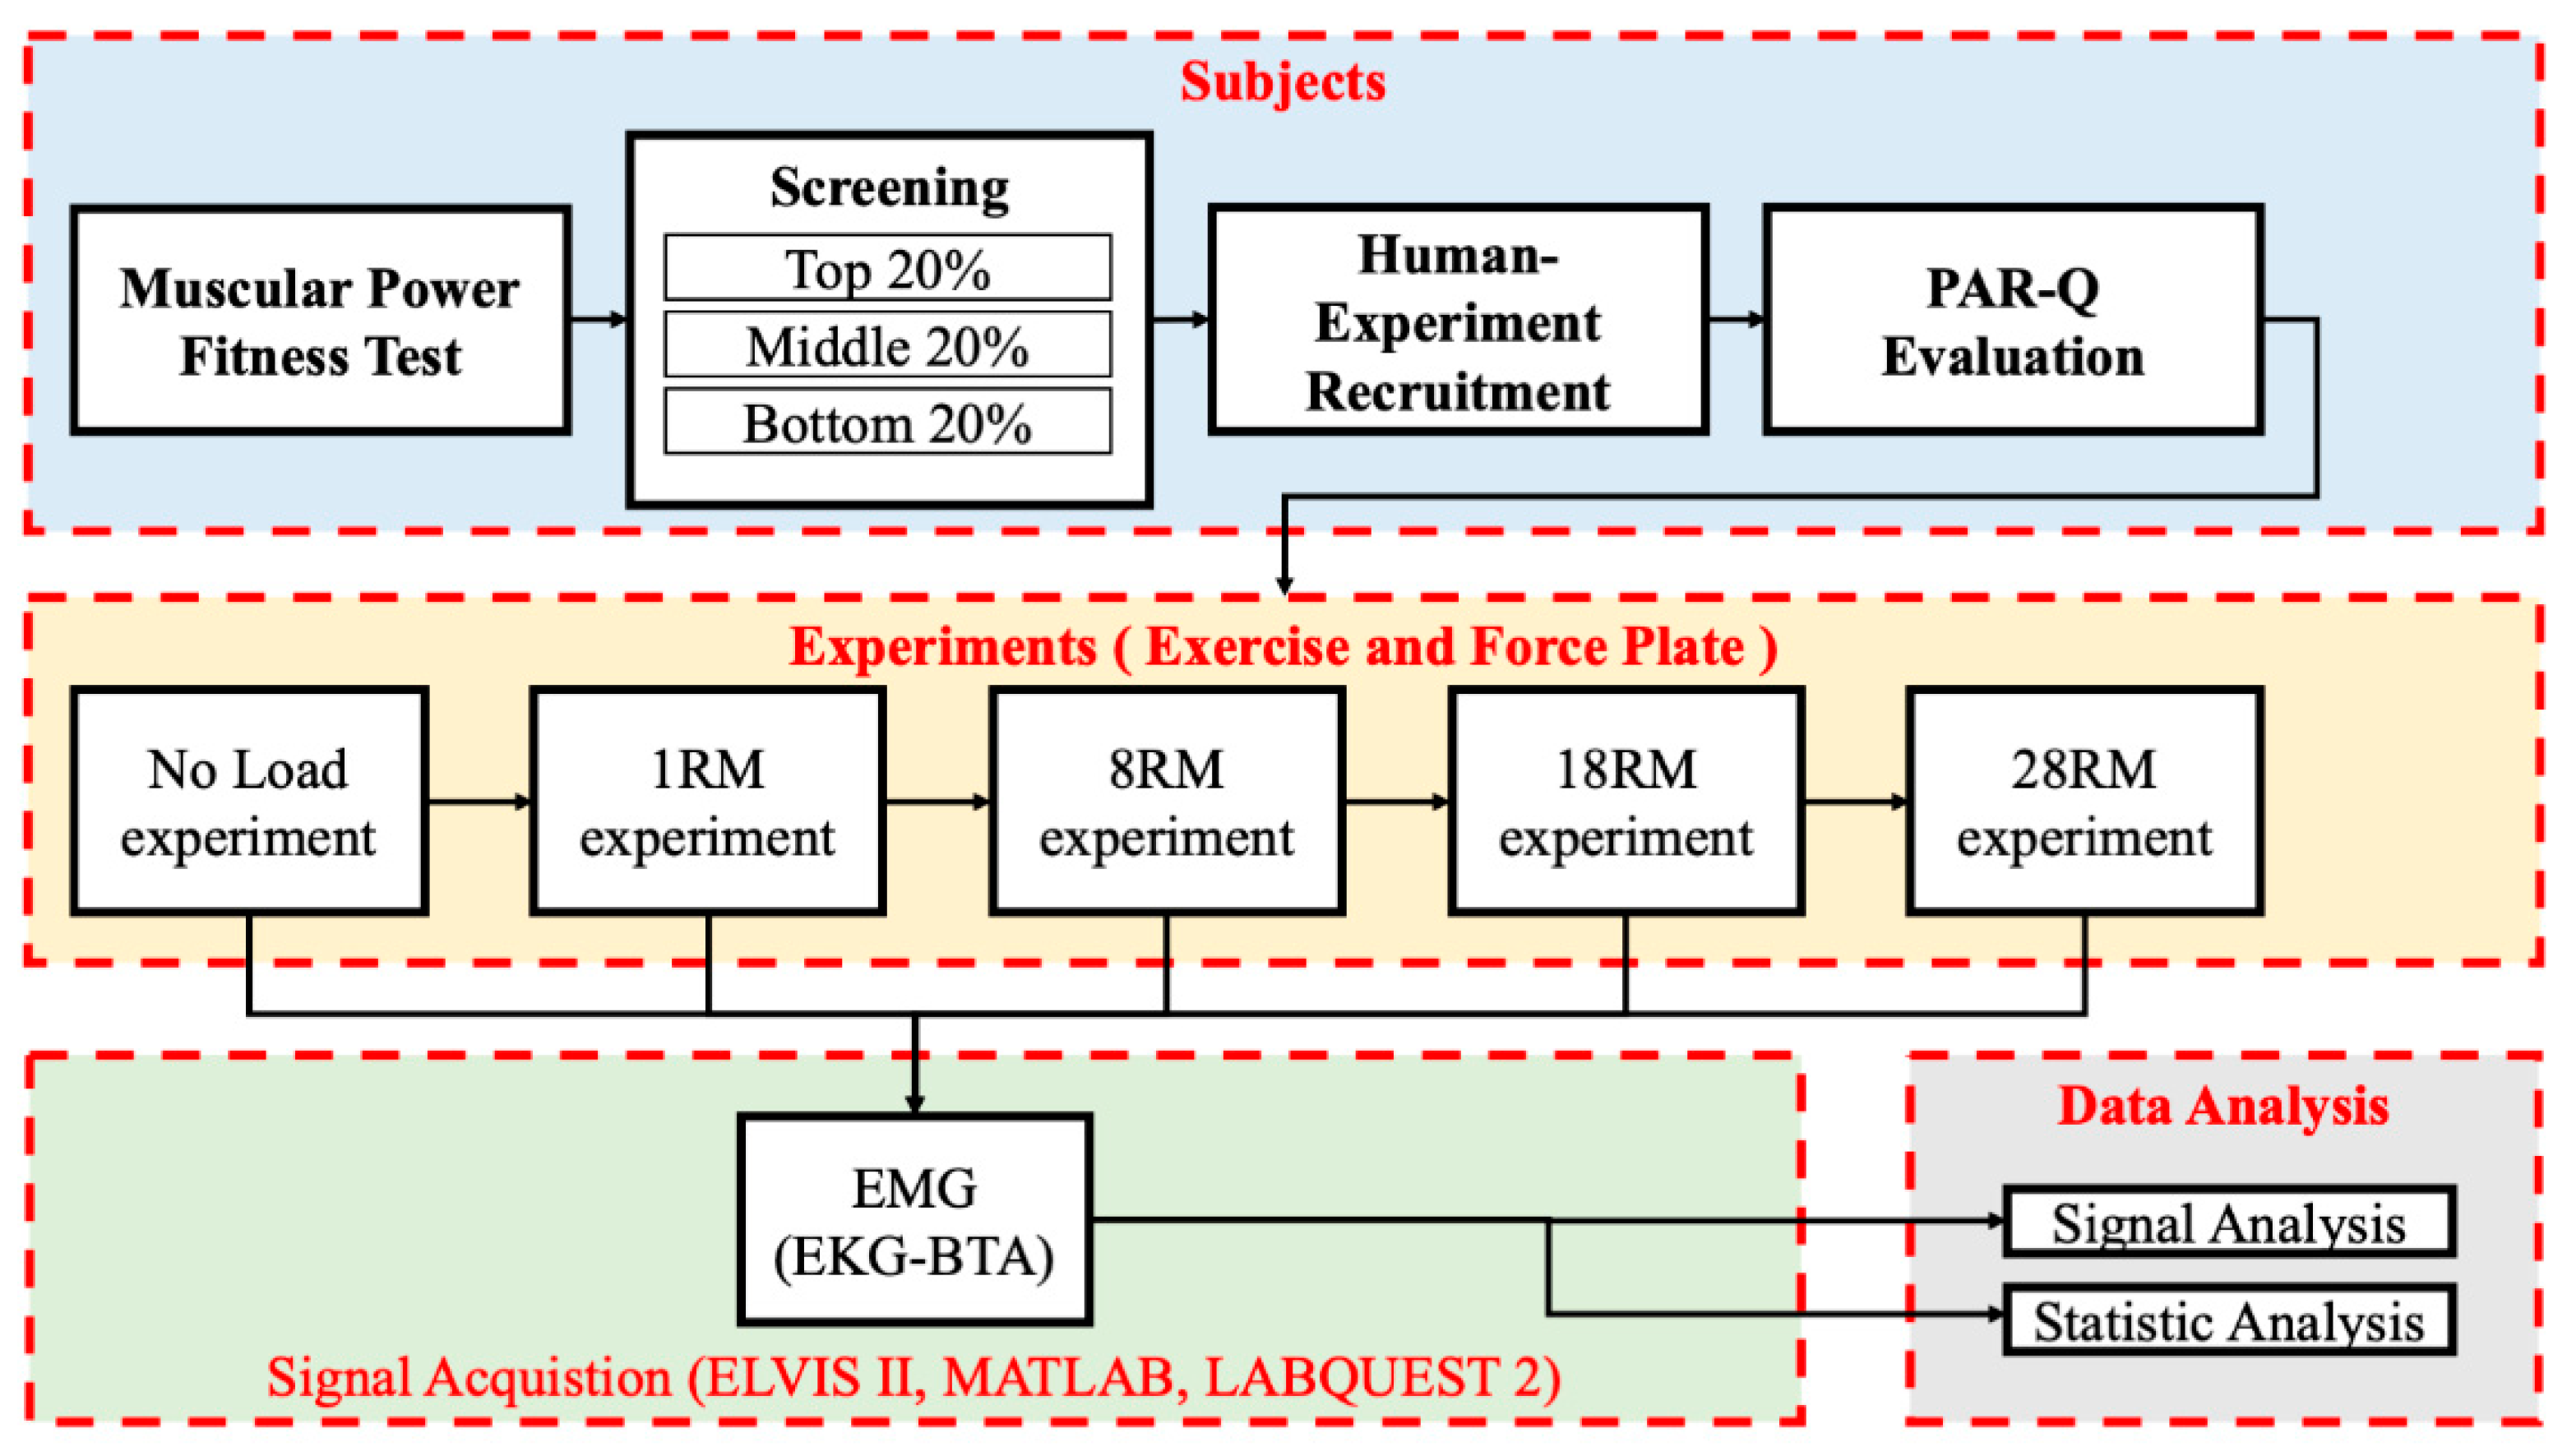
Figure 2.
Average EMG measures of time domain and frequency parameters for the three groups of participants at no load, 8RM, 18RM, and 28RM exercise experiments. (Yellow background indicates significant differences).
Figure 2.
Average EMG measures of time domain and frequency parameters for the three groups of participants at no load, 8RM, 18RM, and 28RM exercise experiments. (Yellow background indicates significant differences).
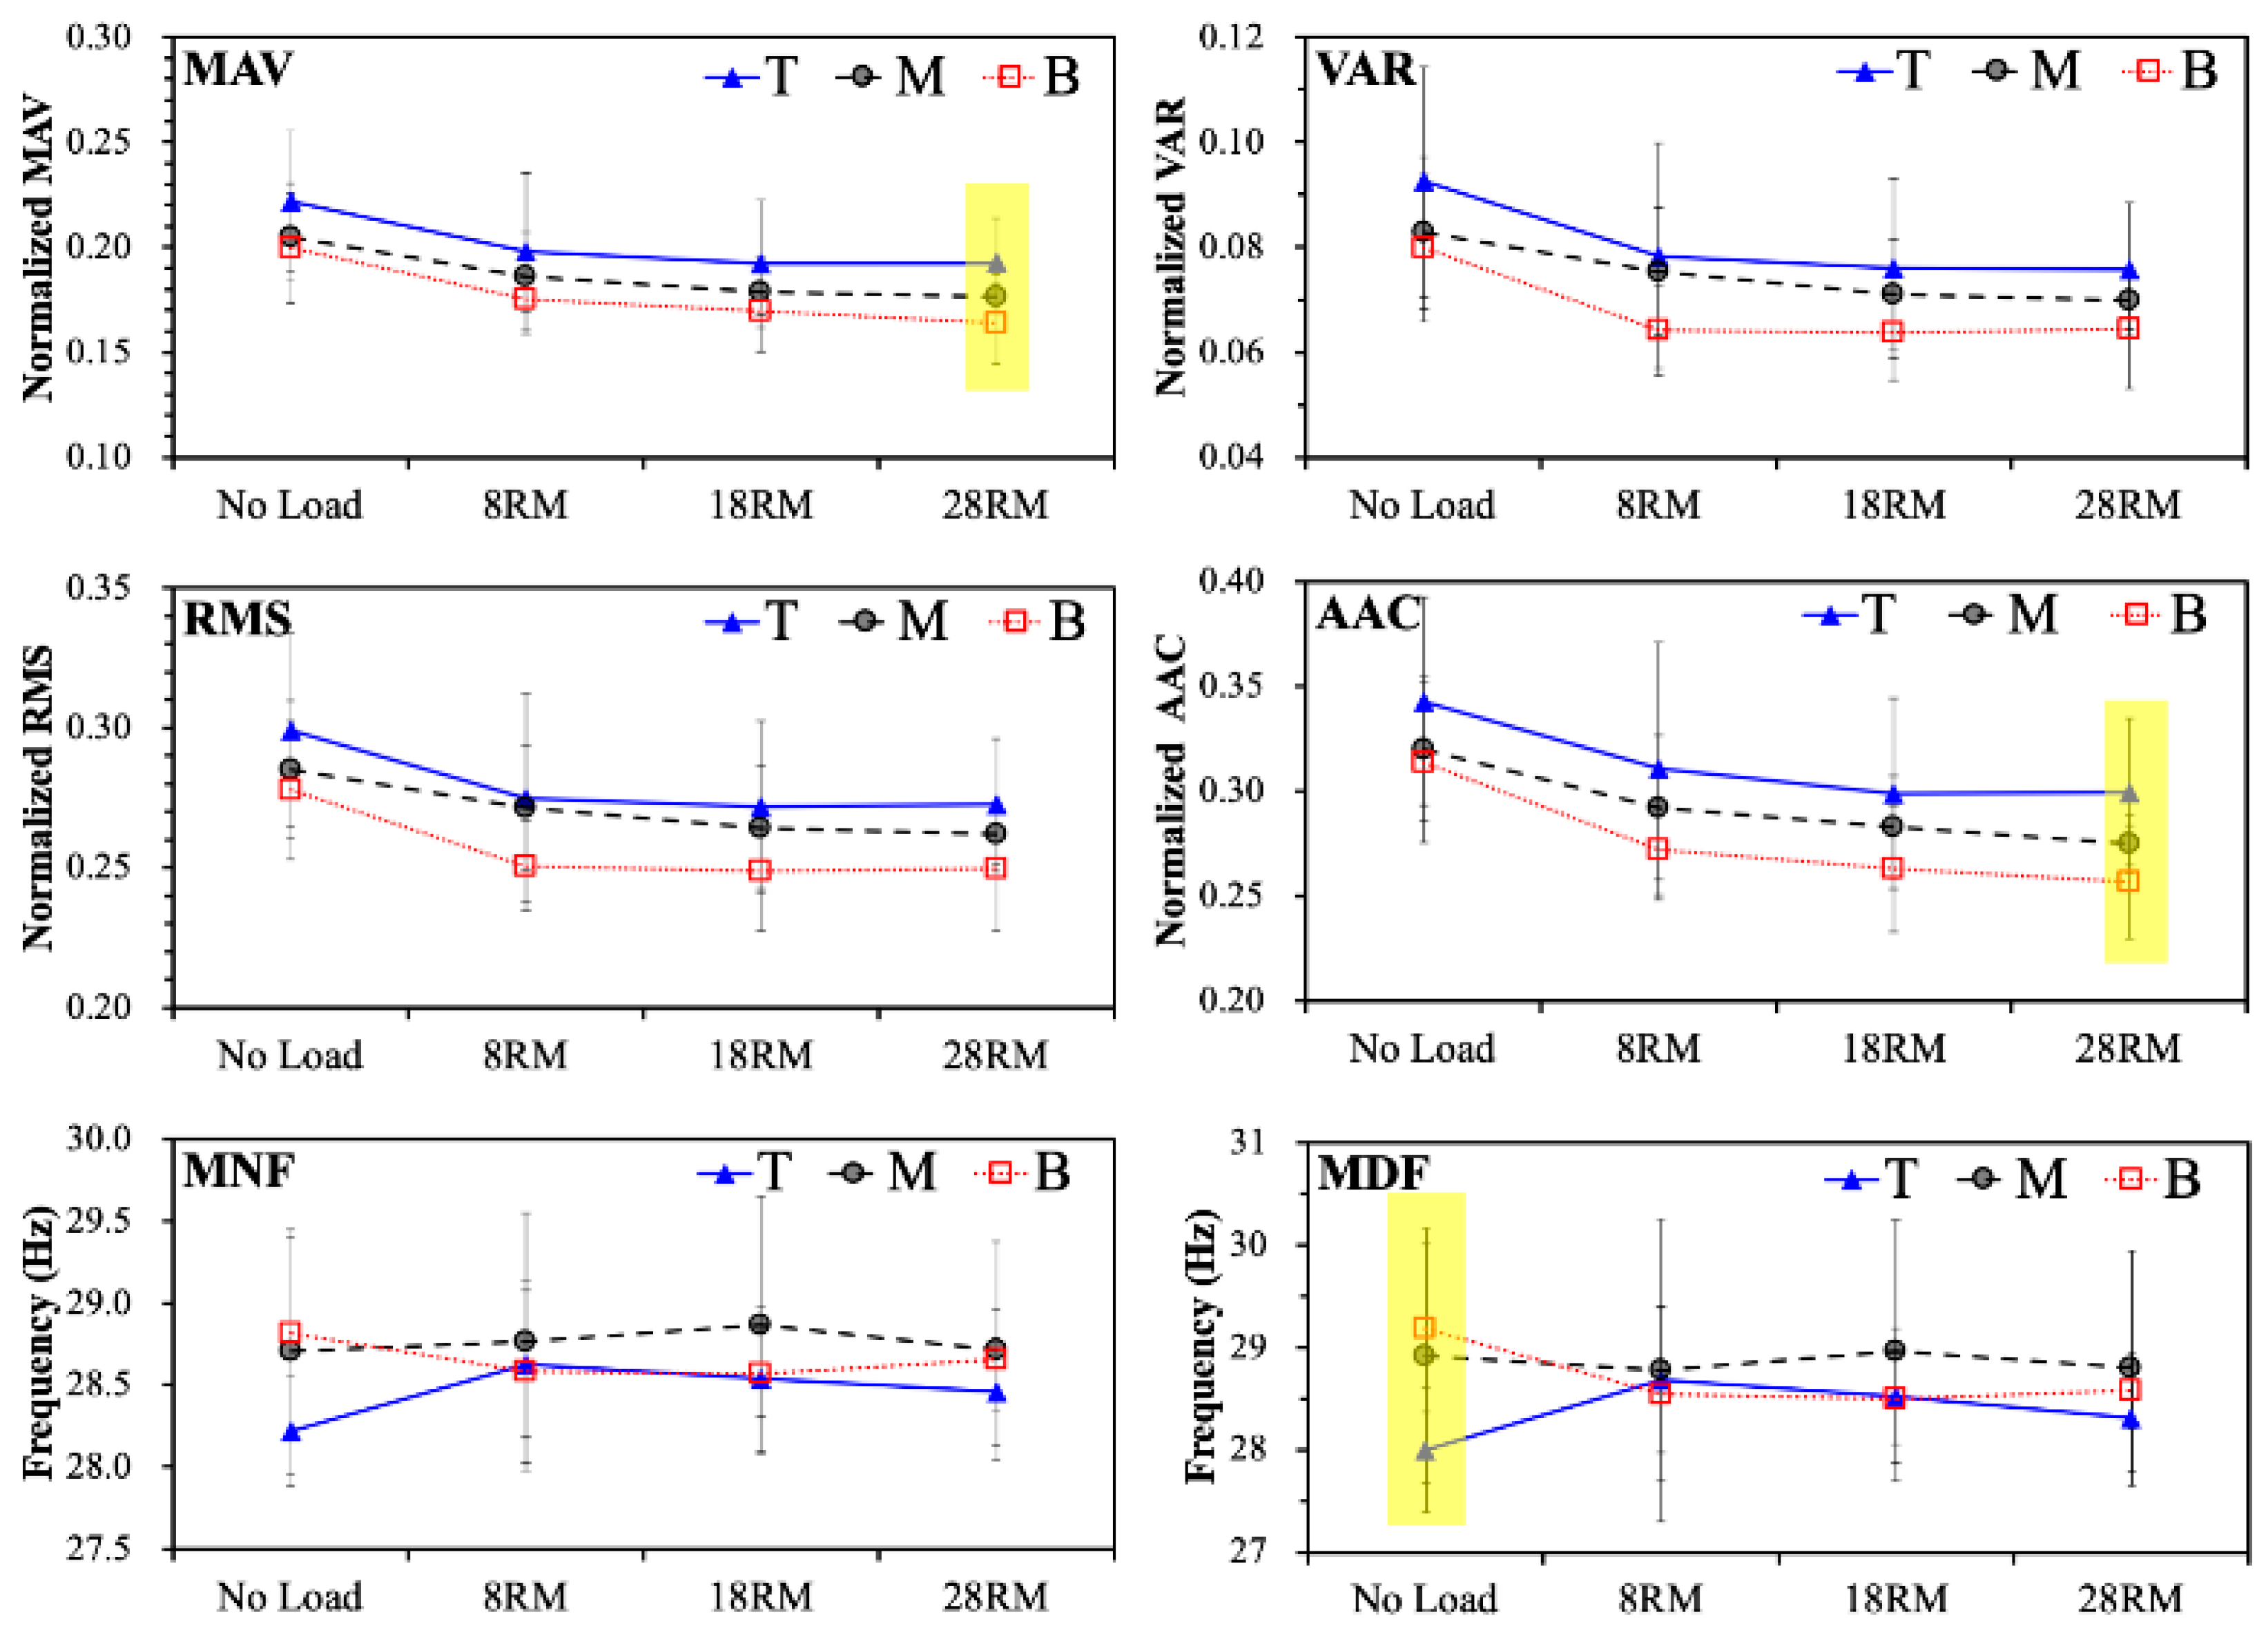
Figure 3.
Average EMG measures of time domain and frequency parameters for the three groups of participants at no load, 8RM, 18RM, and 28RM force plate experiments. (Yellow background indicates significant differences)
Figure 3.
Average EMG measures of time domain and frequency parameters for the three groups of participants at no load, 8RM, 18RM, and 28RM force plate experiments. (Yellow background indicates significant differences)


Table 1.
Basic information of participants.
| Fitness Norms | ||||
|---|---|---|---|---|
| Top 20% | Middle 20% | Bottom 20% | p | |
| n | 10 | 11 | 8 | |
| Height (cm) | 173.3 ± 2.7 | 170.7 ± 8.3 | 166.8 ± 9.2. | 0.223 |
| Weight (kg) | 64.3 ± 8.2 | 62.8 ± 8.2 | 69.1 ± 16.9 | 0.528 |
| BMI | 21.4 ± 2.5 | 21.6 ± 2.5 | 24.7 ± 4.9 | 0.277 |
| 1RM (kg) | 76.20 ± 7.36 | 69.82 ± 9.93 | 63.63 ± 7.95 | 0.024 * |
| Standing long jump (cm) | 259.4 ± 12.7 | 227.1 ± 4.4 | 186.9 ± 13.2 | 0.000 * |
* Significant distinctiveness (p < 0.05).
Table 2.
Statistical analysis of electromyography (EMG) features in exercise experiment (mean ± SD).
Table 2.
Statistical analysis of electromyography (EMG) features in exercise experiment (mean ± SD).
| Features | Fitness Norms | Intensities of Weight-Bearing Squats | ||||
|---|---|---|---|---|---|---|
| No Load | 8RM | 18RM | 28RM | |||
| Time-domain Index | MAV (mV) | T | 0.222 ± 0.033 | 0.198 ± 0.037 | 0.192 ± 0.030 | 0.193 ± 0.021 |
| M | 0.205 ± 0.026 | 0.186 ± 0.021 | 0.179 ± 0.016 | 0.176 ± 0.011 | ||
| B | 0.199 ± 0.026 | 0.175 ± 0.016 | 0.169 ± 0.019 | 0.164 ± 0.019 | ||
| p | 0.27 | 0.283 | 0.21 | 0.018 * | ||
| VAR (mV) | T | 0.093 ± 0.022 | 0.078 ± 0.022 | 0.076 ± 0.017 | 0.076 ± 0.013 | |
| M | 0.083 ± 0.015 | 0.075 ± 0.012 | 0.071 ± 0.011 | 0.069 ± 0.006 | ||
| B | 0.080 ± 0.014 | 0.064 ± 0.009 | 0.064 ± 0.009 | 0.064 ± 0.011 | ||
| p | 0.315 | 0.22 | 0.258 | 0.139 | ||
| RMS (mV) | T | 0.299 ± 0.035 | 0.275 ± 0.037 | 0.272 ± 0.031 | 0.273 ± 0.024 | |
| M | 0.285 ± 0.025 | 0.271 ± 0.022 | 0.264 ± 0.022 | 0.262 ± 0.011 | ||
| B | 0.278 ± 0.025 | 0.251 ± 0.016 | 0.249 ± 0.021 | 0.249 ± 0.022 | ||
| p | 0.317 | 0.22 | 0.277 | 0.12 | ||
| AAC (mV) | T | 0.343 ± 0.049 | 0.311 ± 0.060 | 0.299 ± 0.045 | 0.299 ± 0.035 | |
| M | 0.320 ± 0.034 | 0.292 ± 0.035 | 0.283 ± 0.024 | 0.275 ± 0.014 | ||
| B | 0.313 ± 0.038 | 0.272 ± 0.023 | 0.263 ± 0.030 | 0.257 ± 0.027 | ||
| p | 0.323 | 0.259 | 0.203 | 0.021 * | ||
| Frequency-domain Index | MNF (Hz) | T | 28.22 ± 0.34 | 28.63 ± 0.45 | 28.54 ± 0.44 | 28.46 ± 0.33 |
| M | 28.70 ± 0.75 | 28.77 ± 0.78 | 28.87 ± 0.78 | 28.71 ± 0.67 | ||
| B | 28.81 ± 0.59 | 28.58 ± 0.56 | 28.57 ± 0.26 | 28.65 ± 0.31 | ||
| p | 0.108 | 0.823 | 0.444 | 0.535 | ||
| MDF (Hz) | T | 28.00 ± 0.60 | 28.68 ± 0.71 | 28.52 ± 0.66 | 28.30 ± 0.52 | |
| M | 28.91 ± 1.24 | 28.78 ± 1.48 | 28.96 ± 1.28 | 28.79 ± 1.15 | ||
| B | 29.19 ± 0.82 | 28.54 ± 0.85 | 28.50 ± 0.45 | 28.58 ± 0.37 | ||
| p | 0.039 * | 0.914 | 0.523 | 0.452 | ||
* Significant distinctiveness (p < 0.05).
Table 3.
Statistical analysis of EMG features in force plate experiment (Mean ± SD).
| Features | Fitness Norms | Intensities of Weight-Bearing Squats | ||||
|---|---|---|---|---|---|---|
| No Load | 8RM | 18RM | 28RM | |||
| Time-domain Index | MAV (mV) | T | 0.283 ± 0.044 | 0.292 ± 0.052 | 0.285 ± 0.063 | 0.292 ± 0.058 |
| M | 0.261 ± 0.043 | 0.265 ± 0.069 | 0.271 ± 0.049 | 0.294 ± 0.061 | ||
| B | 0.349 ± 0.069 | 0.359 ± 0.067 | 0.358 ± 0.088 | 0.375 ± 0.062 | ||
| p | 0.006 * | 0.017 * | 0.031 * | 0.016 * | ||
| VAR (mV) | T | 0.132 ± 0.037 | 0.141 ± 0.044 | 0.139 ± 0.051 | 0.143 ± 0.050 | |
| M | 0.115 ± 0.033 | 0.122 ± 0.059 | 0.126 ± 0.034 | 0.143 ± 0.047 | ||
| B | 0.197 ± 0.065 | 0.200 ± 0.062 | 0.203 ± 0.089 | 0.213 ± 0.054 | ||
| p | 0.003 * | 0.022 * | 0.038 * | 0.014 * | ||
| RMS (mV) | T | 0.358 ± 0.051 | 0.368 ± 0.055 | 0.364 ± 0.071 | 0.371 ± 0.065 | |
| M | 0.334 ± 0.047 | 0.339 ± 0.075 | 0.349 ± 0.049 | 0.371 ± 0.061 | ||
| B | 0.436 ± 0.071 | 0.441 ± 0.065 | 0.439 ± 0.088 | 0.453 ± 0.058 | ||
| p | 0.003 * | 0.014 * | 0.032 * | 0.019 * | ||
| AAC (mV) | T | 0.450 ± 0.084 | 0.445 ± 0.091 | 0.442 ± 0.094 | 0.451 ± 0.094 | |
| M | 0.399 ± 0.059 | 0.431 ± 0.156 | 0.439 ± 0.095 | 0.482 ± 0.142 | ||
| B | 0.620 ± 0.181 | 0.642 ± 0.177 | 0.625 ± 0.198 | 0.649 ± 0.156 | ||
| p | 0.002 * | 0.012 * | 0.013 * | 0.014 * | ||
| Frequency-domain Index | MNF (Hz) | T | 27.67 ± 1.07 | 28.00 ± 0.93 | 28.12 ± 1.01 | 28.18 ± 0.90 |
| M | 28.09 ± 1.03 | 26.41 ± 3.46 | 26.65 ± 3.58 | 26.83 ± 2.76 | ||
| B | 24.13 ± 3.71 | 24.46 ± 3.83 | 23.19 ± 3.64 | 24.55 ± 3.35 | ||
| p | 0.002 * | 0.079 | 0.009 * | 0.026 * | ||
| MDF (Hz) | T | 28.14 ± 1.26 | 27.97 ± 0.64 | 28.33 ± 1.96 | 28.30 ± 1.17 | |
| M | 27.97 ± 0.89 | 26.86 ± 2.74 | 27.10 ± 2.83 | 27.28 ± 2.67 | ||
| B | 25.13 ± 2.79 | 25.17 ± 3.03 | 24.32 ± 2.83 | 25.26 ± 2.76 | ||
| p | 0.003 * | 0.077 | 0.015 * | 0.043 * | ||
* Significant distinctiveness (p < 0.05).
Publisher’s Note: MDPI stays neutral with regard to jurisdictional claims in published maps and institutional affiliations. |
© 2020 by the authors. Licensee MDPI, Basel, Switzerland. This article is an open access article distributed under the terms and conditions of the Creative Commons Attribution (CC BY) license (http://creativecommons.org/licenses/by/4.0/).
Share and Cite
MDPI and ACS Style
Chen, C.-K.; Lin, S.-L.; Wang, T.-C.; Lin, Y.-J.; Wu, C.-L. Lower-Limb Electromyography Signal Analysis of Distinct Muscle Fitness Norms under Graded Exercise Intensity. Electronics 2020, 9, 2147. https://doi.org/10.3390/electronics9122147
AMA Style
Chen C-K, Lin S-L, Wang T-C, Lin Y-J, Wu C-L. Lower-Limb Electromyography Signal Analysis of Distinct Muscle Fitness Norms under Graded Exercise Intensity. Electronics. 2020; 9(12):2147. https://doi.org/10.3390/electronics9122147
Chicago/Turabian StyleChen, Ching-Kun, Shyan-Lung Lin, Tasi-Chu Wang, Yu-Jie Lin, and Chieh-Liang Wu. 2020. "Lower-Limb Electromyography Signal Analysis of Distinct Muscle Fitness Norms under Graded Exercise Intensity" Electronics 9, no. 12: 2147. https://doi.org/10.3390/electronics9122147
Note that from the first issue of 2016, this journal uses article numbers instead of page numbers. See further details here.