1. Introduction
Traffic demand is increasing significantly in satellite communication systems. Very High Throughput Satellites (VHTS) are usually geostationary satellite systems that will be able to meet traffic demand in the upcoming years [
1,
2,
3]. In this sense, VHTS systems exceed the capacity of traditional FSS and MSS systems (Fixed and Mobile Satellite Services, respectively) with contoured regional footprints and aspire to achieve 1 Terabit/s per satellite in the near future [
4]. Indeed, VHTS has been claimed either by users, satellite operators, or manufacturers to play a key role in future 5G networks as a complement to terrestrial networks [
5,
6].
VHTS systems are based on the following technical considerations to achieve expected performance and overcome atmospheric attenuations in Ka-band satellite links: multibeam footprint in the service area, the reuse of frequency and polarization [
4,
7], the use of highly spectral efficient transmission techniques (e.g., DVB-S2X) and, advanced link adaptation strategies, such as Variable and Adaptive Coding and Modulation (VCM and ACM, respectively) [
8]. From a system design perspective, the use of link adaptation techniques is motivated by the need to select the most appropriate modulation and coding scheme to meet the link budget conditions and availability requirements of each user terminal in the service area. A worst-case scenario satellite-link-based system design involves an inefficient approach and the expenditure of valuable communication resources [
9].
One of the main problems in dimensioning and optimizing the VHTS user link is the evaluation of co-channel interference between user beams of the same color (frequency and polarization pair) [
10]. This impairment is characterized by the Carrier-to-Interference-plus-Noise Ratio (CINR), which limits the capacity of the satellite link. In addition, in a multi-beam satellite system, the
CINR depends on the number of colors, the angular separation and number of co-channel beams (frequency channeling plan), the carrier power, the operation point of interfering transponders, and the radiation pattern of the user beams in terms of sidelobe levels. Therefore, the characterization of the
CINR is essential and must be considered in the VHTS dimensioning process [
11].
Due to the limited spectrum available in the Ka band (30/20 GHz), the use of Q/V bands (50/40 GHz) in the feeder link is suggested to increase satellite capacity [
12]. When the feeder link is moved to the Q/V bands, there is a larger bandwidth available in Ka for the user link and therefore a higher number of user beams can be assigned per gateway, resulting in a reduced number of gateways. However, the use of Q/V bands in the feeder link imposes the need to introduce fade mitigation techniques using gateway diversity to overcome the attenuation caused by rain, gases, and clouds [
13,
14,
15].
Either using Ka or Q/V in the feeder link, the cost of the ground segment shall be considered as part of the system cost, as it is proposed in the cost model introduced in this paper.
The design of VHTS systems must take into account various technical and commercial requirements and constraints. In the literature, the formal optimization and dimensioning methodology for multibeam satellite networks has been presented in pioneering contributions in [
16,
17], where analytical expressions of some key parameters of satellite link design are presented. However, the cost of the ground segment is not included, and neither the user station G/T nor link availability are part of the methodology.
The authors of [
3] provide an overview of VHTS satellites, including technical and business considerations, and examine important key metrics and trade-offs for these satellites, including a cost per bps decision tree and cost-performance mapping. However, they leave out important aspects, such as the ground segment.
In addition, there are currently well-studied methodologies that estimate and optimize wireless communication network parameters, particularly those applied to Wireless Local Area Network (WLAN) [
18,
19,
20]. However, the general objective of this paper is to evaluate and optimize VHTS systems whose link conditions, architecture, and cost structure are very specific and rather different to other wireless communication systems. This work proposes an optimization methodology to design VHTS systems based on geostationary platforms in order to obtain the minimum cost per Gbps in orbit, where the optimization depends not only on the number of beams, but also on the user
G/
T and the link availability, according to a set of technical and commercial requirements. This methodology minimizes the cost per Gbps in orbit by maximizing the capacity of the channel per beam based on an analytical expression of the average
CINR as a function of the number of beams, the user
G/
T and the link availability. Therefore, optimal values can be obtained straightforwardly.
It is also important to notice that the ground segment is included in the calculation of the system cost and cost per Gbps in orbit, as well as the impact of using CCM or VCM (Constant and Variable Coding and Modulation, respectively) in the satellite capacity.
The main contributions of this work are listed below:
An analytical model that calculates the CINR in the forward link, depending on the number of beams, the user G/T, and the link availability;
The use of Q/V bands in the feeder link is considered;
The beamwidth of the satellite beams is not fixed, allowing the number of spots in the service area to be changed;
The user station G/T can be selected from a set of possible values;
System cost model considers both satellite and ground segment costs;
Link availability in the service area is considered to evaluate system performance with CCM and VCM.
This paper is organized as follows:
Section 2 analyzes the VHTS scenario and presents the optimization problem.
Section 3 details the models and requirements that will be used to evaluate the VHTS system and proposes an analytical model for the calculation of the CINR.
Section 4 explains the evaluation methodology for dimensioning and optimizing VHTS systems.
Section 5 evaluates the methodology in two scenarios presenting the trade-offs and decision factors for selecting optimal values of system parameters and evaluating the capacity of the system using CCM and VCM. Finally,
Section 6 draws the conclusions of the paper.
2. Problem Definition
The methodology presented in this paper aims to obtain an optimal VHTS system at a minimum cost per Gbps in orbit, and at a maximum capacity per beam, according to a set of technical and commercial requirements. The methodology can be applied to any service area and frequency plan and considers three different KPIs (Key Performance Indicator): channel capacity per beam, satellite capacity, and cost per Gbps in orbit.
We focus on the CINR calculation of the forward link, assuming that the fading in the feeder link uplink is controlled by fade mitigation techniques (e.g., uplink power control, gateway diversity), thus assuming that the uplink is not affecting the downlink (user link) performance.
The number of beams required in a VHTS system depends on two important factors: the service area and the beamwidth of the beams.
According to [
16], the transmission channel in each beam can be considered as a Gaussian channel due to the central limit theorem taking into account co-channel interference and noise. This supports the fact that the channel capacity of each beam can be obtained analytically using the Shannon law as:
where
Cb is the Shannon capacity per beam in Gbps,
BWb is the bandwidth per beam in Hz, and
CINRb is the average of carrier-to-interference-plus-noise-ratio for each beam in dB.
Once the Shannon capacity is obtained, the real capacity of each beam is taken into consideration and the required
CINR and spectral efficiencies of DVB-S2X ModCods when using CCM or VCM are used [
21]. The cost per Gbps in orbit of a VHTS satellite network focuses on the analysis of the forward link according to the number of beams used, the
G/
T of the user station and the annual availability. In this sense, the methodology achieves the optimal trade-off solution to minimize the cost per Gbps in orbit by obtaining the highest capacity per beam
Cb according to a set of technical and commercial requirements and constraints for different scenarios. The optimization problem can be formulated as in (2):
subject to
where
is the cost per Gbps in orbit in million euros (M€) per Gbps,
is the total network cost in M€ (cost of satellite and gateways),
is the total satellite capacity in Gbps,
B is the number of beams,
is the figure of merit for the user terminal in dB/K. It is selected from a set of N values of commercially available options,
is the required link availability in the service area,
represents the m-th system constraint, such as the payload mass, the maximum total system cost and diameter of antenna satellite,
represents the m-th set of possible values to the m-th system constraint, and
M is the number of system constraints.
The cost per Gbps in orbit can be calculated using (4) and (5):
where
is the satellite cost in M€, and
is the total ground segment cost associated to gateways in M€.
3. Fundamentals and Analytical Models
This section describes the analytical models required for the proposed method of optimizing the cost and performance of the VHTS satellite network. In addition, a new analytical model of the CINR is presented as a function of the number of beams, the G/T ratio of user stations, and the annual availability.
3.1. Spot Beam Model and Link Budget Calculation
In a multibeam system, the coverage footprint of each beam can be described as the curve formed by the intersection of the conical model of the antenna beam with a spherical model of the Earth [
22]. The variation in the number of beams depends on the beamwidth of the antenna beams. If the beamwidth is reduced, the area covered by each beam will be smaller, so the number of beams will be increased to match the total coverage area. This affects other parameters such as directivity, the diameter of the satellite antenna, as well as the definition of the feed cluster.
If
represents the position of the user as a function of the angle between the center of the beam and the position of the receiver with respect to the satellite, the beam gain can be modelled as [
23]:
where
represents the gain at the
b-
th beam centre (1 ≤
b ≤
B) when free space loss is taken into account, and the
denotes the distance (in thousands of km) of the
b-
th beam centre from centre of the central beam and d
0 ≃ 35,786 km,
,
is the one-sided half-power beamwidth, and
Jx is the first-kind Bessel function of order
x [
23]. The EIRP (Effective Isotropic Radiated Power) footprints are obtained by multiplying
by the power assigned to each beam.
The beam gain must be calculated for the latitude and longitude (lat, lon) grid in the service area. The sidelobes of the satellite antenna pattern are taken into account only for the calculation of the co-channel interference induced by spatially separated co-channel beams.
In [
16], it is shown that the carrier-to-interference ratio (
CIR) in each (
lat, lon) decreases alongside the number of beams due to the presence of more cochannel beams. Co-channel interference power
depends on frequency reuse scheme and can be calculated considering the co-channel beams set in the system as [
16]:
where
represents the q-th interferer spot,
is the total number of interfering beams of the beam b, and
is the power level of q-th interference inside the b-th beam in the geographical position (lat, lon).
Rain attenuation for each point in the grid depends on the required link availability, elevation, frequency, and polarization. In this sense, the service area percentage will be the percentage of those geographic coordinates that meet the minimum CINR requirement for the specified annual availability.
A bent-pipe transponder architecture is considered in the satellite. The uplink is not considered in the forward link because there are different technologies to guarantee a value not affecting the total link budget, such as ULPC (Uplink Power Control), or gateway diversity [
24,
25]. The total
CINR (in dB) in the downlink of the user link is calculated for each geographical position using (9):
where
cnr and
cir represent the carrier-to-noise and carrier-to-interference ratios in natural units, respectively.
The
CNR (dB) calculation is based on the well-known link-budget models. The downlink
CNR is calculated as:
where
is the EIRP of the satellite beam in the (lat, lon) grid,
BWb is the available bandwidth to each beam in Hz,
is the carrier to noise ratio in the geographical position in dB,
is the figure of merit of the user terminal in the geographical position (lat, lon) in dB/K,
represents the free-space losses in geographical position in dB,
is Boltzmann constant (−228.6 dBW/(K·Hz)), and
AT (lat,lon,P) is the total atmospheric attenuation (in dB) for a link availability
P calculated using an ITU recommendation [
26].
3.2. Technical and Commercial Requirements
A set of technical and commercial requirements are defined separately for ground and space segments.
The requirements of the ground segment for the feeder link affect the calculation of the minimum number of gateways, which also depends on the use of Ka or Q/V band in the feeder link.
A mixed solution using Q/V band on the feeder-link and Ka band on the user link is recommended to maximize system capacity [
2]. Since the available bandwidth in Q/V band is larger, more capacity can be obtained in the system, and thus a reduction in the cost of Gbps is achieved.
Frequency reuse in the multibeam satellite is usually defined by four colors [
17] with two frequencies and two orthogonal polarizations in the frequency plan. The relationship between the uplink and the downlink parameters in the forward link [
27] are defined in (11) and (12):
where
NC is the number of colors defined in the frequency plan,
BWT is the total system bandwidth in MHz,
BWb is the bandwidth per beam in MHz,
BWA is the bandwidth assigned to each gateway in MHz,
NP is the number of polarizations of the frequency plan, and
NGW is the number of gateways.
For instance, in a scenario of 82 beams and a four color scheme (two polarizations and two frequencies) to provide coverage in Europe, and with a bandwidth of 250 MHz per beam, at least eight gateways would be needed if the Ka band is shared between user and feeder links; however, five gateways would be required if Q/V bands are used in the feeder link (assuming an available bandwidth of 1.3 GHz for the Ka band and 2.5 GHz for the Q/V bands [
2]).
According to [
28], the cost of ground segment varies between 10% and 15 % of the total cost of system (
). The model in (13) is proposed to evaluate the cost of a gateway, which aggregates the cost associate with the number of user beams fed by the gateway (
) and the cost of the antenna (
).
where
is the gateway cost (in M€),
is the number of user beams per gateway, and
DGW is the antenna diameter of the gateway.
and
are empirical constants to adjust the cost to money units. The total cost of the ground segment is the sum of the cost of the gateways [
22].
The space segment is limited by the maximum satellite mass imposed by the platform and launcher. The satellite mass
(kg) depends on the number of beams (
B) and can be modelled as (14), with a constant mass of 4000 kg as the minimum mass of a full-wideband satellite [
16]:
Finally, an additional limit associated to the maximum total cost of the system can be defined. The satellite cost model (15) includes a constant cost of 180 M€ [
16], including an average launch cost of 100 M€ and a fixed cost of 80 M€ as the minimum price of a broadband payload. A corrective term has been added according to the number of beams (
B) [
16].
3.3. Proposed Analytical Model for the
This paper proposes an analytical model of the average
CINR per beam
(in dB) as in (16). This model depends on the number of beams (
B), the
G/
T (dB/K) of the user terminals, and the annual availability (
P). The
are the fitting terms due to the link availability obtained from the rain attenuation in the service area.
where
Equation (16) has been derived from multiple simulations evaluating different scenarios and different technical requirements. In these simulations, the is obtained. A total of 14,000 different combinations of the number of beams, user G/T, and link availability for each scenario have been evaluated to obtain .
The values of the index i go from 0 to 4, whereas the range of index j depends on i, and it must be fulfilled that i + j ≤ 5 to obtain the best fitting of . This condition is represented by k in Equation (17), which limits the range of the index j.
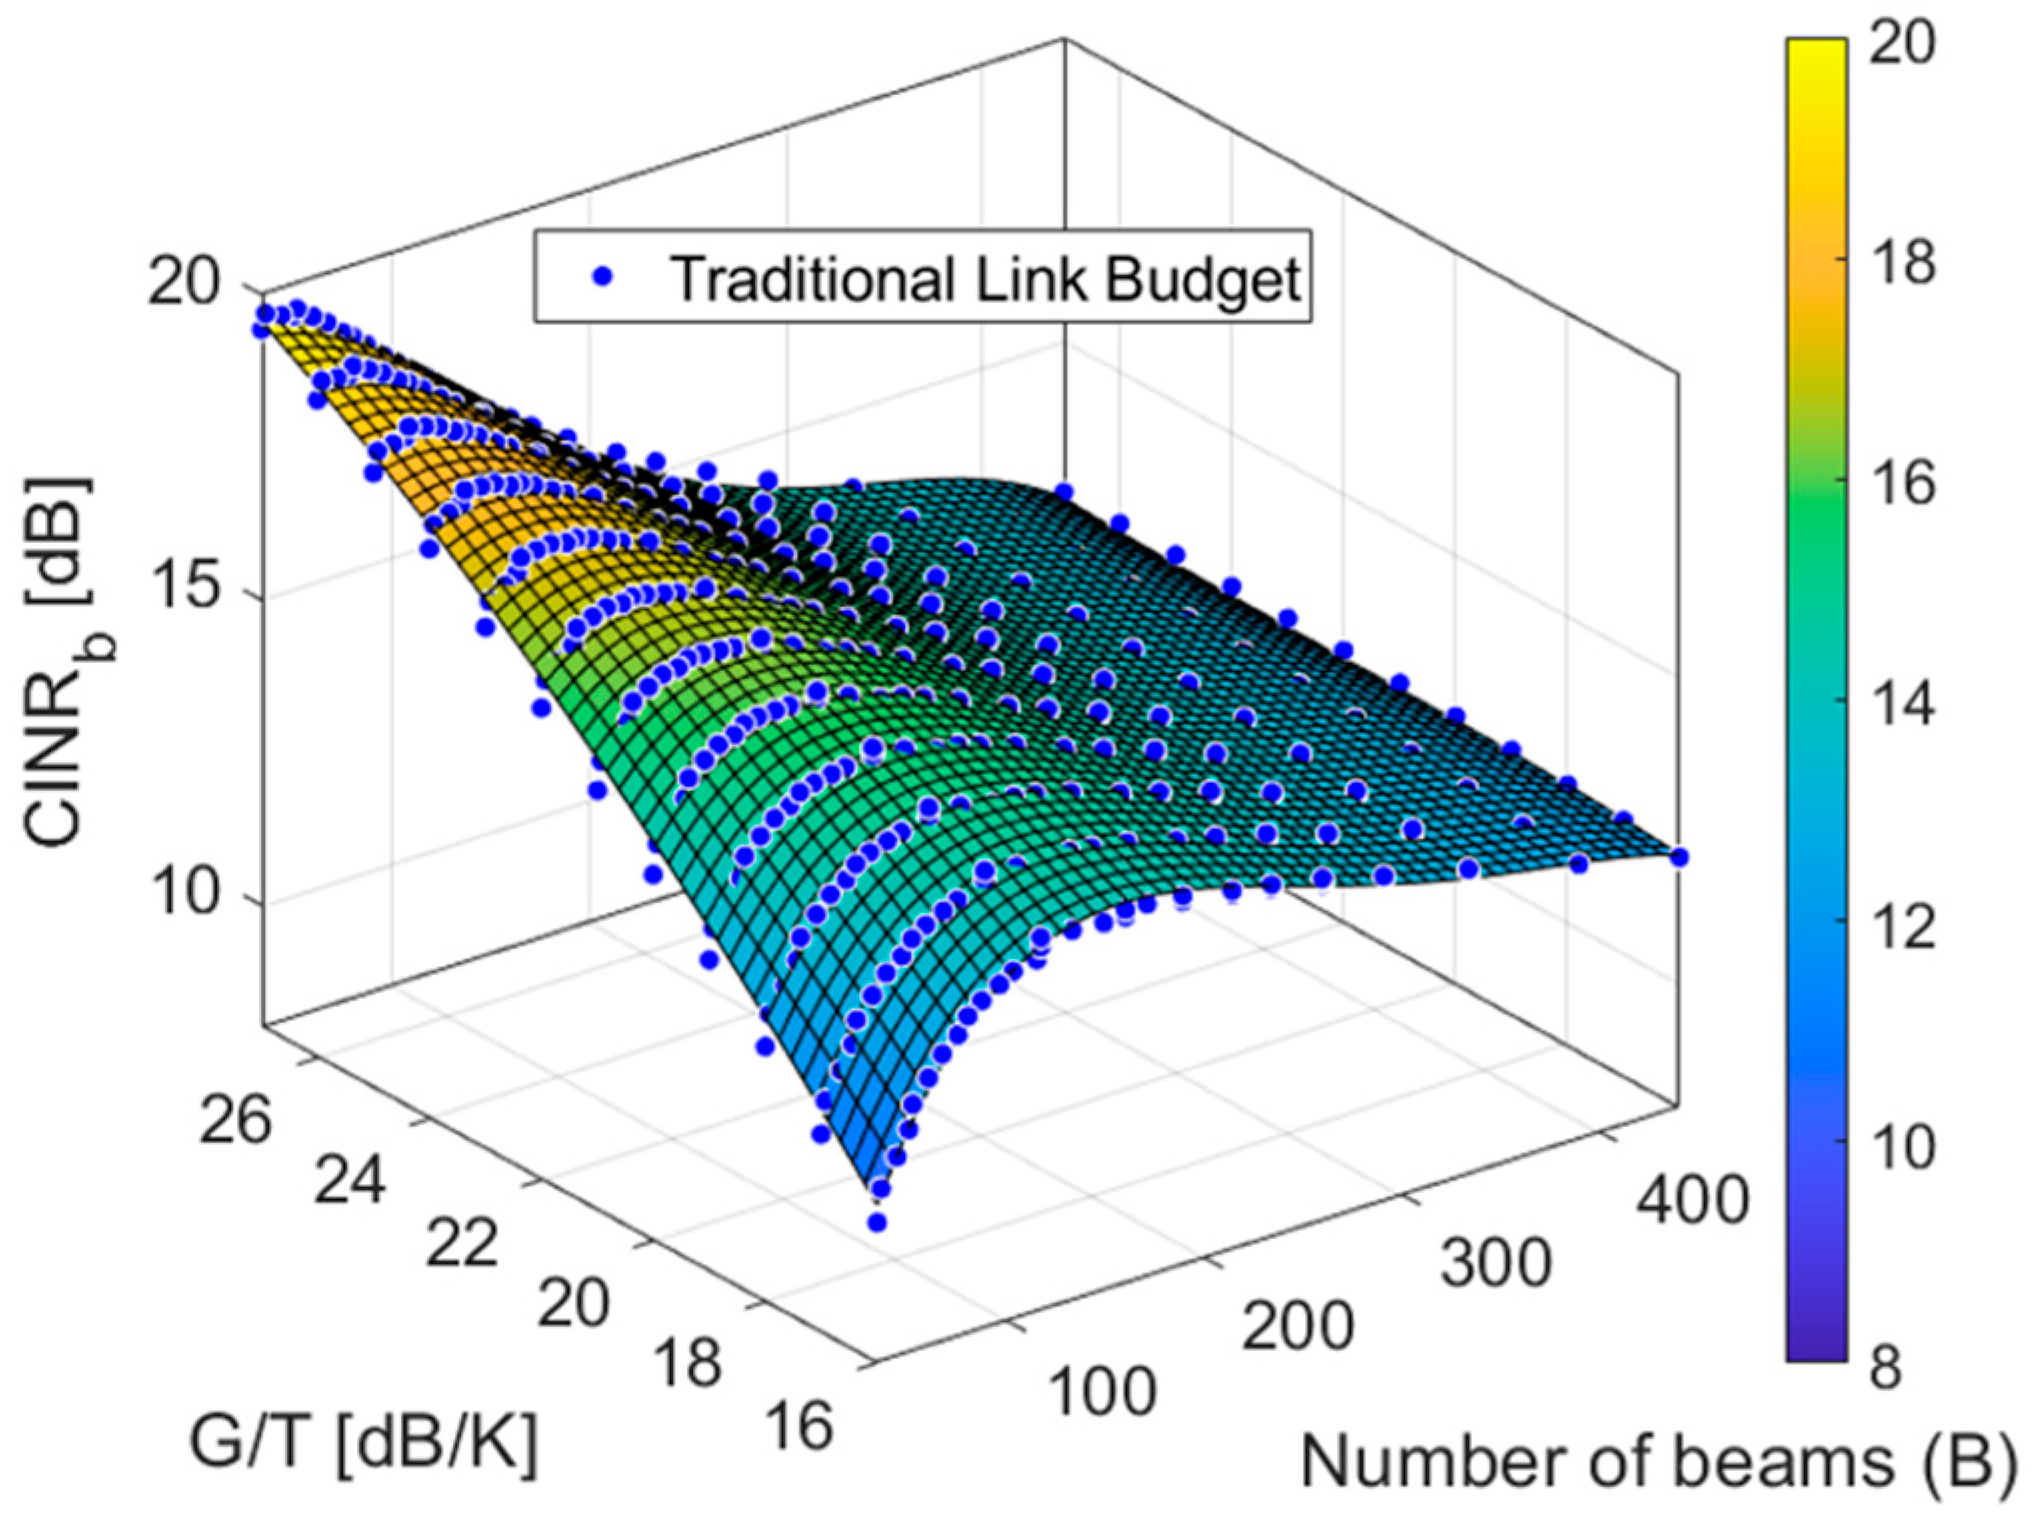
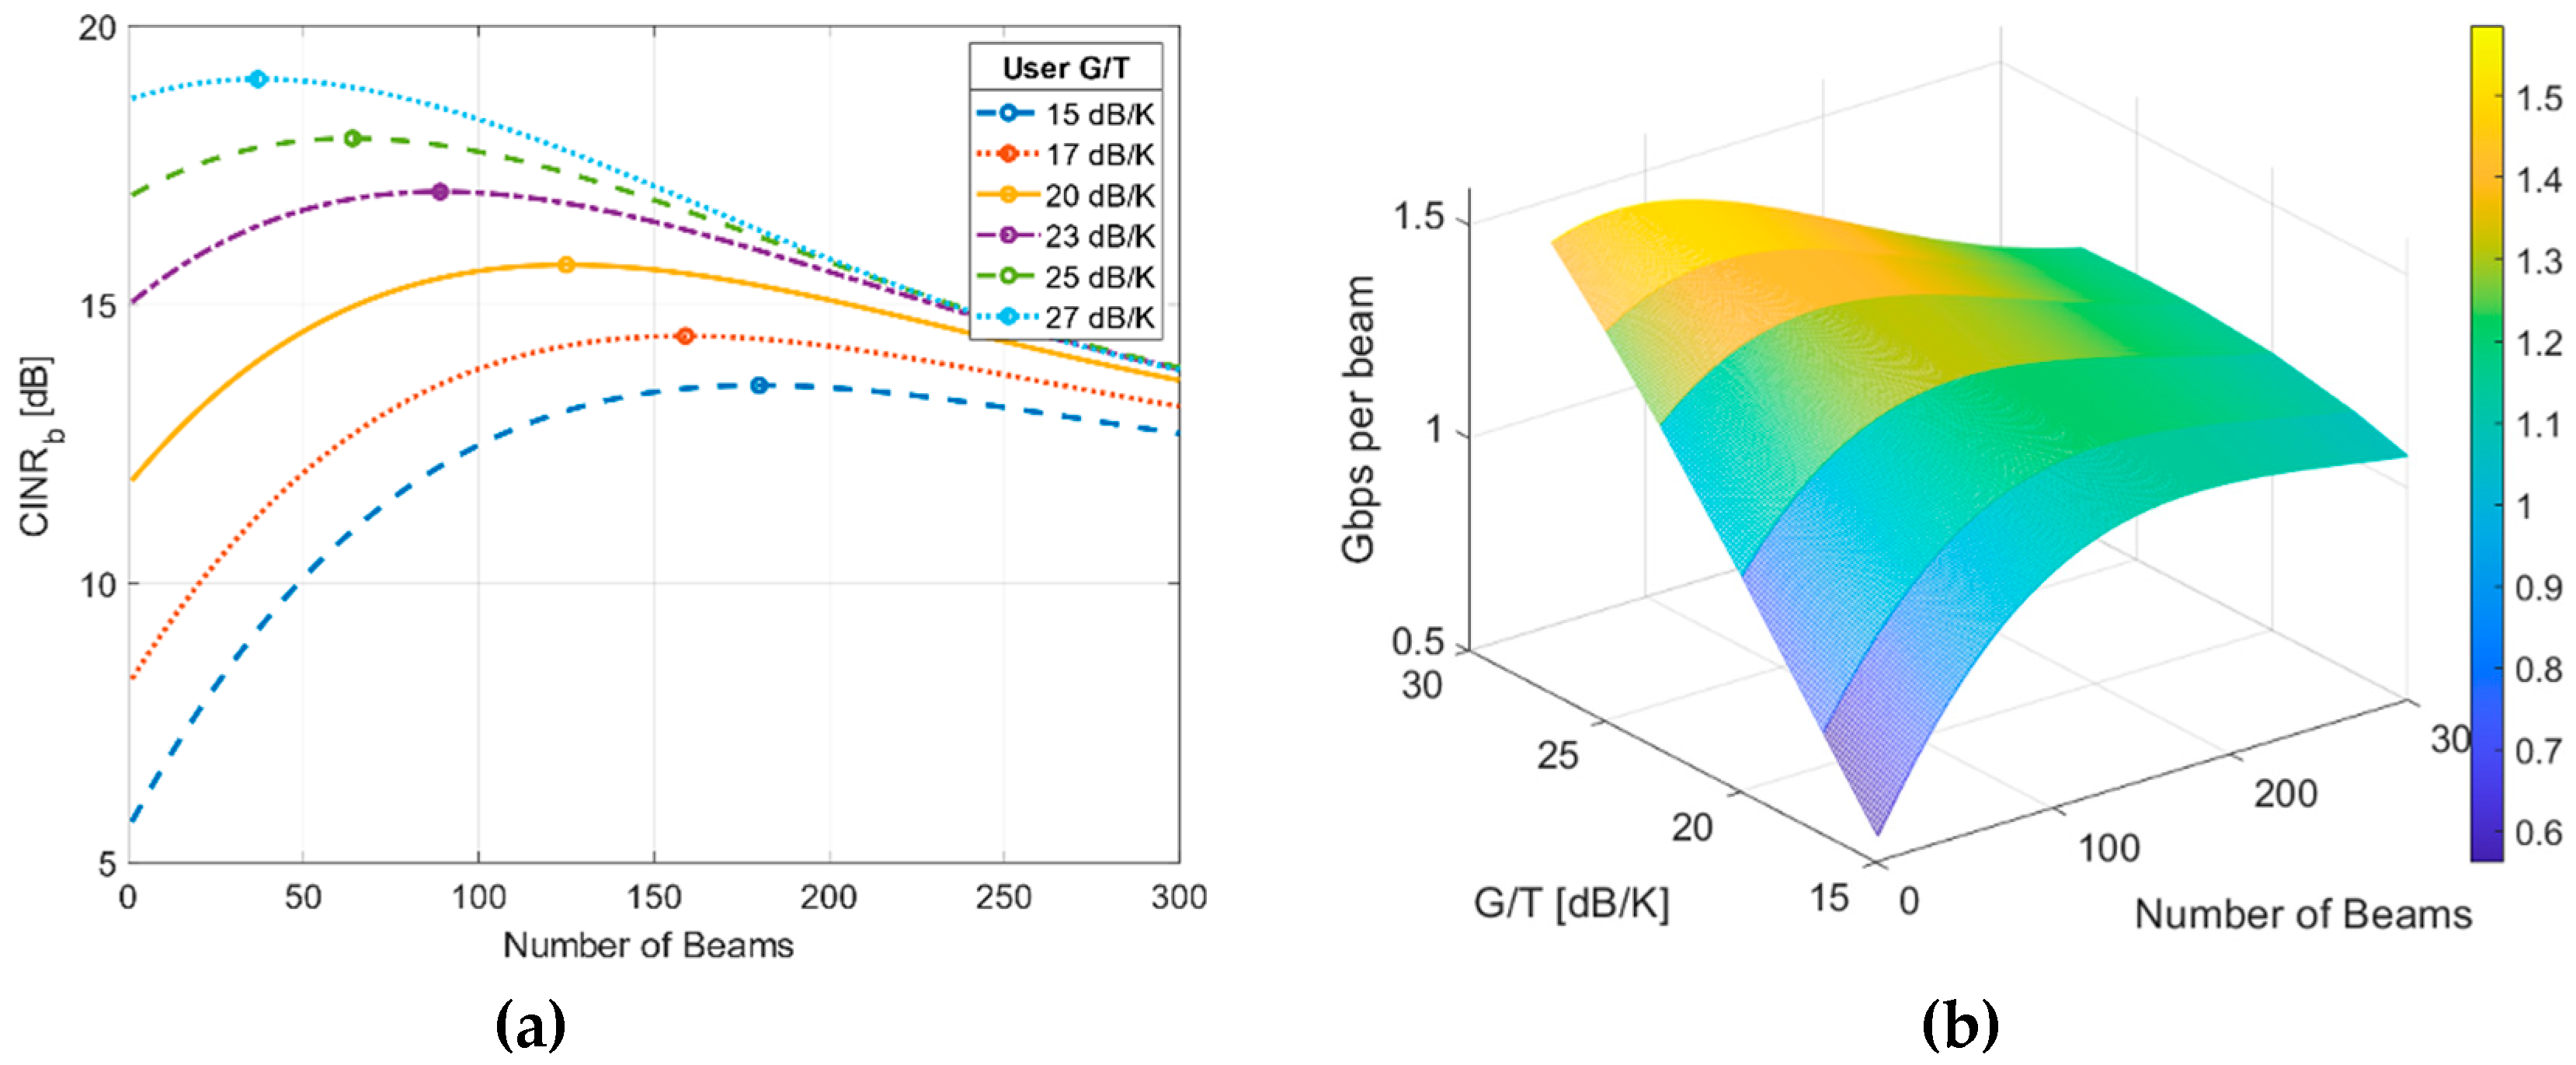
An example of the application of (16) is shown in
Figure 1 where the average
in Central Asia is represented for a link availability of 99.5%: blue dots represent the values obtained with the traditional link budget (9) and the surface is the fitting derived from Equation (16). The graph shows that the variation of the
does not behave monotonically with the number of beams.
4. Proposed Methodology
The methodology presented in this paper aims to obtain the optimal VHTS system that achieves the minimum cost per Gbps in orbit obtained the maximum capacity per beam according to a set of technical and commercial requirements. The methodology can be applied to any service area or frequency plan and it provides an idea of the impact of multiple variables on the performance and cost of VHTS satellites.
The methodology is flexible, so it is necessary to define in advance the technical and commercial requirements and system constraints, such as the service area, the maximum diameter of the satellite antenna, the maximum satellite mass, and the maximum cost that will be invested, taking into account the costs of the satellite and the ground segment.
An important input into the dimensioning is the finite set of possible G/T values of the user terminals, which will depend on the commercial values for the service to be provided. For this, the initial G/T must be the minimum possible according to the user terminals.
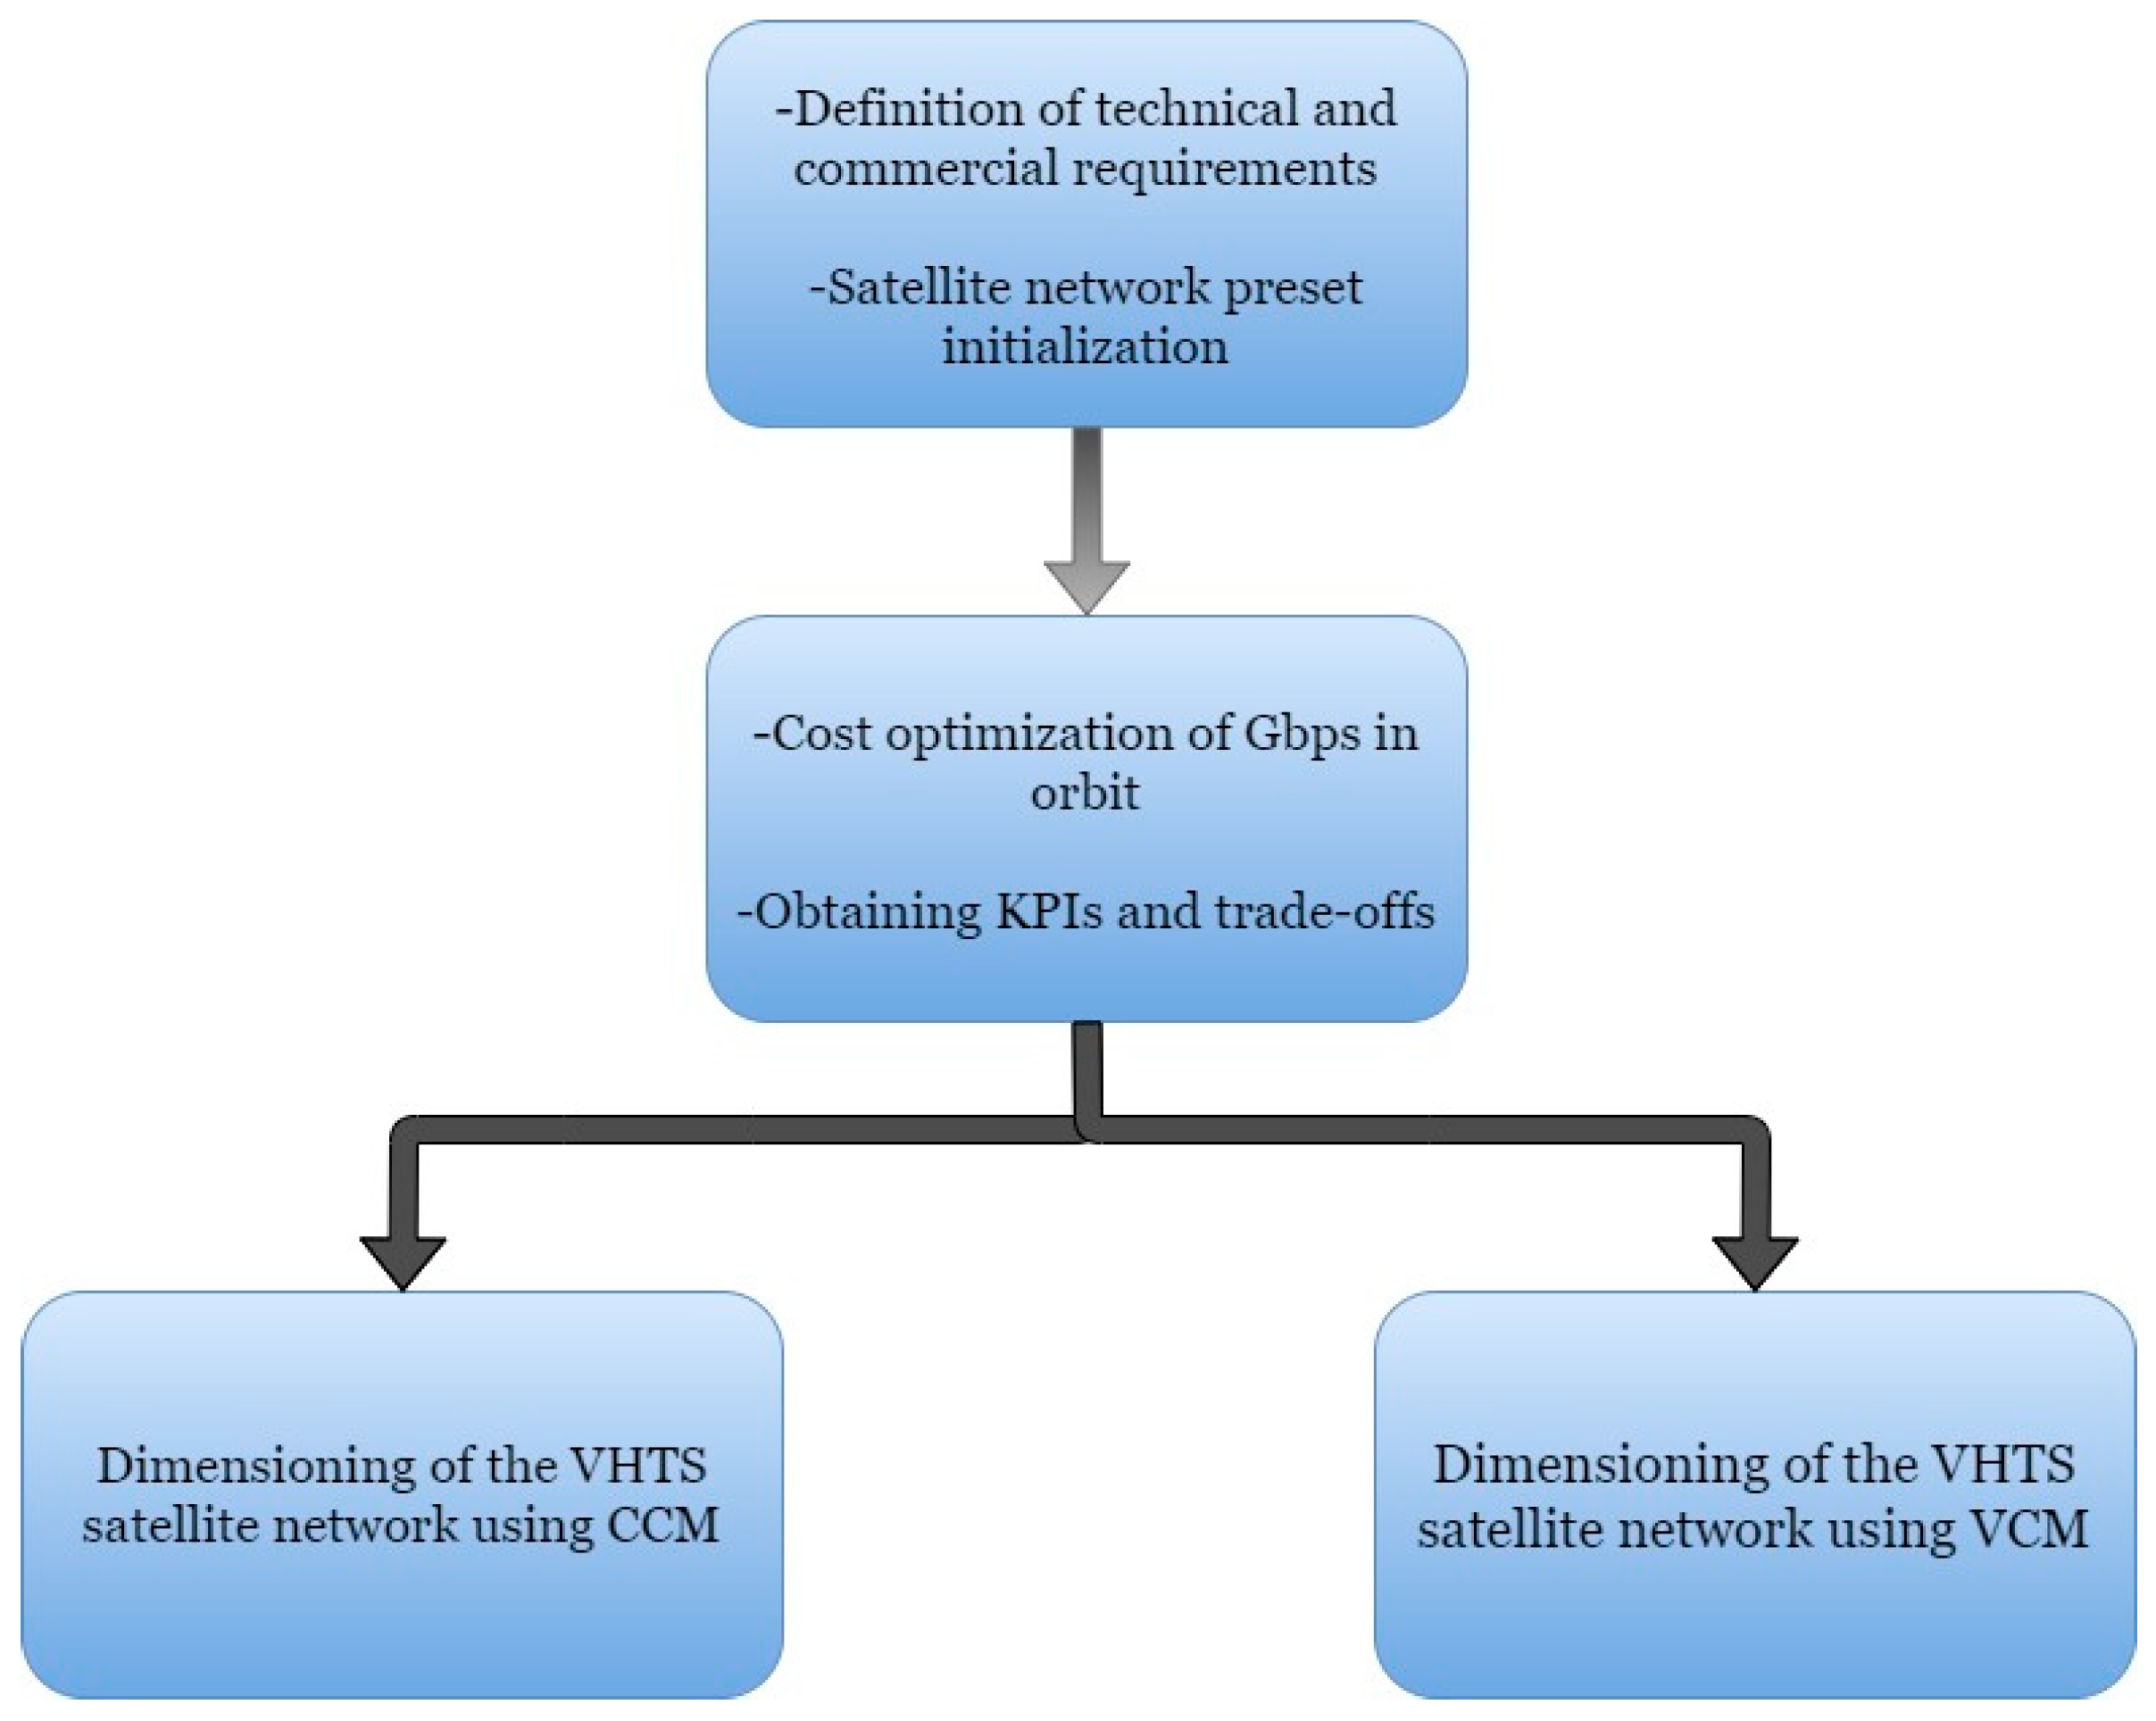
The proposed methodology is divided into two stages (
Figure 2): first, the optimum system configuration (user
G/
T and number of satellite beams) is obtained in terms of cost per Gbps in orbit; second, the satellite capacity using diverse transmission schemes (CCM and VCM) is calculated for a set of link availabilities imposed in the service area.
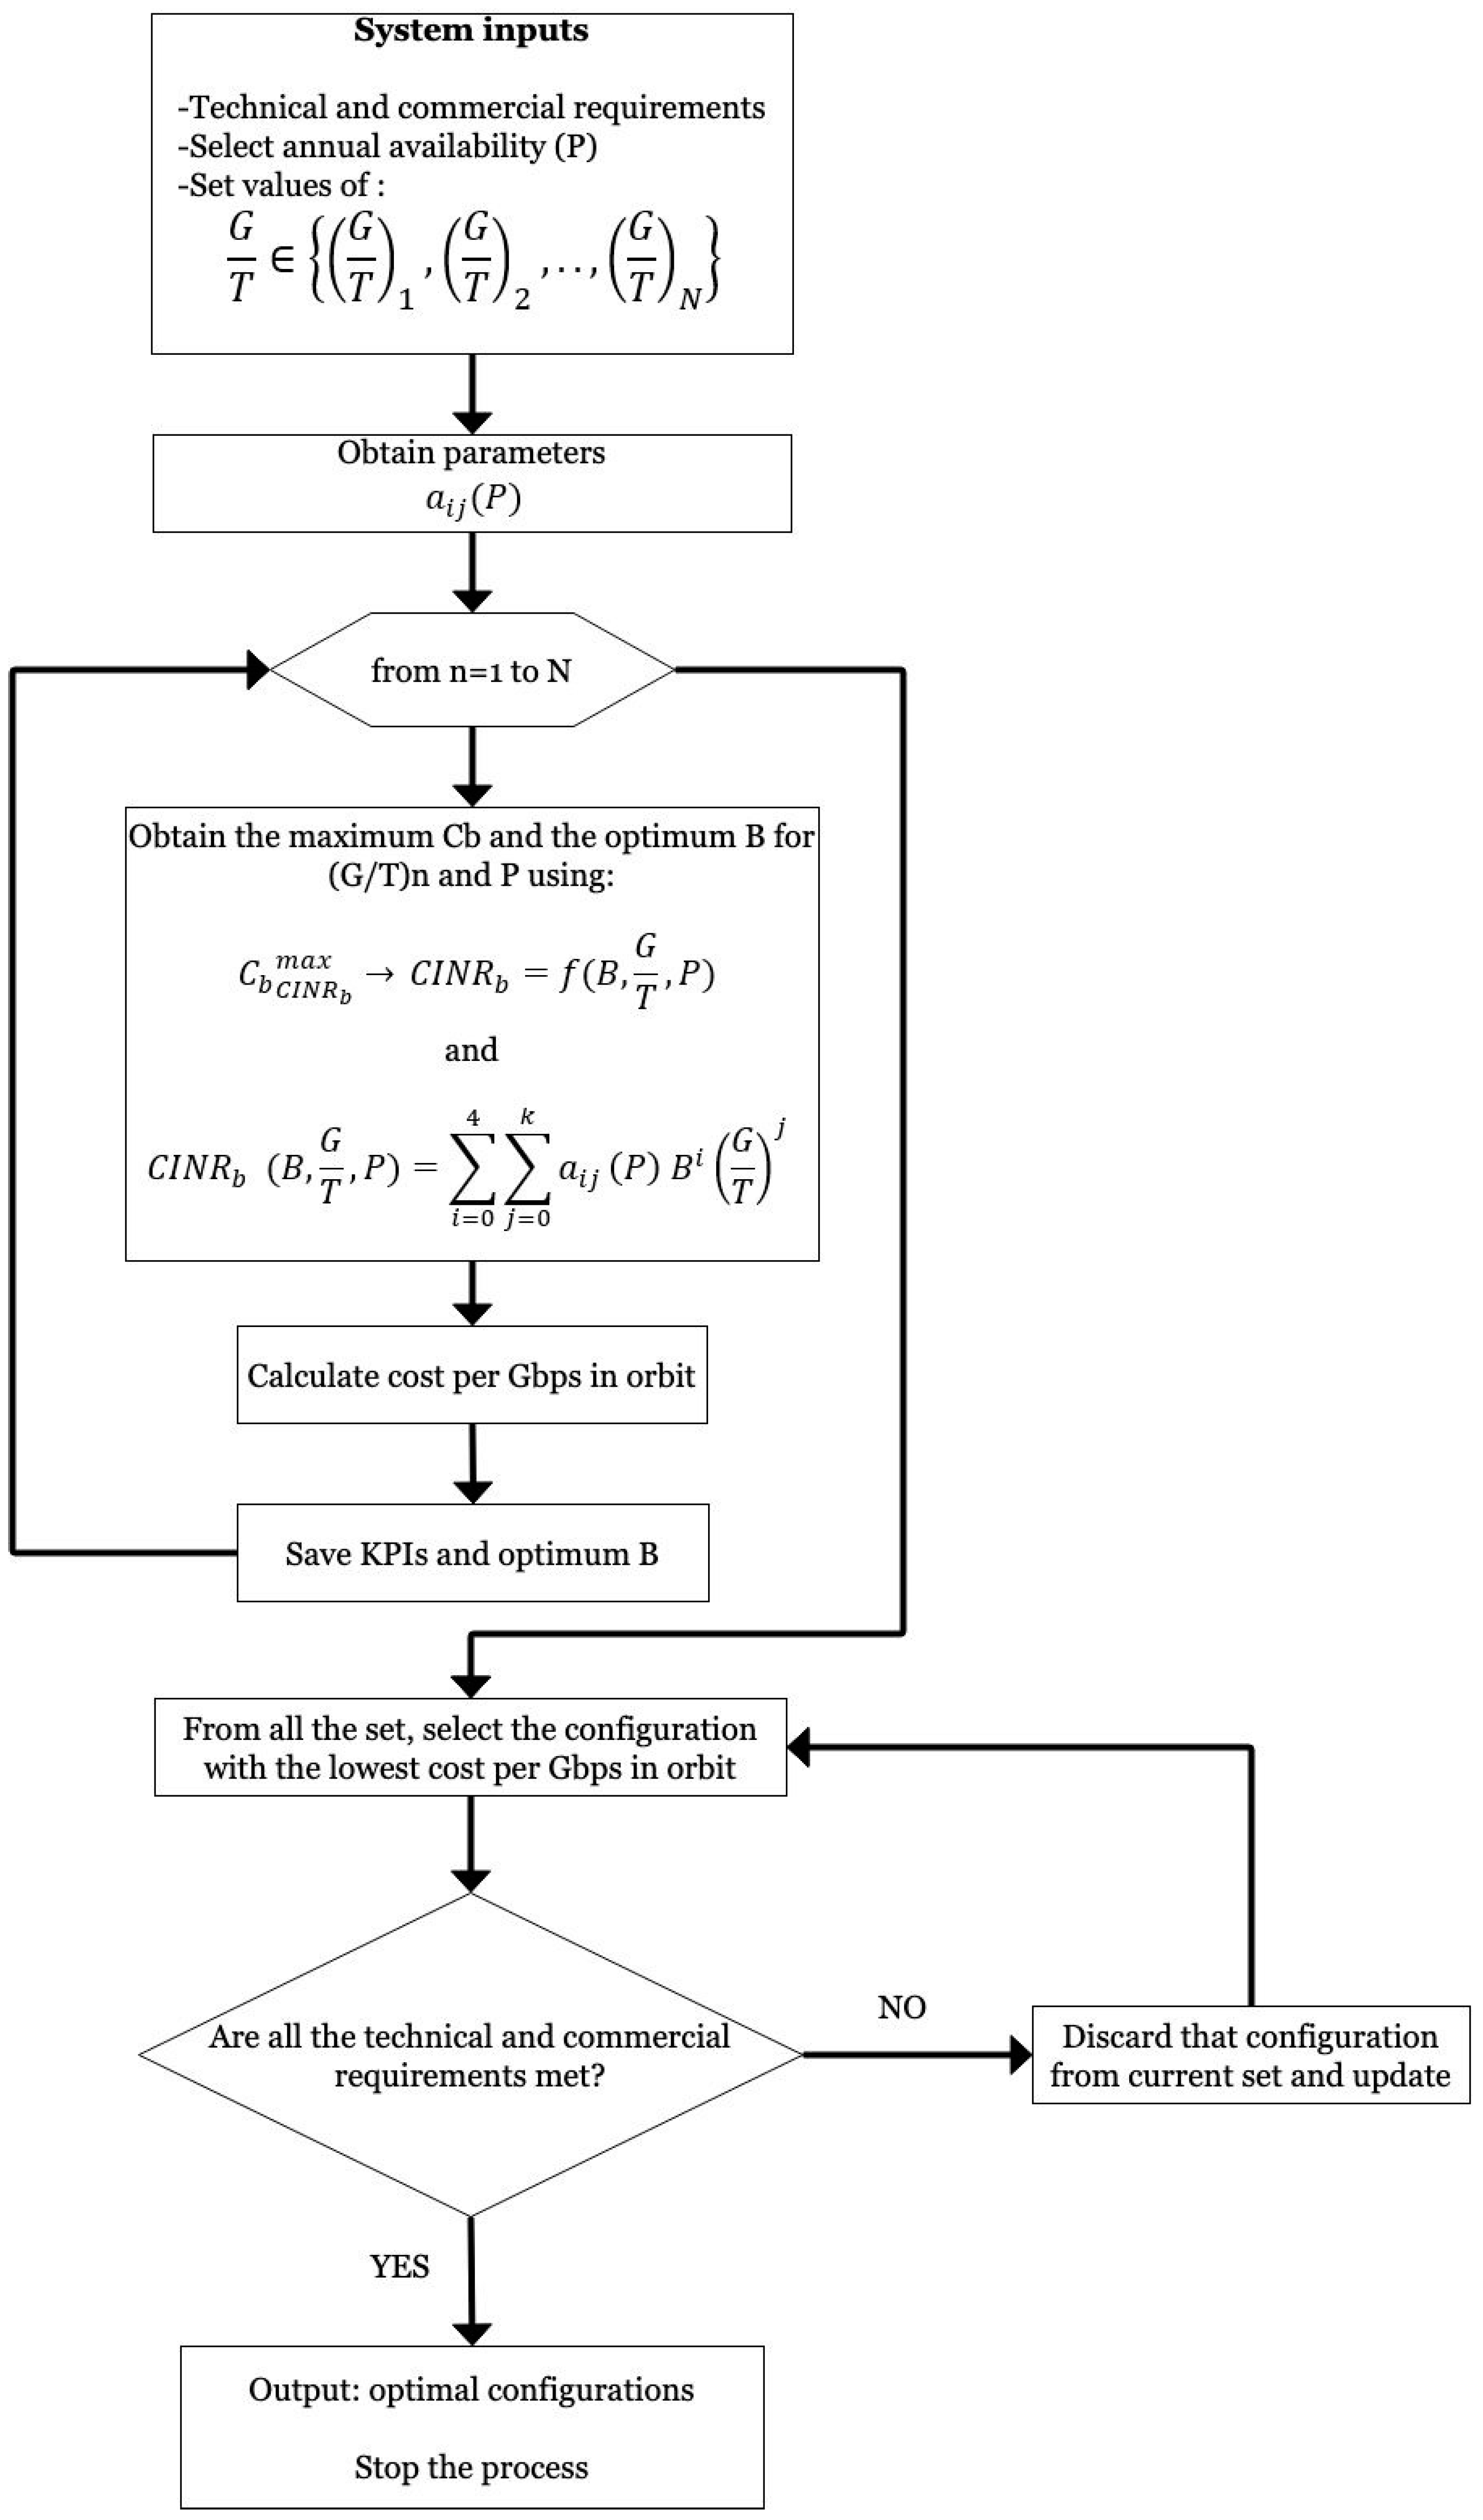
4.1. Algorithm for Cost Optimization: KPIs and Trade-Offs
The algorithm for the optimization of the cost per Gbps in orbit, as well as the calculation of KPIs and trade-offs for the design of the VHTS satellite network, is shown in
Figure 3. The minimization of the cost of Gbps in orbit for the maximum capacity is obtained by the maximum
depending on the number of beams, the user
G/
T, and for the required link availability using Equation (16).
The results of this stage are the optimal number of beams and the user station G/T for a required link availability that minimizes the cost of Gbps in orbit. The results include the number of gateways, the total system cost, the capacity per beam, and the total satellite capacity.
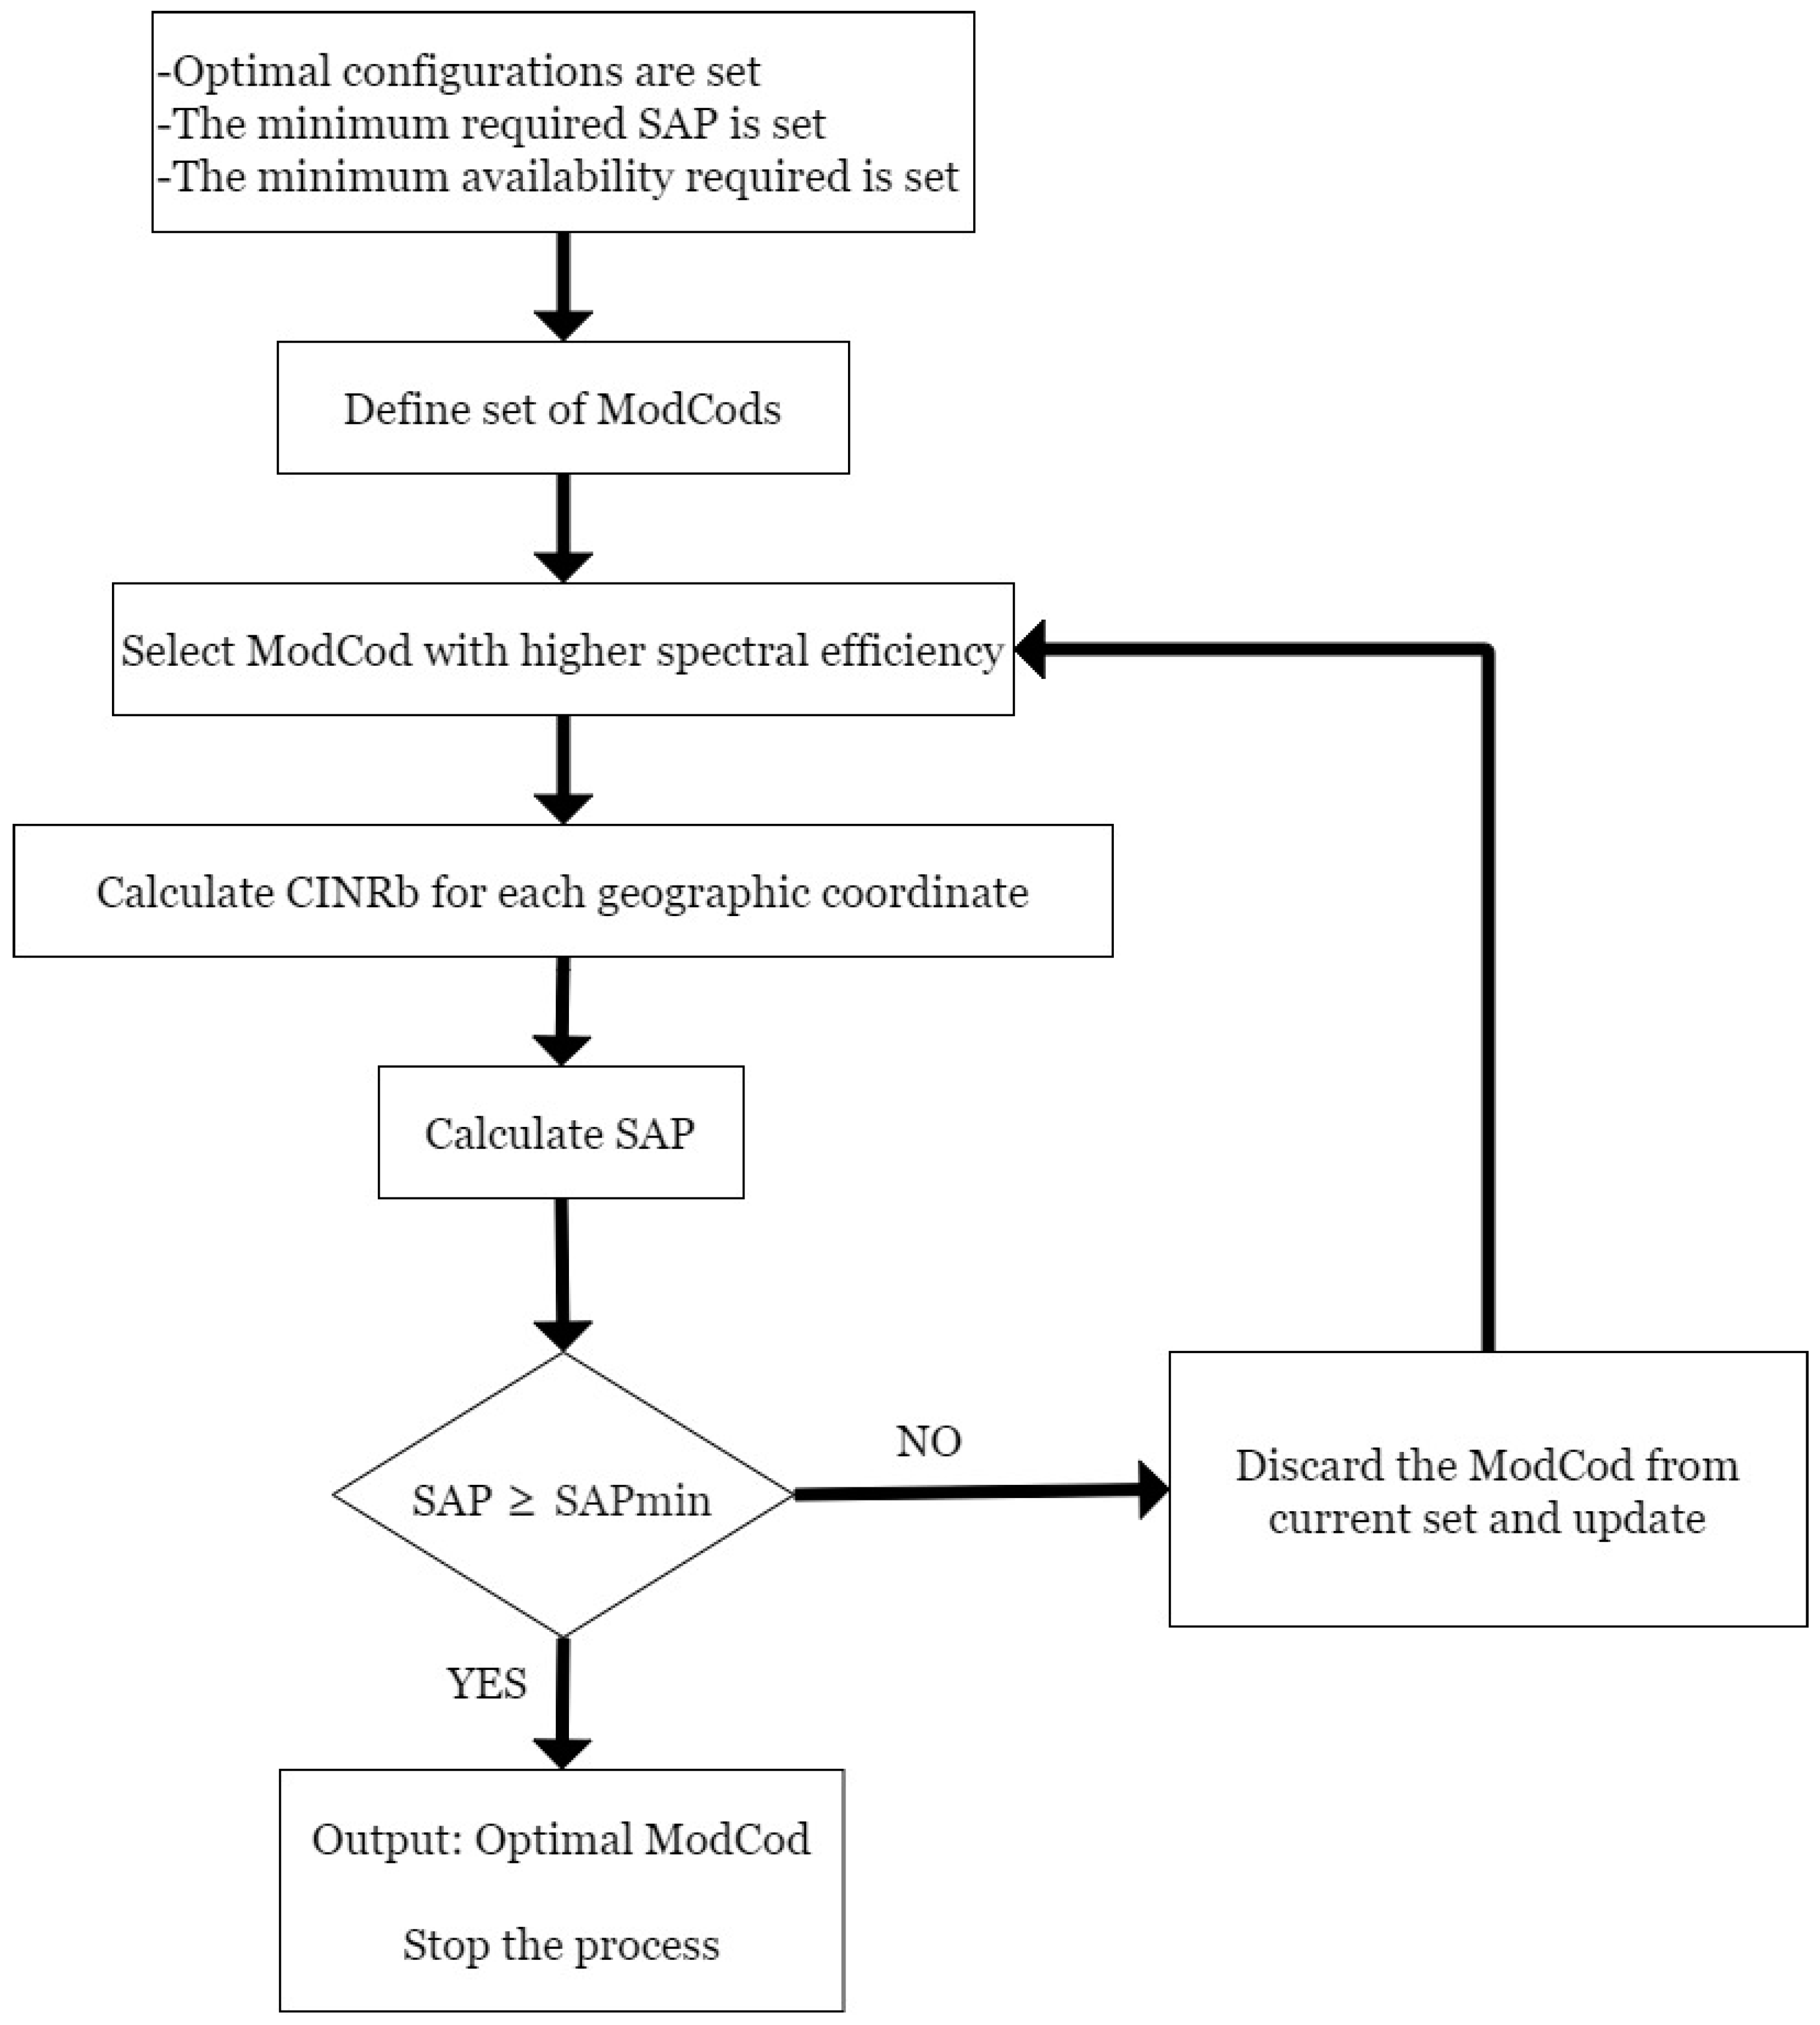
4.2. Capacity of the VHTS Satellite Network Using CCM/VCM
In the first stage of the methodology, the number of beams and the value of the optimum user station G/T are obtained as well as the cost of Gbps in orbit for an ideal channel capacity (Shannon).
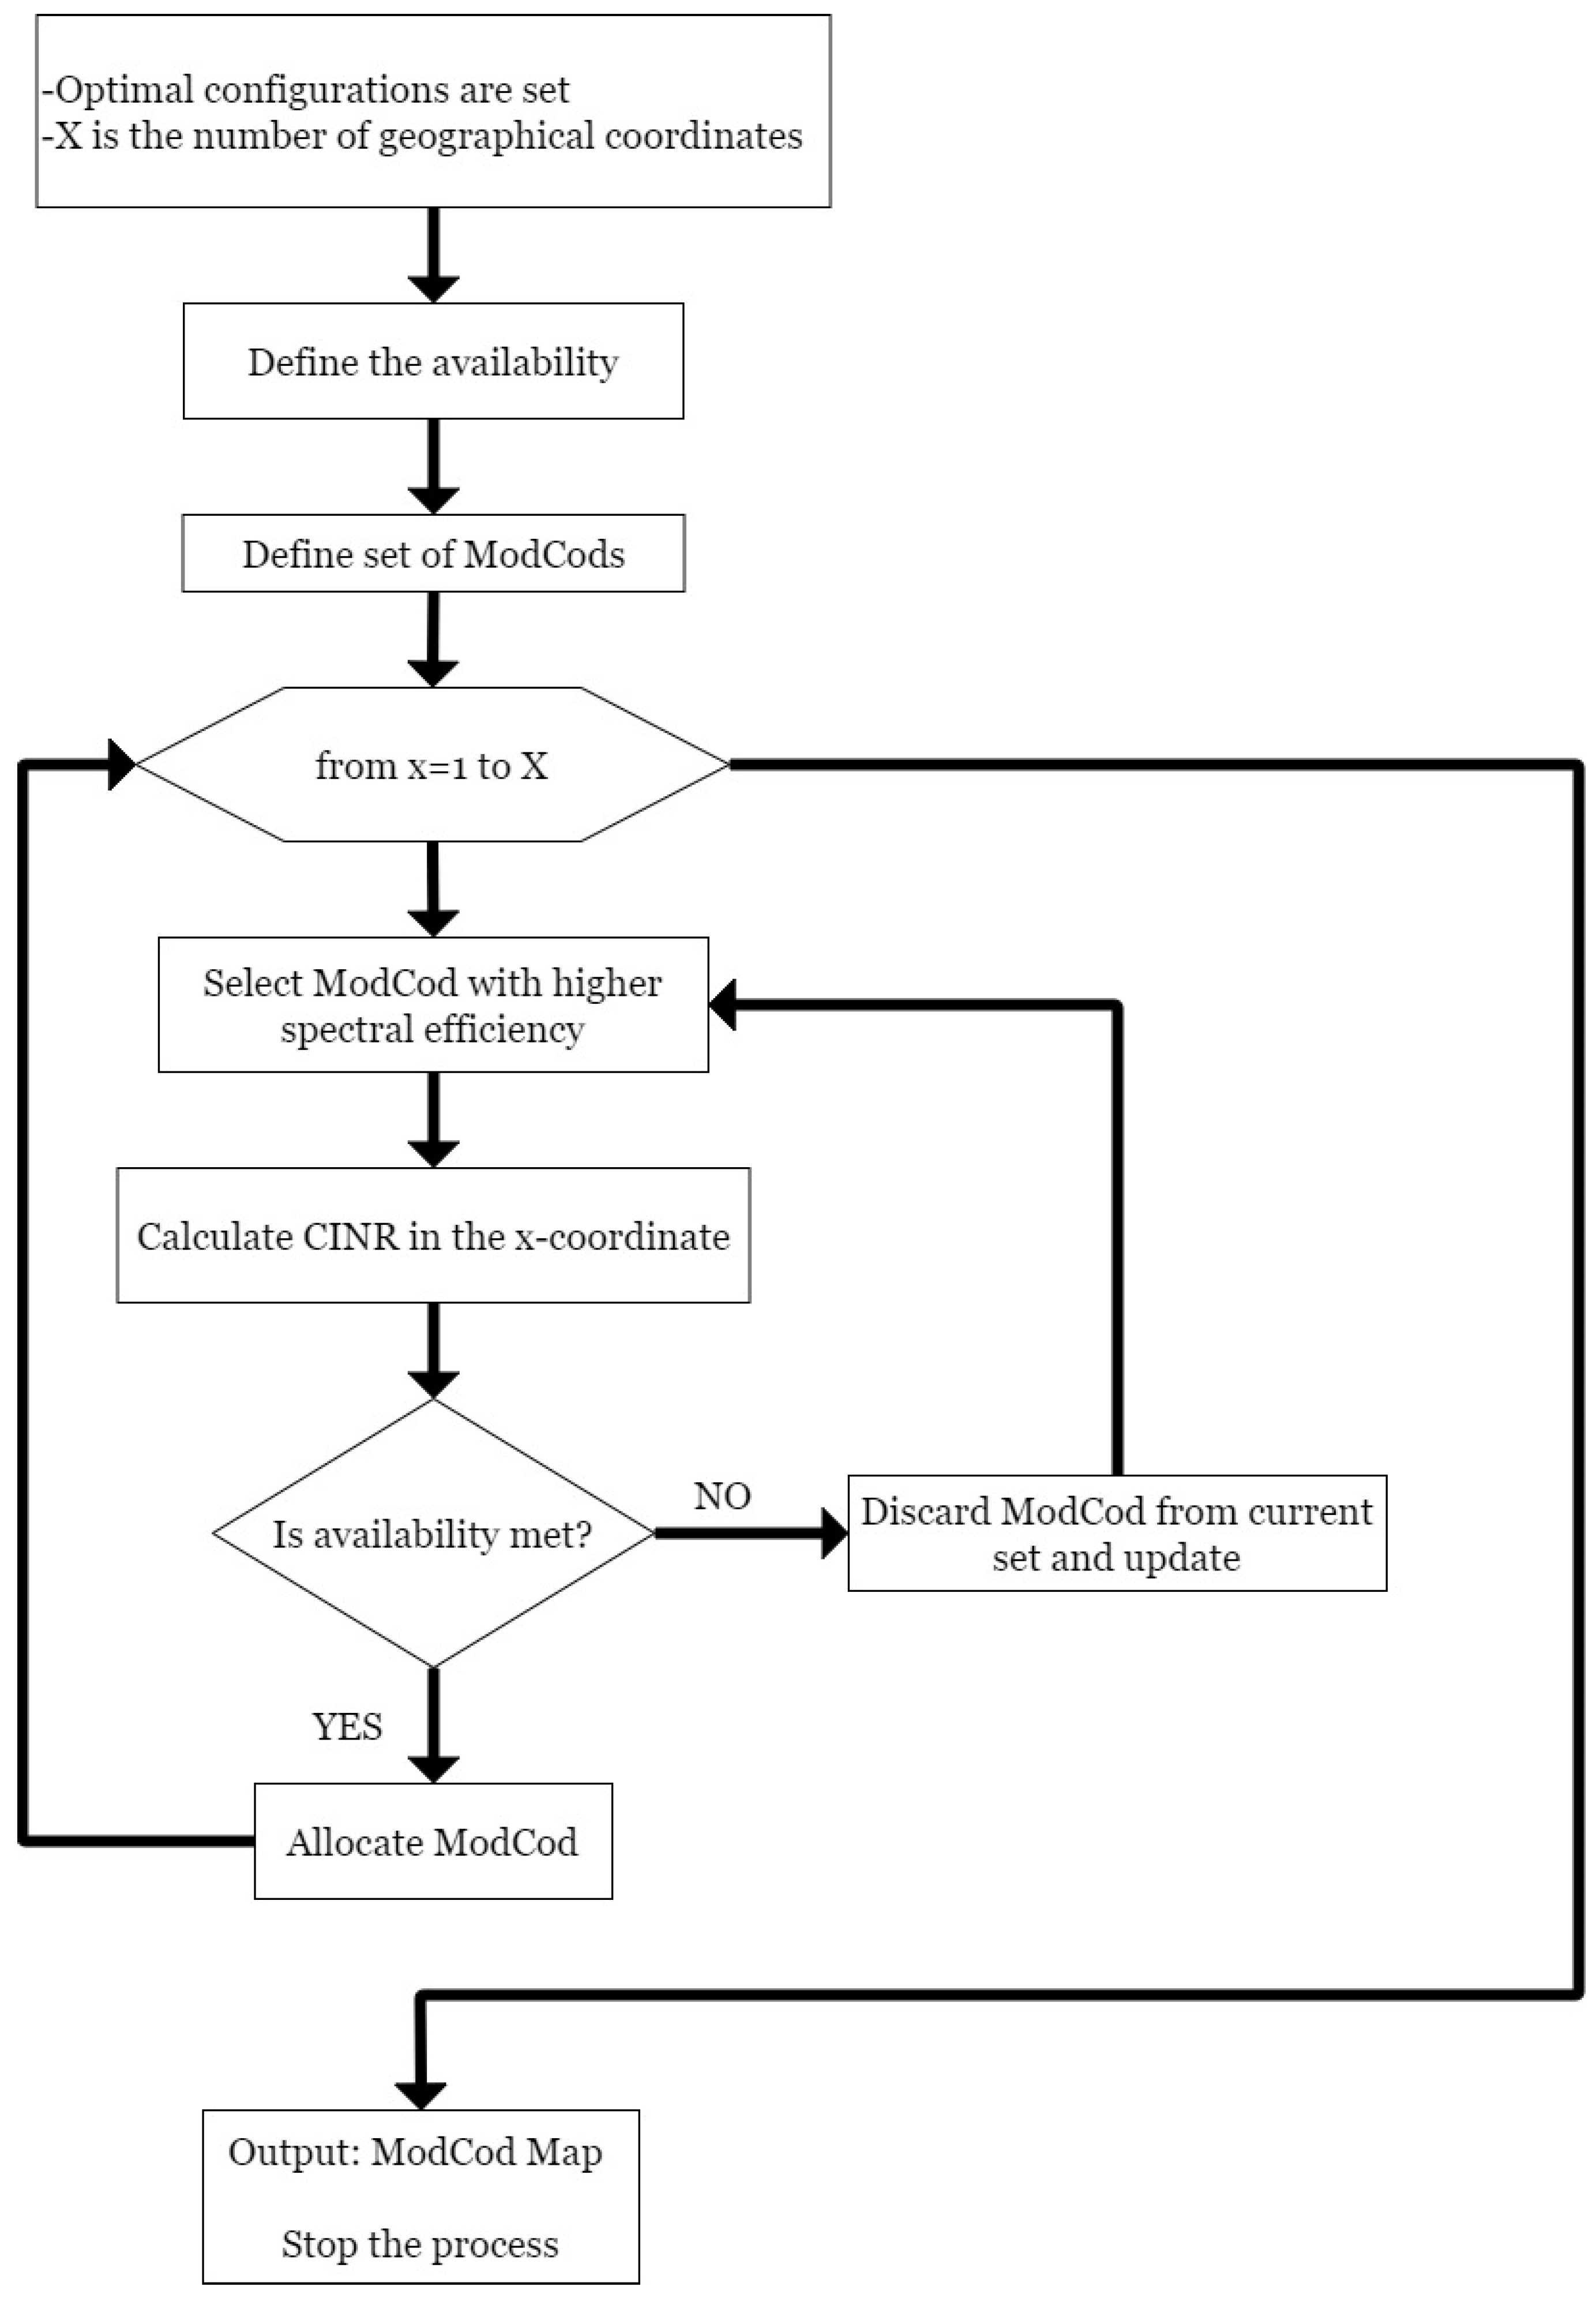
Next, the procedure for dimensioning the VHTS satellite network using CCM or VCM is presented (see the flowchart in
Figure 4 and
Figure 5, respectively).
As defined in [
14], we introduce the service area percentage (SAP) to evaluate the performance of CCM and is defined as the percentage of the service area that fulfils the
CINR requirement for a given ModCod.
For CCM: With the values obtained from the number of beams (B) and G/T, the CINR must be calculated for each geographic coordinate in the service area in order to select the ModCod that provides the highest channel capacity and that meets the SAP requirement for the selected link availability (P).
For VCM: ModCod is modified for each geographic coordinate in the service area depending on the value of CINR for the required link availability. VCM increases the total capacity of the satellite by using ModCods with the highest spectral efficiency according to the particular site link conditions.
5. Case Studies
In this section, the proposed methodology has been applied to the two case studies detailed in
Table 1. It is important to notice that the number of gateways and cost of systems are obtained when the Q/V band is used in the feeder link.
In summary, the first part of the methodology is based on the calculation of using (16), for different values of the user terminal G/T and the number of beams. This means that each G/T value corresponds to a different optimal number of beams.
Table A1 and
Table A2 of the
Appendix A show the variation of the
parameters for different link availabilities. These coefficients have a strong impact on the
and thus on the optimal values for system design. The
parameters of scenario 1 are smaller than scenario 2, which means that rain has a greater impact on the service area of scenario 1.
5.1. Scenario 1
Following the proposed methodology, the first step is the calculation of the system KPIs in clear sky conditions (95% availability) for the system set and constraints.
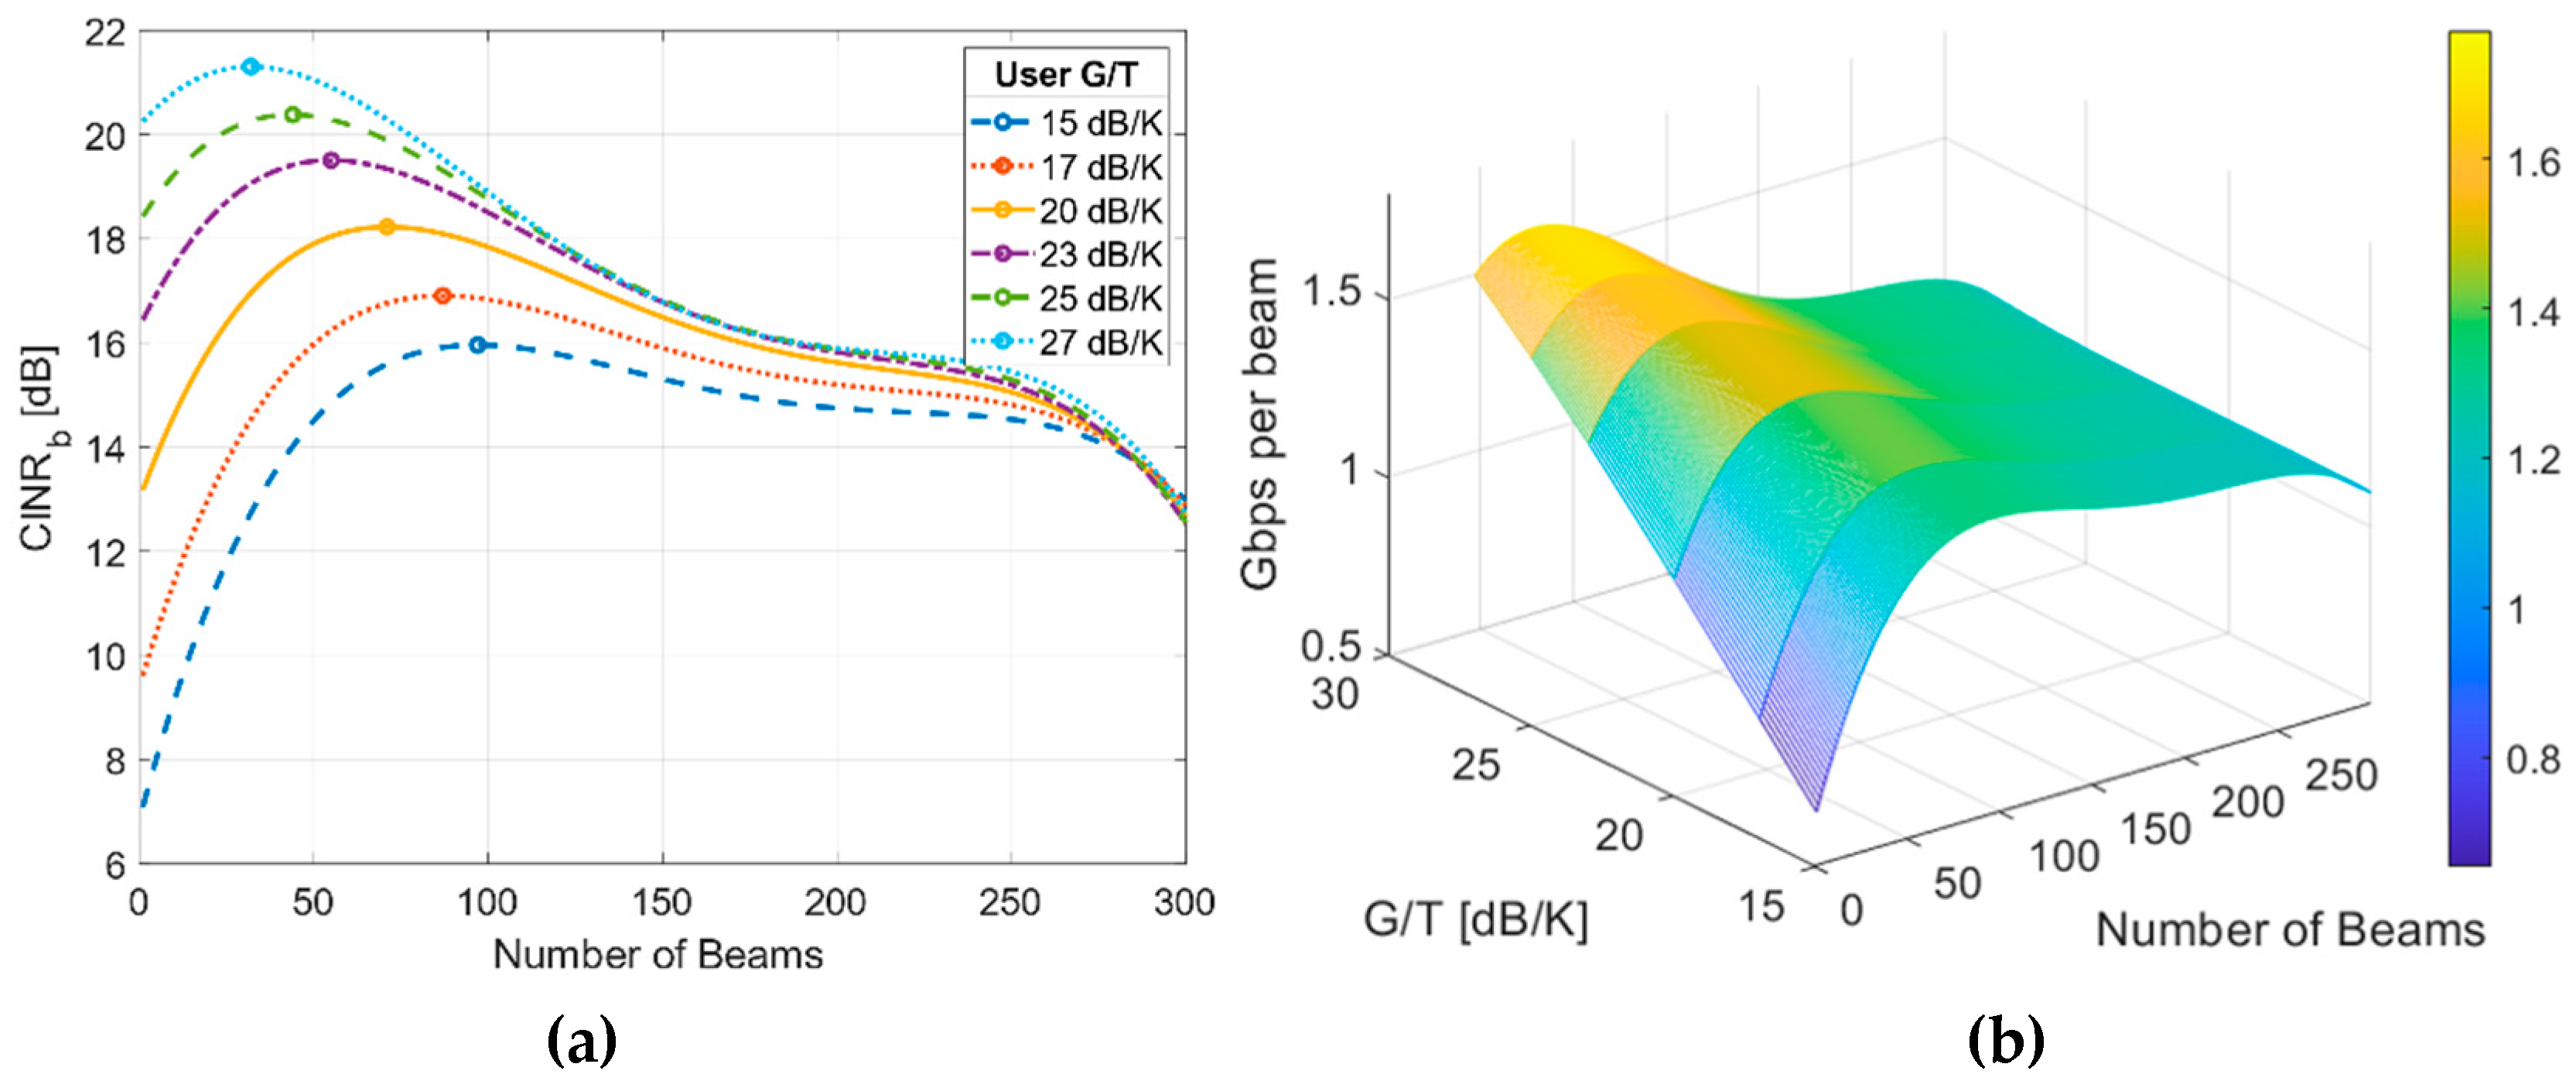
Figure 6a shows the average
depending on the number of beams and the user
G/
T. It is shown that when the required user
G/
T increases, the optimal number of beams decreases and the average
increases. The same idea applies to the maximum beam capacity (
Figure 6b); if
G/
T increases, the optimal number of beams decreases and the Gbps per beam increases.
There is a trade-off because the number of beams has a strong impact on factors such as the total capacity of the satellite, the satellite mass (14), the total satellite cost (15) and therefore the cost of Gbps in orbit.
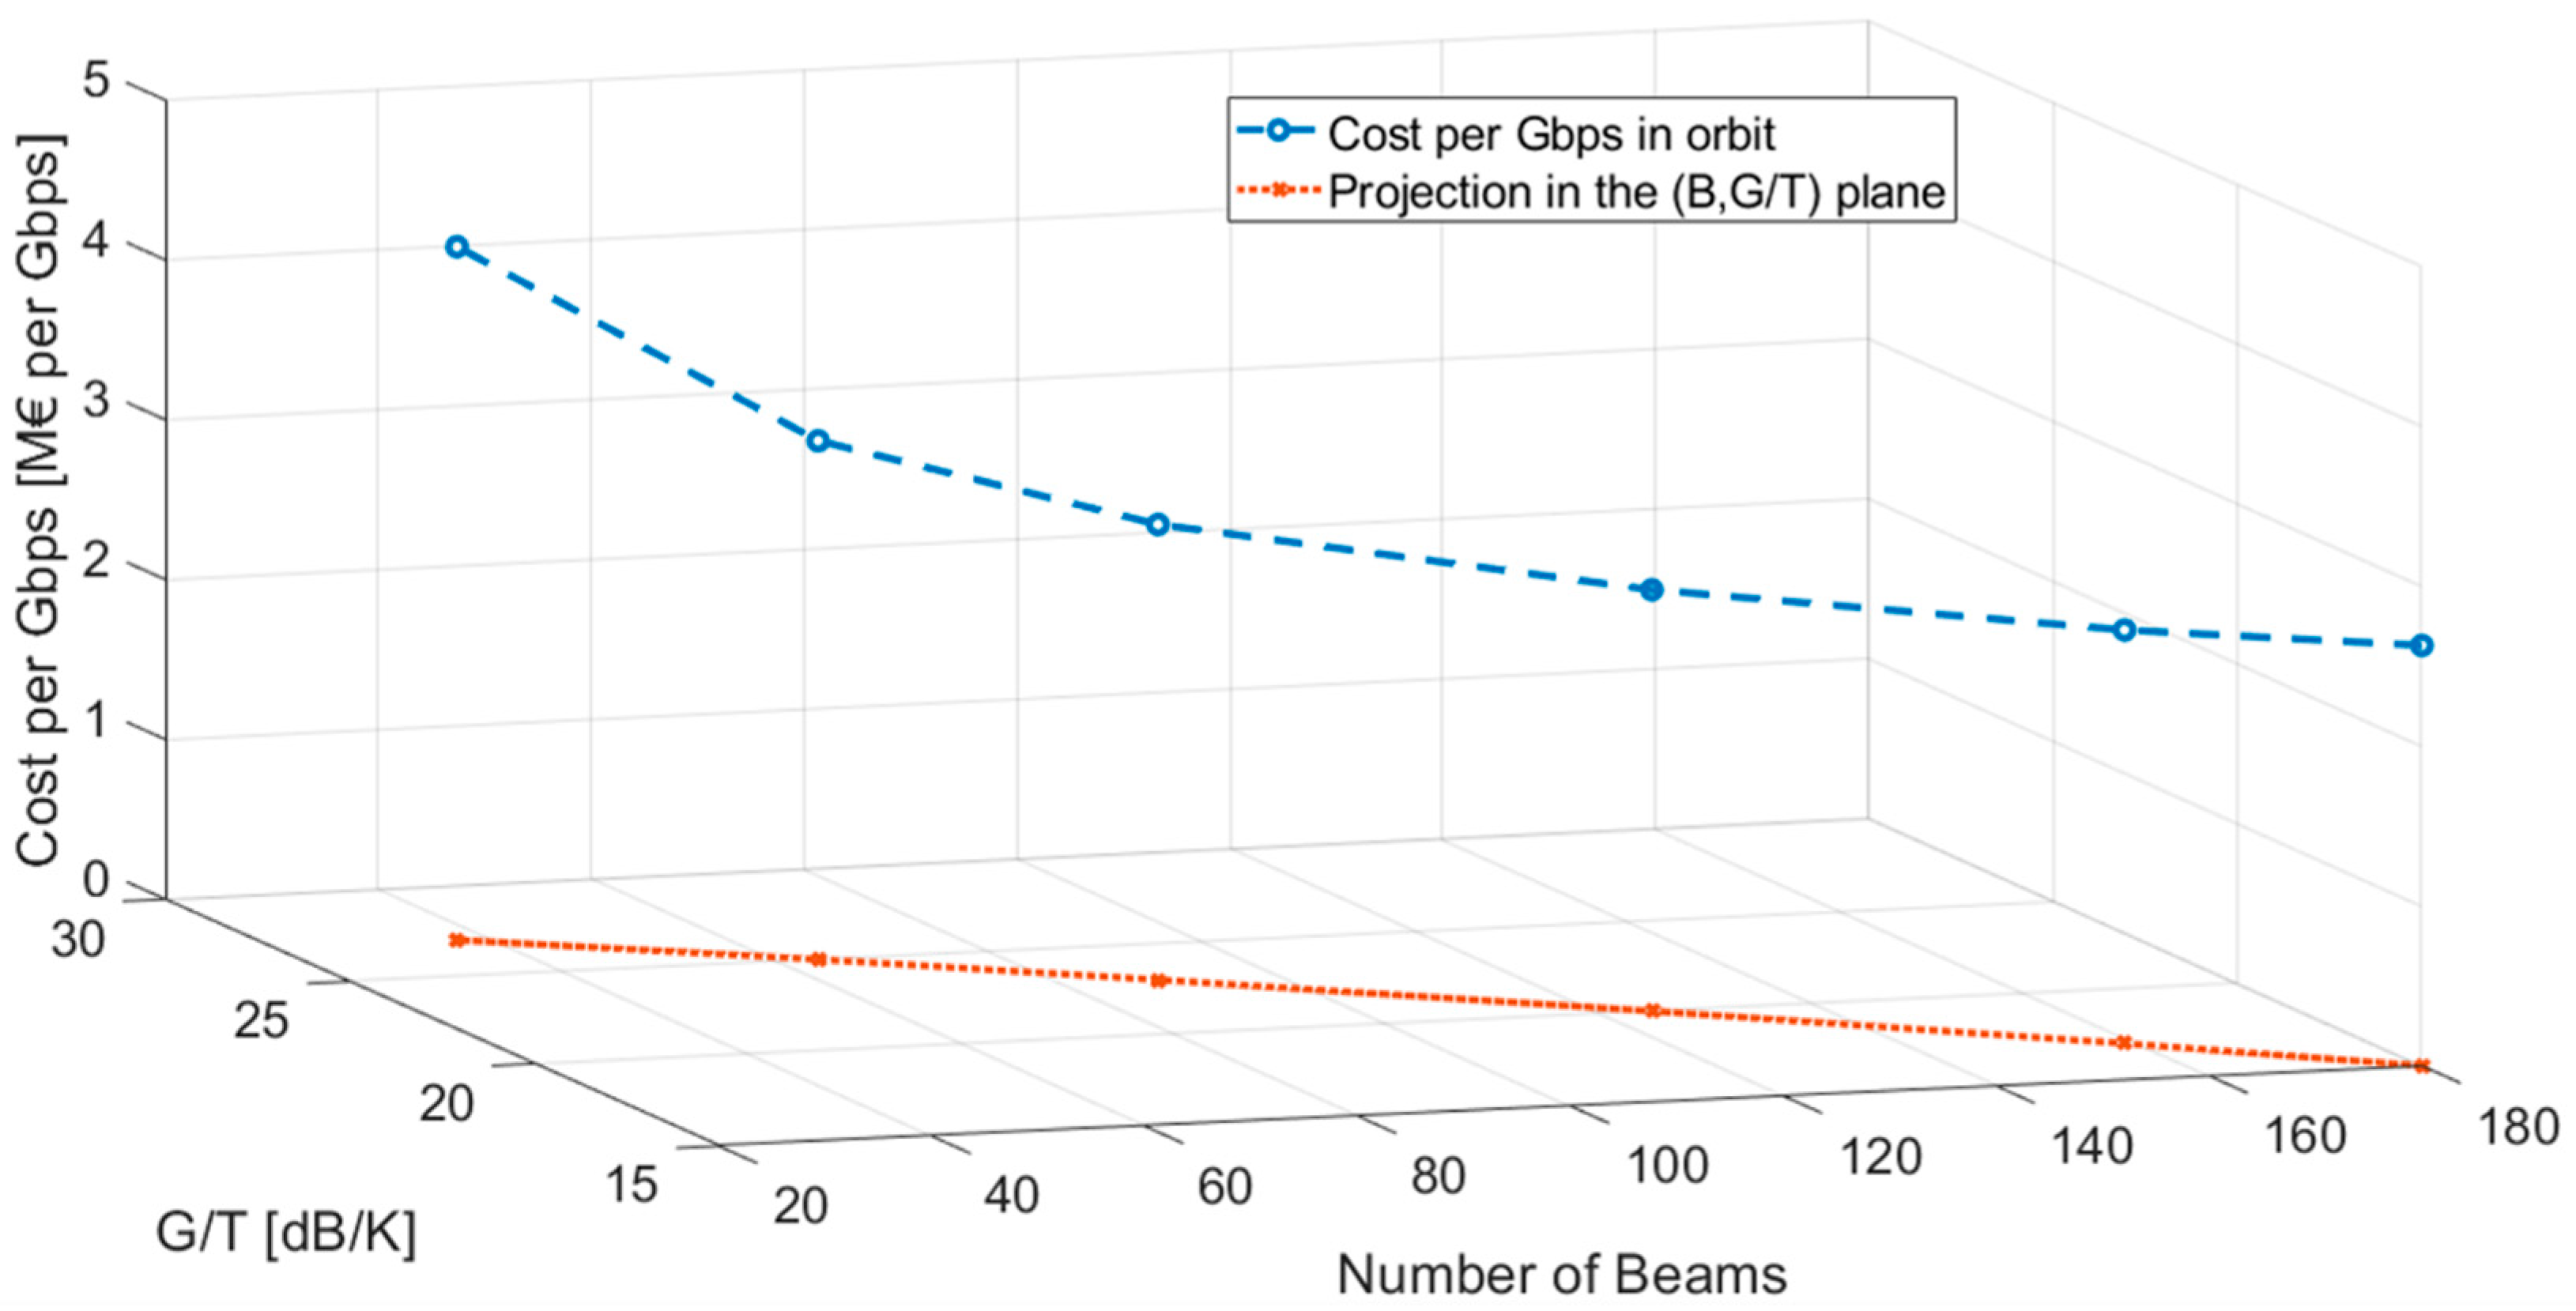
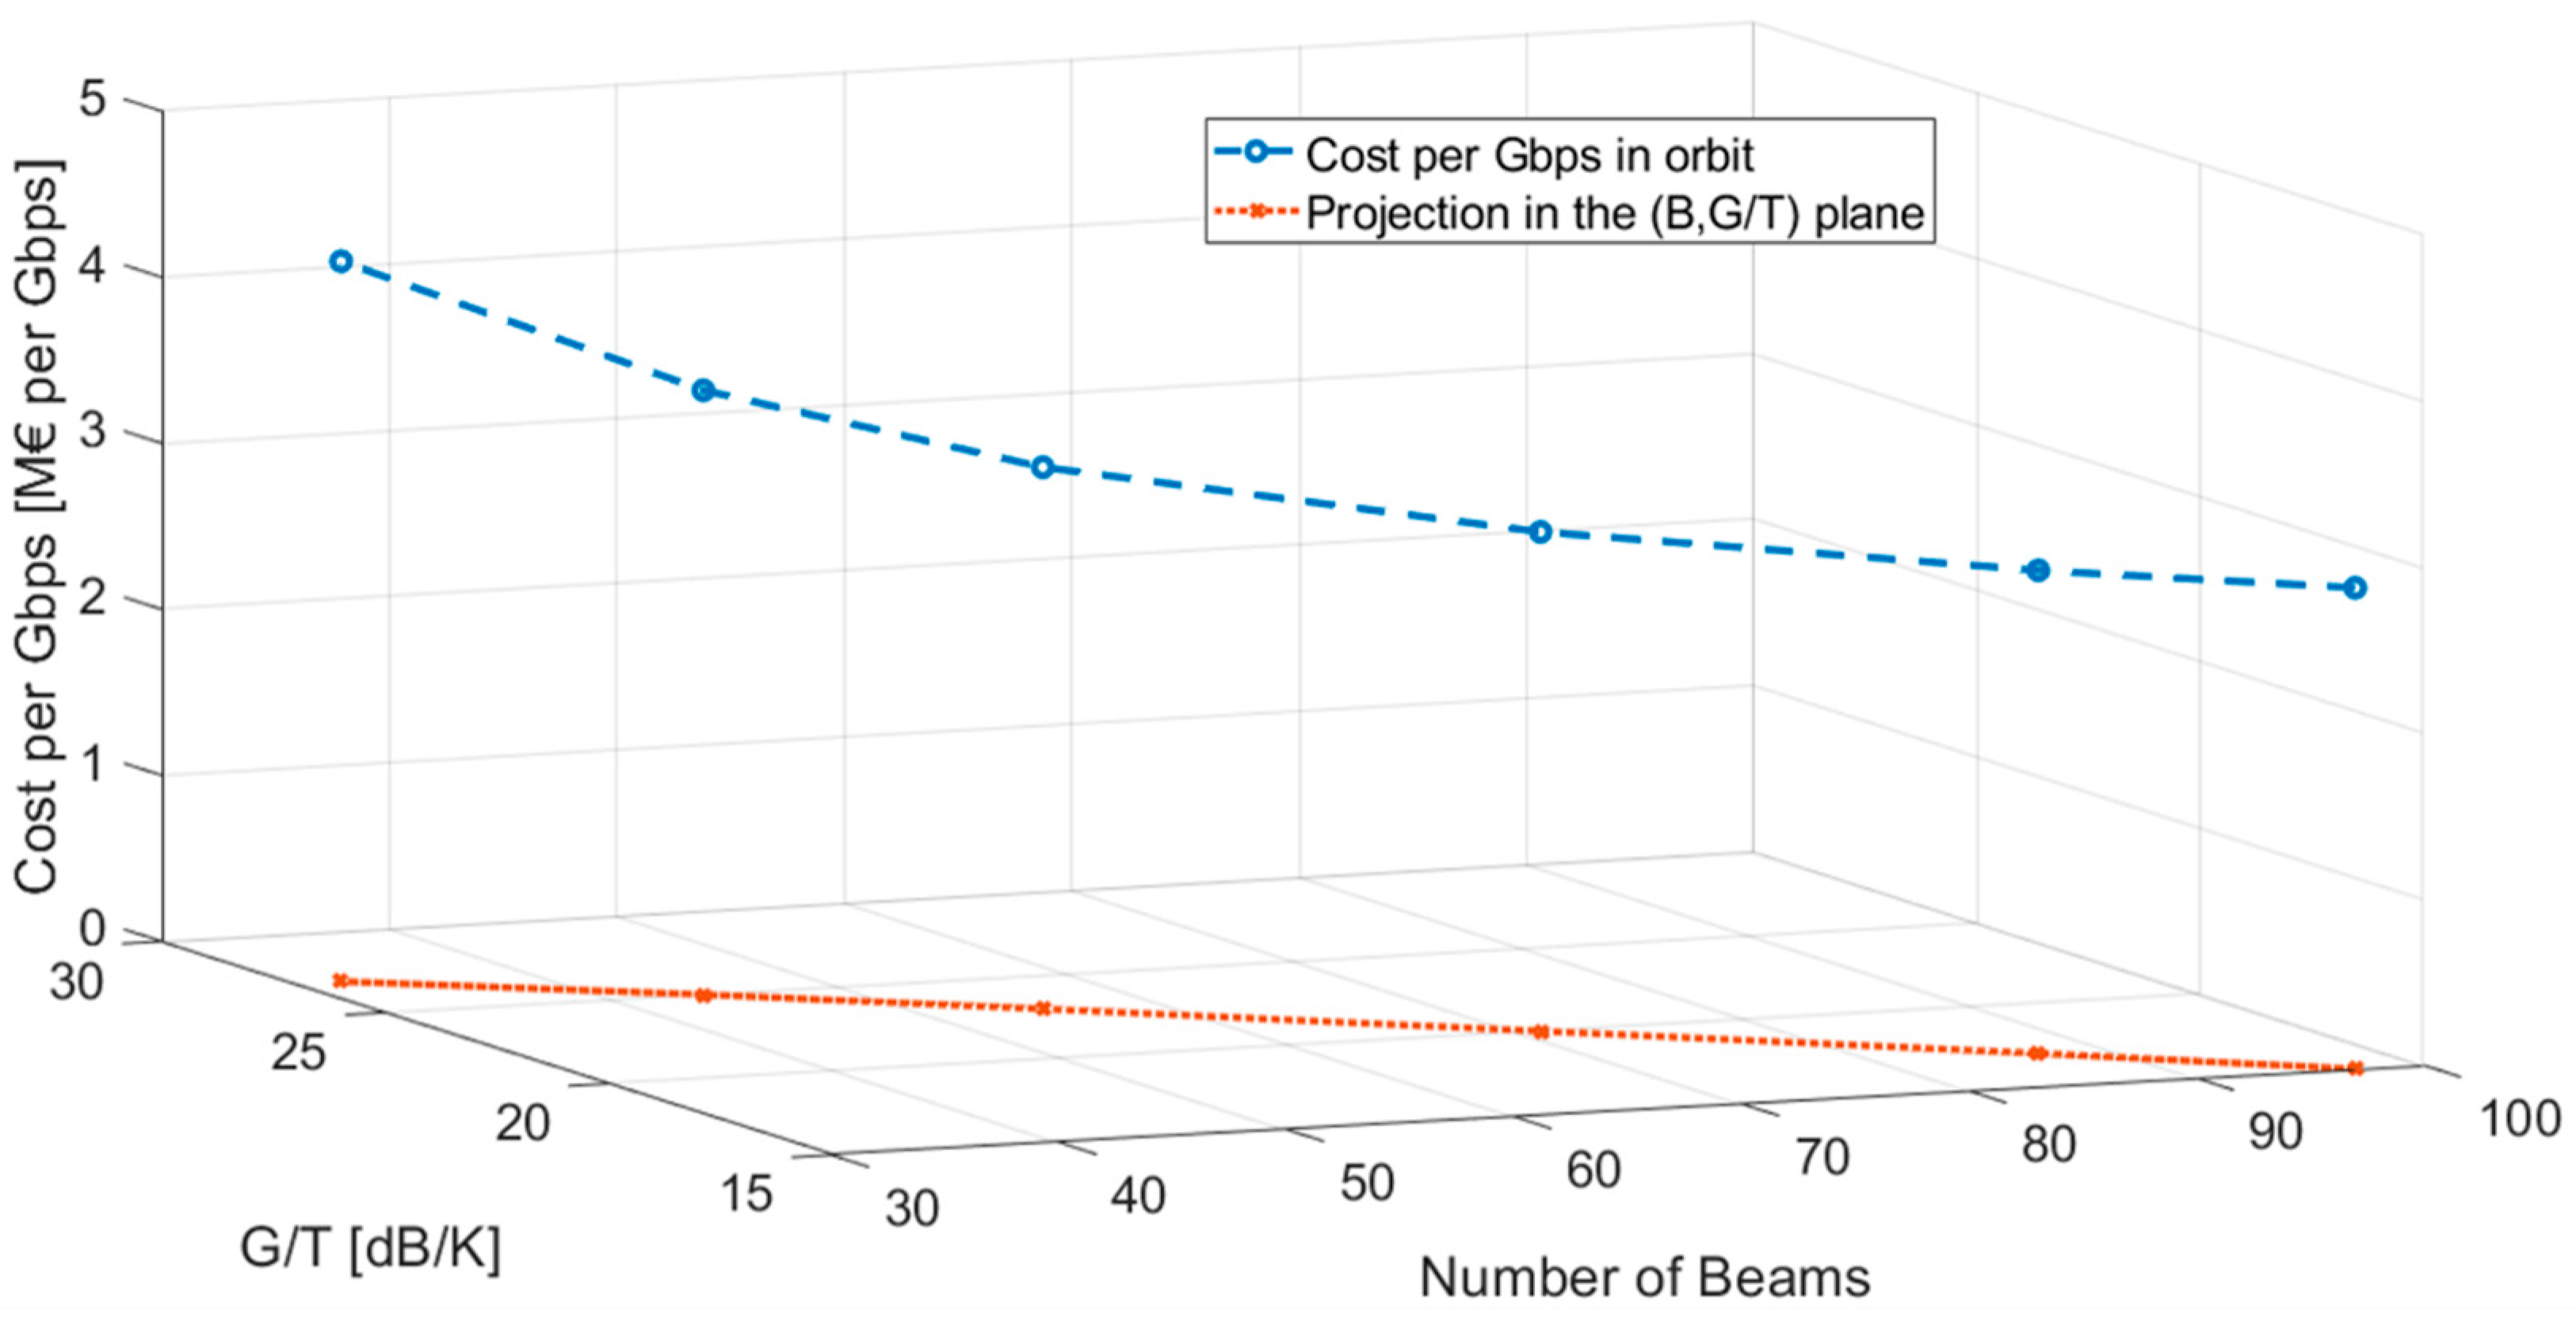
Figure 7 shows the cost per Gbps in orbit that would be obtained for the optimal number of beams with different user
G/
T for scenario 1.
The decision factors are shown in
Table 1, showing the optimal number of beams for a set of user
G/
T along with KPIs (satellite capacity, satellite mass, system cost, and cost per Gbps in orbit).
Table 2 shows that when the user
G/
T decreases, the optimal number of beams increases. However, the
and beam capacity decrease due to cochannel interference, and the number of gateways and total cost increase. On the other hand, the total system capacity increases and therefore the cost per Gbps in orbit decreases.
The minimum cost per Gbps in orbit is obtained for a
G/
T of 15 dB/K and an optimal number of beams of 180. To achieve these conditions, the maximum cost of the system is 41 M€ higher than required (see
Table 1). For this reason, the lowest possible cost per Gbps in orbit fully compliant with requirements of
Table 1 is obtained when the user
G/
T is 17 dB/K and the number of beams is 159. This minimum cost is 2.5869 M€ per Gbps in orbit.
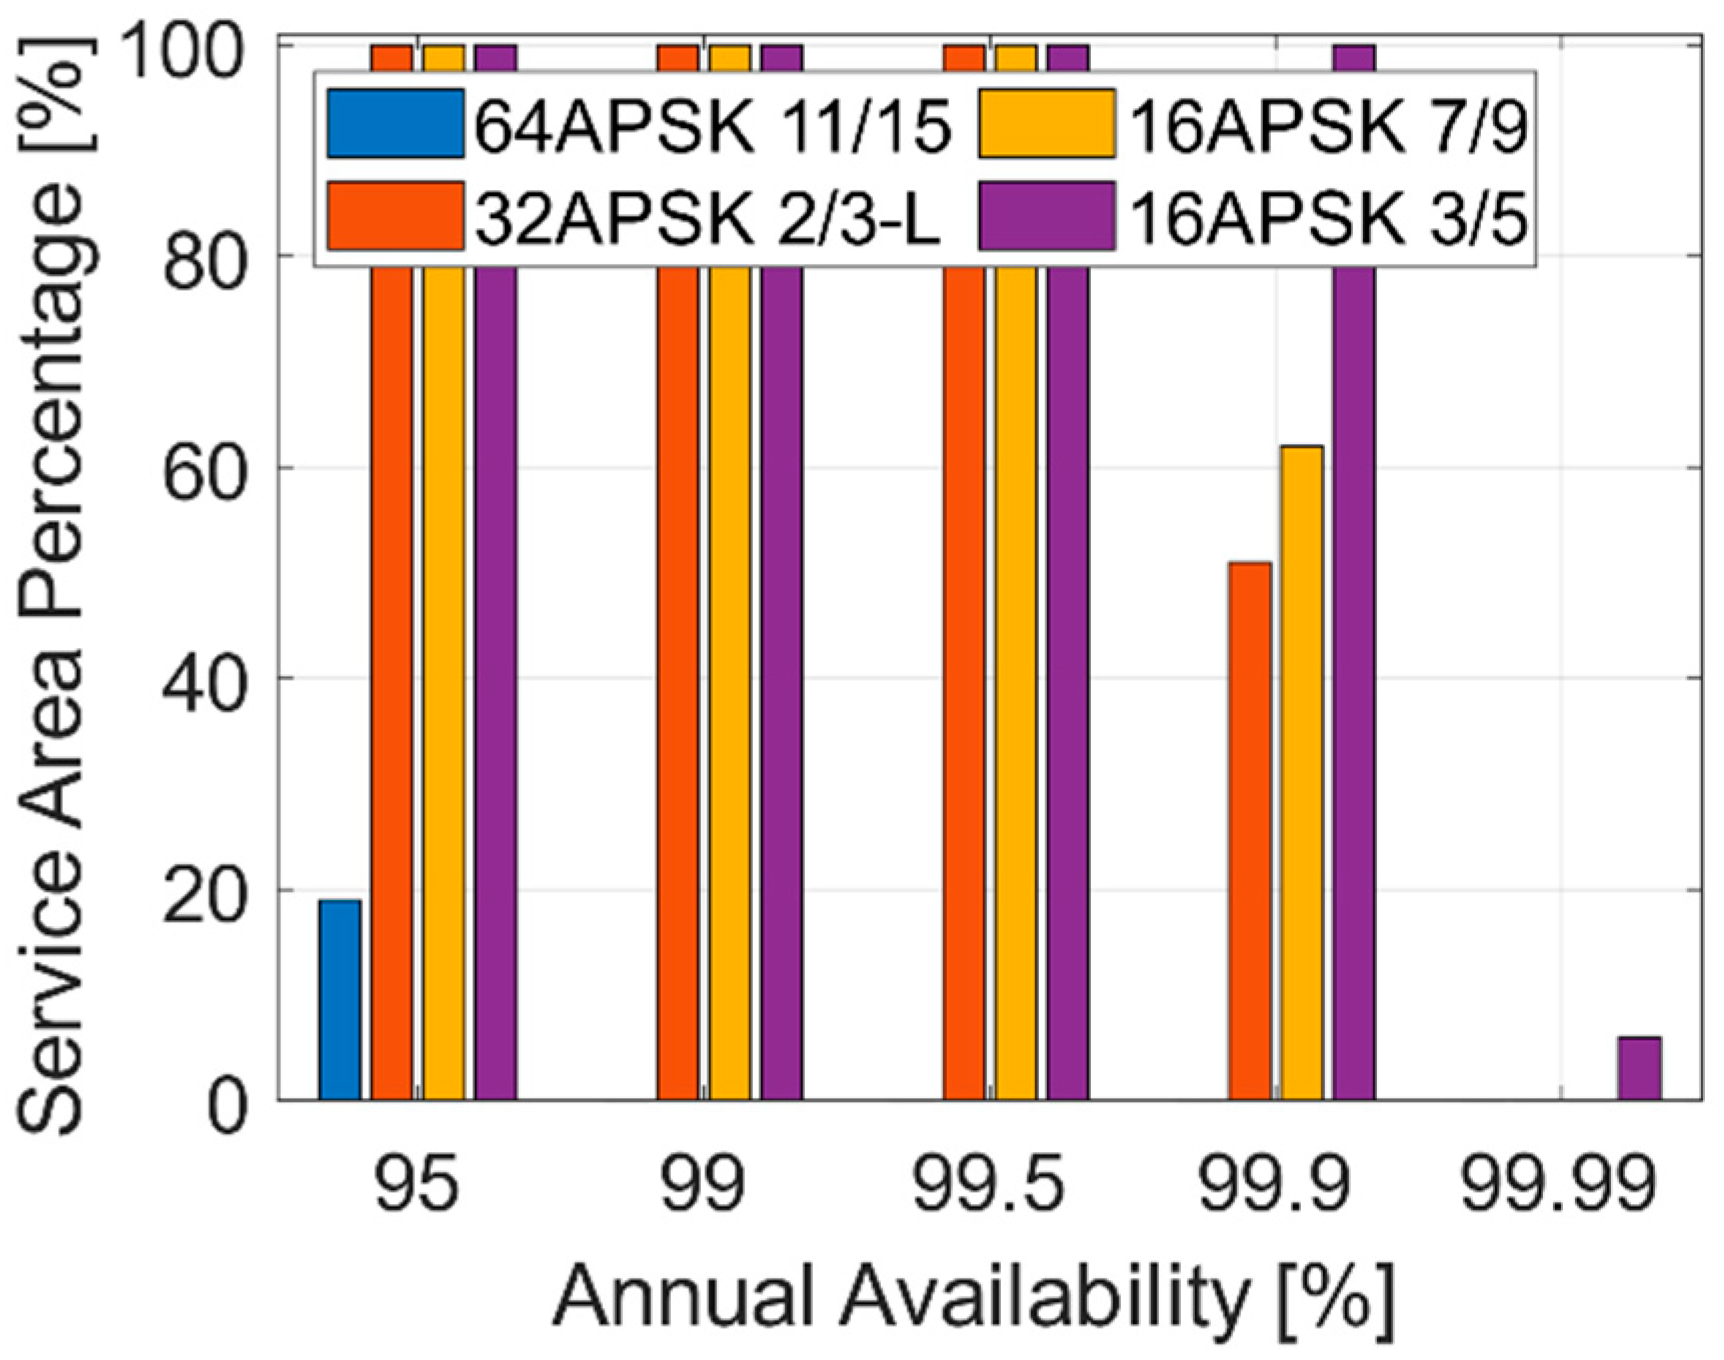
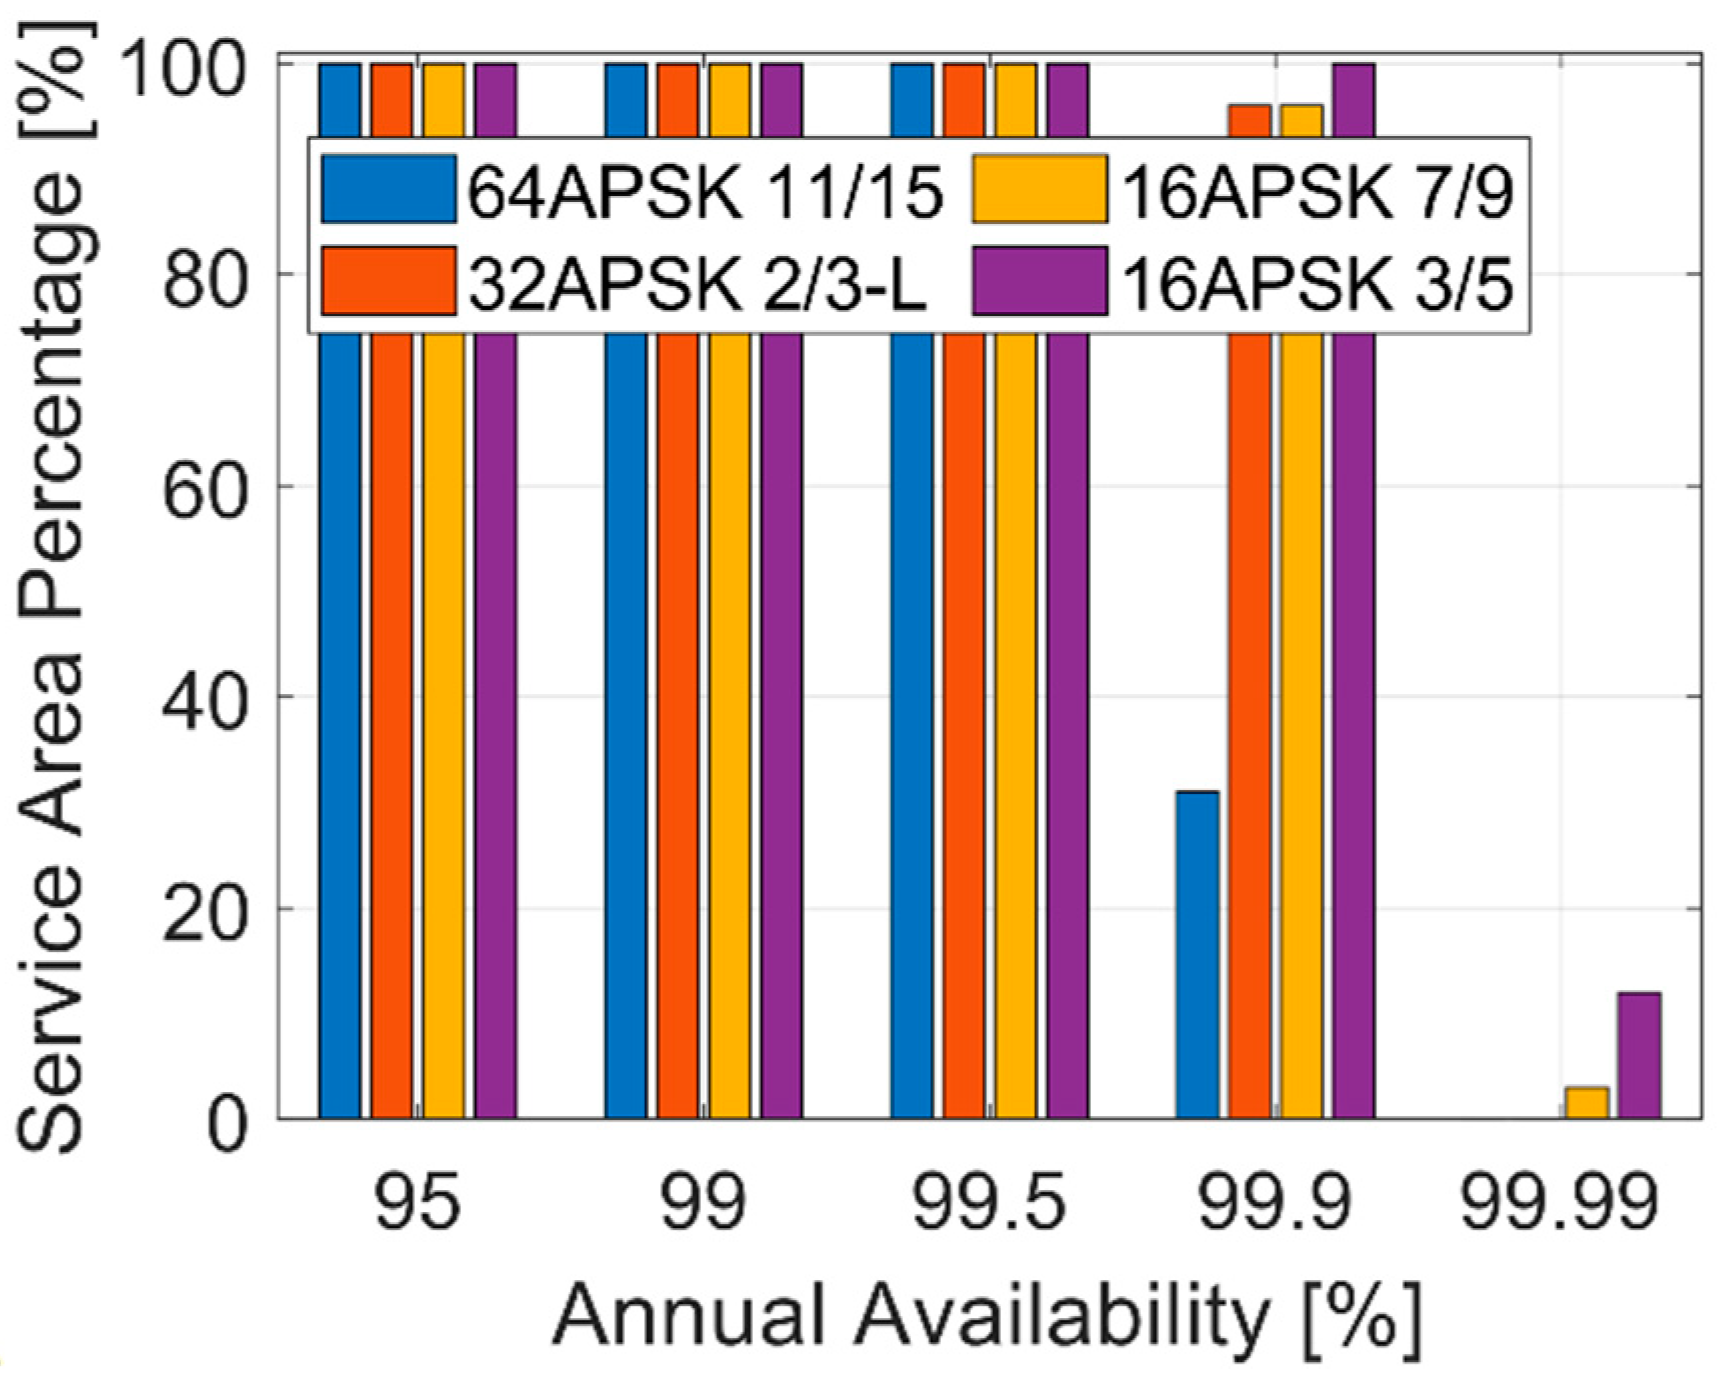
In the second step of the methodology, the service area percentage for a limited set of DVB-S2X ModCods has been calculated.
Figure 8 shows the results using CCM for a user G/T of 17 dB/K, 159 beams, and different link availabilities. The use of 64APSK 11/15 is not feasible, and with 32APSK 2/3-L or 16APSK 7/9, the maximum link availability is 99.7%. Thus, in order to meet the 99.9% requirement, 16APSK 3/5 shall be used.
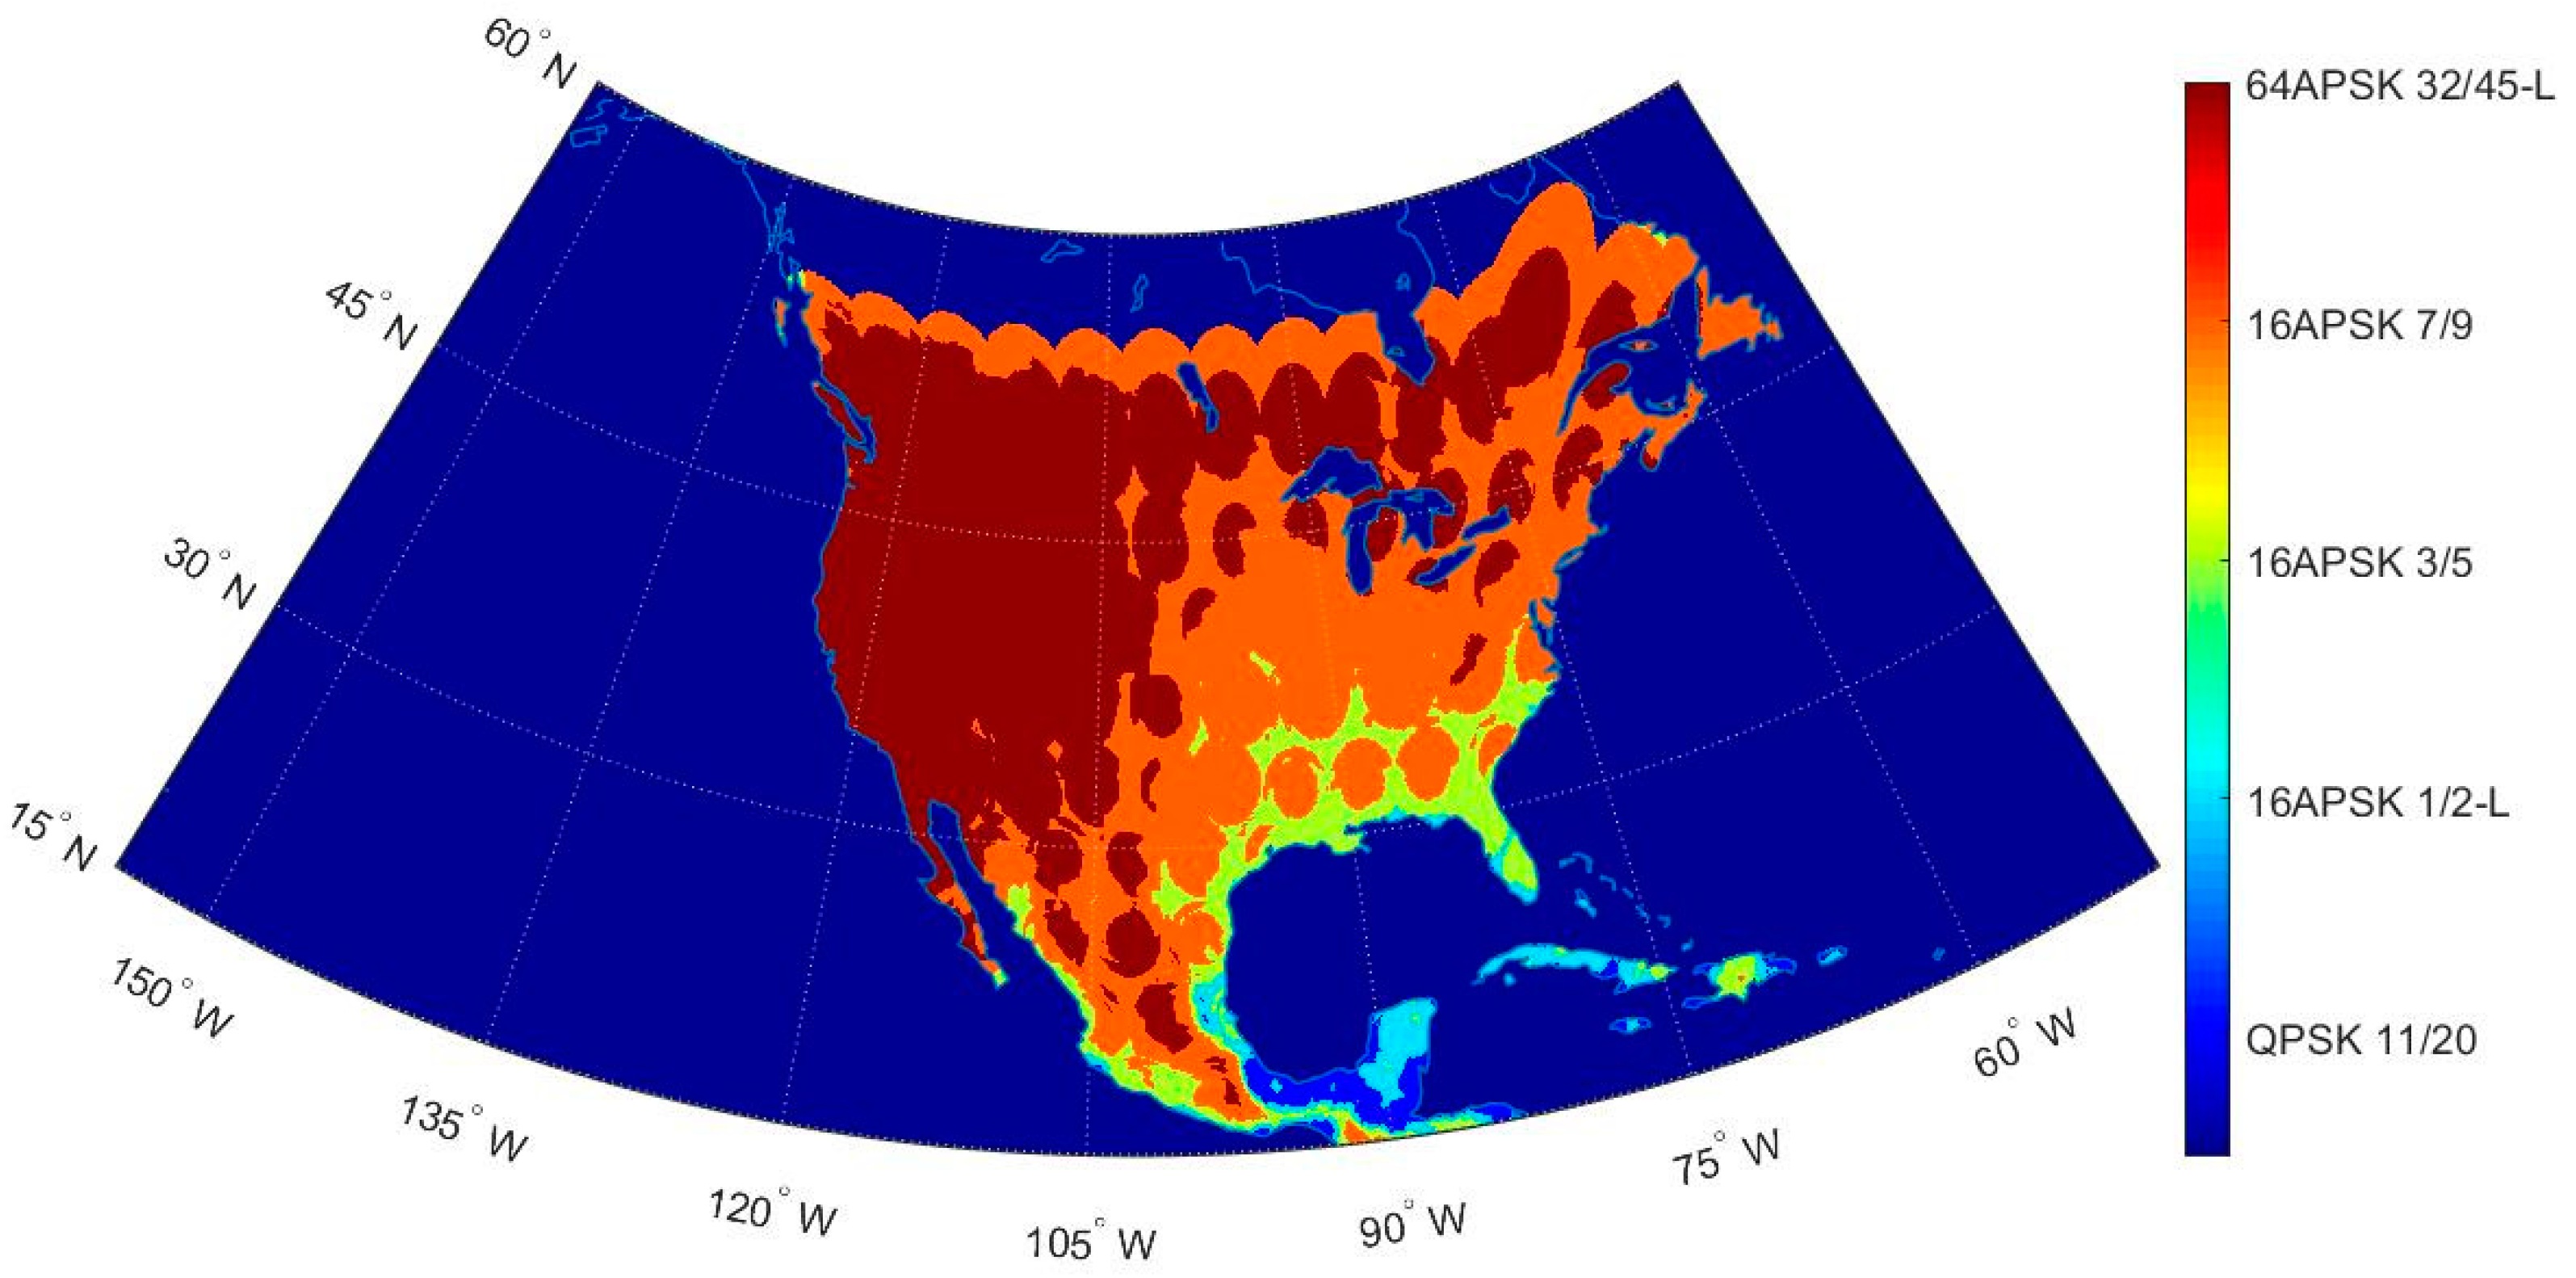
Figure 9 shows the distribution of ModCods in the service area with VCM for scenario 1. Five different ModCods were used: 64APSK 32/45-L, 16APSK 7/9, 16APSK 3/5, 16APSK ½-L, and QPSK 11/20. It can be seen that the ModCod assignment in the service area varies according to the link condition of each site.
In terms of satellite capacity, 94.2 Gbps is obtained using CCM and 129.75 Gbps with VCM for 99.9% availability.
5.2. Scenario 2
Following the proposed methodology, the average
CINRb for scenario 2 for different user
G/
T is represented in
Figure 10a. As expected, when the user
G/
T increases, the optimal number of beams decreases, and the tradeoff motivated by the increase in cochannel interference for large number of beams appears.
Figure 10b shows the capacity per beam for scenario 2, with a non-monotonic behavior with the number of beams.
Figure 11 shows the reduction in the cost per Gbps in orbit with the increase in the optimal number of beams for different user
G/
T for scenario 2. Compared to the first scenario, the optimal number of beams and the total cost of the system is reduced, as it corresponds to a system with lower capacity requirements and reduced service area.
The decision factors of the first step of the methodology are presented in
Table 3. The minimum feasible user
G/
T in scenario 2 is 15 dB/K. There is a trade-off again because the
CINRb, the capacity per beam, and the cost per Gbps in orbit decrease, but the number of gateways, the total cost of the system, and total capacity of the system increase.
In scenario 2, when the user
G/
T is 15 dB/K and the number of beams is 97, a minimum possible cost of 2.8986 M€ per Gbps in orbit is obtained, which exceeds the specified system cost in 25 M€ (see
Table 1). For this reason, the minimum possible cost per Gbps in orbit that meets with all the requirements is 2.9091 M€ per Gbps, achieved for a user
G/
T of 17 dB/K and 87 beams.
For scenario 2, the percentage of the service area that meets the requirements for 17 dB/K, 87 beams, and different availabilities in case of using CCM is shown in
Figure 12. It is observed that in scenario 2, it is feasible to use 64APSK 11/15 up to an availability of 99.7%. When using 32APSK 2/3-L, 16APSK 7/9, or 16APSK 3/5, 99.9% is the maximum link availability that meets the minimum service area percentage.
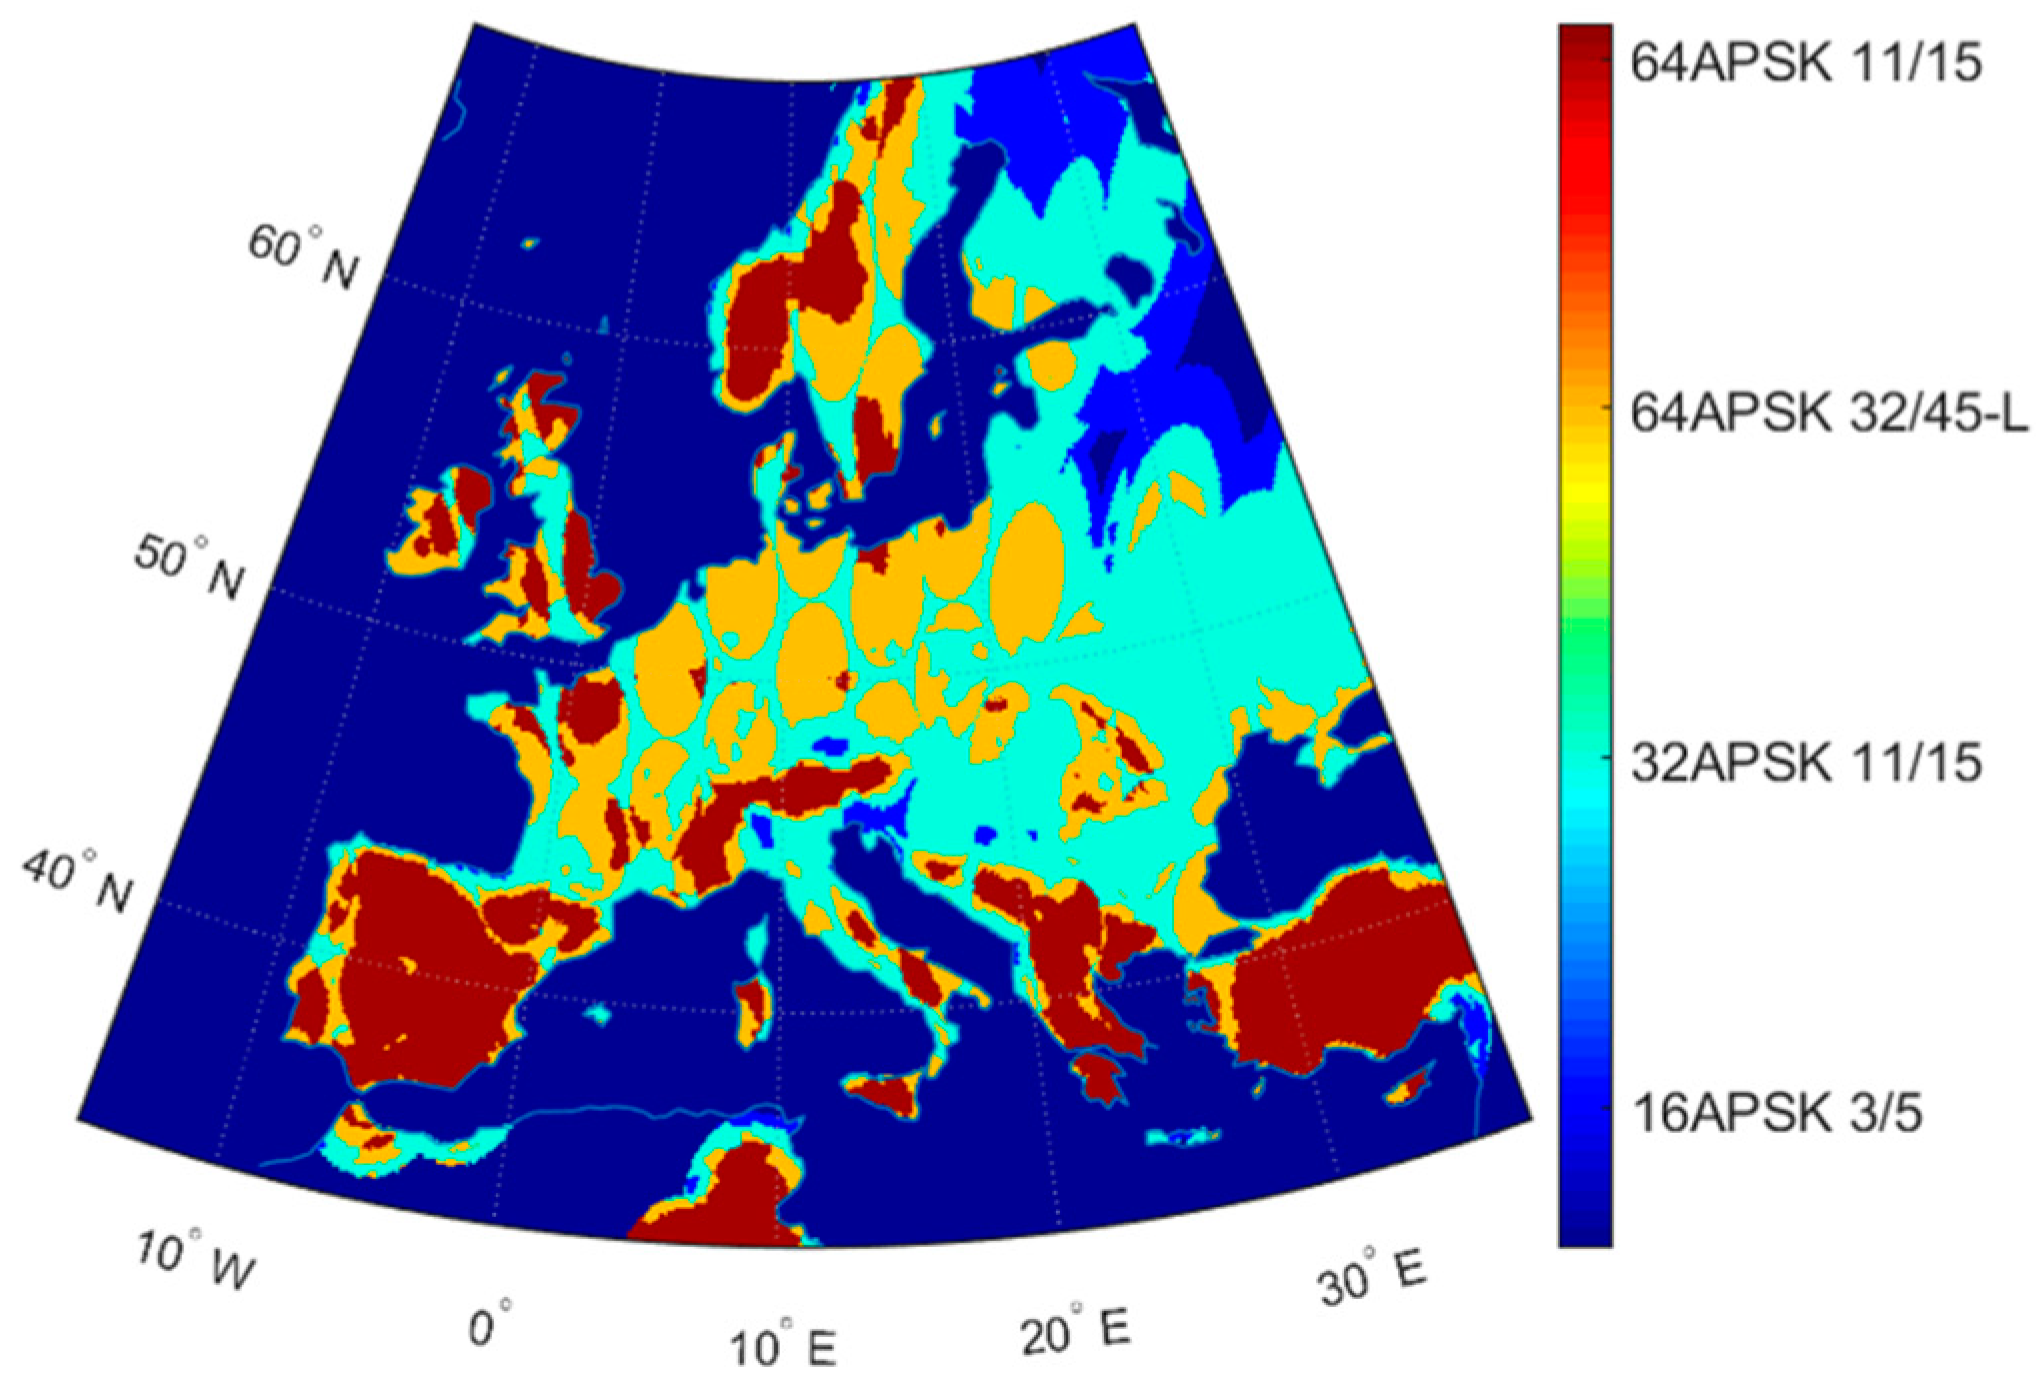
Figure 13 shows the distribution of ModCods within the service area for VCM. Availability can be increased up to 99.9%, meeting 100% SAP compliance by using four different ModCods in the service area (64APSK 11/15, 16APSK 32/45-L, 32APSK 11/15, and 16APSK 3/5).
For CCM, all evaluated ModCods have an SAP below 98% for a link availability of 99.9% except 16APSK 3/5, which is 100% SAP compliant (
Figure 9). In a VCM scheme for 99.9%, there are geographical coordinates where a ModCod 64APSK 11/15 can be used, although there are also coordinates that use 16APSK 3/5 (
Figure 10). Comparing CCM and VCM for scenario 2, a satellite capacity of 51.54 Gbps using CCM and 78.16 Gbps using VCM are achieved.
6. Discussion
It is important to note that the second scenario has two main different considerations that had an important impact on the obtained results:
The service area is smaller than for scenario 1. It means that for the same number of beams the beamwidth is smaller in scenario 2. Therefore, the directivity is greater and the satellite antenna diameter will be larger.
Rain attenuation is completely different in the two scenarios. This affects the link availability that depends on the selected ModCod and on the service area percentage in VCM.
If we analyze the cost per Gbps in orbit, in scenario 1, the cost per Gbps in orbit is between 2.63 and 4.34 M€, while in scenario 2 the range is from 2.90 to 4.34 M€. For the same user G/T, the cost per Gbps in orbit is lower for higher satellite capacities.
In scenario 1, for a given user G/T increase, the optimal number of beams changes faster than in scenario 2, thus limiting the capacity per beam in scenario 1.
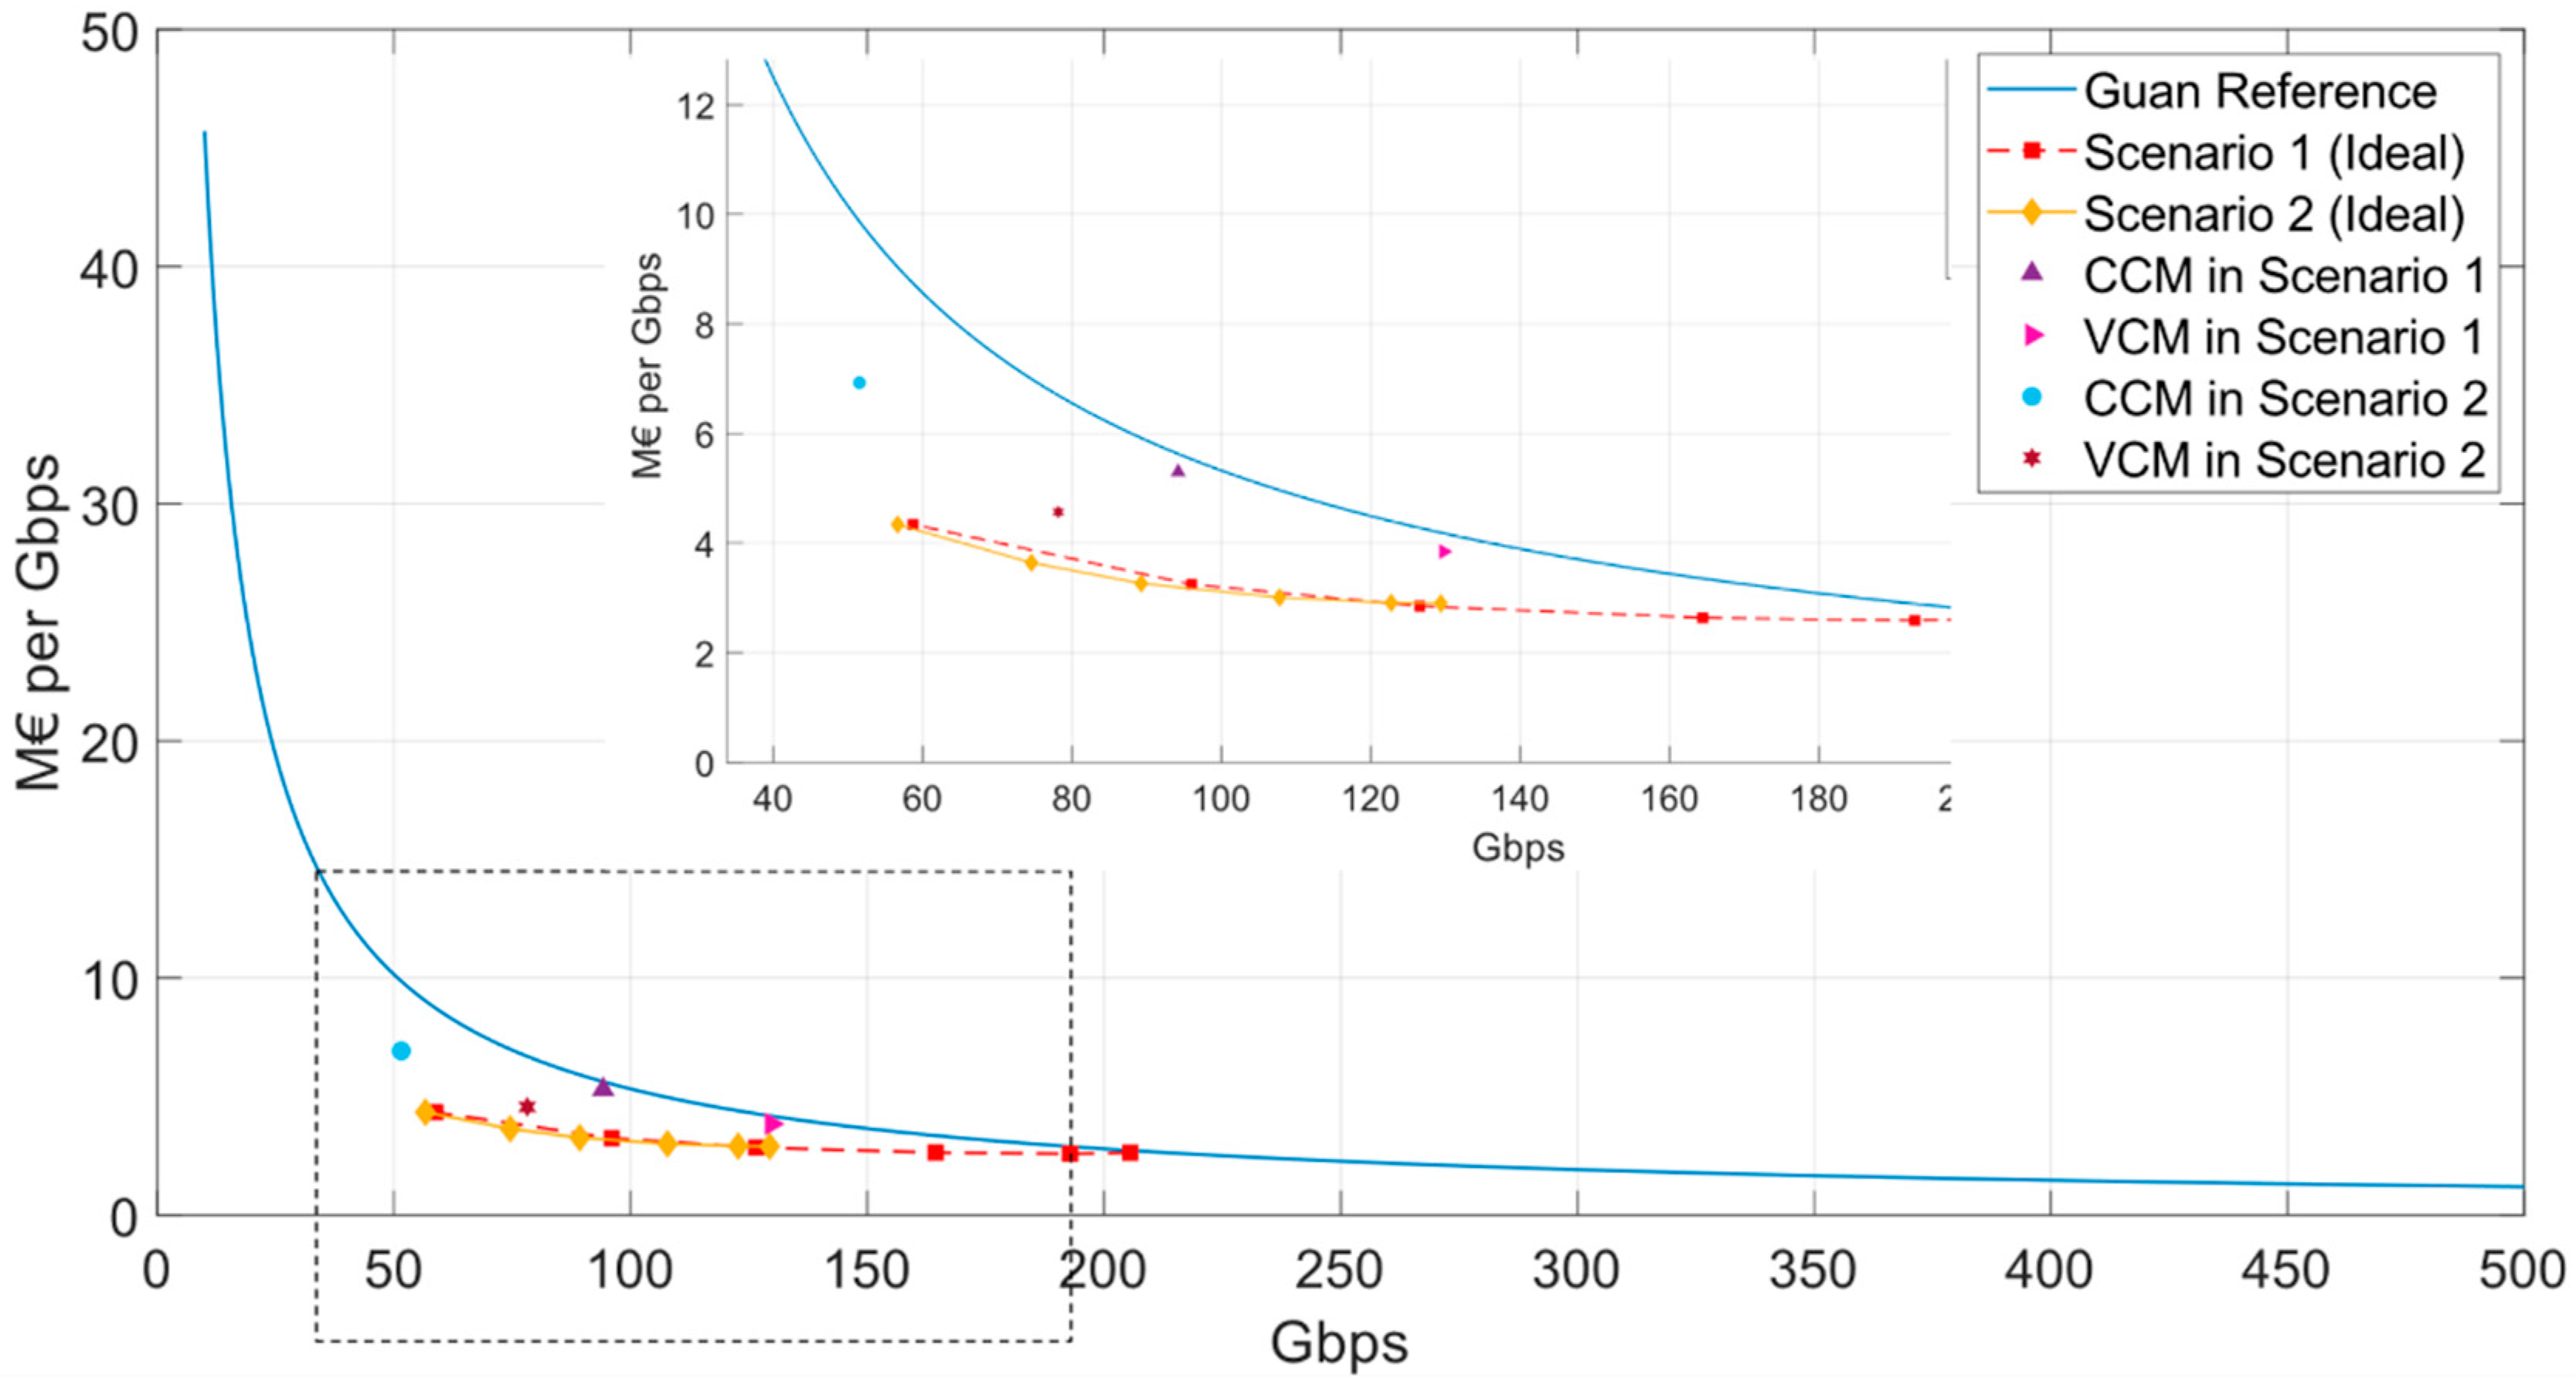
This methodology minimizes the cost per Gbps in orbit, as shown when the results are compared with the affordability curve presented in [
3]. Both scenario 1 and scenario 2 remain below the reference curve, as shown in
Figure 14. The reference curve presented in [
3] does not take into account launch and ground segment costs. However, in this paper an average launch cost of 100 million euros has been added, plus a fixed cost of 80 million euros as a minimum price for a broadband payload, which is added to the corresponding ground segment cost (see
Figure 14).
7. Conclusions
This contribution presents a methodology for the evaluation of VHTS satellite networks, taking into account technical and commercial requirements. The method is based on the use of an analytical expression of the as a function of the user G/T, the number of beams, and link availability. The methodology helps to evaluate the trade-off resulting from the different combinations of user G/T, the optimal number of beams, and the system cost. In addition, the cost per Gbps in orbit for clear sky conditions and the actual channel capacity using CCM or VCM for different link availabilities are obtained.
The method includes the contribution of the ground segment cost to the total system cost and evaluates the number of required gateways. The results considering the Q/V band in the feeder link have been presented. In the scenarios under study, up to two redundant gateways would be required to ensure an availability above 99.9% in case the Q/V band is used in the feeder link by using the model in [
29]. A redundant gateway is added to the network when a nominal gateway is in outage due to a heavy rain attenuation, therefore, all traffic from nominal gateway impaired is rerouted to redundant gateway assigned, ensuring high availability on the network.
The proposed methodology is flexible, since the system designer can modify input values ad-hoc, such as the service area, technical and commercial requirements, and system constraints, to evaluate the impact on the KPIs and thus select the most appropriate solution.
The methodology has been validated in two service areas with different characteristics (North America and Europe) to compare the results of the cost per Gbps in orbit. The results show realistic KPI figures and their variation with the number of beams and the user G/T.
As future work, the methodology will be extended to include the return link, adding new requirements, constraints, cost models, and KPIs to consider ACM (Adaptive Coding and Modulation) and the use of flexible payloads and irregular beams.
Author Contributions
Conceptualization, F.G.O.-G. and R.M.; methodology, F.G.O.-G. and R.M.; software, F.G.O.-G.; validation, R.M., M.A.S.-N. and S.L.-A.; formal analysis, F.G.O.-G. and R.M.; investigation, F.G.O.-G. and A.C.; writing—original draft preparation, F.G.O.-G.; writing—review and editing, R.M. and M.A.S.-N.; supervision, R.M., M.A.S.-N. and S.L.-A.; project administration, R.M.; funding acquisition, R.M. All authors have read and agreed to the published version of the manuscript.
Funding
This work has been supported by the Spanish Government, Ministerio de Economía, Industria y Competitividad through the National Program of Research, Development and Innovation within the FUTURE-RADIO project under Grant TEC2017-85529-C3-1-R and a PhD scholarship provided by Universidad Politécnica de Madrid.
Acknowledgments
This paper was made possible thanks to the Spanish Government and the Universidad Politécnica de Madrid for their financial support.
Conflicts of Interest
The authors declare no conflict of interest.
Appendix A
Table A1 and
Table A2 show the parameters
used to fit the
(Equation (16)) for different link availabilities within a confidence interval of 99.1%.
Table A1.
Parameters as a function of availability in scenario 1.
Table A1.
Parameters as a function of availability in scenario 1.
| Link Availability |
|---|
| 95% | 99% | 99.9% | 99.99% |
|---|
| −17.41 | −16.99 | −15.35 | −20.12 |
| 1.706 | 1.522 | 0.8099 | 4.196x10⁻¹ |
| −8.521 × 10⁻³ | −1.305 × 10⁻³ | 2.356 × 10⁻² | 2.502 × 10⁻² |
| −1.914 × 10⁻⁴ | −2.675 × 10⁻⁴ | −5.118 × 10⁻⁴ | −3.327 × 10⁻⁴ |
| 2.194 × 10⁻¹ | 2.03 × 10⁻¹ | 1.282 × 10⁻¹ | 8.972 × 10⁻² |
| −5.54 × 10⁻³ | −3.56 × 10⁻³ | 2.455 × 10⁻³ | 4.371 × 10⁻³ |
| −1.186 × 10⁻⁴ | −1.657 × 10⁻⁴ | −2.526 × 10⁻⁴ | −1.283 × 10⁻⁴ |
| 1.912 × 10⁻⁶ | 2.213 × 10⁻⁶ | 2.483 × 10⁻⁶ | 3.253 × 10⁻⁷ |
| −8.65 × 10⁻⁴ | −8.248 × 10⁻⁴ | −5.308 × 10⁻⁴ | −3.237 × 10⁻⁴ |
| 1.779 × 10⁻⁵ | 1.395 × 10⁻⁵ | 8.686 × 10⁻⁷ | −6.341 × 10⁻⁶ |
| 7.45 × 10⁻⁸ | 1.195 × 10⁻⁷ | 1.731 × 10⁻⁷ | 1.022 × 10⁻⁷ |
| 1.433 × 10⁻⁶ | 1.412 × 10⁻⁶ | 9.06 × 10⁻⁷ | 6.658 × 10⁻⁷ |
| −1.847 × 10⁻⁸ | −1.621 × 10⁻⁸ | −4.887 × 10⁻⁹ | 2.422 × 10⁻⁹ |
| −8.19 × 10⁻¹⁰ | −8.32 × 10⁻¹⁰ | −5.23 × 10⁻¹⁰ | −4.60 × 10⁻¹⁰ |
Table A2.
Parameters as a function of availability in scenario 2.
Table A2.
Parameters as a function of availability in scenario 2.
| Link Availability |
|---|
| 95% | 99% | 99.9% | 99.99% |
|---|
| −14.44 | −13.88 | −10.85 | −18.82 |
| 1.474 | 1.276 | 4.427 × 10⁻¹ | 5.107 × 10⁻¹ |
| 5.618 × 10⁻⁴ | 7.985 × 10⁻³ | 3.639 × 10⁻² | 2.053 × 10⁻² |
| −2.844 × 10⁻⁴ | −3.621 × 10⁻⁴ | −6.394 × 10⁻⁴ | −2.688 × 10⁻⁴ |
| 4.097 × 10⁻¹ | 3.769 × 10⁻¹ | 2.216 × 10⁻¹ | 1.916 × 10⁻¹ |
| −6.46 × 10⁻³ | −2.588 × 10⁻³ | 1.223 × 10⁻² | 6.362 × 10⁻³ |
| −3.309 × 10⁻⁴ | −4.188 × 10⁻⁴ | −6.966 × 10⁻⁴ | −1.417 × 10⁻⁴ |
| 4.277 × 10⁻⁶ | 4.836 × 10⁻⁶ | 6.286 × 10⁻⁶ | −8.15 × 10⁻⁷ |
| −3.287 × 10⁻³ | −3.145 × 10⁻³ | −2.356 × 10⁻³ | −1.813 × 10⁻³ |
| 5.044 × 10⁻⁵ | 3.603 × 10⁻⁵ | −2.065 × 10⁻⁵ | −2.365 × 10⁻⁵ |
| 4.716 × 10⁻⁷ | 6.266 × 10⁻⁷ | 1.085 × 10⁻⁶ | 3.131 × 10⁻⁷ |
| 1.109 × 10⁻⁵ | 1.102 × 10⁻⁵ | 9.853 × 10⁻⁶ | 7.992 × 10⁻⁶ |
| −1.145 × 10⁻⁷ | −9.79 × 10⁻⁸ | −2.46 × 10⁻⁸ | 2.355 × 10⁻⁸ |
| −1.291 × 10⁻⁸ | −1.323 × 10⁻⁸ | −1.348 × 10⁻⁸ | −1.219 × 10⁻⁸ |
References
- Fenech, H.; Amos, S.; Hirsch, A.; Soumpholphakdy, V. VHTS Systems: Requirements and Evolution; European Antennas and Propagation (EUCAP): Paris, France, 2017. [Google Scholar]
- Evans, B.; Thompson, P. Key Issues and Technologies for a Terabit/s Satellite; AIAA International Communications Satellite Systems: Anaheim, CA, USA, 2010. [Google Scholar]
- Guan, Y.; Geng, F.; Saleh, J.H. Review of High Throughput Satellites: Market Disruptions, Affordability-Throughput Map, and the Cost Per Bit/Second Decision Tree. IEEE Aerosp. Electron. Syst. Mag. 2019, 34, 64–80. [Google Scholar] [CrossRef]
- Demers, Y.; Amyotte, E.; Glatre, K.; Godin, M.; Hill, J.; Liang, A.; Riel, M. Ka-Band User Antennas for VHTS GEO Applications; European Antennas and Propagation EUCAP: Paris, France, 2017. [Google Scholar]
- Competitive Digital Single Market. Towards a European Gigabit Society. In COM 587 and Staff Working Document-SWS 300; European Commission: Brussels, Belgium, 2016. [Google Scholar]
- EUTELSAT. New Generation Satellite to Deliver High-Speed Broadband Across Europe. Available online: https://www.eutelsat.com/home/satellites/future-satellites/konnect-vhts.html# (accessed on 27 January 2020).
- Morel, C.; Arapoglou, P.D.; Angelone, M.; Ginesi, A. Link Adaptation Strategies for Next Generation Satellite Video Broadcasting: A System Approach. IEEE Trans. Broadcasting 2015, 61, 603–614. [Google Scholar] [CrossRef]
- Vasayada, Y.; Gopal, R.; Ravishankar, C.; Zakaria, G.; BenAmmar, N. Architectures for next generation high throughput satellite systems. Int. J. Satell. Commun. Netw. 2016, 34, 523–546. [Google Scholar] [CrossRef]
- Ortiz-Gomez, F.G.; Martinez, R.; Salas-Natera, M.A.; Landeros-Ayala, S. Adaptive Resources Allocation for Flexible Payload Enabling VHTS Systems: Methodology and Architecture. In Proceedings of the 36th AIAA International Communications Satellite Systems Conference (ICSSC), Niagara Falls, ON, Canada, 15–18 October 2018. [Google Scholar]
- Ugolini, A.; Colavolpe, G.; Angelone, M.; Vanelli-Coralli, A.; Ginesi, A. Capacity of Interference Exploitation Schemes in Multibeam Satellite Systems. IEEE Trans. Aerosp. Electron. Syst. 2019, 55, 3230–3245. [Google Scholar] [CrossRef]
- Cocco, G.; de Cola, T.; Angelone, M.; Katona, Z.; Erl, S. Radio Resource Management Optimization of Flexible Satellite Payload for DVB-S2 Systems. IEEE Trans. Broadcasting 2017, 64, 266–1280. [Google Scholar] [CrossRef]
- Gharanjik, A. Transmission Optimization for High Throughput Satellite Systems. Ph.D. Thesis, Royal Institute of Technology, Stockholm, Sweden, 2016. [Google Scholar]
- Rossi, T.; de Sanctis, M.; Maggio, F.; Ruggieri, M.; Hibberd, C.; Togni, C. Smart Gateway Diversity Optimization for EHF Satellite Networks. IEEE Trans. Aerosp. Electron. Syst. 2019. [Google Scholar] [CrossRef]
- Jeannin, N.; Castanet, L.; Radzik, J.; Bousquet, M.; Evans, B.; Thompson, P. Smart gateways for terabit/s satellite. Int. J. Satell. Commun. Netw. 2014, 32, 93–106. [Google Scholar] [CrossRef]
- Cornejo, A.; Landeros-Ayala, S.; Martínez, R.; Matías, J.M. Analysis to Quantify and Optimize Spot Beams for a High Throughput Satellite in Ka and Q/V Bands. IEEE Lat. Am. Trans. 2019, 17, 219–227. [Google Scholar] [CrossRef]
- Serrano-Velarde, D.; Lame, E.; Fenech, H.; Rodriguez, G.F. Novel Dimensioning Method for High-Throughput Satellites: Forward Link. IEEE Trans. Aerosp. Electron. Syst. 2014, 50, 2146–2163. [Google Scholar] [CrossRef]
- Fenech, H.; Amos, S.; Hirsch, A.; Soumpholphakdv, V. High throughput satellite systems: An analytical approach. IEEE Trans. Aerosp. Electron. Syst. 2015, 51, 192–202. [Google Scholar] [CrossRef]
- Mahanti, A.; Arlitt, M.; Williamson, C. Assessing the Completeness of Wireless-side Tracing Mechanisms. In Proceedings of the 2007 IEEE International Symposium on a World of Wireless, Mobile and Multimedia Networks, Espoo, Finland, 18–21 June 2007. [Google Scholar]
- Mahanti, A.; Carlsson, N.; Williamson, C.; Arlitt, M. Ambient interference effects in wi-fi networks. In Proceedings of the International Conference on Research in Networking, Chennai, India, 11–15 May 2010. [Google Scholar]
- Chen, C.; Wang, C.; Liu, H.; Hu, M.; Ren, Z. A novel AP selection scheme in software defined networking enabled WLAN. Comput. Electr. Eng. 2018, 66, 288–304. [Google Scholar] [CrossRef]
- European Telecommunications Standards Institute. Digital Video Broadcasting (DVB) Second Generation Framing Structure, Channel Coding and Modulation Systems for Broadcasting, Interactive Services, News Gathering and Other Broadband Satellite Applications; Part 2: DVB-S2 Extensions (DVB-S2X); European Telecommunications Standards Institute: Sophia Antipoli, France, 2014. [Google Scholar]
- Ortiz-Gomez, F.G.; Martinez, R.; Landeros-Ayala, S. Method of Optimizing the Costs of a Satellite Network in Ka and Q/V Bands in the Feeder Link. In Proceedings of the AIAA International Communications Satellite Systems, Trieste, Italy, 16–19 October 2017. [Google Scholar]
- Chatzinotas, S.; Zheng, G.; Ottersten, B. Joint Precoding with Flexible Power Constraints in Multibeam Satellite. In Proceedings of the GLOBECOM IEEE Global Telecommunications Conference, Kathmandu, Nepal, 5–9 December 2011. [Google Scholar]
- Roumeliotis, A.J.; Kourogiorgas, C.; Panagopoulos, A. Optimal Capacity Allocation Strategies in Smart Gateway Satellite Systems. IEEE Commun. Lett. 2018, 23, 56–59. [Google Scholar] [CrossRef]
- Roumeliotis, A.J.; Kourogiorgas, C.; Panagopoulos, A. Dynamic Capacity Allocation in Smart Gateway High Throughput Satellite Systems Using Matching Theory. IEEE Syst. J. 2018, 13, 1–9. [Google Scholar] [CrossRef]
- International Telecommunication Union. Radiocommunication Sector. ITU-R Recommendations 618-13: Propagation Data and Prediction Methods Required for the Design of Earth-Space Telecommunication Systems; International Telecommunication Union: Geneva, Switzerland, 2017. [Google Scholar]
- Ho, H.; Squires, R.; Brown, C. Q/V Band Satellite Feeder Links—Ready for Deployment; Northrop Grumman Aerospace Systems: Falls Church, VA, USA, 2017. [Google Scholar]
- Revillon, P. Fundamentals and Dynamics of the Satellite Communications Business; Euroconsult: Madrid, Spain, 2016. [Google Scholar]
- Cornejo, A.; Landeros, S.; Matías, J.M.; Martínez, R. Applying Learning Methods to Optimize the Ground Segment for HTS Systems. In Proceedings of the 11th IEEE Latin American Symposium on Circuits and Systems, San José, Costa Rica, February 2020. [Google Scholar]
Figure 1.
Average CINRb in Central Asia (27 million km2) for a link availability of 99.5%.
Figure 1.
Average CINRb in Central Asia (27 million km2) for a link availability of 99.5%.
Figure 2.
Proposed methodology diagram.
Figure 2.
Proposed methodology diagram.
Figure 3.
Flowchart for cost optimization, Key Performance Indicator (KPIs), and trade-offs.
Figure 3.
Flowchart for cost optimization, Key Performance Indicator (KPIs), and trade-offs.
Figure 4.
Flowchart for dimensioning using Constant Coding and Modulation (CCM).
Figure 4.
Flowchart for dimensioning using Constant Coding and Modulation (CCM).
Figure 5.
Flowchart for dimensioning using Variable Coding and Modulation (VCM).
Figure 5.
Flowchart for dimensioning using Variable Coding and Modulation (VCM).
Figure 6.
Analysis in clear sky conditions in scenario 1. (a) Variation of the CINRb depending on the numbers of beams and the user G/T; (b) variation of the Cb depending on the numbers of beams and the user G/T.
Figure 6.
Analysis in clear sky conditions in scenario 1. (a) Variation of the CINRb depending on the numbers of beams and the user G/T; (b) variation of the Cb depending on the numbers of beams and the user G/T.
Figure 7.
Variation of the cost per Gbps in orbit for different optimal numbers of beams depending on the user G/T. Scenario 1.
Figure 7.
Variation of the cost per Gbps in orbit for different optimal numbers of beams depending on the user G/T. Scenario 1.
Figure 8.
Service area percentage for different ModCods (CCM) of Scenario 1 (159 beams and a user G/T of 17 dB/K).
Figure 8.
Service area percentage for different ModCods (CCM) of Scenario 1 (159 beams and a user G/T of 17 dB/K).
Figure 9.
VCM map (DVB-S2X), scenario 1, 159 beams, and a user G/T of 17 dB/K (availability 99.9%).
Figure 9.
VCM map (DVB-S2X), scenario 1, 159 beams, and a user G/T of 17 dB/K (availability 99.9%).
Figure 10.
Analysis in clear sky conditions in scenario 2. (a) variation of the CINRb depending on the numbers of beams and the user G/T; (b) variation of the Cb depending on the numbers of beams and the user G/T.
Figure 10.
Analysis in clear sky conditions in scenario 2. (a) variation of the CINRb depending on the numbers of beams and the user G/T; (b) variation of the Cb depending on the numbers of beams and the user G/T.
Figure 11.
Variation of the Cost per Gbps in orbit for different optimal numbers of beams depending on the user G/T. Scenario 2.
Figure 11.
Variation of the Cost per Gbps in orbit for different optimal numbers of beams depending on the user G/T. Scenario 2.
Figure 12.
Service Area Percentage for different ModCods (CCM). Scenario 2 (87 beams and a user G/T of 17 dB/K).
Figure 12.
Service Area Percentage for different ModCods (CCM). Scenario 2 (87 beams and a user G/T of 17 dB/K).
Figure 13.
VCM map (DVB-S2X), scenario 2, 87 beams, and a user G/T of 17 dB/K (availability 99.9%).
Figure 13.
VCM map (DVB-S2X), scenario 2, 87 beams, and a user G/T of 17 dB/K (availability 99.9%).
Figure 14.
Performance comparison of methodology on Very High Throughput Satellite (VHTS) affordability for throughput according to [
3]. Note: the launch cost and the ground segment cost have been added.
Figure 14.
Performance comparison of methodology on Very High Throughput Satellite (VHTS) affordability for throughput according to [
3]. Note: the launch cost and the ground segment cost have been added.
Table 1.
Definition of scenarios.
Table 1.
Definition of scenarios.
| Parameters | Scenario 1 | Scenario 2 |
|---|
| Service Area | CONUS, Mexico and Cuba | Europa and selected sites in Northern Africa |
| Satellite Position | 109 W | 9 E |
| Bandwidth per gateway (Q/V band) | 2.5 GHz | 2.5 GHz |
| Gateway antenna diameter | 9.1 m | 9.1 m |
| Bandwidth per beam (Ka band) | 250 MHz | 250 MHz |
| Frequency plan | 4 colours | 4 colours |
| Maximum investment cost | 500 M€ | 360 M€ |
| Maximum satellite mass | 6700 Kg | 6700 Kg |
| Maximum satellite antenna diameter (user link) | 2 m | 2 m |
| Minimum satellite capacity (Shannon) | 100 Gbps | 70 Gbps |
| Link availability | 99.9% | 99.9% |
| Minimum service area percentage | 98% | 98% |
Table 2.
Analysis in clear sky conditions for Scenario 1.
Table 2.
Analysis in clear sky conditions for Scenario 1.
| G/T [dB/K] | Optimal Number of Beams | CINRb [dB] | Gbps Per Beam (Ideal) | Ideal Satellite Capacity [Gbps] | Satellite Mass [kg] | Number of Gateways | Total System Cost [M€] | Cost Per Gbps in Orbit [M€ Per Gbps] |
|---|
| 15 | 180 | 13.5620 | 1.1418 | 205.5316 | 6.5766e3 | 9 | 540.6561 | 2.6305 |
| 17 | 159 | 14.4485 | 1.2126 | 192.8105 | 6.5135e3 | 8 | 498.7832 | 2.5869 |
| 20 | 125 | 15.7243 | 1.3154 | 164.4252 | 6.3954e3 | 7 | 433.5103 | 2.6365 |
| 23 | 89 | 17.0365 | 1.4219 | 126.5506 | 6.2381e3 | 5 | 360.5645 | 2.8492 |
| 25 | 64 | 17.9914 | 1.4998 | 95.9895 | 6.0952e3 | 4 | 311.4916 | 3.2451 |
| 27 | 37 | 19.0556 | 1.5870 | 58.7190 | 5.8777e3 | 2 | 254.7458 | 4.3383 |
Table 3.
Analysis in clear sky conditions for Scenario 2.
Table 3.
Analysis in clear sky conditions for Scenario 2.
| G/T [dB/K] | Optimal Number of Beams | CINRb [dB] | Gbps Per Beam (Ideal) | Ideal Satellite Capacity [Gbps] | Satellite Mass [kg] | Number of Gateways | Total System Cost [M€] | Cost Per Gbps in Orbit [M€ Per Gbps] |
|---|
| 15 | 97 | 15.9491 | 1.3336 | 129.3588 | 6.2769e3 | 5 | 374.9645 | 2.8986 |
| 17 | 87 | 16.8955 | 1.4104 | 122.7081 | 6.2279e3 | 5 | 356.9645 | 2.9091 |
| 20 | 71 | 18.2139 | 1.5180 | 107.7803 | 6.1392e3 | 4 | 324.0916 | 3.0070 |
| 23 | 55 | 19.4923 | 1.6228 | 89.2558 | 6.0327e3 | 3 | 291.2187 | 3.2627 |
| 25 | 44 | 20.3663 | 1.6947 | 74.5661 | 5.9440e3 | 3 | 271.4187 | 3.6400 |
| 27 | 32 | 21.285 | 1.7704 | 56.6513 | 5.8240e3 | 2 | 245.7458 | 4.3379 |
© 2020 by the authors. Licensee MDPI, Basel, Switzerland. This article is an open access article distributed under the terms and conditions of the Creative Commons Attribution (CC BY) license (http://creativecommons.org/licenses/by/4.0/).

 ,
, 


