Article

High Starch Induces Hematological Variations, Metabolic Changes, Oxidative Stress, Inflammatory Responses, and Histopathological Lesions in Largemouth Bass (Micropterus salmoides)

National-Local Joint Engineering Laboratory of Aquatic Animal Genetic Breeding and Nutrition (Zhejiang), Department of Fisheries, School of Life Science, Huzhou University, 759 East 2nd Road, Huzhou 313000, China
*
Authors to whom correspondence should be addressed.
Metabolites 2024, 14(4), 236; https://doi.org/10.3390/metabo14040236
Submission received: 25 March 2024 / Revised: 9 April 2024 / Accepted: 17 April 2024 / Published: 19 April 2024
(This article belongs to the Special Issue Metabolism in Aquatic Products)

Abstract

:
This study evaluated effects of high starch (20%) on hematological variations, glucose and lipid metabolism, antioxidant ability, inflammatory responses, and histopathological lesions in largemouth bass. Results showed hepatic crude lipid and triacylglycerol (TAG) contents were notably increased in fish fed high starch. High starch could increase counts of neutrophils, lymphocytes, monocytes, eosinophils, and basophils and serum contents of TAG, TBA, BUN, and LEP (p < 0.05). There were increasing trends in levels of GLUT2, glycolysis, gluconeogenesis, and LDH in fish fed high starch through the AKT/PI3K signal pathway. Meanwhile, high starch not only triggered TAG and cholesterol synthesis, but mediated cholesterol accumulation by reducing ABCG5, ABCG8, and NPC1L1. Significant increases in lipid droplets and vacuolization were also shown in hepatocytes of D3–D7 groups fed high starch. In addition, high starch could decrease levels of mitochondrial Trx2, TrxR2, and Prx3, while increasing ROS contents. Moreover, high starch could notably increase amounts of inflammatory factors (IL-1β, TNF-α, etc.) by activating NLRP3 inflammasome key molecules (GSDME, caspase 1, etc.). In conclusion, high starch could not only induce metabolic disorders via gluconeogenesis and accumulation of glycogen, TAG, and cholesterol, but could disturb redox homeostasis and cause inflammatory responses by activating the NLRP3 inflammasome in largemouth bass.

1. Introduction

As the cheapest and widest energy source or ingredient, starch is also a good binder for animal feeds [1,2]. In most cases, adequate amount of dietary starch could enhance growth and feed efficiency, but it can also save protein by redirecting amino acids away from the oxidative process in humans, terrestrial animals, and fish species [3,4]. Meanwhile, optimal contents of dietary starch could improve metabolism and enhance antioxidant capacity and immunity in animals [5,6,7]. Nevertheless, carnivorous fish exhibit reduced capacity to digest dietary starch compared to omnivorous and herbivorous fish, as indicated by various research studies involving grass carp (Ctenopharyngodon idellus), Chinese longsnout catfish (Leiocassis longirostris) [8], jundiá catfish (Rhamdia quelen), Nile tilapia (Oreochromis niloticus) [9], and largemouth bass (Micropterus salmoides) [10]. Several studies have proved that long-term intake of excessive dietary starch could induce metabolic dysfunction [6,11] and then impair the innate immunity in fish [12,13]. Therefore, the regulatory mechanisms of high starch have been a hot research area in carnivorous fish species and other animals.
Too much starch in the diet can cause an increase in serum glucose (GLU) levels, impacting glucose metabolism and lipid metabolic indices, like high-density lipoprotein cholesterol (HDL-C), triacylglycerol (TAG), total cholesterol (TC), low-density lipoprotein cholesterol (LDL-C), etc. [1,7,12]. Previous studies have found glucose and lipid metabolic processes can be regulated by different signaling pathways mediated by serum hormones, including glucagon (GC), insulin (INS), adiponectin (ADPN), and leptin (LEP) [7,14,15]. In addition, the processes of glycogen synthesis and decomposition are also modulated by these serum hormones in animals in response to higher dietary starch [14,16,17]. Moreover, several studies have reported that higher dietary starch could induce hepatic cholesterol and bile acid accumulation in humans and animals [18]. These metabolic processes, such as glycolysis and gluconeogenesis, lipolysis and lipogenesis, glycogen synthesis, and cholesterol and bile acid accumulation, are mainly regulated by various signaling pathways, including AKT and SREBP signaling pathways in humans and animals [19,20]. While most research has concentrated on glycolysis, gluconeogenesis, lipolysis, and glycogen synthesis in carnivorous fish, there are limited data available regarding the synthesis and storage of bile acids through hepatic cholesterol in carnivorous fish species consuming higher dietary starch.
Throughout the breakdown of nutrients, such as starch, reactive oxygen species (ROS) were consistently formed in humans, terrestrial animals, and fish species [3,21]. Although optimal amounts of ROS could play essential functions in growth, metabolism, and immune defense, ROS overload could induce the damage of proteins, lipids, and DNA [22,23]. So, it is important to alleviate these oxidative stresses induced by ROS overload through different adequate antioxidant enzymes and molecules, including superoxide dismutase (SOD), catalase (CAT), thioredoxin 2 (Trx2), thioredoxin reductase 2 (TrxR2), peroxiredoxin 3 (Prx3), and glutathione S-transferase (GST) [13,24,25]. Past research has indicated that carnivorous fish fed diets high in starch exhibited low antioxidant capacity and strong oxidative stress [13,23,26]. In addition, excessive ROS can cause cellular damage in these immune regulatory cells, including leukocytes, macrophages, and natural killer cells [27]. Prasad and colleagues [21] have shown that immune and inflammatory responses can be influenced by the release of various cytokines, such as tumor necrosis factor-α (TNF-α), interferons (IFNs), and interleukins (ILs), which was also supported by Herb and Schramm [28] and Liu et al. [29]. In animals, the leukocyte numbers and platelet (PLT) counts have appeared as biomarkers of inflammation or inflammatory response in clinical practices recently [3,30,31,32]. And the secretion and maturation of these pro-inflammatory cytokines could be mediated by the NLRP3 inflammasome in animal cells [33]. Excessive production of ROS can activate the NLRP3 inflammasome [34,35,36]. Yet, there were limited data regarding the connection among elevated starch-induced ROS, NLRP3 inflammasome, and inflammatory markers in carnivorous fish.
Largemouth bass is a common fish species that is economically important and extensively cultivated in China due to its rapid growth, abundant harvest, soft flesh, lack of intermuscular spines, and other favorable characteristics [37]. Numerous previous research projects have investigated the prolonged impacts of increased dietary starch on the development characteristics, metabolic capacities, and overall health of the liver and intestines in largemouth bass [17,18,38]. Little information could be obtained on the short-time relationship between high starch-mediated hematological variations, metabolic changes, oxidative stress, inflammatory responses, and histopathology in largemouth bass. This research sought to investigate the processes that lead to the development of metabolic fatty liver in largemouth bass fed a diet high in starch. This study utilized a system dynamics approach, analyzing data from various body and blood measurements as well as metabolic, oxidative stress, antioxidant, inflammatory, and histopathological markers in largemouth bass fed with high starch.

2. Materials and Methods

2.1. Diets, Fish, and Feeding Trials

Two isonitrogenous and isolipidic (crude protein: 46.72%, crude lipid: 9.86%) trial diets were produced with two levels of dietary starch (0% and 20%), respectively (Table 1). All used ingredients were firstly filtrated with 60-mesh screens, mixed, produced into pellets with 2.5 mm diameter, air-dried, and then stored following methods outlined by Wu et al. [39]. Juvenile largemouth bass were acquired from a nearby fish breeder and introduced to recirculating tanks (1000 L) with a starch-free diet for two weeks. Following the acclimation period, 720 healthy fish (with an average starting weight of 7.43 ± 0.15 g) were chosen and distributed at random among 24 recirculating tanks (each with a capacity of 500 L and containing 30 fish). After the distribution, all fish were still fed a diet without starch for one month to maintain physiological consistency. Then, control groups with 3 tanks were still fed with a control diet without starch; these experimental groups (21 tanks) were fed with a high-starch diet (20%) and randomly distributed into seven groups (D1–D7) for 7 days. During the culturing time, all fish were fed with 3% of the total fish weight per day at 08:00 and 17:00. The recirculated water was filtered, with a temperature range of 26.3 to 28.4 degrees Celsius, pH range of 6.8 to 7.1, dissolved oxygen levels above 5.8 mg/L, low nitrite levels less than 0.02 mg/L, low ammonia nitrogen levels less than 0.05 mg/L, and exposed to natural sunlight.

2.2. Fish Tissue Samples’ Preparation

After the experiment, all fish in these trial groups were first fasted for about 24 h, anesthetized with MS-222 (Sigma, St. Louis, MO, USA), and weighed to evaluate fish body indices. Twenty fish in each tank were randomly selected, weighed, and used for blood sampling for hematological assays. All the serum and liver samples were gathered with methods supplied by Wu et al. [39]. These tested samples were firstly frozen using liquid nitrogen and subsequently kept at −80 °C for additional measurements. Frozen liver tissue samples were powderized in liquid nitrogen, suspended with physiological saline, and centrifuged with methods supplied by Wu et al. [39]. All the supernatants were gathered, divided into Eppendorf tubes, and then frozen at −80 °C for further experimental tests.

2.3. Measurement of Hematological and Serum Biochemical Indices

The TEK 8500 VET automated blood analyzer from Jiangxi Tekang Tech (Nanchang, China) was utilized for the assessment of hematological parameters and cell populations, such as red blood cells (RBCs), hemoglobin (HGB), white blood cells (WBCs), eosinophils (EOS), neutrophils (NEU), basophils (BAS), lymphocytes (LYM), monocytes (MON), and platelets (PLT). All measurements were performed with 15 replicates.
Serum levels or activities of various biomarkers including GLU, INS, HDL-C, LEP, TAG, LDL-C, TC, aspartate aminotransferase (AST), total bile acid (TBA), albumin (ALB), alanine aminotransferase (ALT), alkaline phosphatase (ALP), blood urea nitrogen (BUN), LDH, GC, and ADPN were measured using commercial diagnostic kits provided by Jiancheng Biotech (Nanjing, China). All analyses were performed with 9 replicates.

2.4. Measurement of Glucose and Lipid Metabolic Parameters in Fish Liver

Diagnostic kits from Jiancheng Biotech (Nanjing, China) were used to measure the activities or contents of various enzymes and compounds including glucokinase (GCK), phosphofructokinase (PFK), pyruvic acid (PA), pyruvate kinase (PK), lactic dehydrogenase (LDH), phosphoenolpyruvate carboxylase (PEPC), lactic acid (LA), fructose-1.6-bisphosphatase (FBP), liver triglyceride (LTAG), acetyl coenzyme A (Ac-CoA), malonyl monoacyl CoA (Mal-CoA), and liver glycogen (LAG). Levels of glucose transporter 2 (GLUT2), glycogen synthetase (GCS), glucose 6-phosphatase (G6Pase), glycogen branching enzyme (GBE), fatty acid synthase (FAS), glycogen debranching enzyme (GDE), and acetyl-CoA carboxylase (ACC) were assessed through relative ELISA kits following the manufacturer’s instructions (Hengyuan Biotech, Shanghai, China). The crude lipid content in the liver was measured using the chloroform-methanol method supplied by Araujo et al. [40]. All measurements were performed with 9 replicates.

2.5. Measurement of Antioxidant and Inflammatory Parameters in the Liver

Commercial diagnostic kits from Jiancheng Biotech (Nanjing, China) were used to measure levels of total superoxide dismutase (T-SOD), glutathione S-transferase (GST), CAT, malondialdehyde (MDA), hydrogen peroxide (H2O2), and total antioxidant capacity (T-AOC). ELISA kits from Jiangsu Meimian Industrial Co., Ltd. (Hangzhou, China) were used to evaluate the contents of ROS in the liver. Levels of TNF-α, IL-1β, IL-6, IFN-γ, IL-8, IL-12, and IL-17 in these fish liver samples were also assessed with ELISA kits purchased from Shanghai Hengyuan Biotech (Shanghai, China) following their recommended protocols. All measurements were performed with 9 replicates.

2.6. Measurement of Gene Expression in the Liver

RNA extraction, RNA integrity examination, quantification, and RNA reverse transcription were performed with methods supplied by Wu et al. [13]. All the cDNA samples were treated with ethanol (95%) and then frozen at −80 °C for further analysis. All the primers were designed according to relative gene sequences from largemouth bass in the GenBank (Table 2). The CFX96 machine from Bio-Rad in Hercules, CA, USA was utilized for conducting real-time qPCR analysis, with expression variations analyzed using the 2−ΔΔCT method as outlined by Yang et al. [37]. All measurements were performed with 9 replicates for further analyses.

2.7. Measurement of Histomorphometrical Parameters of the Liver

Six fish were selected at random from each category, and liver tissue samples measuring 0.5 cm × 0.5 cm × 0.5 cm were rinsed with 0.6% saline and then immersed in a 4% paraformaldehyde solution for 48 h. The liver tissue samples were then fixed, dehydrated, embedded, and stained with hematoxylin and eosin (HE), periodic acid Schiff (PAS), or oil red O (ORO) before being examined under light microscopy (DM500, Leica, Leica Microsystems (Schweiz) AG, Heerbrugg, Switzerland). Liver micrographs were captured at 20 × and 40 × magnification and recorded using a digital camera following the procedures outlined in our laboratory’s previous publication [39]. K-Viewer (https://kv.kintoneapp.com/en/user/, accessed 31 March 2023) 1.0 software (1.0.4) (Konfoong Bioinf Tech Co., Ltd, Ningbo, China) and Slide Viewer (accessed 21 April 2023) 2.5 software (2.5.0) (3DHISTECH Ltd., Budapest, Hungary) were utilized for image analysis conducted by Wu et al. [39]. Each analysis was conducted with 3 duplicates.

2.8. Data Analysis

All results were expressed as mean ± SD (standard deviation). Groups were compared using SPSS 25.0 (IBM, Chicago, IL, USA) through a one-way analysis of variance (ANOVA). Tukey’s multiple interval test was used for multiple comparisons between different dietary treatments. Furthermore, orthogonal polynomial contrasts about linear and/or quadratic effects were used with the methods supplied by Wu et al. [39]. A significant difference was indicated when p was less than 0.05.

3. Results

3.1. Body Indices and Lipid Contents in the Liver

The viscerosomatic index (VSI), hepatosomatic index (HSI), and intestinal somatic index (ISI) of the fish showed a tendency to rise as the number of days on a high starch diet increased in largemouth bass juveniles, reaching their peak in the D7 trial groups (p < 0.05) (Figure 1A–C). Furthermore, no significant variances were seen in ISI among the D3, D5 and D7 trial groups (p > 0.05). The liver’s crude lipid contents increased as the high starch diet was cultured for more days, reaching its peak in the D7 groups (p < 0.05), although there were no notable differences between the D1 and D3 groups (p > 0.05).

3.2. Hematological Parameters

With the increase in the consumption of a high-starch diet by largemouth bass over several days, there was first a rise and then a decrease in the trends on RBC counts in the D1–D7 groups (p > 0.05), while there were no notable differences in RBC counts between the D0 and D7 groups (p > 0.05). Furthermore, HGB levels rose in the D1, D3, and D5 groups and reached their peak in the D5 trial groups before declining in the D7 treated groups (p < 0.05). Additionally, there was a notable increase in the counts of WBC and LYM (p < 0.05), with WBC peaking in the D7 groups (p > 0.05), and LYM peaking in the D5 groups (p > 0.05). In the meantime, all NEU, MON, and EOS levels showed marked increases when compared to the D0 group, peaking in the D7 groups (p < 0.05). There were no notable differences in MON and EOS counts between the D3 and D5 groups (p > 0.05). Conversely, there was a marked inverse correlation between PLT counts and the duration of consuming a high-starch diet in comparison to the D0 groups (p < 0.05). However, no significant differences were presented between the D5 and D7 groups (p > 0.05) (Table 3).

3.3. Biochemical and Hormone Indicators in the Serum

High dietary starch significantly increased contents or levels of GLU, HDL-C, and LDL-C in the serum of D1–D7 groups when compared with that in the D0 groups fed with a no-starch diet (p < 0.05). The peaked levels of HDL-C, and LDL-C were all shown in the D7 groups (p < 0.05), with no notable differences among D1, D3, D5, and D7 groups (p > 0.05). TG and TC contents were notably heightened and peaked in the D5 and D7 groups (p < 0.05), respectively. AST activities were firstly heightened and then maintained stable trends in D1, D3, D5, and D7 groups (p > 0.05). Similarly, ALT activities and TBA contents were also markedly heightened to the maximal levels in the D5 and D3 groups, respectively, with no significant differences between the D3 and D5 groups (p > 0.05). In addition, amounts of ALP, ALB, LDH, and BUN were all first increased in the D1 and D3 groups when compared with that in the D0 groups (p < 0.05) and then reduced in the D5 and/or D7 groups. However, amounts of ALP, ALB, LDH, and BUN in the D7 groups were still significantly higher than those in the D0 groups (p < 0.05). In addition, the contents of INS and ADPN first rose to their peaks in the D3 groups when compared to those in the D0 groups (p < 0.05) and then decreased to the lower levels in the D5 and D7 groups when compared to that in the D3 groups (p < 0.05). However, GC amounts were increased and peaked in the D7 groups when compared to that in the D0 groups. The levels of LEP were also firstly heightened and reached maximal values in the D5 groups and then decreased in the D7 groups, although LEP levels in the D7 groups were markedly higher than those in the D0 groups (p < 0.05) (Table 4).

3.4. Activities or Contents of Glucose and Lipid Metabolism in Fish Liver

Compared to the D0 groups, amounts and activities of GLUT2, GCK, PFK, PK, LDH, PEPC, and ACC were all notably heightened in the livers of D3, D5, and D7 groups fed with high-starch diet (p < 0.05) and reached maximal levels in D5 or D7 groups, respectively. The contents of PA and LA were also notably heightened in the livers of D1–D7 groups fed with a high-starch diet (p < 0.05), although decreased in the D7 groups when compared with their peak in D5 and D3 groups (p < 0.05), respectively. In addition, activities of FBP, G6Pase, GCS, GBE, and FAS were first increased in D3 or D5 treated groups (p < 0.05) and then decreased in D7 groups. However, activities of GDE were significantly reduced in the D1–D7 groups when compared with D0 groups (p < 0.05), although there were no differences between the D1–D3, and the D5–D7 groups. While, LAG contents were increased in D1–D7 groups and reached the maximal level in the D7 groups (p < 0.05). Although there was no significant variation among the D0, D1, and D3 groups (p > 0.05), Ac-CoA contents were increased in D5 and D7 groups (p < 0.05). Moreover, there were similar variable patterns in the contents of Mal-CoA and LTAG. Compared to the D0 groups, the maximal contents of Mal-CoA and LTAG were both shown in the D5 groups, although no significant variation could be observed between the D5 and D7 groups (p > 0.05) (Table 5).

3.5. Gene Expression Variations of Glucose Metabolism in Fish Liver

The levels of GLUT2, GCK, PFK, PK, FBP, and G6Pase showed a rising trend, peaking in the D5 or D7 groups when compared to the D0 groups (p < 0.05). In the D3 and D5 groups, the levels of LDH transcription showed a notable increase (p < 0.05), while the remaining three groups did not exhibit any significant differences statistically (p > 0.05) (Figure 2). High dietary starch significantly increased the mRNA levels of glucose-6-phosphate 1-dehydrogenase (G6PD), 6-phosphogluconate dehydrogenase (PGD), glycgenin 2 (GYG2), glycogen synthetase (GCS), 1,4-alpha-glucan branching enzyme (GBE), and serine/threonine-protein phosphatase PP1 (PP1) (p < 0.05). The mRNA expression of glycogen debranching enzyme (GDE) was significantly reduced in the D5 and D7 groups, with no significant difference between the two groups (p > 0.05) (Figure 3).
Furthermore, there were rising trends in the levels of insulin receptor (ISR), insulin receptor substrate 2 (ISR2b), serine/threonine kinase 1 (AKT1), and sterol regulatory element binding protein 1c (SREBP1c) observed in the livers of subjects on high-starch diets (p < 0.05). In addition, the levels of PIK3c were significantly higher in the D5 groups compared to the D0 groups (p < 0.05), with no statistical differences observed among the latter (p < 0.05). The highest levels of SREBP1c were shown in the D5 groups compared to those in the other four groups, although there were no statistical differences observed among D1, D3, and D7 groups (p > 0.05) (Figure 4).

3.6. Gene Expression Variations of FA and TAG Metabolism in Fish Liver

The high-starch diet significantly upregulated the expression of genes involved in fatty acid synthesis, including acetyl-CoA carboxylase (ACC), fatty acid synthase (FAS), acyl-CoA desaturase (SCD), and NADP-dependent malic enzyme 1 (ME1), with the highest levels observed in the D5 groups compared to those in D0 groups (p < 0.05). Levels of mRNA for fatty acid-binding protein liver type (FABP-L) and fatty acid transport protein 4 (FATP4) were significantly increased to their highest levels in D7 or D5 groups (p < 0.05), respectively. Additionally, high starch was found to notably enhance the expression of glycerol kinase (GK), glycerol-3-phosphate acyltransferase 3 (GPAT3), GPAT4, and diacylglycerol O-acyltransferase 2 (DGAT2) related to triglyceride production in the livers of fish fed with high-starch diet (p < 0.05). Similarly, the levels of perilipin-2 (Plin2) were notably increased to the highest point in the D5 groups and then decreased in the D7 groups (p < 0.05), with no significant variations between the D3 and D7 groups (p > 0.05). Moreover, the levels of the triglyceride transporter apolipoprotein B-100 (APOB100) were significantly increased to the highest point in the D5 groups, then decreased in the D7 groups (p < 0.05), with no significant difference between the D1 and D3 groups (p > 0.05) (Figure 5).

3.7. Cholesterol Metabolism and Bile Acid Synthesis of Gene Expression

In the hepatic cells of fish fed a high-starch diet, the expression levels of genes involved in cholesterol metabolism, including sterol regulatory element-binding protein 2 (SREBP2), acetoacetyl-CoA synthetase (AACS), 3-hydroxy-3-methylglutaryl-Coenzyme A reductase a (HMGCRa), hydroxymethylglutaryl-CoA synthase (HMGCS), and lanosterol 14-alpha demethylase (CYP51), were significantly elevated in the D3 treated groups compared to the D0 control groups (p > 0.05) and then decreased in the D7 groups compared to the D3 treated groups (p < 0.05). Both HMGCRa and HMGCS showed no significant differences not just between the D1 and D3 groups, but also between the D5 and D7 groups (p > 0.05). SREBP2 and AACS were not significantly different between D0, D5, and D7 groups (p > 0.05), and CYP51 was not significantly different between D7 and D0 groups (p > 0.05). Expression levels of sterol O-acyltransferase 2 (SOAT2) consistently rose in high-starch groups as feeding time increased, peaking in the D7 groups (p < 0.05). Conversely, the expression of ATP-binding cassette sub-family G member 5 (ABCG5) and ABCG8 were reduced in the D3, D5, and D7 treated groups compared with the D0 control groups (p < 0.05). Additionally, there was first an increase trend on the levels of Niemann-Pick C1-like protein 1 (NPC1L1) in the D1 and D3 groups and then, they reduced to the original levels in D5 and D7 groups when compared with the D0 groups (Figure 6).
In addition, the mRNA transcription levels of bile acid processing, such as CYP7A1 and CYP27A1, were significantly increased in the D1 and D3 groups (p < 0.05) and then reduced in the D7 groups in comparison to the D0 groups. The expression of the bile salt export pump (BSEP) only decreased significantly in the D7 groups compared to D0 (p < 0.05), with no significant differences observed among D0, D1, D3, and D5 groups. The transcription levels of sodium/taurocholate cotransporting polypeptide (NTCP) were significantly increased in the D3 and D5 treated groups (p < 0.05) and then reduced in the D7 treated groups in comparison to the D0 groups. Amounts of solute carrier organic anion transporter family member 1 (OATP1) were constantly up-regulated and reached the peak in the D7 treated groups (p < 0.05). Moreover, organic solute transporter subunit alpha (OST-α) was notably up-regulated in D1–D7 groups and obtained the maximal levels in D3 treated groups compared with D0 control groups (p < 0.05). However, no significant variations were observed in the transcription of canalicular multispecific organic anion transporter 2 (MRP3) (p > 0.05) (Figure 7).

3.8. Variation of Antioxidant and Oxidant Parameters

The liver’s T-SOD and CAT activities were notably reduced in D1–D7 groups fed with the high-starch diet compared to the D0 groups (p < 0.05). There were no significant differences in T-SOD levels among the D1, D3, and D5 groups (p > 0.05), nor in CAT levels between the D1 and D3 groups and among the D3, D5, and D7 groups (p > 0.05). ROS and H2O2 levels were both elevated and peaked in the D5 groups (p < 0.05), with no significant variation observed between the D3 and D7 groups in terms of ROS (p > 0.05). Amounts of GST and MDA were peaked in the D7 groups (p < 0.05), with no significant differences observed among D0, D1, and D3 for GST (p > 0.05) and among D1, D3, and D5 treated groups for MDA levels (p > 0.05). T-AOC levels were lower in the D5 and D7 groups compared to the D0 groups (p > 0.05), with no significant differences observed among the D0, D1, and D3 groups, as well as between the D5 and D7 groups (p > 0.05) (Table 6).
The expressions of Cu/Zn superoxide dismutase (Cu/Zn-SOD) and manganese superoxide dismutase (Mn-SOD) were initially reduced to a minimum in the D1 and D3 groups compared to the D0 control groups (p < 0.05), respectively, both followed by an increase in the D5 groups (p < 0.05) and then were reduced in the D7 groups. There were no significant differences in the transcription levels of CAT in the D0–D7 groups (p > 0.05). Furthermore, GST1 transcriptions were notably elevated in the D3 and D5 groups compared to the D0 group, reaching its peak in the D3 and D5 groups (p < 0.05), with no significant differences between these two groups (p > 0.05). In contrast, the expressions of thioredoxin 2 (Trx2), thioredoxin reductase 2 (TrxR2), and peroxiredoxin 3 (Prx3) were decreased as high-starch feeding increased compared to the D0 groups (p < 0.05) (Figure 8A). The livers of largemouth bass fed a high-starch diet showed increased transcription variations of cytochrome c oxidase 4 (COX4), NADPH oxidase 1 (NOX1), NADPH oxidase activator 1 (NOXA1), and heme oxygenase 1 (HO1), reaching their peaks in the D5 and/or D7 groups compared to those in the D0 groups (p < 0.05). Furthermore, there were no significant variations in COX4 levels among D0, D1, and D7 groups. There were no notable variations in HO1 transcription levels between the D5 and D7 treated groups (p > 0.05) (Figure 8B).

3.9. Variation of Molecules in Inflammatory Responses in Fish Liver

In the livers of largemouth bass fed high starch, TNF-α contents were constantly heightened and peaked in the D7 treated groups compared to the D0 control groups (p < 0.05). There were similar variation trends in the levels of IL-6, IL-8, IL-17, and IL-1β in the D1–D7 groups and were notably higher than those in the D0 control groups (p < 0.05). IL-6 contents were firstly heightened and peaked in the D3 treated groups compared to the D0 groups (p < 0.05). Similarly, contents of IL-8, IL-17, and IL-1β were also firstly heightened and all reached the maximum in the D5 treated groups compared to those in the D0 groups (p < 0.05). Contents of IL-12 in high-starch groups were notably higher than that in the D0 groups, although there were no differences among the D1–D7 treated groups (p > 0.05). IFN-γ levels were notably increased in the D5 and D7 groups compared with those in D0, D1, and D3 treated groups (p < 0.05), while there were no significant differences among the D0, D1, D3 groups and between the D5, D7 groups (Table 7).
Expression levels of IL-1β, IL-8, and TNF-α were first increased and reached the maximum in the D3 and/or D5 groups compared to those in the D0 groups (p < 0.05) and then reduced in D7 groups. Although there were no differences in the D0, D1, and D3 groups (p >0.05), expression levels of IL-12 and IFN-γ were notably increased in the D5 and D7 groups compared to those in the D0 groups (p < 0.05), with no significant differences observed among D5 and D7 (p > 0.05). In addition, transcription levels of apoptosis genes (caspase 1 and caspase 3) were increased in the D5 and D7 groups, and both peaked in the D7 trial groups (p > 0.05). And the transcription levels of caspase 6, caspase 8, and caspase 9 also first increased and reached peaks in the D5 and/or D3 groups compared to those in the D0 groups (p < 0.05) and then all decreased in D7 groups, with notable differences between D7 and D0 groups (p > 0.05) (Figure 9A). Moreover, the expression levels of NLRP3 inflammasome key molecules, including nucleotide-binding oligomerization domain-containing protein 1 (NOD1), NOD2, and gasdermin-E (GSDME), were notably elevated after consuming a high-starch diet, peaked in the fish liver of D7 or D5 groups compared to that of D0 groups (p < 0.05). Although there were no significant differences in the D0–D5 groups, apoptosis-associated speck-like protein-containing CARD (ASC) levels were notably elevated in the D7 groups (p < 0.05) (Figure 9B).

3.10. Fish Hepatic Histopathological Lesions

The liver samples of juvenile largemouth bass in the high-starch group (B–E) and the control group (A) were observed by photographing, hematoxylin-eosin staining (HE), periodic acid-Schiff staining (PAS), and Oil Red O staining (ORO) (Figure 10). Within the D0 category (A1–A3), the livers of the largemouth bass displayed a reddish hue and no apparent abnormal characteristics, featuring well-formed hepatocytes with distinct nuclei. Additionally, the glycogen granules and lipid droplets in the liver cells of the largemouth bass were both smaller and of a lighter shade. Within the D1 groups (B1–B3), there were instances of pale livers displaying a dense nuclear phenotype and indistinct liver cords, often indicating the early stages of liver fibrosis in clinical settings. Additionally, there was an increase in glycogen granules and lipid droplets. In D3 (C1–C3), D5 (D1–D3), and D7 (E1–E3) groups, the white areas in the livers of largemouth bass increased and the shape became larger, and glycogen granules and lipid droplets were increased with culturing times with the high-starch diet.

4. Discussion

Previous studies have found dietary starch levels could modulate body indices (VSI, HSI, and ISI), which can also influence animal body compositions [41,42]. The current research found that high-starch diet (20%) led to a notable increase in VSI, HSI, and ISI in largemouth bass as the culturing days increased, similar with previous studies on giant gourami (Osphronemus goramy) [7], blunt snout bream (Megalobrama amblycephala) [43], and black carp (Mylopharyngodon piceus) [
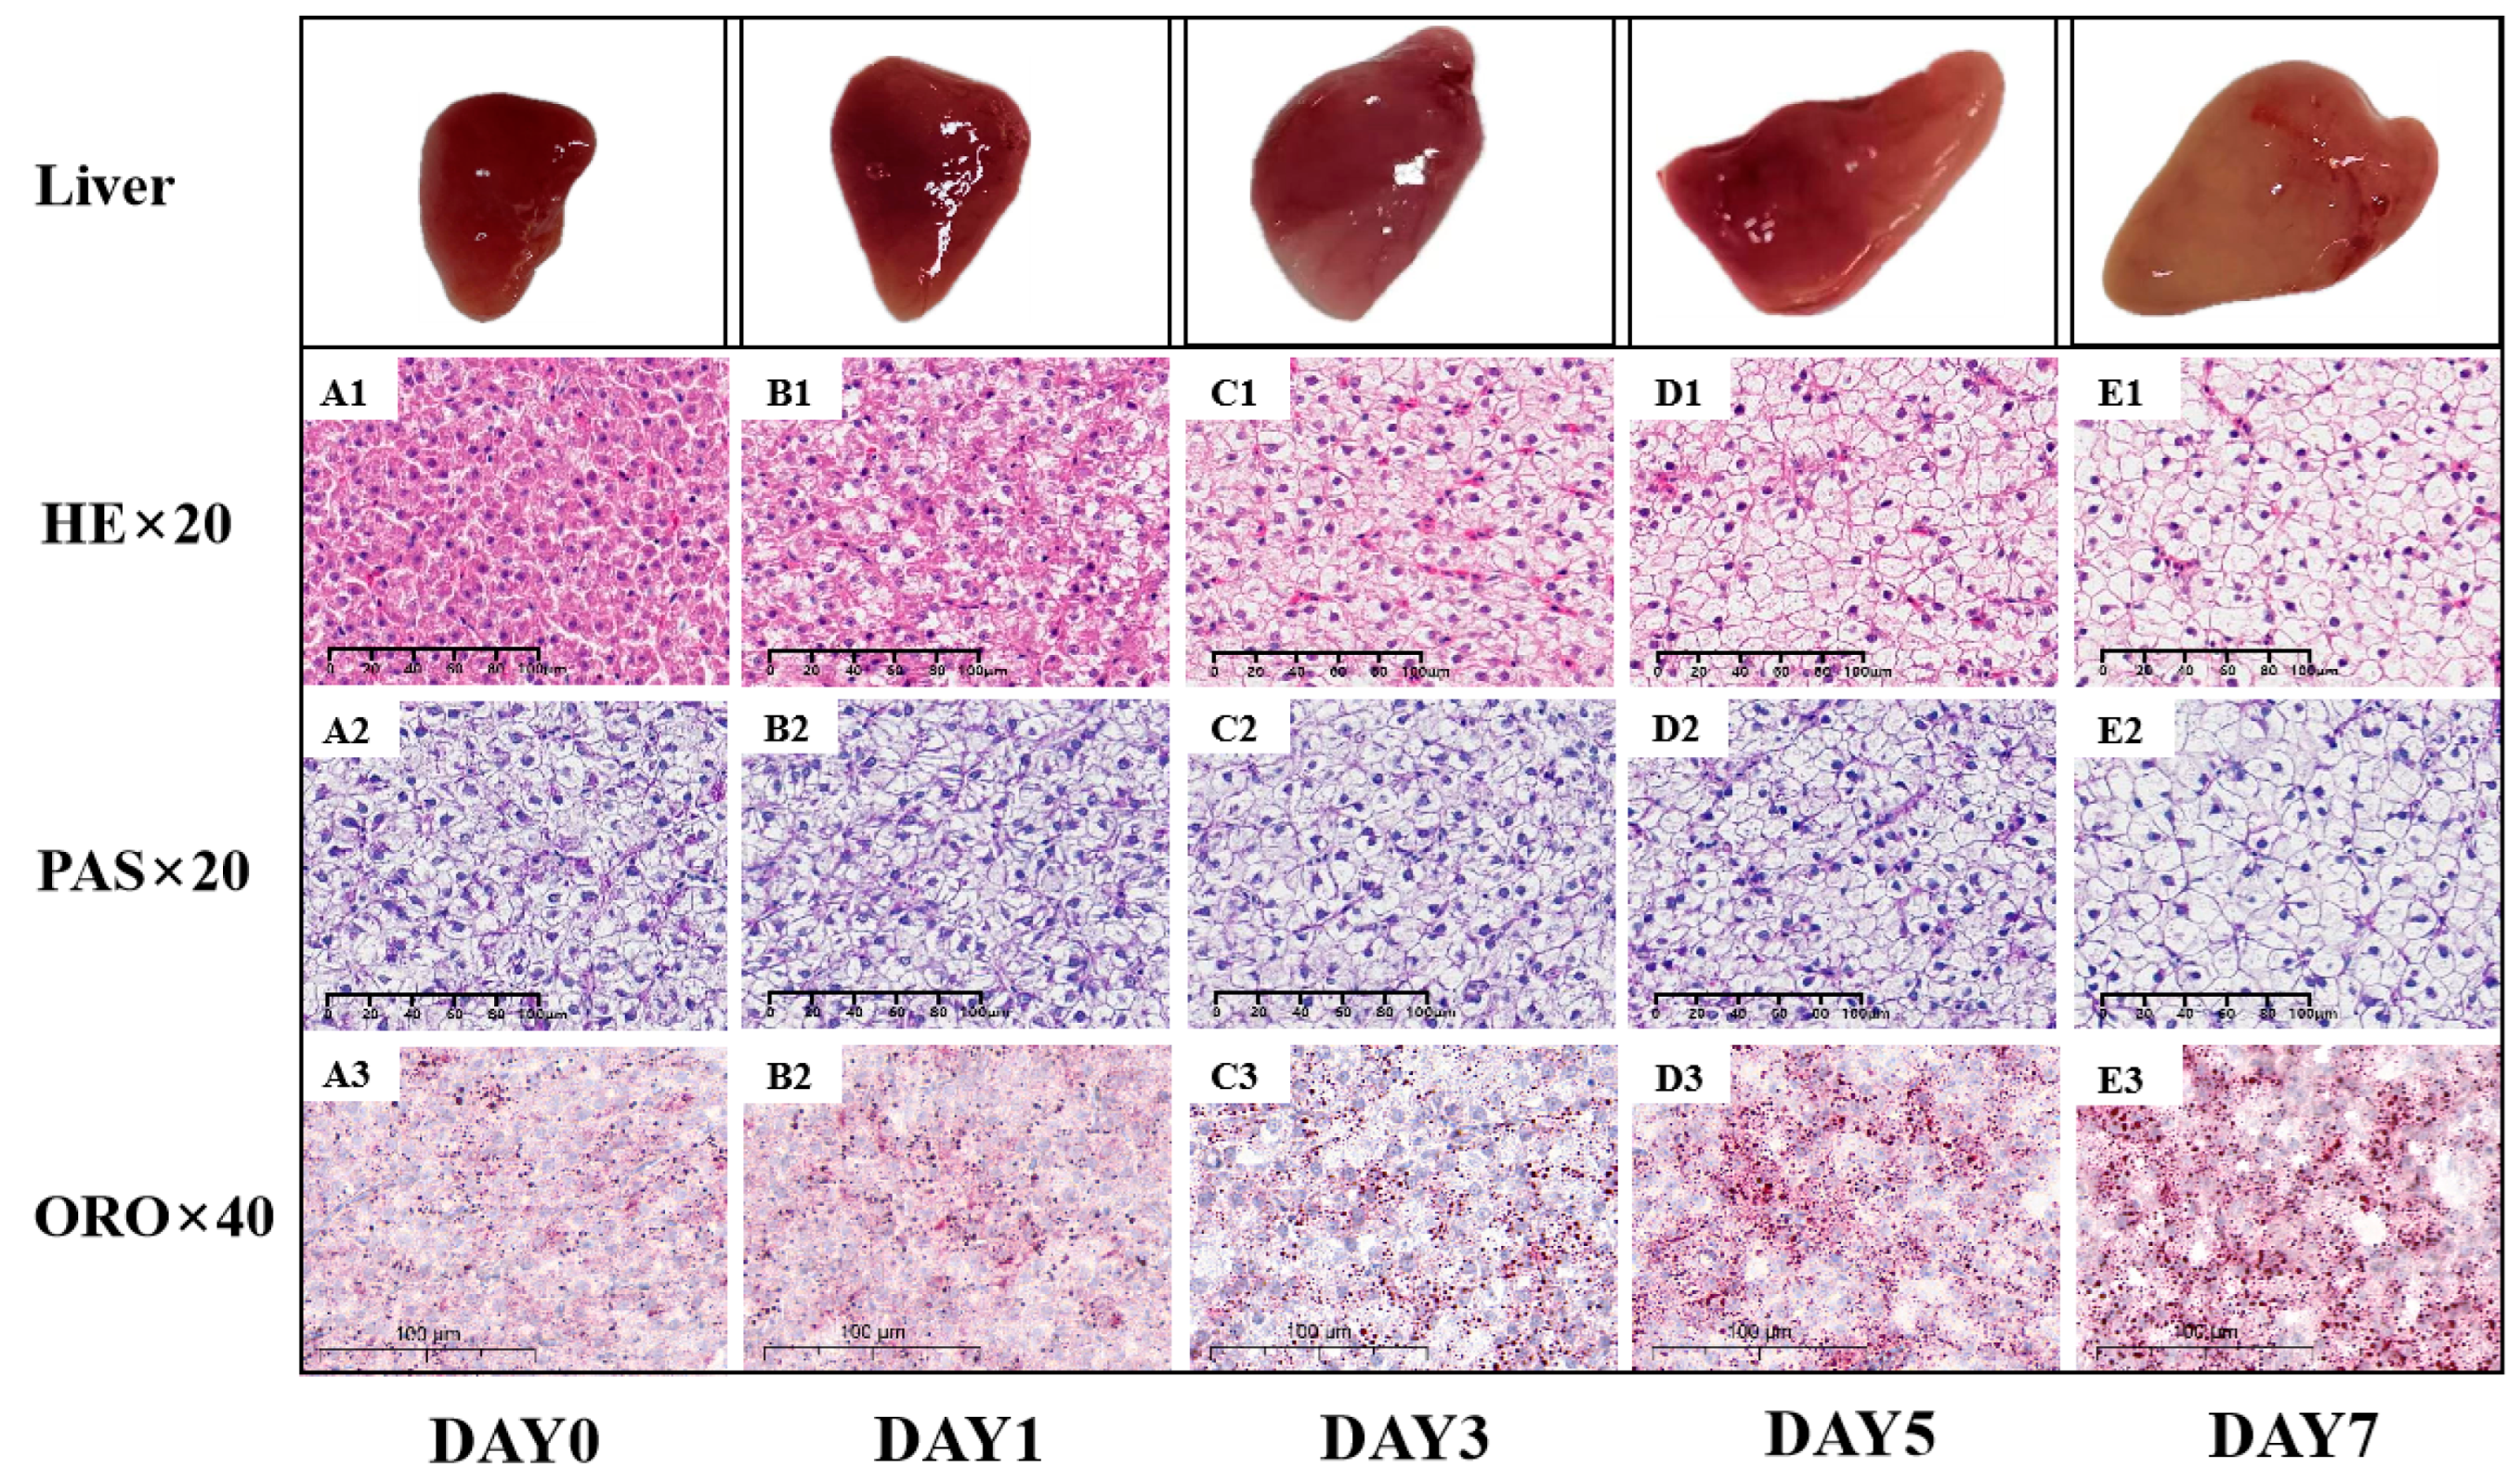
13]. Additionally, our findings indicated a significant rise in hepatic lipid levels over time due to high starch exposure, aligning with earlier studies on largemouth bass [44,45] and GIFT tilapia (Oreochromis niloticus) [5]. Higher dietary starch, when combined with these findings and our results, was found to induce hepatic lipid synthesis and accumulation in largemouth bass.
Hematological parameters have been important physiological assays for analyzing pathological variations in human and fish species [31,46,47]. Our results showed that high starch increased RBC counts and HGB levels, especially in the D1, D3 and D5 groups, which was in line with former results in Siberian sturgeon (Acipenser baerii) [48]. It is well-known that RBC and HGB undertake key roles in increasing oxygen-carrying, metabolic capacity and redox regulation in humans and animals [49,50,51]. Therefore, combining these findings and our results, it could be inferred that the largemouth bass needs more oxygen to carry out various physiological activities during the absorbing and metabolic processes of higher dietary starch. In addition, our results found high starch significantly increased counts of WBC, NEU, LYM, MON, EOS, and BAS with increasing culturing times, which agrees with previous results in Labeo rohita [52] and gilthead sea bream (Sparus aurata) [53]. It is well-known that adequate counts of WBC, NEU, LYM, MON, EOS, and BAS could improve immunity and enhance the defense effects when the animal is infected by some kinds of pathogens or fed with adequate nutrients [54]. However, excessive counts of WBC, NEU, MON, EOS, and BAS could induce inflammation and/or inflammatory responses in dairy goat [55], rat [56], and humans with type 2 diabetes mellitus [57]. The combination of these discoveries and our study outcomes indicates that increased consumption of dietary starch may lead to inflammation or inflammatory reactions in largemouth bass.
Serum biochemical indices are widely recognized as crucial indicators of health and metabolic status in both humans and animals. ALT and AST variations reflect hepatic metabolism and environmental abnormalities in animals [58]. Increased serum ALT and AST levels in the D3, D5, and D7 groups indicated that hepatic metabolism might be disturbed or damaged mediated by high dietary starch in largemouth bass [17]. Meanwhile, serum BUN variations could correlate with nitrogen utilization and reflect the homeostasis of exogenous amino acids [59]. So, higher BUN contents presented in D1–D7 groups indicated high dietary starch might impair exogenous nitrogen utilization in largemouth bass. Although ALP could act as an immune defense biomarker [60,61], excessive levels of ALP could couple degeneration, necrosis, and destruction of the liver due to cellular damage [62]. Moreover, higher levels of serum ALP are also correlated with the bile ducts obstructed in metabolic liver diseases [60]. Combined with higher serum ALP activities in fish fed high-starch diets in this study, it is suggested high dietary starch could cause cellular damage in largemouth bass. In addition to being an important immune index, serum ALB also plays a key role in the antioxidant function [63]. Considering the lower levels of serum ALB in D7 groups, it indicated that high dietary starch could impair immunity and increase the danger of oxidative stress in largemouth bass. Previous studies have found higher levels of serum TBA could be correlated with early-stage metabolic liver disease mediated by higher contents of cholesterol in animals [37,64]. Therefore, elevated levels of serum TBA suggest that increased dietary starch not only worsens liver damage but also triggers cholestatic disease in largemouth bass [65,66]. In typical physiological conditions, HDL-C moves total cholesterol from peripheral tissues to the liver for additional processing and bile acid production, whereas LDL-C transports hepatic cholesterol to other tissues [67]. Our findings showed contrasting trends in the HDL-C and LDL-C levels in D7 groups when compared with those in D0 groups (Table 4), which is consistent with previous findings in mice [68] and juvenile blunt snout bream [43]. Moreover, some researches have shown the level of TG and TC is positively proportional to the severity of fatty liver [67,69]. Combined with higher contents of serum TAG and TC, it is suggested that high dietary starch could not only prevent TC and TAG from being absorbed and utilized by the body, but also induce their accumulation in the body and then result in dyslipidemia and metabolic fatty liver [70].
Carnivorous fish are recognized as having weak capabilities for processing glucose and often present persistent hyperglycemia after feeding on a diet with high starch [2]. INS, ADPN, and GC play a crucial role as endocrine hormones in maintaining the glucose balance by managing fluctuations in serum glucose levels in both mammals and animals, as highlighted in studies by del sol Novoa et al. [71], Xu et al. [72], and Zhong et al. [17]. Elevated levels of serum glucose can trigger INS and ADPN release or decrease glucagon production to alleviate stress from hyperglycemia and maintain the glucose balance [73]. Our research discovered contrasting trends in the levels of serum INS, ADPN, and GC, despite a consistent increase in serum glucose levels in largemouth bass fed a high-starch diet. Likewise, earlier research has demonstrated that a 20% wheat starch diet led to a notable increase in blood glucose and INS levels in largemouth bass [6] and over a 4-week period in rainbow trout [74]. Conversely, it was observed that a high-starch diet resulted in significantly higher blood glucose levels after 3 h of feeding, but had no impact on INS levels in largemouth bass fed a diet with high starch (13.56%) [18]. As for these differences on the INS contents, it might be due to the different sample time in these studies. Furthermore, the levels of INS and ADPN were both decreased in the D7 groups, indicating that inadequate secretion of these hormones was the primary cause of glucose intolerance in carnivorous fish species [2]. In addition to reducing appetite signal, LEP also plays a crucial role in controlling fat or lipid reserves in both humans and animals [75,76,77]. Considering these findings and higher contents of serum LEP in this study, it indicated that higher starch could induce LEP secretion, which could then initiate the self-regulatory mechanism in response to higher serum glucose in largemouth bass [78]. Moreover, higher LEP levels were also presented in these obese individuals with a higher percentage of body fat, which was mainly mediated by typical LEP resistance in obesity [79]. The combination of these discoveries and our own results indicates that elevated starch levels may lead to LEP resistance, ultimately disrupting the regulation of lipid metabolism in largemouth bass, although further research about this resistance mechanism is needed to fully understand this.
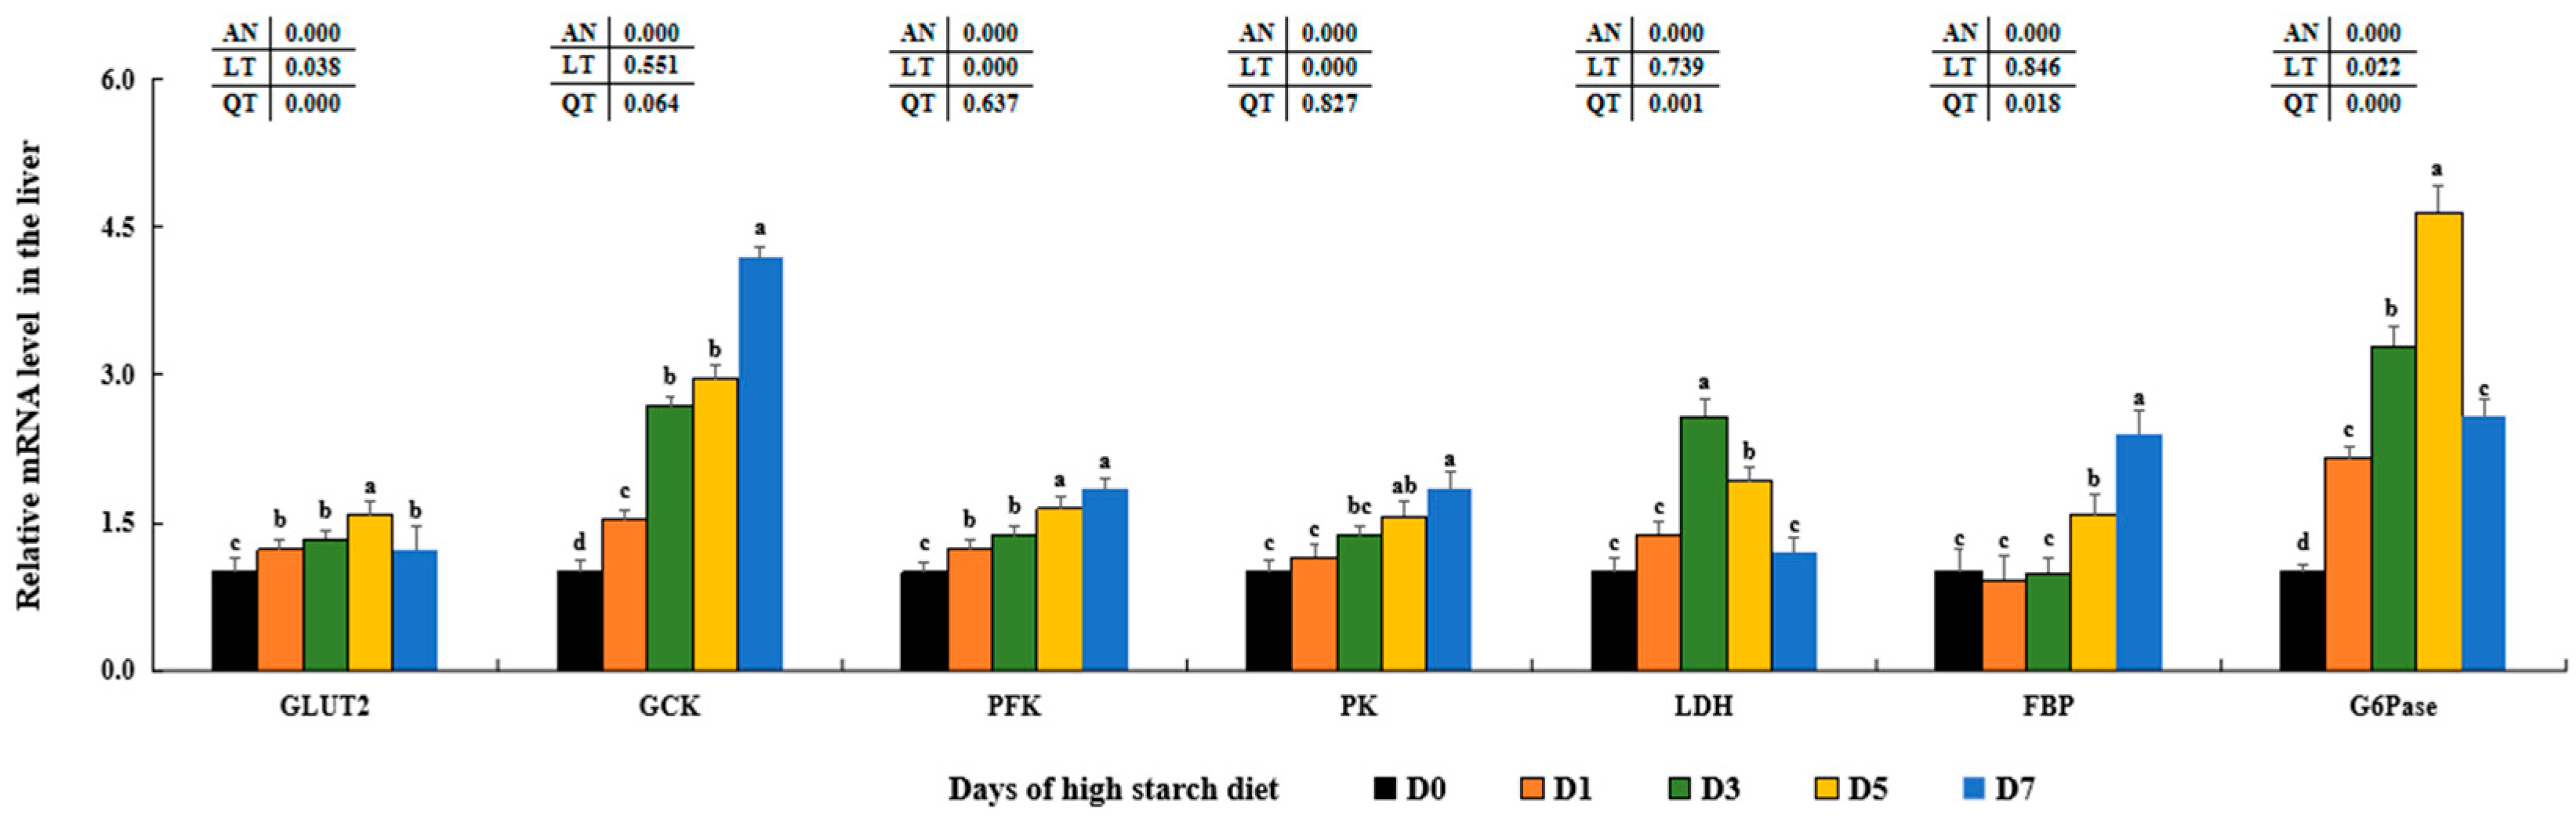
As a major metabolic organ, the liver tissue plays important roles regulating glucose and lipid metabolic processes, include glycolysis, gluconeogenesis, glycogen synthesis, lipogenesis and lipolysis [10]. The important role of GLUT2 in regulating glucose transfer between the liver and serum through the PI3K/AKT signaling pathway has been widely recognized [80,81]. Our research found that elevated levels of dietary starch significantly increased GLUT2 levels at both transcription and protein levels, consistent with findings in rainbow trout (Oncorhynchus mykiss) [82], blunt snout bream [83], and Gibel carp (Carassius gibelio) [84]. This indicates that high starch intake may enhance the transport of plasma glucose into hepatic cells by stimulating GLUT2 in largemouth bass. Numerous past research has indicated that elevated levels of starch can trigger glycolysis pathways through the INS signal pathway in mice [85], blunt snout bream [86], common carp (Cyprinus carpio) [87], and largemouth bass [45]. Levels of GCK, PFK, PK, ISRa, ISRS2b, PI3Kc, and AKT1 were significantly increased in the D5–D7 groups that were fed the high-starch diet, as well as with higher PA contents in our findings. Our results, along with these discoveries, suggest that elevated levels of starch may enhance glucose metabolism by stimulating glycolysis through the activation of the typical PI3K/AKT signaling pathway in largemouth bass. Additionally, gluconeogenesis was also stimulated with elevated levels of FBP and G6Pase in the D5–D7 groups that were given high-starch diet, which is similar with former results in largemouth bass fed 13.56% dietary starch [18], suggesting there was a competition between dietary glucose and endogenous productive glucose. Based on these findings, it was suggested that high levels of starch could lead to glucose metabolic disorders and hinder glucose utilization in largemouth bass.
Furthermore, the hepatic production of glycogen in animals may be controlled by the PI3K/AKT signaling pathway, which acts on its downstream proteins and enzymes (GYG2, GCS, GBE, and GDE) as indicated by Yang et al. [37] and Zhang et al. [88]. Typically, increased levels of GYG2, GCS, and GBE may play important functions in enhancing glycogen production, whereas elevated GDE levels could facilitate the breakdown of hepatic glycogen [2]. Past research has shown that the amounts of glycogen in the liver increased as the levels of starch in the diet rose for red spotted grouper (Epinephelus akaara) [89] and blunt snout bream [90]. Furthermore, by utilizing [U-14C] glucose as a marker, it showed a significant rise in glycogen synthesis from glucose in largemouth bass when the dietary starch level was raised from 5% to 15% [91]. Combined with these findings, it indicated that high starch may induce hepatic glycogen synthesis in largemouth bass through the PI3K/AKT signal transduction pathway, as evidenced by the variations of these key molecules, LAG contents, and PAS-stained histological sections in our results. Nevertheless, levels of hepatic LA and LDH activities in serum and liver showed significant increases in the D1–D7 groups, mirroring findings in goats [92] and cattle [93] that were given a high-starch diet. Past research has shown that increased LA accumulation can lead to risks such as lactic acidosis, nonalcoholic fatty liver disease, and tumors in humans and animals [94,95,96,97]. Based on these discoveries and our findings, it appears that excessive LA levels could lead to lactic acidosis and metabolic disorders in largemouth bass fed a diet high in starch.
Typically, Ac-CoA is converted by ACC1 into Mal-CoA, which is then transformed by FAS into fatty acids (FAs) within the liver cells [18,98]. The citrate-pyruvate pathway, facilitated by ME, and the pentose-citrate pathway, facilitated by G6PD, supply the necessary energy for this process [37]. Consistent with prior findings in largemouth bass that were given a high-starch diet [18], we also observed elevated levels of ACC, FAS, Mal-CoA, SCD, ME1, G6PD, and PGD in fish fed a high-starch diet. This suggests that high starch intake can stimulate fatty acid production by up-regulating the expression of these genes associated with lipid synthesis in the liver of largemouth bass. Moreover, FATP1 can facilitate the transfer of FA to the endoplasmic reticulum within liver cells for the production of LTAG, as demonstrated by Ipsen et al. [99] and López [100]. And GK, GPAT3, GPAT4, and DGAT2 are the rate-limiting enzymes during LTAG synthesizing processes [101]. Then, these synthesized LTAG could bind apolipoprotein B100 (APOB100) and enter the bloodstream by free diffusion [102]. Meanwhile, Plin2, as a key lipid droplet coated protein, is tightly related with lipid droplet biogenesis and storage in tissues [103]. Elevated levels of Plin2 are often associated with various metabolic disorders, including insulin resistance and type 2 diabetes in human and animals [103,104]. The study found that FABP10, GPAT3, GPAT4, DGAT2, APOB100, and Plin2 levels were notably higher in groups consuming high-starch diets, consistent with earlier findings in largemouth bass [18] and gilthead sea bream [105]. Previous research has shown that the AKT/SREBP1c signaling pathway can stimulate LTG synthesis in both animals and fish, as documented by Wang et al. [106] and Ferre et al. [107]. In addition to increased levels of these important molecules, this study also showed that high starch in largemouth bass can activate the AKT/SREBP1c signal pathway, leading to enhanced FA and LTAG synthesis, as well as lipid droplet formation, as demonstrated by LTAG levels and histological sections stained with HE and ORO in this study.
SREBP2, a crucial transcription factor, has the ability to regulate the metabolism and balance of cholesterol in the liver by influencing the transcription of genes that are regulated by sterols, such as AACS, HMGCS, HMGCRa, and CYP51 [18,19]. AACS has the ability to use ketone bodies for the creation of cholesterol and fatty acids, converting acetoacetate into its CoA ester to generate acetoacetyl-CoA in the cytosol [108]. This process is facilitated by HMGCS, which transforms acetoacetyl-CoA into 3-hydroxy-3-methylglutaryl-CoA (HMG-CoA) [109,110]. Subsequently, HMGCRa is able to facilitate the transformation of HMG-CoA into mevalonic acid in order to generate cholesterol [111]. CYP51 plays an essential role in the sterols’ production and is a significant focus of cholesterol-lowering medications according to recent studies [112,113,114]. Our results showed that a diet with high-starch significantly increased the levels of SREBP2 and its target genes related to cholesterol synthesis (AACS, HMGCS, HMGCRa, and CYP51) in groups D1, D3, and D5. This effect was consistent with findings in largemouth bass [18] and male C57BL/6J mice [115], suggesting that high starch intake may stimulate cholesterol production through the SREBP2 signaling pathway in the hepatic cells of largemouth bass. The expression of these genes was significantly reduced in the D7 groups compared to that in the D3 groups, which might be due to the negative feedback regulatory mechanism mediated by higher contents of TC in the liver of largemouth bass [19,20], although further research is needed to fully understand this regulatory process. In addition, SOAT2 plays an important function in lipid droplet biogenesis and storage by converting cholesterol to cholesteryl ester in cells [104,116]. Prior research has shown that an increase in lipid droplets can be triggered by elevated glucose levels in normal colon cells and colorectal cancer stem cells [117], as well as in mice with type 2 diabetes [118]. Based on these results, it is proposed that increased levels of SOAT2 may be responsible for the accumulation of lipid droplets in largemouth bass fed a high-starch diet. Meanwhile, ABCG5 and ABCG8 act as key proteins transporting endogenous cholesterol out of the liver into other tissues, while NPC1L1 plays key roles in up-taking intestine cholesterol into hepatic cells [119,120]. Combined with these findings and lower levels of ABCG5, ABCG8, and NPC1L1 in this study, it indicated these three key reduced transporters might mediate the hepatic cholesterol decomposition in largemouth bass [116].
In general, bile acid synthesis is mainly regulated by two key rate-limiting enzymes (CYP7A1 and CYP27A1) mediating the oxidation of cholesterol in hepatocytes [120,121]. Higher CYP7A1 and CYP27A1 levels in D1–D3 groups indicated high starch could induce bile acid synthesis via the oxidation of cholesterol in hepatocytes of largemouth bass. The reduced levels of CYP7A1 and CYP27A1 in D5–D7 groups might be caused by the negative feedback regulatory mechanism mediated by higher TBA contents in hepatocytes [121,122]. Furthermore, liver bile acids may be moved into the bile canaliculus using the bile salt transporter known as the canalicular bile salt export pump (BSEP) [123,124]. Although there were no marked differences among D0–D5 groups, lower BSEP levels in D7 groups indicated high starch might block the transportation of hepatic bile acids into bile canaliculus and then result in possible cholestasis [120,121]. Two important transporting polypeptides, NTCP and OATP1, facilitate the absorption of bile acids from the portal vein into hepatocytes [125]. Higher NTCP and OATP1 levels in D1–D5 groups indicated that bile acids could be taken up into hepatocytes induced by high starch, which might further aggravate cholestasis in largemouth bass. In humans and rodents, studies have found higher levels of hepatic OST-α could help bile acid excretion into the circulating system [122,126]. Combined with higher OST-α mRNA levels and serum TBA contents, it indicated that high starch could drive bile acid excretion into the circulating system via a heightening expression of hepatic OST-α in largemouth bass, although this driving mechanism needed to be studied in fish species [127].
It is well known that cellular ROS is mainly generated by NADPH oxidases (NOX) and the respiratory electron transport chain (ETC) of mitochondria during glucose metabolic processes in animals [28,128,129]. Our study revealed that the expression of certain genes, such as G6PD, NOX1, NADPH oxidase activator 1 (NOXA1), and cytochrome c oxidase 4 (COX4), along with the levels of H2O2 significantly increased with high-starch diets. This is consistent with findings in humans with diabetes [23,25,130], suggesting that high starch intake may enhance oxidative phosphorylation, leading to elevated ROS levels in largemouth bass liver. In general, SOD and CAT in antioxidant systems could catalyze ROS and reduce oxidative stress in animals [5,21]. Meanwhile, increased GST and MDA amounts can symbolize physiological biomarkers to oxidative or inflammatory stress in cultured animals [1,3]. Past research has shown that the antioxidant abilities were diminished by elevated starch levels in black carp [131], black sea bream (Acanthopagrus schlegelii) [12], GIFT tilapia [5], and largemouth bass [132]. Similarly, our results also found a notable reduction in the amounts of SOD, CAT and T-AOC along with a significant increase in the amounts of GST, MDA, and H2O2 in the D5 and D7 groups that were given a high-starch diet. Moreover, a specialized thioredoxin system within mitochondria, consisting of Trx2, TrxR2, and Prx3, has been identified as crucial for protecting against oxidative stress induced by H2O2 through disulfide reductase functions [133,134]. Our results show that a high-starch diet could inhibit the genetic expressions of Trx2, TrxR2, and Prx3 in the liver in largemouth bass. Considering these findings and our data, it indicated that high starch could aggravate ROS damage and disturb mitochondrial redox homeostasis by decreasing antioxidant capabilities in largemouth bass [128].
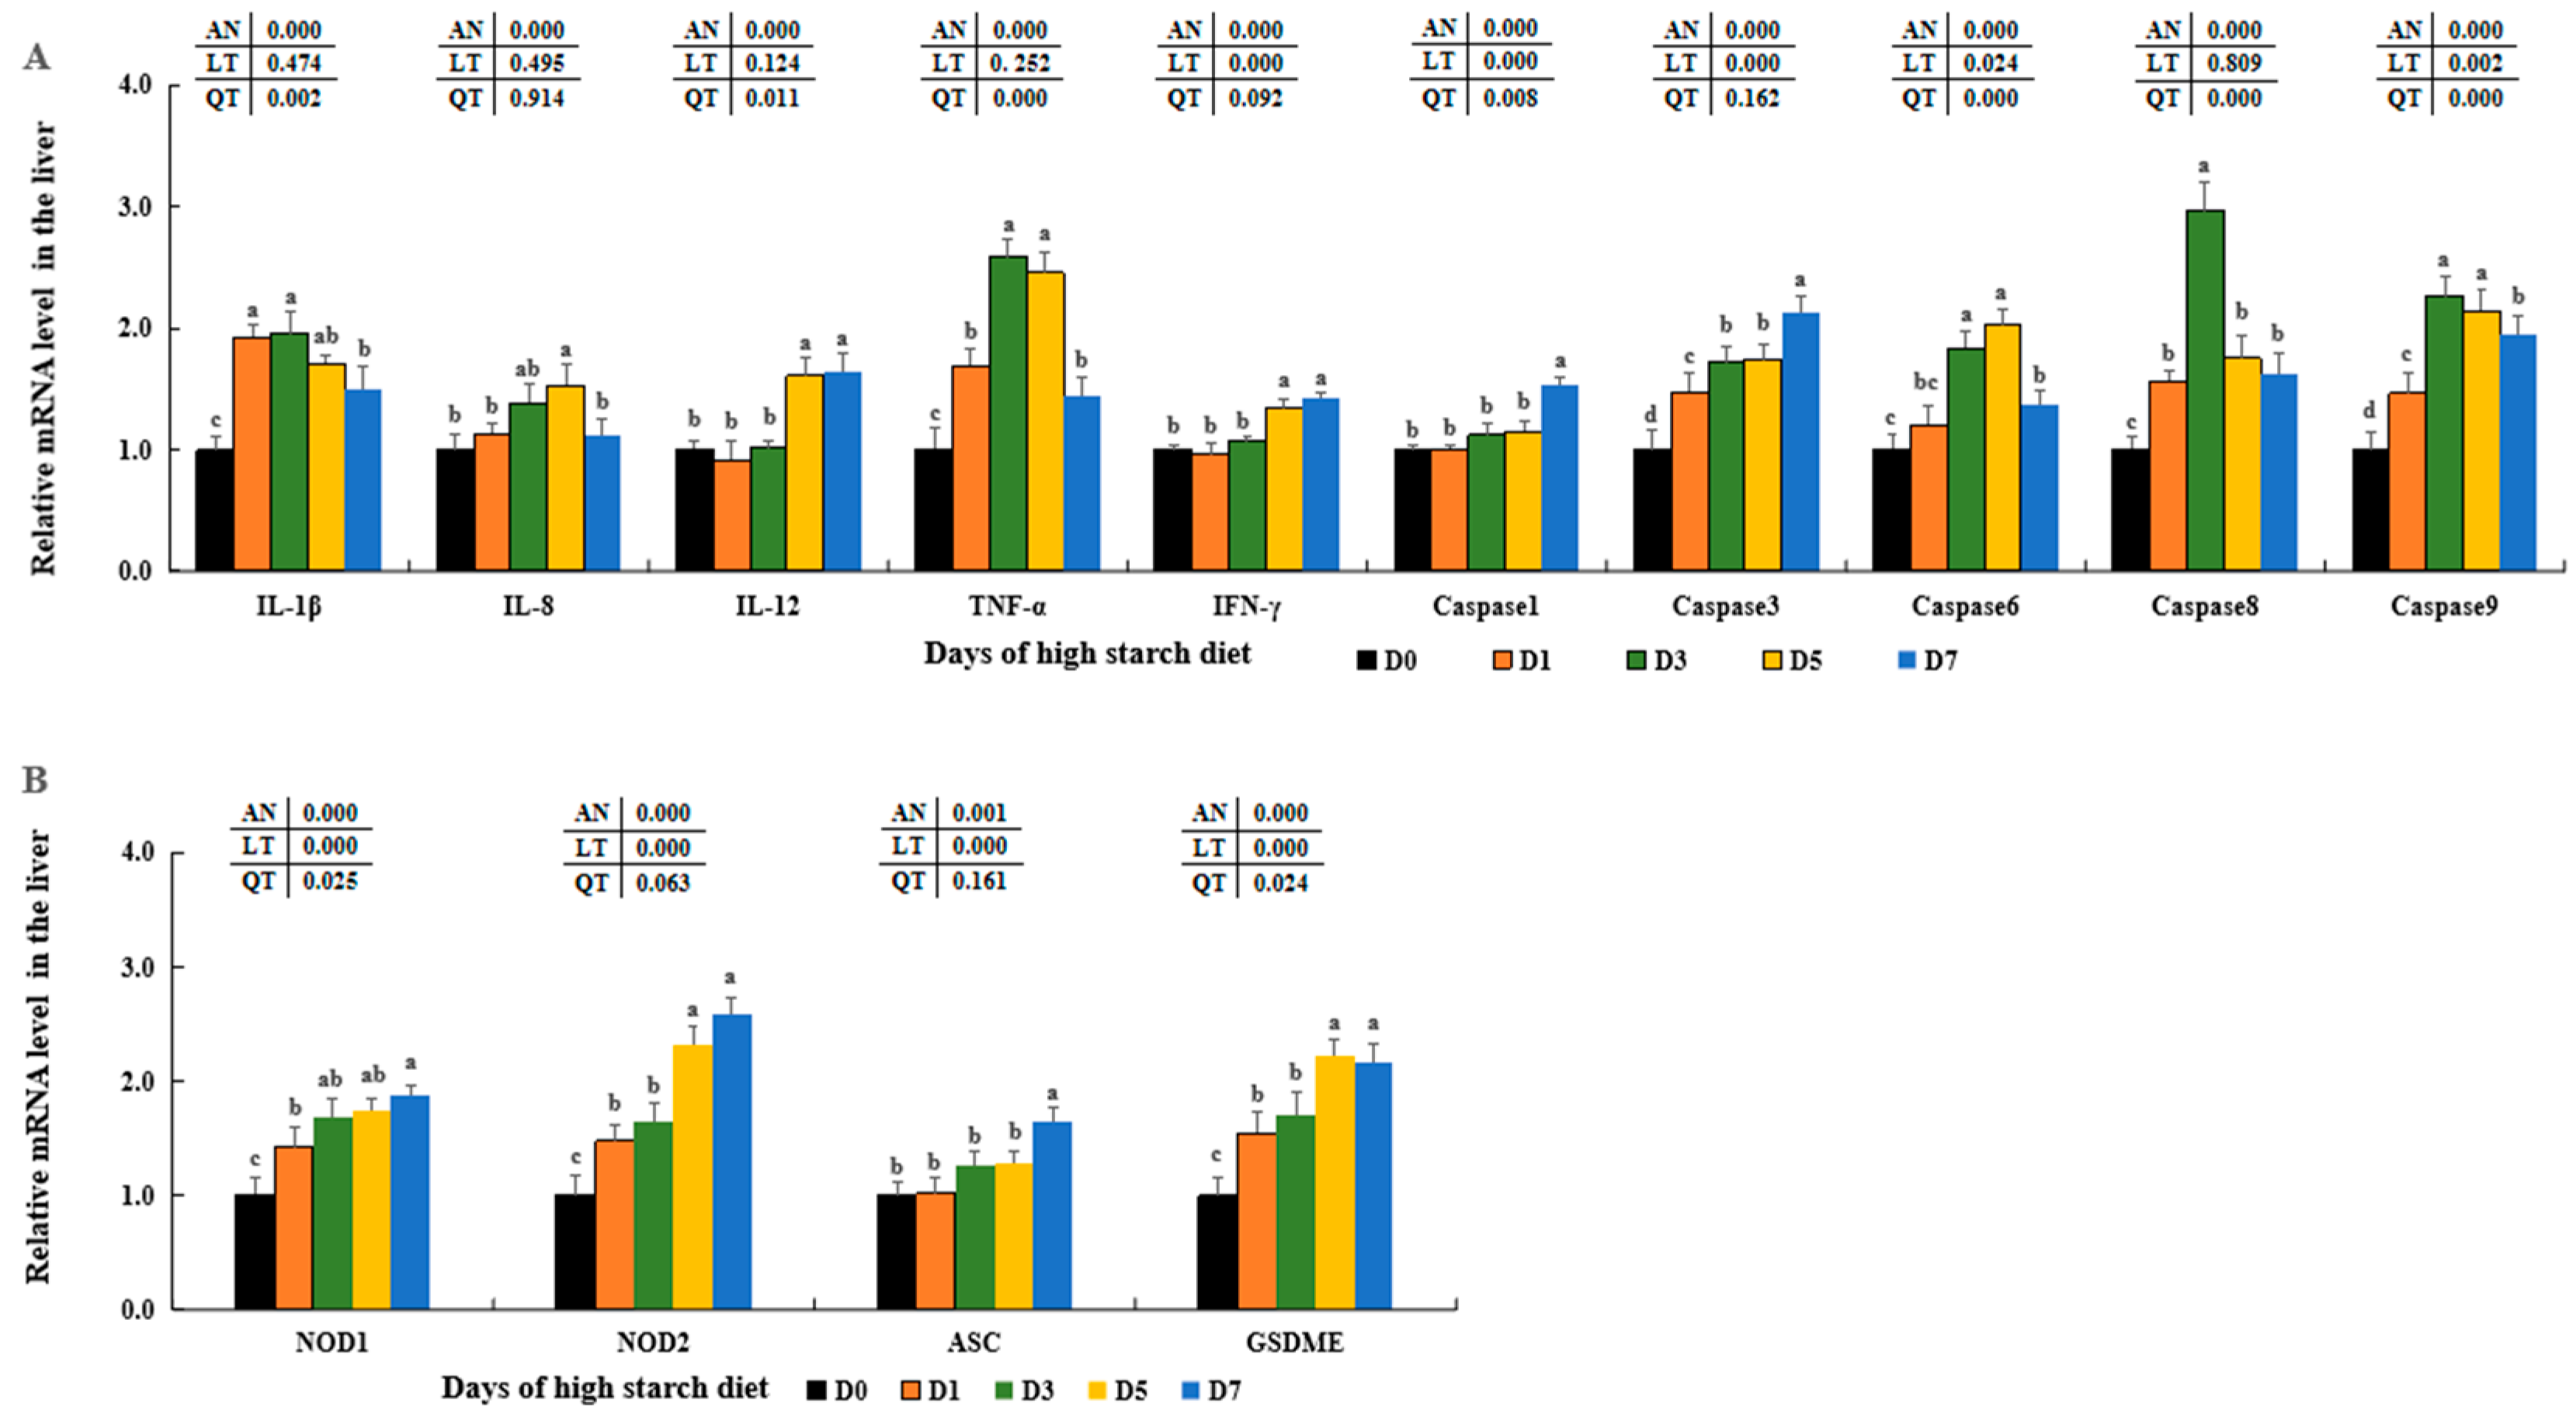
Numerous research studies have shown that an overabundance of NOX-derived ROS can lead to inflammation by boosting the generation of pro-inflammatory cytokines in the liver, such as IL-1β, TNF-α, IFN-γ, IL-6, IL-8, IL-12, IL-17, and others [24,29]. Prior studies have discovered elevated amounts of inflammatory markers such as IL-1β, TNF-α, and IFN-γ, which were presented in human with diabetes [135,136,137], pig with malnutrition [138], and mice fed high-carbohydrate diets [139]. Likewise, our results showed elevated concentrations of IL-1β, IL-6, IL-8, IL-12, IL-17, TNF-α, and IFN-γ in the hepatic cells of largemouth bass with increasing time of feeding high-starch diet in this study. Combined with previous results and our findings, it further proved that inflammatory responses could be caused by ROS excessively generated during the metabolism of higher dietary starch in largemouth bass. In addition, the secretion and maturation of these pro-inflammatory cytokines were mediated by the typical NLRP3 inflammasome in human and animal cells [24,33]. The NLRP3 inflammasome consists of the NLRP3 sensor molecule, the ASC adaptor protein, and pro-caspase-1 [35]. Various molecular and cellular events, including ROS overload, can lead to the stimulation of the NLRP3 inflammasome [27,140]. In the formation of NLRP3 inflammasomes, pro-caspase-1 can transform into cleaved-caspase-1, triggering the processing of pro-IL-1β precursors into their active states [135,141]. Recent research has shown that elevated glucose levels can stimulate the generation of ROS, boost the triggering of the NLRP3 inflammasome, and increase IL-1β release in macrophages [34,142] as well as in RSC96 (rat Schwann cell line) cells [27]. Moreover, additional research has shown that elevated glucose levels can lead to the depletion of retinal pericytes through a process of inflammatory cell death involving NLRP3 and caspase-1 [141]. The research also revealed increased ASC, NOD1, NOD2, GSDME, and caspase-1 expression in fish groups exposed to high starch, mirroring findings in human and rat cells [27,34]. By combining these discoveries with our own results, we can conclude that inflammatory reactions may be initiated by the activation of the NLRP3 inflammasome induced by ROS overload in largemouth bass fed with high starch (Figure 11).

5. Conclusions

In summary, our results found high starch could increase body physical indicators (HSI, VSI, and ISI) and counts of leukocytes (WBC, NEU, MON, EOS, and BAS). And high starch could cause insufficient secretion of INS and ADPN and then induce glucose metabolic disorders and abnormal glycogen accumulation. Meanwhile, high starch could cause abnormal TAG and cholesterol accumulation via SREBP1/2 signal pathways. In addition, high starch could induce oxidative stress by heightening ROS contents and reducing antioxidant capabilities. Oxidative stress or ROS overload induced by high starch in largemouth bass can activate the NLRP3 inflammasome, leading to inflammatory responses (Figure 11).

Author Contributions

Conceptualization, C.W., X.S. and Y.X.; methodology, Y.X., P.Z., H.Z., J.Y., X.Y., Y.F., J.W. and C.W.; software, Y.X., P.Z. and H.Z.; validation, Y.X., P.Z., H.Z., J.Y., X.Y., Y.F. and J.W.; formal analysis, Y.X., P.Z. and H.Z.; investigation, Y.X., P.Z. and H.Z.; resources, C.W. and X.S.; data curation, Y.X., P.Z. and H.Z.; writing—original draft preparation, Y.X., X.S., P.Z., H.Z., J.Y., X.Y., Y.F., J.W. and C.W.; writing—review and editing, Y.X., X.S., P.Z., H.Z., J.Y., X.Y., Y.F., J.W. and C.W.; visualization, Y.X., P.Z. and H.Z.; supervision, J.Y., Y.F., J.W., C.W. and X.S.; project administration, C.W.; funding acquisition, C.W. All authors have read and agreed to the published version of the manuscript.

Funding

This research was funded by the Key Research and Development Program of Zhejiang Province (2019C02046).

Institutional Review Board Statement

Animal procedures were strictly performed in accordance with the Regulations of the Experimental Animal Ethics Committee of Huzhou University and approved by the Institutional Animal Care and Use Committee (approval ID: HUZJ-DW-2022-032; approval date: 6 March 2022).

Informed Consent Statement

Not applicable.

Data Availability Statement

The data presented in this study are available in the main article.

Acknowledgments

The authors thank Xiaoqin Hua and Qian Gao (Hangzhou Haoke Biotech Co., Ltd. (Hangzhou, China)) for contributing in the analysis of the histopathological lesions of fish liver.

Conflicts of Interest

The authors declare no conflict of interest, there is no connection between these companies and the subject of this manuscript.

References

  1. Deng, K.; Pan, M.; Liu, J.; Yang, M.; Gu, Z.; Zhang, Y.; Liu, G.; Liu, D.; Zhang, W.; Mai, K. Chronic stress of high dietary carbohydrate level causes inflammation and influences glucose transport through SOCS3 in Japanese flounder Paralichthys olivaceus. Sci. Rep. 2018, 8, 7415. [Google Scholar] [CrossRef]
  2. Kamalam, B.S.; Medale, F.; Panserat, S. Utilisation of dietary carbohydrates in farmed fishes: New insights on influencing factors, biological limitations and future strategies. Aquaculture 2017, 467, 3–27. [Google Scholar] [CrossRef]
  3. Signorello, M.G.; Ravera, S.; Leoncini, G. Lectin-induced oxidative stress in human platelets. Redox Biol. 2020, 32, 101456. [Google Scholar] [CrossRef] [PubMed]
  4. Vielma, J.; Koskela, J.; Ruohonen, K.; Jokinen, I.; Kettunen, J. Optimal diet composition for European whitefish (Coregonus lavaretus): Carbohydrate stress and immune parameter responses. Aquaculture 2003, 225, 3–16. [Google Scholar] [CrossRef]
  5. Han, H.; Wang, Z.; Wang, J.; Wang, T.; Li, Y.; Guan, D.; Sun, H. Impact of high dietary cornstarch level on growth, antioxidant response, and immune status in GIFT tilapia Oreochromis niloticus. Sci. Rep. 2021, 11, 6678. [Google Scholar] [CrossRef]
  6. Lin, S.M.; Shi, C.M.; Mu, M.M.; Chen, Y.J.; Luo, L. Effect of high dietary starch levels on growth, hepatic glucose metabolism, oxidative status and immune response of juvenile largemouth bass, Micropterus salmoides. Fish Shellfish Immunol. 2018, 78, 121–126. [Google Scholar] [CrossRef]
  7. Sari, D.N.; Ekasari, J.; Nasrullah, H.; Suprayudi, M.A.; Alimuddin, A. High carbohydrate increases amylase, plasma glucose, and gene expression related to glycolysis in giant gourami Osphronemus goramy. Fish Physiol. Biochem. 2022, 48, 1495–1505. [Google Scholar] [CrossRef]
  8. Su, J.; Gong, Y.; Mei, L.; Xi, L.; Chi, S.; Yang, Y.; Jin, J.; Liu, H.; Zhu, X.; Xie, S.; et al. The characteristics of glucose homoeostasis in grass carp and Chinese longsnout catfish after oral starch administration: A comparative study between herbivorous and carnivorous species of fish. Br. J. Nutr. 2020, 123, 627–641. [Google Scholar] [CrossRef]
  9. do Carmo Gominho-Rosa, M.; Rodrigues, A.P.O.; Mattioni, B.; de Francisco, A.; Moraes, G.; Fracalossi, D.M. Comparison between the omnivorous jundiá catfish (Rhamdia quelen) and Nile tilapia (Oreochromis niloticus) on the utilization of dietary starch sources: Digestibility, enzyme activity and starch microstructure. Aquaculture 2015, 435, 92–99. [Google Scholar] [CrossRef]
  10. Xia, R.; Liu, H.K.; Liu, X.F.; Deng, X.; Qin, C.J.; He, Y.F.; Lin, S.M.; Chen, Y.J. Molecular cloning and tissue distribution of glucokinase and glucose-6-phosphatase catalytic subunit paralogs in largemouth bass Micropterus salmoides: Regulation by dietary starch levels and a glucose load. Comp. Biochem. Physiol. A Mol. Integr. Physiol. 2024, 287, 111523. [Google Scholar] [CrossRef]
  11. Zhang, B.Y.; Yang, H.L.; Nie, Q.J.; Zhang, Y.; Cai, G.H.; Sun, Y.Z. High dietary wheat starch negatively regulated growth performance, glucose and lipid metabolisms, liver and intestinal health of juvenile largemouth bass, Micropterus salmoides. Fish Physiol. Biochem. 2024, in press. [Google Scholar] [CrossRef]
  12. Wang, L.; Sun, Y.; Xu, B.; Sagada, G.; Chen, K.; Xiao, J.; Zhang, J.; Shao, Q. Effects of berberine supplementation in high starch diet on growth performance, antioxidative status, immune parameters and ammonia stress response of fingerling black sea bream (Acanthopagrus schlegelii). Aquaculture 2020, 527, 735473. [Google Scholar] [CrossRef]
  13. Wu, C.; Ye, J.; Gao, J.; Chen, L.; Lu, Z. The effects of dietary carbohydrate on the growth, antioxidant capacities, innate immune responses and pathogen resistance of juvenile black carp Mylopharyngodon piceus. Fish Shellfish Immunol. 2016, 49, 132–142. [Google Scholar] [CrossRef] [PubMed]
  14. Jiang, G.; Zhang, B.B. Glucagon and regulation of glucose metabolism. Am. J. Physiol. Endocrinol. Metab. 2003, 284, E671–E678. [Google Scholar] [CrossRef]
  15. Hatting, M.; Tavares, C.D.J.; Sharabi, K.; Rines, A.K.; Puigserver, P. Insulin regulation of gluconeogenesis. Ann. N. Y. Acad. Sci. 2018, 1411, 21–35. [Google Scholar] [CrossRef] [PubMed]
  16. Li, X.; Han, T.; Zheng, S.; Wu, G. Hepatic glucose metabolism and its disorders in fish. Adv. Exp. Med. Biol. 2022, 1354, 207–236. [Google Scholar]
  17. Zhong, L.; Liu, H.; Zhang, H.; Zhang, W.; Li, M.; Huang, Y.; Yao, J.; Huang, X.; Geng, Y.; Chen, D.; et al. High Starch in diet leads to disruption of hepatic glycogen metabolism and liver fibrosis in largemouth bass (Micropterus salmoides), which is mediated by the PI3K/Akt signaling pathway. Front. Physiol. 2022, 13, 880513. [Google Scholar] [CrossRef]
  18. Chen, P.; Zhu, Y.; Wu, X.; Gu, X.; Xue, M.; Liang, X. Metabolic adaptation to high-starch diet in largemouth bass (Micropterus salmoides) was associated with the restoration of metabolic functions via inflammation, bile acid synthesis and energy metabolism. Br. J. Nutr. 2023, 129, 381–394. [Google Scholar] [CrossRef]
  19. Eberle, D.; Hegarty, B.; Bossard, P.; Ferre, P.; Foufelle, F. SREBP transcription factors: Master regulators of lipid homeostasis. Biochimie 2004, 86, 839–848. [Google Scholar] [CrossRef]
  20. Horton, J.D.; Goldstein, J.L.; Brown, M.S. SREBPs: Activators of the complete program of cholesterol and fatty acid synthesis in the liver. J. Clin. Investig. 2002, 109, 1125–1131. [Google Scholar] [CrossRef]
  21. Prasad, S.; Gupta, S.C.; Tyagi, A.K. Reactive oxygen species (ROS) and cancer: Role of antioxidative nutraceuticals. Cancer Lett. 2017, 387, 95–105. [Google Scholar] [CrossRef] [PubMed]
  22. Covarrubias, L.; Hernández-García, D.; Schnabel, D.; Salas-Vidal, E.; Castro-Obregón, S. Function of reactive oxygen species during animal development: Passive or active? Dev. Biol. 2008, 320, 1–11. [Google Scholar] [CrossRef] [PubMed]
  23. Rains, J.L.; Jain, S.K. Oxidative stress, insulin signaling, and diabetes. Free Radic. Biol. Med. 2011, 50, 567–575. [Google Scholar] [CrossRef] [PubMed]
  24. Abais, J.M.; Xia, M.; Li, G.; Chen, Y.; Conley, S.M.; Gehr, T.W.B.; Boini, K.M.; Li, P.L. Nod-like receptor protein 3 (NLRP3) inflammasome activation and podocyte injury via thioredoxin-interacting protein (TXNIP) during hyperhomocysteinemia. J. Biol. Chem. 2014, 289, 27159–27168. [Google Scholar] [CrossRef] [PubMed]
  25. Han, Y.; Xu, X.; Tang, C.; Gao, P.; Chen, X.; Xiong, X.; Yang, M.; Yang, S.; Zhu, X.; Yuan, S.; et al. Reactive oxygen species promote tubular injury in diabetic nephropathy: The role of the mitochondrial ros-txnip-nlrp3 biological axis. Redox Biol. 2018, 16, 32–46. [Google Scholar] [CrossRef]
  26. Liu, Y.; Liu, N.; Wang, A.; Chen, N.; Li, S. Resveratrol inclusion alleviated high-dietary-carbohydrate-induced glycogen deposition and immune response of largemouth bass, Micropterus salmoides. Br. J. Nutr. 2022, 127, 165–176. [Google Scholar] [CrossRef] [PubMed]
  27. Cheng, Y.C.; Chu, L.W.; Chen, J.Y.; Hsieh, S.L.; Chang, Y.C.; Dai, Z.K.; Wu, B.N. Loganin Attenuates High Glucose-induced Schwann cells pyroptosis by inhibiting ROS generation and NLRP3 inflammasome activation. Cells 2020, 9, 1948. [Google Scholar] [CrossRef] [PubMed]
  28. Herb, M.; Schramm, M. Functions of ROS in macrophages and antimicrobial immunity. Antioxidants 2021, 10, 313. [Google Scholar] [CrossRef] [PubMed]
  29. Liu, J.; Han, X.; Zhang, T.; Tian, K.; Li, Z.; Luo, F. Reactive oxygen species (ROS) scavenging biomaterials for anti-inflammatory diseases: From mechanism to therapy. J. Hematol. Oncol. 2023, 16, 116. [Google Scholar] [CrossRef]
  30. Kounis, N.G.; Soufras, G.D.; Tsigkas, G.; Hahalis, G. White blood cell counts, leukocyte ratios, and eosinophils as inflammatory markers in patients with coronary artery disease. Clin. Appl. Thromb. Hemost. 2015, 21, 139–143. [Google Scholar] [CrossRef]
  31. Fazio, F. Fish hematology analysis as an important tool of aquaculture: A review. Aquaculture 2019, 500, 237–242. [Google Scholar] [CrossRef]
  32. Witeska, M.; Kondera, E.; Bojarski, B. Hematological and Hematopoietic analysis in fish toxicology-A review. Animals 2023, 13, 2625. [Google Scholar] [CrossRef]
  33. Schroder, K.; Zhou, R.; Tschopp, J. The NLRP3 inflammasome: A sensor for metabolic danger? Science 2010, 327, 296–300. [Google Scholar] [CrossRef] [PubMed]
  34. Dai, J.; Zhang, X.; Li, L.; Chen, H.; Chai, Y. Autophagy inhibition contributes to ROS-producing NLRP3-dependent inflammasome activation and cytokine secretion in high glucose-induced macrophages. Cell Physiol. Biochem. 2017, 43, 247–256. [Google Scholar] [CrossRef]
  35. Schroder, K.; Tschopp, J. The inflammasomes. Cell 2010, 140, 821–832. [Google Scholar] [CrossRef] [PubMed]
  36. Yu, Z.W.; Zhang, J.; Li, X.; Wang, Y.; Fu, Y.H.; Gao, X.Y. A new research hot spot: The role of NLRP3 inflammasome activation, a key step in pyroptosis, in diabetes and diabetic complications. Life Sci. 2020, 240, 117138. [Google Scholar] [CrossRef] [PubMed]
  37. Yang, W.; Wu, J.; Song, R.; Li, Z.; Jia, X.; Qian, P.; Zhang, H.; Zhang, P.; Xue, X.; Li, S.; et al. Effects of dietary soybean lecithin on growth performances, body composition, serum biochemical parameters, digestive and metabolic abilities in largemouth bass Micropterus salmoides. Aquac. Rep. 2023, 29, 101528. [Google Scholar] [CrossRef]
  38. Li, X.; Zheng, S.; Ma, X.; Cheng, K.; Wu, G. Effects of dietary protein and lipid levels on the growth performance, feed utilization, and liver histology of largemouth bass (Micropterus salmoides). Amino Acids 2020, 52, 1043–1061. [Google Scholar] [CrossRef] [PubMed]
  39. Wu, J.; Yang, W.; Song, R.; Li, Z.; Jia, X.; Zhang, H.; Zhang, P.; Xue, X.; Li, S.; Xie, Y.; et al. Dietary soybean lecithin improves growth, immunity, antioxidant capability and intestinal barrier functions in largemouth bass Micropterus salmoides juveniles. Metabolites 2023, 13, 512. [Google Scholar] [CrossRef]
  40. Araujo, P.; Zeng, Y.; Du, Z.Y.; Nguyen, T.T.; Froyland, L.; Grung, B. Discrimination of n-3 rich oils by gas chromatography. Lipids 2010, 45, 1147–1158. [Google Scholar] [CrossRef]
  41. Liu, Q.Q.; Xia, R.; Deng, X.; Yang, H.J.; Luo, L.; Lin, S.M.; Qin, C.J.; Chen, Y.J. Effects of dietary starch and metformin levels on the growth performance, body composition, hepatic glycolipid metabolism, and liver histology of juvenile largemouth bass Micropterus salmoides. Aquaculture 2023, 573, 739582. [Google Scholar] [CrossRef]
  42. Romano, N.; Sinha, A.K.; Fischer, H.; Nugroho, R.A.; Powell, A.; Yamamoto, F.Y. Pregelatinized starch improves growth and mitigates adverse liver/intestinal histomorphology in largemouth bass, Micropterus salmoides, juveniles. Anim. Feed Sci. Technol. 2022, 291, 115381. [Google Scholar] [CrossRef]
  43. Xia, S.L.; Li, X.F.; Abasubong, K.P.; Xu, C.; Shi, H.J.; Liu, W.B.; Zhang, D.D. Effects of dietary glucose and starch levels on the growth, apparent digestibility, and skin-associated mucosal non-specific immune parameters in juvenile blunt snout bream (Megalobrama amblycephala). Fish Shellfish Immunol. 2018, 79, 193–201. [Google Scholar] [CrossRef] [PubMed]
  44. Li, S.; Sang, C.; Turchini, G.M.; Wang, A.; Zhang, J.; Chen, N. Starch in aquafeeds: The benefits of a high amylose to amylopectin ratio and resistant starch content in diets for the carnivorous fish, largemouth bass (Micropterus salmoides). Br. J. Nutr. 2020, 124, 1145–1155. [Google Scholar] [CrossRef] [PubMed]
  45. Ma, H.J.; Mou, M.M.; Pu, D.C.; Lin, S.M.; Chen, Y.J.; Luo, L. Effect of dietary starch level on growth, metabolism enzyme and oxidative status of juvenile largemouth bass, Micropterus salmoides. Aquaculture 2019, 498, 482–487. [Google Scholar] [CrossRef]
  46. Ahmed, I.; Reshi, Q.M.; Fazio, F. The influence of the endogenous and exogenous factors on hematological parameters in different fish species: A review. Aquac. Int. 2020, 28, 869–899. [Google Scholar] [CrossRef]
  47. Seibel, H.; Bassmann, B.; Rebl, A. Blood will tell: What hematological analyses can reveal about fish welfare. Front. Vet. Sci. 2021, 8, 616955. [Google Scholar] [CrossRef] [PubMed]
  48. Duman, S.; Sahan, A. Effects of beta-1,3/1,6 glucan dietary supplements on some immunological and hematological health markersin Siberian sturgeon (Acipenser baerii) infected with Aeromonas hydrophila. Pol. J. Vet. Sci. 2023, 26, 109–118. [Google Scholar] [CrossRef]
  49. Kuhn, V.; Diederich, L.; Keller, T.C.S., IV; Kramer, C.M.; Luckstadt, W.; Panknin, C.; Suvorava, T.; Isakson, B.E.; Kelm, M.; Cortese-Krott, M.M. Red blood cell function and dysfunction: Redox regulation, nitric oxide metabolism, anemia. Antioxid. Redox Signal 2017, 26, 718–742. [Google Scholar] [CrossRef]
  50. Klinken, S.P. Red blood cells. Int. J. Biochem. Cell B 2002, 34, 1513–1518. [Google Scholar] [CrossRef]
  51. Stosik, M.; Tokarz-Deptula, B.; Deptula, J.; Deptula, W. Immune functions of erythrocytes in osteichthyes. Front. Immunol. 2020, 11, 1914. [Google Scholar] [CrossRef] [PubMed]
  52. Kumar, S.; Sahu, N.P.; Pal, A.K.; Choudhury, D.; Yengkokpam, S.; Mukherjee, S.C. Effect of dietary carbohydrate on haematology, respiratory burst activity and histological changes in L. rohita juveniles. Fish Shellfish Immunol. 2005, 19, 331–344. [Google Scholar] [CrossRef] [PubMed]
  53. Magalhaes, R.; Martins, N.; Fontinha, F.; Olsen, R.E.; Serra, C.R.; Peres, H.; Oliva-Teles, A. Dietary ARA, DHA, and carbohydrate ratios affect the immune status of gilthead sea bream juveniles upon bacterial challenge. Animals 2023, 13, 1770. [Google Scholar] [CrossRef] [PubMed]
  54. Bandeira Junior, G.; Dos Santos, A.C.; Souza, C.F.; Baldissera, M.D.; Moreira, K.; da Veiga, M.L.; da Rocha, M.; de Vargas, A.P.C.; da Cunha, M.A.; Baldisserotto, B. Citrobacter freundii infection in silver catfish (Rhamdia quelen): Hematological and histological alterations. Microb. Pathog. 2018, 125, 276–280. [Google Scholar] [CrossRef]
  55. Zheng, L.; Shen, J.; Han, X.; Jin, C.; Chen, X.; Yao, J. High rumen degradable starch diet induced blood bile acids profile changes and hepatic inflammatory response in dairy goats. Anim. Nutr. 2023, 14, 121–129. [Google Scholar] [CrossRef] [PubMed]
  56. Tian, Y.F.; He, C.T.; Chen, Y.T.; Hsieh, P.S. Lipoic acid suppresses portal endotoxemia-induced steatohepatitis and pancreatic inflammation in rats. World J. Gastroenterol. 2013, 19, 2761–2771. [Google Scholar] [CrossRef]
  57. Ebrahim, H.; Fiseha, T.; Ebrahim, Y.; Bisetegn, H. Comparison of hematological parameters between type 2 diabetes mellitus patients and healthy controls at Dessie comprehensive specialized hospital, Northeast Ethiopia: Comparative cross-sectional study. PLoS ONE 2022, 17, e0272145. [Google Scholar] [CrossRef]
  58. Ozer, J.; Ratner, M.; Shaw, M.; Bailey, W.; Schomaker, S. The current state of serum biomarkers of hepatotoxicity. Toxicology 2008, 245, 194–205. [Google Scholar] [CrossRef]
  59. Adam, A.M.; Nasir, S.A.R.; Merchant, A.Z.; Rizvi, A.H.; Rehan, A.; Shaikh, A.T.; Abbas, A.H.; Godil, A.; Khetpal, A.; Mallick, M.S.A.; et al. Efficacy of serum blood urea nitrogen, creatinine and electrolytes in the diagnosis and mortality risk assessment of patients with acute coronary syndrome. Indian Heart J. 2018, 70, 353–359. [Google Scholar] [CrossRef]
  60. Sharma, U.; Pal, D.; Prasad, R. Alkaline phosphatase: An overview. Indian J. Clin. Biochem. 2014, 29, 269–278. [Google Scholar] [CrossRef]
  61. Zhou, Q.; Wang, L.; Wang, H.; Xie, F.; Wang, T. Effect of dietary vitamin C on the growth performance and innate immunity of juvenile cobia (Rachycentron canadum). Fish Shellfish Immunol. 2012, 32, 969–975. [Google Scholar] [CrossRef] [PubMed]
  62. Akrami, R.; Gharaei, A.; Mansour, M.R.; Galeshi, A. Effects of dietary onion (Allium cepa) powder on growth, innate immune response and hemato-biochemical parameters of beluga (Huso huso Linnaeus, 1754) juvenile. Fish Shellfish Immunol. 2015, 45, 828–834. [Google Scholar] [CrossRef] [PubMed]
  63. Candiano, G.; Petretto, A.; Bruschi, M.; Santucci, L.; Dimuccio, V.; Prunotto, M.; Gusmano, R.; Urbani, A.; Ghiggeri, G.M. The oxido-redox potential of albumin methodological approach and relevance to human diseases. J. Proteom. 2009, 73, 188–195. [Google Scholar] [CrossRef] [PubMed]
  64. Zhou, X.; Zhang, X.; Zhao, N.; Zhang, L.; Qiu, W.; Song, C.; Chai, J.; Cai, S.; Chen, W. Gut microbiota deficiency exacerbates liver injury in bile duct ligated mice via inflammation and lipid metabolism. Int. J. Mol. Sci. 2023, 24, 3180. [Google Scholar] [CrossRef] [PubMed]
  65. Piechota, J.; Jelski, W. Intrahepatic cholestasis in pregnancy: Review of the literature. J. Clin. Med. 2020, 9, 1361. [Google Scholar] [CrossRef] [PubMed]
  66. Wen, W.; Li, Q.; She, J.; Bai, X.; Zhang, L.; Li, R.; Wu, Y.; Zhou, J.; Yuan, Z. Predictive value of serum TBA for 2-year MACEs in ACS patients undergoing PCI: A prospective cohort study. Sci. Rep. 2024, 14, 1733. [Google Scholar] [CrossRef] [PubMed]
  67. Kosmas, C.E.; Rodriguez Polanco, S.; Bousvarou, M.D.; Papakonstantinou, E.J.; Pena Genao, E.; Guzman, E.; Kostara, C.E. The triglyceride/high-density lipoprotein cholesterol (TG/HDL-C) ratio as a risk marker for metabolic syndrome and cardiovascular disease. Diagnostics 2023, 13, 929. [Google Scholar] [CrossRef] [PubMed]
  68. Zhang, C.; Fang, T.; Shi, L.; Wang, Y.; Deng, X.; Wang, J.; Zhou, Y. The synbiotic combination of probiotics and inulin improves NAFLD though modulating gut microbiota. J. Nutr. Biochem. 2024, 125, 109546. [Google Scholar] [CrossRef]
  69. Amor, A.J.; Perea, V. Dyslipidemia in nonalcoholic fatty liver disease. Curr. Opin. Endocrinol. Diabetes Obes. 2019, 26, 103–108. [Google Scholar] [CrossRef]
  70. Katsiki, N.; Mikhailidis, D.P.; Mantzoros, C.S. Non-alcoholic fatty liver disease and dyslipidemia: An update. Metabolism 2016, 65, 1109–1123. [Google Scholar] [CrossRef]
  71. del sol Novoa, M.; Capilla, E.; Rojas, P.; Baro, J.; Gutierrez, J.; Navarro, I. Glucagon and insulin response to dietary carbohydrate in rainbow trout (Oncorhynchus mykiss). Gen. Comp. Endocrinol. 2004, 139, 48–54. [Google Scholar] [CrossRef] [PubMed]
  72. Xu, C.; Yang, Z.; Yang, Z.F.; He, X.X.; Zhang, C.Y.; Yang, H.M.; Rose, S.P.; Wang, Z.Y. Effects of different dietary starch sources on growth and glucose metabolism of geese. Poult. Sci. 2023, 102, 102362. [Google Scholar] [CrossRef] [PubMed]
  73. Enes, P.; Sanchez-Gurmaches, J.; Navarro, I.; Gutierrez, J.; Oliva-Teles, A. Role of insulin and IGF-1 on the regulation of glucose metabolism in European sea bass (Dicentrarchus labrax) fed with different dietary carbohydrate levels. Comp. Biochem. Physiol. A Mol. Integr. Physiol. 2010, 157, 346–353. [Google Scholar] [CrossRef] [PubMed]
  74. Polakof, S.; Panserat, S.; Soengas, J.L.; Moon, T.W. Glucose metabolism in fish: A review. J. Comp. Physiol. B 2012, 182, 1015–1045. [Google Scholar] [CrossRef] [PubMed]
  75. Marques-Oliveira, G.H.; Silva, T.M.; Lima, W.G.; Valadares, H.M.S.; Chaves, V.E. Insulin as a hormone regulator of the synthesis and release of leptin by white adipose tissue. Peptides 2018, 106, 49–58. [Google Scholar] [CrossRef]
  76. Harris, R.B. Direct and indirect effects of leptin on adipocyte metabolism. Biochim. Biophys. Acta 2014, 1842, 414–423. [Google Scholar] [CrossRef] [PubMed]
  77. Stern, J.H.; Rutkowski, J.M.; Scherer, P.E. Adiponectin, leptin, and fatty acids in the maintenance of metabolic homeostasis through adipose tissue crosstalk. Cell Metab. 2016, 23, 770–784. [Google Scholar] [CrossRef] [PubMed]
  78. Li, A.; Yuan, X.; Liang, X.-F.; Liu, L.; Li, J.; Li, B.; Fang, J.; Li, J.; He, S.; Xue, M.; et al. Adaptations of lipid metabolism and food intake in response to low and high fat diets in juvenile grass carp (Ctenopharyngodon idellus). Aquaculture 2016, 457, 43–49. [Google Scholar] [CrossRef]
  79. DiNicolantonio, J.J.; Lucan, S.C.; O’Keefe, J.H. The evidence for saturated fat and for sugar related to coronary heart disease. Prog. Cardiovasc. Dis. 2016, 58, 464–472. [Google Scholar] [CrossRef]
  80. Bhattamisra, S.K.; Koh, H.M.; Lim, S.Y.; Choudhury, H.; Pandey, M. Molecular and biochemical pathways of catalpol in alleviating diabetes mellitus and its complications. Biomolecules 2021, 11, 323. [Google Scholar] [CrossRef]
  81. Cui, X.; Qian, D.W.; Jiang, S.; Shang, E.X.; Zhu, Z.H.; Duan, J.A. Scutellariae Radix and Coptidis Rhizoma improve glucose and lipid metabolism in T2DM rats via regulation of the metabolic profiling and MAPK/PI3K/Akt signaling pathway. Int. J. Mol. Sci. 2018, 19, 3634. [Google Scholar] [CrossRef] [PubMed]
  82. Panserat, S.; Plagnes-Juan, E.; Kaushik, S. Nutritional regulation and tissue specificity of gene expression for proteins involved in hepatic glucose metabolism in rainbow trout (Oncorhynchus mykiss). J. Exp. Biol. 2001, 204, 2351–2360. [Google Scholar] [CrossRef] [PubMed]
  83. Liang, H.; Mokrani, A.; Chisomo-Kasiya, H.; Wilson-Arop, O.M.; Mi, H.; Ji, K.; Ge, X.; Ren, M. Molecular characterization and identification of facilitative glucose transporter 2 (GLUT2) and its expression and of the related glycometabolism enzymes in response to different starch levels in blunt snout bream (Megalobrama amblycephala). Fish. Physiol. Biochem. 2018, 44, 869–883. [Google Scholar] [CrossRef]
  84. Gong, Y.; Xi, L.; Liu, Y.; Lu, Q.; Zhang, Z.; Liu, H.; Jin, J.; Yang, Y.; Zhu, X.; Xie, S.; et al. Sequential activations of ChREBP and SREBP1 signals regulate the high-carbohydrate diet-induced hepatic lipid deposition in Gibel carp (Carassius gibelio). Aquac. Nutr. 2023, 2023, 6672985. [Google Scholar] [CrossRef]
  85. Brandon, A.E.; Small, L.; Nguyen, T.V.; Suryana, E.; Gong, H.; Yassmin, C.; Hancock, S.E.; Pulpitel, T.; Stonehouse, S.; Prescott, L.; et al. Insulin sensitivity is preserved in mice made obese by feeding a high starch diet. eLife 2022, 11, e79250. [Google Scholar] [CrossRef]
  86. Miao, L.H.; Lin, Y.; Pan, W.J.; Huang, X.; Ge, X.P.; Ren, M.C.; Zhou, Q.L.; Liu, B. Identification of differentially expressed micrornas associate with glucose metabolism in different organs of blunt snout bream (Megalobrama amblycephala). Int. J. Mol. Sci. 2017, 18, 1161. [Google Scholar] [CrossRef] [PubMed]
  87. Fan, Z.; Wang, L.; Li, C.; Wu, D.; Li, J.; Zhang, H.; Xiong, S.; Miao, L.; Ge, X.; Li, Z. Integration of microRNA and mRNA analyses depicts the potential roles of Momordica charantia saponin administration in insulin resistance of juvenile common carp (Cyprinus carpio) fed with a high-starch diet. Front. Mol. Biosci. 2023, 10, 1054949. [Google Scholar] [CrossRef]
  88. Zhang, P.; Zhang, C.; Yao, X.; Xie, Y.; Zhang, H.; Shao, X.; Yang, X.; Nie, Q.; Ye, J.; Wu, C.; et al. Selenium yeast improve growth, serum biochemical indices, metabolic ability, antioxidant capacity and immunity in black carp Mylopharyngodn piceus. Fish Shellfish Immunol. 2024, 146, 109414. [Google Scholar] [CrossRef]
  89. Wang, J.; Li, X.; Han, T.; Yang, Y.; Jiang, Y.; Yang, M.; Xu, Y.; Harpaz, S. Effects of different dietary carbohydrate levels on growth, feed utilization and body composition of juvenile grouper Epinephelus akaara. Aquaculture 2016, 459, 143–147. [Google Scholar] [CrossRef]
  90. Li, X.F.; Wang, Y.; Liu, W.B.; Jiang, G.Z.; Zhu, J. Effects of dietary carbohydrate/lipid ratios on growth performance, body composition and glucose metabolism of fingerling blunt snout bream Megalobrama amblycephala. Aquac. Nutr. 2013, 19, 701–708. [Google Scholar] [CrossRef]
  91. Li, X.; Zheng, S.; Ma, X.; Cheng, K.; Wu, G. Effects of dietary starch and lipid levels on the protein retention and growth of largemouth bass (Micropterus salmoides). Amino Acids 2020, 52, 999–1016. [Google Scholar] [CrossRef] [PubMed]
  92. Chen, L.; Luo, Y.; Wang, H.; Liu, S.; Shen, Y.; Wang, M. Effects of glucose and starch on lactate production by newly isolated Streptococcus bovis S1 from Saanen goats. Appl. Environ. Microbiol. 2016, 82, 5982–5989. [Google Scholar] [CrossRef] [PubMed]
  93. Rocha, L.C.; Assuncao, A.S.A.; Martins, R.A.; de Carvalho, V.V.; Perdigao, A.; Buzalaf, M.A.R.; Adamec, J.; Braga, C.P.; Millen, D.D.; Vieira, J.C.S.; et al. Feedlot diets containing different starch levels and additives change the cecal proteome involved in cattle’s energy metabolism and inflammatory response. Sci. Rep. 2022, 12, 5691. [Google Scholar] [CrossRef] [PubMed]
  94. Adeva-Andany, M.; Lopez-Ojen, M.; Funcasta-Calderon, R.; Ameneiros-Rodriguez, E.; Donapetry-Garcia, C.; Vila-Altesor, M.; Rodriguez-Seijas, J. Comprehensive review on lactate metabolism in human health. Mitochondrion 2014, 17, 76–100. [Google Scholar] [CrossRef] [PubMed]
  95. Brooks, G.A. The science and translation of lactate shuttle theory. Cell Metab. 2018, 27, 757–785. [Google Scholar] [CrossRef] [PubMed]
  96. Wang, T.; Chen, K.; Yao, W.; Zheng, R.; He, Q.; Xia, J.; Li, J.; Shao, Y.; Zhang, L.; Huang, L.; et al. Acetylation of lactate dehydrogenase B drives NAFLD progression by impairing lactate clearance. J. Hepatol. 2021, 74, 1038–1052. [Google Scholar] [CrossRef]
  97. Gao, Y.; Zhou, H.; Liu, G.; Wu, J.; Yuan, Y.; Shang, A. Tumor Microenvironment: Lactic acid promotes tumor development. J. Immunol. Res. 2022, 2022, 3119375. [Google Scholar] [CrossRef] [PubMed]
  98. Xu, L.N.; Yin, L.H.; Jin, Y.; Qi, Y.; Han, X.; Xu, Y.W.; Liu, K.X.; Zhao, Y.Y.; Peng, J.Y. Effect and possible mechanisms of dioscin on ameliorating metabolic glycolipid metabolic disorder in type-2-diabetes. Phytomedicine 2020, 67, 153139. [Google Scholar] [CrossRef] [PubMed]
  99. Ipsen, D.H.; Lykkesfeldt, J.; Tveden-Nyborg, P. Molecular mechanisms of hepatic lipid accumulation in non-alcoholic fatty liver disease. Cell Mol. Life Sci. 2018, 75, 3313–3327. [Google Scholar] [CrossRef]
  100. Salvador Lopez, J.M.; Van Bogaert, I.N. Microbial fatty acid transport proteins and their biotechnological potential. Biotechnol. Bioeng. 2021, 118, 2184–2201. [Google Scholar] [CrossRef]
  101. Cao, J.; Perez, S.; Goodwin, B.; Lin, Q.; Peng, H.; Qadri, A.; Zhou, Y.; Clark, R.W.; Perreault, M.; Tobin, J.F.; et al. Mice deleted for GPAT3 have reduced GPAT activity in white adipose tissue and altered energy and cholesterol homeostasis in diet-induced obesity. Am. J. Physiol. Endocrinol. Metab. 2014, 306, E1176–E1187. [Google Scholar] [CrossRef] [PubMed]
  102. Wang, H.; Nikain, C.; Amengual, J.; La Forest, M.; Yu, Y.; Wang, M.C.; Watts, R.; Lehner, R.; Qiu, Y.; Cai, M.; et al. FITM2 deficiency results in ER lipid accumulation, ER stress, reduced apolipoprotein B lipidation, and VLDL triglyceride secretion in vitro and in mouse liver. BioRxiv 2023, 12, 570183. [Google Scholar]
  103. Cinato, M.; Andersson, L.; Miljanovic, A.; Laudette, M.; Kunduzova, O.; Boren, J.; Levin, M.C. Role of Perilipins in oxidative stress-implications for cardiovascular disease. Antioxidants 2024, 13, 209. [Google Scholar] [CrossRef] [PubMed]
  104. Zadoorian, A.; Du, X.; Yang, H. Lipid droplet biogenesis and functions in health and disease. Nat. Rev. Endocrinol. 2023, 19, 443–459. [Google Scholar] [CrossRef] [PubMed]
  105. Castro, C.; Corraze, G.; Basto, A.; Larroquet, L.; Panserat, S.; Oliva-Teles, A. Dietary lipid and carbohydrate interactions: Implications on lipid and glucose absorption, transport in Gilthead sea bream (Sparus aurata) Juveniles. Lipids 2016, 51, 743–755. [Google Scholar] [CrossRef] [PubMed]
  106. Wang, Y.; Viscarra, J.; Kim, S.J.; Sul, H.S. Transcriptional regulation of hepatic lipogenesis. Nat. Rev. Mol. Cell Biol. 2015, 16, 678–689. [Google Scholar] [CrossRef] [PubMed]
  107. Ferre, P.; Phan, F.; Foufelle, F. SREBP-1c and lipogenesis in the liver: An update1. Biochem. J. 2021, 478, 3723–3739. [Google Scholar] [CrossRef] [PubMed]
  108. Hasegawa, S.; Noda, K.; Maeda, A.; Matsuoka, M.; Yamasaki, M.; Fukui, T. Acetoacetyl-CoA synthetase, a ketone body-utilizing enzyme, is controlled by SREBP-2 and affects serum cholesterol levels. Mol. Genet. Metab. 2012, 107, 553–560. [Google Scholar] [CrossRef]
  109. Bergstrom, J.D. The lipogenic enzyme acetoacetyl-CoA synthetase and ketone body utilization for denovo lipid synthesis, a review. J. Lipid Res. 2023, 64, 100407. [Google Scholar] [CrossRef]
  110. Hasegawa, S.; Inoue, D.; Yamasaki, M.; Li, C.; Imai, M.; Takahashi, N.; Fukui, T. Site-specific cleavage of acetoacetyl-CoA synthetase by legumain. FEBS Lett. 2016, 590, 1592–1601. [Google Scholar] [CrossRef]
  111. Kessler, E.C.; Gross, J.J.; Bruckmaier, R.M.; Albrecht, C. Cholesterol metabolism, transport, and hepatic regulation in dairy cows during transition and early lactation. J. Dairy. Sci. 2014, 97, 5481–5490. [Google Scholar] [CrossRef] [PubMed]
  112. Lepesheva, G.I.; Waterman, M.R. Sterol 14α-demethylase cytochrome P450 (CYP51), a P450 in all biological kingdoms. Biochim. Biophys. Acta 2007, 1770, 467–477. [Google Scholar] [CrossRef] [PubMed]
  113. Hargrove, T.Y.; Friggeri, L.; Wawrzak, Z.; Sivakumaran, S.; Yazlovitskaya, E.M.; Hiebert, S.W.; Guengerich, F.P.; Waterman, M.R.; Lepesheva, G.I. Human sterol 14alpha-demethylase as a target for anticancer chemotherapy: Towards structure-aided drug design. J. Lipid Res. 2016, 57, 1552–1563. [Google Scholar] [CrossRef]
  114. Cokan, K.B.; Hancock, J.M.; Spindelbock, W.; Rezen, T.; Juvan, P.; Rozman, D. Matching mouse models to specific human liver disease states by comparative functional genomics of mouse and human datasets. Biochim. Biophys. Acta Gene Regul. Mech. 2022, 1865, 194785. [Google Scholar] [CrossRef] [PubMed]
  115. Yamashita, M.; Kumazoe, M.; Nakamura, Y.; Won, Y.S.; Bae, J.; Yamashita, S.; Tachibana, H. The combination of green tea extract and eriodictyol inhibited high-fat/high-sucrose diet-induced cholesterol upregulation is accompanied by suppression of cholesterol synthesis enzymes. J. Nutr. Sci. Vitaminol. 2016, 62, 249–256. [Google Scholar] [CrossRef] [PubMed]
  116. Luo, J.; Yang, H.; Song, B.L. Mechanisms and regulation of cholesterol homeostasis. Nat. Rev. Mol. Cell Biol. 2020, 21, 225–245. [Google Scholar] [CrossRef]
  117. Tirinato, L.; Pagliari, F.; Di Franco, S.; Sogne, E.; Marafioti, M.G.; Jansen, J.; Falqui, A.; Todaro, M.; Candeloro, P.; Liberale, C.; et al. ROS and Lipid Droplet accumulation induced by high glucose exposure in healthy colon and Colorectal Cancer Stem Cells. Genes. Dis. 2020, 7, 620–635. [Google Scholar] [CrossRef]
  118. Li, Q.; Zhao, Y.; Guo, H.; Li, Q.; Yan, C.; Li, Y.; He, S.; Wang, N.; Wang, Q. Impaired lipophagy induced-microglial lipid droplets accumulation contributes to the buildup of TREM1 in diabetes-associated cognitive impairment. Autophagy 2023, 19, 2639–2656. [Google Scholar] [CrossRef]
  119. Zein, A.A.; Kaur, R.; Hussein, T.O.K.; Graf, G.A.; Lee, J.Y. ABCG5/G8: A structural view to pathophysiology of the hepatobiliary cholesterol secretion. Biochem. Soc. Trans. 2019, 47, 1259–1268. [Google Scholar] [CrossRef]
  120. Boyer, J.L. Bile formation and secretion. Compr. Physiol. 2013, 3, 1035–1078. [Google Scholar]
  121. Perino, A.; Schoonjans, K. Metabolic Messengers: Bile acids. Nat. Metab. 2022, 4, 416–423. [Google Scholar] [CrossRef] [PubMed]
  122. Trauner, M.; Boyer, J.L. Bile salt transporters: Molecular characterization, function, and regulation. Physiol. Rev. 2003, 83, 633–671. [Google Scholar] [CrossRef] [PubMed]
  123. Jia, W.; Xie, G.; Jia, W. Bile acid-microbiota crosstalk in gastrointestinal inflammation and carcinogenesis. Nat. Rev. Gastroenterol. Hepatol. 2018, 15, 111–128. [Google Scholar] [CrossRef] [PubMed]
  124. Suchy, F.J.; Ananthanarayanan, M. Bile salt excretory pump: Biology and pathobiology. J. Pediatr. Gastroenterol. Nutr. 2006, 43, S10–S16. [Google Scholar] [CrossRef] [PubMed]
  125. Trauner, M.; Boyer, J.L. Cholestatic syndromes. Curr. Opin. Gastroenterol. 2004, 20, 220–230. [Google Scholar] [CrossRef] [PubMed]
  126. Boyer, J.L.; Trauner, M.; Mennone, A.; Soroka, C.J.; Cai, S.Y.; Moustafa, T.; Zollner, G.; Lee, J.Y.; Ballatori, N. Upregulation of a basolateral FXR-dependent bile acid efflux transporter OSTalpha-OSTbeta in cholestasis in humans and rodents. Am. J. Physiol. Gastrointest. Liver Physiol. 2006, 290, G1124–G1130. [Google Scholar] [CrossRef] [PubMed]
  127. Beaudoin, J.J.; Brouwer, K.L.R.; Malinen, M.M. Novel insights into the organic solute transporter alpha/beta, OSTalpha/beta: From the bench to the bedside. Pharmacol. Ther. 2020, 211, 107542. [Google Scholar] [CrossRef] [PubMed]
  128. Sies, H. Hydrogen peroxide as a central redox signaling molecule in physiological oxidative stress: Oxidative eustress. Redox Biol. 2017, 11, 613–619. [Google Scholar] [CrossRef] [PubMed]
  129. Yang, S.; Lian, G. ROS and diseases: Role in metabolism and energy supply. Mol. Cell Biochem. 2020, 467, 1–12. [Google Scholar] [CrossRef]
  130. El Haouari, M.; Rosado, J.A. Platelet signalling abnormalities in patients with type 2 diabetes mellitus: A review. Blood Cells Mol. Dis. 2008, 41, 119–123. [Google Scholar] [CrossRef]
  131. Zhou, C.; Huang, Z.; Lin, H.; Ma, Z.; Wang, J.; Wang, Y.; Yu, W. Rhizoma curcumae Longae ameliorates high dietary carbohydrate-induced hepatic oxidative stress, inflammation in golden pompano Trachinotus ovatus. Fish Shellfish Immunol. 2022, 130, 31–42. [Google Scholar] [CrossRef] [PubMed]
  132. Zhao, L.; Liang, J.; Chen, F.; Tang, X.; Liao, L.; Liu, Q.; Luo, J.; Du, Z.; Li, Z.; Luo, W.; et al. High carbohydrate diet induced endoplasmic reticulum stress and oxidative stress, promoted inflammation and apoptosis, impaired intestinal barrier of juvenile largemouth bass (Micropterus salmoides). Fish Shellfish Immunol. 2021, 119, 308–317. [Google Scholar] [CrossRef] [PubMed]
  133. Huang, Q.; Zhou, H.J.; Zhang, H.; Huang, Y.; Hinojosa-Kirschenbaum, F.; Fan, P.; Yao, L.; Belardinelli, L.; Tellides, G.; Giordano, F.J.; et al. Thioredoxin-2 inhibits mitochondrial reactive oxygen species generation and apoptosis stress kinase-1 activity to maintain cardiac function. Circulation 2015, 131, 1082–1097. [Google Scholar] [CrossRef] [PubMed]
  134. Lu, J.; Holmgren, A. The thioredoxin antioxidant system. Free Radic. Biol. Med. 2014, 66, 75–87. [Google Scholar] [CrossRef] [PubMed]
  135. Ding, S.; Xu, S.; Ma, Y.; Liu, G.; Jang, H.; Fang, J. Modulatory mechanisms of the NLRP3 inflammasomes in diabetes. Biomolecules 2019, 9, 850. [Google Scholar] [CrossRef] [PubMed]
  136. Esser, N.; Legrand-Poels, S.; Piette, J.; Scheen, A.J.; Paquot, N. Inflammation as a link between obesity, metabolic syndrome and type 2 diabetes. Diabetes Res. Clin. Pract. 2014, 105, 141–150. [Google Scholar] [CrossRef] [PubMed]
  137. SantaCruz-Calvo, S.; Bharath, L.; Pugh, G.; SantaCruz-Calvo, L.; Lenin, R.R.; Lutshumba, J.; Liu, R.; Bachstetter, A.D.; Zhu, B.; Nikolajczyk, B.S. Adaptive immune cells shape obesity-associated type 2 diabetes mellitus and less prominent comorbidities. Nat. Rev. Endocrinol. 2022, 18, 23–42. [Google Scholar] [CrossRef] [PubMed]
  138. Baek, O.; Fabiansen, C.; Friis, H.; Ritz, C.; Koch, J.; Willesen, J.L.; Heegaard, P.M.H.; Lykkesfeldt, J.; Briend, A.; Golden, M.H.; et al. Malnutrition predisposes to endotoxin-induced edema and impaired inflammatory response in parenterally fed piglets. JPEN J. Parenter. Enteral Nutr. 2020, 44, 668–676. [Google Scholar] [CrossRef] [PubMed]
  139. Hildebrand Budke, C.R.; Thomaz, D.M.C.; Oliveira, R.J.; Guimaraes, R.C.A.; Ramires, A.D.; Dourado, D.M.; Santos, E.F.D.; Menezes, A.C.G.; Antoniolli-Silva, A. Effect of fiber supplementation on systemic inflammation and liver steatosis in mice fed with high-carbohydrate diets. Metab. Syndr. Relat. Disord. 2022, 20, 558–566. [Google Scholar] [CrossRef]
  140. Jia, M.; Wu, C.; Gao, F.; Xiang, H.; Sun, N.; Peng, P.; Li, J.; Yuan, X.; Li, H.; Meng, X.; et al. Activation of NLRP3 inflammasome in peripheral nerve contributes to paclitaxel-induced neuropathic pain. Mol. Pain. 2017, 13, 1744806917719804. [Google Scholar] [CrossRef]
  141. Gan, J.; Huang, M.; Lan, G.; Liu, L.; Xu, F. High Glucose induces the loss of retinal pericytes partly via NLRP3-Caspase-1-GSDMD-mediated pyroptosis. Biomed. Res. Int. 2020, 2020, 4510628. [Google Scholar] [CrossRef] [PubMed]
  142. Mo, Y.; Mo, L.; Zhang, Y.; Zhang, Y.; Yuan, J.; Zhang, Q. High glucose enhances the activation of NLRP3 inflammasome by ambient fine particulate matter in alveolar macrophages. Part. Fibre Toxicol. 2023, 20, 41. [Google Scholar] [CrossRef] [PubMed]
Figure 1. Effect of high-starch diet on body index including VSI (A), HSI (B), ISI (C) and crude lipid content in the liver (D) in largemouth bass. Data are reported as the mean ± SD of three replicates (n = 3). Bars with different superscripts (a–e) are significantly different (p < 0.05). To calculate animal-specific parameters, the following equations were used: hepatosomatic index (HSI, %) = liver weight/final body weight (FBW) × 100. Viscerosomatic index (VSI, %) = viscera weight/FBW × 100. Intestinalsomatic index (ISI, %) = intestinal fat weight/FBW × 100.
Metabolites 14 00236 g001
Figure 2. Effect of high-starch diet on related mRNA levels of hepatic glucose metabolism in largemouth bass. Data are reported as the mean ± SD of three replicates (n = 3). Bars with different superscripts (a–d) are significantly different (p < 0.05).
Metabolites 14 00236 g002
Figure 3. Effect of high-starch diet on related mRNA levels of hepatic glycogen metabolism in largemouth bass. Data are reported as the mean ± SD of three replicates (n = 3). Bars with different superscripts (a–d) are significantly different (p < 0.05).
Metabolites 14 00236 g003
Figure 4. Effect of high-starch diet on related mRNA levels of signal molecules regulating glucose metabolism in largemouth bass. Data are reported as the mean ± SD of three replicates (n = 3). Bars with different superscripts (a–c) are significantly different (p < 0.05).
Metabolites 14 00236 g004
Figure 5. Effect of high-starch diet on related mRNA levels of hepatic lipid metabolism in largemouth bass. Data are reported as the mean ± SD of three replicates (n = 3). Bars with different superscripts (a–e) are significantly different (p < 0.05).
Metabolites 14 00236 g005
Figure 6. Effect of high-starch diet on related mRNA levels of hepatic cholesterol metabolism in largemouth bass. Data are reported as the mean ± SD of three replicates (n = 3). Bars with different superscripts (a–d) are significantly different (p < 0.05).
Metabolites 14 00236 g006
Figure 7. Effect of high-starch diet on related mRNA levels of hepatic bile acid metabolism in largemouth bass. Data are reported as the mean ± SD of three replicates (n = 3). Bars with different superscripts (a–d) are significantly different (p < 0.05).
Metabolites 14 00236 g007
Figure 8. Effect of high-starch diet on related mRNA levels of hepatic antioxidant index in largemouth bass. (A) Antioxidant and oxidative parameters, (B) ROS generating and oxidative stress indexes. Data are reported as the mean ± SD of three replicates (n = 3). Bars with different superscripts (a–d) are significantly different (p < 0.05).
Metabolites 14 00236 g008
Figure 9. Effect of high-starch diet on related mRNA levels of hepatic inflammation in largemouth bass. (A) Inflammatory reaction, (B) The NLRP3 inflammasome activation. Data are reported as the mean ± SD of three replicates (n = 3). Bars with different superscripts (a–d) are significantly different (p < 0.05).
Metabolites 14 00236 g009
Figure 10. HE staining (magnification × 20), PAS staining (magnification × 20), and ORO staining (magnification × 40) of the liver sections of juvenile largemouth bass fed with high-starch diet containing D0 (A1A3), D1 (B1B3), D3 (C1C3), D5 (D1D3), and D7 (E1E3).
Metabolites 14 00236 g010
Figure 11. The summary of glucose and lipid metabolism, antioxidant and oxidative responses, and inflammatory responses in the hepatic cells of largemouth bass.
Metabolites 14 00236 g011
Table 1. Composition and nutrient levels of experimental diets (air-dry basis).
IngredientComposition of Diets (%)
Diet 1Diet 2
Fish meal a20.0020.00
Soybean meal b10.00 10.00
Casein c35.00 35.00
Pregelatinized tapioca starch d0.00 20.00
Rapeseed oil e6.50 6.50
Lecithin f2.00 2.00
Mineral premix g2.00 2.00
Vitamin premix h1.00 1.00
Choline chloride i0.40 0.40
Microcrystalline cellulose j23.10 3.10
Nutrient levels (%)
Moisture7.317.18
Crude protein46.6346.74
Crude lipid10.8510.55
Ash6.336.43
a Supplied by Zhejiang Dongyu Biotechnology Co., Ltd. (Huzhou, China). b Supplied by Ningbo Food Co., Ltd. (Ningbo, China). c Obtained from Gansu Hualing Dairy Co., Ltd. (Lanzhou, China). d Supplied by Xinxin biochemical technology Co., Ltd. (Hangzhou, China). e Rapeseed oil was produced using oil press. f Supplied by Jiangsu Yuanshengyuan Biological Engineering Co., Ltd. (Nanjing, China). g Mineral premix (mg kg−1 diet): Ca(H2PO4)2, 12,000 mg; KI, 0.4 mg; CoCl2·6H2O, 52 mg; CuSO4·5H2O, 16 mg; FeSO4·7H2O, 200 mg; ZnSO4·7H2O, 280 mg; MnSO4·H2O, 45 mg; MgSO4·7H2O, 1200 mg; NaCl, 60 mg. h Vitamin premix (mg kg−1 diet): vitamin A, 35 mg; vitamin D, 6 mg; vitamin C, 1000 mg; vitamin E, 300 mg; thiamine, 30 mg; riboflavin, 50 mg; pyridoxine hydrochloride, 20 mg; vitamin B12, 0.1 mg; vitamin K3, 10 mg; inositol, 800 mg; pantothenic acid, 60 mg; folic acid, 20 mg; niacin, 200 mg; biotin, 60 mg. i Supplied by Zhejiang Yixing Feed Group Co., Ltd. (Jiaxing, China). j Supplied by Sinopharm Chemical Reagent Co., Ltd. (Shanghai, China).
Table 2. The list of PCR primers used in this study.
GeneForward (5′-3′)Reverse (5′-3′)Reference
GLUT2TCACCGTGTTTATTTATCTTCGAGCTCCGTATCGTCTTTGGXM_038728860
GCKAAGGGAACAATGTTGTGGGAGCTGCGGTCCTCGTAATXM_038703172
PFKCTGTATAATCCCTGCCACCATTCTCCACCACAAACACTCGXM_038720351
PKCACCAACCCATTCATTTGCGTGTCATCACCTCAGAGTAGCGXM_038711316
LDHGCAGGAGGGTGAAAGCCGGTTGGAGACCACGATGAGTXM_038726015
FBPCTGCGGCTGCTGTATGAACCCGCTGATGGATGCTCTXM_038704229
G6PaseGTCAACAAGCAACCCAACGAGTGAGGACACCACGACCCXM_038734911
ISRCCCGAGACATCTATGAGACCGCAAAGCACGACGCCAAATXM_038715865
ISRS2bTCCCCGTTCACACTCCTCTCATTTTTGTTCCGCACCACXM_038720730
PI3KcGCCAGTAGTGAGCAGTGAAAGCTCCATGACGGCATAGATAGCAXM_038693595
AKT1AGCGGGCTCGGTTCTACGGTATCTTTGTCCAGCATGAGGTTTMG993041
SREBP1cGAGGACACCAAGCCGAATGTGCCAGAGGGTTGAGGGAXM_038699585
G6PDTGGTGCTGGGTCAGTATGTGCGCAGGTAAAGGTGGCXM_038722146
PGDTTTGTGGTCTGCGCTTACAGATCCTCCTGGGCTTCTTCXM_038739743
GYG2GATAGCCAAGGAACAGCCTGAAGCATCTTAGAACGGAGTXM_038722829
GCSCATCCAACGGACACGAACCATCTTGAACTTGTCAGGGAXM_038695255
GBETTGACGGCTTCCGATTTATTGGCAAGCATCAGGTAXM_038694127
PP1GGCTGTTTGAGTATGGTGGCTCTGGGTATTTGATCTTGTAGGCXM_038728851
GDETCCTTGATGTAACCCACGACCAGTAGCACAGCAAGCCATAXM_038718921
ACCGCCAGTCTCCCAACTCCTAATGCGATACCTGTCCACCTXM_038709728
FASCATTCCGTAGTAGGATAAGTCAACACATAGTCATAACCACGCAGTCGXM_038735140
SCDCCCTTCAGCATCTCCTTTGTGGTAATGTGGCCTTGTAXM_038735580
ME1TCGCTAAGGAGGAGTGTTTGGTTTCTTGATCTGTGGGTGCXM_038712129
FABP-LGGTCAAGTCGGTGGTTCAATGCGTTTGCTTGTCCTCXM_038704629
FATP4GATTCTACCGTTCATCTACCCGAATGATCCTGCCGACTAXM_038733650
GKTGCGGACTCAATCAACGTCCATCAGCCAGCGTAGXM_038720816
GPAT3AGAGGGCGATAGTGAGGGCAGGATGGGAAGTTTGGTCXM_038733141
GPAT4CTGTTGTTGGGCTGTTGCTCCATTCTTGGGTTTATTCTCXM_038704699
DGAT2CTTCCGCTTGCCCGTCCTTGCATTTCCTGTCCCGTTATXM_038708163
Plin2GAGTGGACACGGCCCTAAGAACCCAGGCGGACATAGXM_038730762
APOB100GATTGTAAAGTTTGAGGCTGACTGCATGAATTTCGTAGGGXM_038727548
SREBP2TGTTGCCGTGGGTGATGTTGCGATGCCTCCAGAATXM_038694760
AACSGCTCGGCTCAACTACGCTCGAACAACGCCACATCTTXM_038703519
HMGCRaGGTGGAGTGCTTAGTAATCGGCACGCAGGGAAGAAAGTCAXM_038702603
HMGCSCCTGGACGACTTTGGCTATCCTGTGAAGGGTCCTGTCTXM_038733206
CYP51TCGCCTCAGACTGTAGCAGGAGGTAGCGGTCAGGGTTXM_038725400
SOAT2CTTGGCAATGGGCTTCGGGCTCTGTCGCTTGTCGTTCXM_038695616
ABCG5ACGGATGTAGGGAGGGACCGCTTCTTGTAGGAGGGTAXM_038737039
ABCG8GCTTTCTCATGCCTCCTTTAGTTCATCGCCTCCACCACXM_038737035
NPC1L1CCTTCCCTCCTCGCTGATCCAAGAACACGCCCAATCXM_038702470
CYP7A1CGGCGGTTGCGTTACTTGATAGCAGGGTCCAATAGTTCXM_038717160
CYP27A1TTGCCTCTATGCCATCAGTCTCACTCCGAAGCCAAACGXM_038720051
BSEPAGATGCTCCGTACCAAGCGCACCAAGTAACCTCCAAACCTATXM_038716782
NTCPCAAGGCTGTCGGAGGCAACGATGGAGGAGAAGGGAACGXM_038732638
OATP1GCAGTGGCAGTTGGGATCGCAGCAGCAGAAGGAGGTATXM_038738452
OST-αCCAAGAAGACCACCATCATACACCACGACTGCAAAAXM_038708198
MRP3ACGTGGAGTTCCGCGACTAGTGCGACCAACGATACCAAXM_038719452
Cu/Zn-SODTGAGCAGGAGGGCGATTCGCACTGATGCACCCATTTGTAXM_038708943
Mn-SODCAGGGATCTACAGGTCTCATT ACGCTCGCTCACATTCTC XM_038727054
CATACCTATTGCTGTCCGCTTCTCTCCCAGTTGCCCTCCTCAXM_038704976
GST1GAGCCCATCAGAACACCCACCCAAATAGCACCCAACXM_038711179
Trx2TTCAGGACCACGATGACTTCACTGCAACAGCCTTCTCCAACCXM_038693856
TrxR2GCCTTCTGTAGAGGGAGACACTGAACCACCACCAATGACXM_038703974
Prx3ACAAAGCCAATGAGTTCCATTGCCTAAGCCTCCAGTCXM_038737170
COX4GCCTGACAAACGCTACAAAGGGTACAAGGCAATCTTCTCCTCXM_038723148
NOX1GTGTCCCATCCCTCAGTTGCCGCATCACAATCTTCXM_038698886
NOXA1TCCTACACTGCCACCTATGCTGGACCTTCACCACCACAGXM_038704394
HO1TCTTTGGCGTAAACTGGAGGTAGCGAGTGTAGGCGTGGGXM_038694281
TNF-αCAACGGCAAGTGTCAAACCCTCTTGTCCTGAGCCCTTGGTATXM_038723994
IL-1βGCGACCGCAGTAAGAAAGCAGACGGGATAGTCGATGTAXM_038733429
IL-8TTCTCCTGGCTGCTTTGGTGGATGGCCCTCCTGTTAXM_038704093
IL-12CCGCTGTTATTCAGTCTTACCGCATCAGGGAGCAGTTCAXM_038693841
IFN-γGAGTTGCTTTGGCGTTTGTGTTGATGCTCCTGGTGAXM_038709291
Caspase1ATGAAGCCAGCAGGAAGCTTGGGATGAGTGCGTTTGXM_038694367
Caspase3CGTGGTACAGACCTGGATGGCCTGGAGCAGTGGAATAXM_038699323
Caspase6ATGCCGTGGACAGTGAGTTCATACCAGGACCCGTTGATXM_038710174
Caspase8CAGGCTCCATCTACATCCTCCCTTGCTGACCTCCXM_038718636
Caspase9TCCCAGTTCAGCACATCAGGACCTCATTAGGCGACACXM_038734900
NOD1TGTTGGTGGGAGGTATTTGTGGTAAGACGTGGGTGGTXM_038712291
NOD2GGGCAATAAGATAGGTGATGTGATAATGTTGGCGAGGGXM_038701062
ASCAAATAAGGTGGAGGGTAAAGTCTGCTTCACAGTGGCXM_038710753
GSDMEACATGACGGACGCTACGAGCTGAAAGGTGCTGGAAAXM_038711654
β-actinTTCACCACCACAGCCGAAAGTCTGGGCAACGGAACCTCTXM_038695351
GLUT2, glucose transporter 2; GCK, glucokinase; PFK, phosphofructokinase; PK, pyruvate kinase; LDH, lactate dehydrogenase; FBP, fructose-1,6-bisphosphatase; G6Pase, glucose-6-phosphatase; ISR, insulin receptor; IRS2b, insulin receptor substrate 2b; PI3Kc, phosphatidylinositol 4,5-bisphosphate 3-kinase catalytic; AKT1, AKT serine/threonine kinase 1; SREBP1c, sterol regulatory element-binding protein 1c; G6PD, glucose-6-phosphate 1-dehydrogenase; PGD, 6-phosphogluconate dehydrogenase; GYG2, glycogenin 2; GCS, glycogen synthase; GBE, 1,4-alpha-glucan-branching enzyme; PP1, serine/threonine-protein phosphatase PP1; GDE, glycogen debranching enzyme; ACC, acetyl-CoA carboxylase; FAS, fatty acid synthase; SCD, acyl-CoA desaturase; ME1, NADP-dependent malic enzyme 1; FABP-L, fatty acid-binding protein liver type; FATP4, long-chain fatty acid transport protein 4; GK, glycerol kinase; GPAT3, glycerol-phosphate acyltransferase 3; GPAT4, glycerol-phosphate acyltransferase 4; DGAT2, diacylglycerol O-acyltransferase 2; Plin2, perilipin 2; APOB100, apolipoprotein B 100; SREBP2, sterol regulatory element-binding protein 2; AACS, acetoacetyl-CoA synthetase; HMGCRa, 3-hydroxy-3-methylglutaryl-Coenzyme A reductase; HMGCS, hydroxymethylglutaryl-CoA synthase; CYP51, lanosterol 14-alpha demethylase; SOAT2, sterol O-acyltransferase 2; ABCG5, ATP-binding cassette sub-family G member 5; ABCG8, ATP-binding cassette sub-family G member 8; NPC1L1, Niemann-Pick C1-like protein 1; CYP7A1, cholesterol 7-alpha-monooxygenase; CYP27A1, sterol 26-hydroxylase; BSEP, bile salt export pump; NTCP, sodium/taurocholate cotransporting polypeptide; OATP1, solute carrier organic anion transporter family member 1; OST-α, organic solute transporter subunit alpha; MRP3, canalicular multispecific organic anion transporter 2; Cu/Zn-SOD, Cu/Zn-superoxide dismutase; Mn-SOD, Mn-superoxide dismutase; CAT, catalase; GST1, glutathione S-transferase 1; Trx2, thioredoxin 2; TrxR2, thioredoxin reductase 2; Prx3, peroxiredoxin 3; COX4, cytochrome c oxidase; NOX1, NADPH oxidase 1; NOXA1, NADPH oxidase activator 1; HO1, heme oxygenase-1; TNF-α, tumor necrosis factor alpha; IL-1β, interleukin-1 beta; IL-8, interleukin 8; IL-12, interleukin 12; IFN-γ, interferon-gamma; Caspase1; Caspase3; Caspase6; Caspase8; Caspase9; NOD1, nucleotide-binding oligomerization domain-containing protein 1; NOD2, nucleotide-binding oligomerization domain-containing protein 2; ASC, apoptosis-associated speck-like protein containing a CARD; GSDME, gasdermin-E.
Table 3. Effects of dietary days on hematological parameters in largemouth bass fed high starch (mean ± SD, n = 15).
ItemsDays of High Starch Diet
D0D1D3D5D7ANLTQT
RBC A3.34 ± 0.10 b3.61 ± 0.19 ab3.61 ± 0.25 a3.60 ± 0.18 ab3.52 ± 0.17 ab0.028 0.461 0.061
HGB B117.13 ± 4.32 c134.88 ± 5.08 a133.00 ± 5.88 a136.63 ± 3.93 a126.00 ± 5.24 b0.000 0.031 0.154
WBC C129.75 ± 6.27 b160.97 ± 13.91 a160.22 ± 22.52 a163.54 ± 7.90 a175.13 ± 11.92 a0.000 0.000 0.001
NEU C2.71 ± 0.30 e5.20 ± 0.53 d6.90 ± 0.42 c7.68 ± 0.48 b8.67 ± 0.27 a0.000 0.000 0.000
LYM C129.55 ± 5.67 c135.88 ± 13.28 bc145.88 ± 16.04 ab149.59 ± 7.37 a147.65 ± 5.05 a0.002 0.000 0.000
MON C4.79 ± 0.19 d10.44 ± 0.21 c11.56 ± 0.25 b12.03 ± 0.49 b13.24 ± 0.55 a0.000 0.000 0.000
EOS C0.14 ± 0.02 c0.18 ± 0.01 c1.27 ± 0.13 b1.59 ± 0.04 b2.12 ± 0.40 a0.000 0.000 0.000
BAS C0.14 ± 0.01 d0.31 ± 0.07 d3.08 ± 0.01 c4.15 ± 0.09 b6.53 ± 0.39 a0.000 0.000 0.000
PLT C825.80 ± 47.56 a448.75 ± 49.66 b309.88 ± 57.81 c258.38 ± 50.96 cd223.63 ± 34.89 d0.000 0.0000.000
Note: a–e Values in the same row with different letters indicate significant differences (p < 0.05). AN: ANOVA, LT: linear trend, QT: quadratic trend. A = 1012/L, B = g/L, C = 109/L.
Table 4. Effects of dietary days on biochemical and hormone indicators of serum in largemouth bass fed high starch (mean ± SD, n = 9).
ItemsDays of High Starch Diet
D0D1D3D5D7ANLTQT
GLU A4.39 ± 0.06 d5.59 ± 0.06 c5.73 ± 0.32 c6.71 ± 0.14 b8.76 ± 0.39 a0.000 0.022 0.000
HDL-C A 2.07 ± 0.12 b2.60 ± 0.06 a2.78 ± 0.10 a2.51 ± 0.15 a2.79 ± 0.13 a0.000 0.012 0.098
LDL-C A1.42 ± 0.05 b1.85 ± 0.08 a1.94 ± 0.05 a1.90 ± 0.10 a2.03 ± 0.09 a0.000 0.001 0.038
TG A5.18 ± 0.11 d6.44 ± 0.30 c7.32 ± 0.17 b9.17 ± 0.42 a9.00 ± 0.27 a0.000 0.000 0.506
TC A5.99 ± 0.42 c7.34 ± 0.20 d7.91 ± 0.08 a8.07 ± 0.07 a8.12 ± 0.25 a0.000 0.043 0.166
AST B56.10 ± 6.50 b84.77 ± 2.47 a90.00 ± 3.37 a85.33 ± 6.61 a97.70 ± 6.87 a0.000 0.002 0.096
ALT B3.73 ± 0.15 c6.90 ± 0.26 b8.17 ± 1.10 ab9.37 ± 2.15 a9.05 ± 0.35 a0.001 0.000 0.008
TBA C8.10 ± 0.46 d9.10 ± 0.10 c11.20 ± 0.44 a10.57 ± 0.25 ab10.00 ± 0.20 b0.000 0.015 0.000
ALP B104.77 ± 5.08 d138.50 ± 2.88 b156.47 ± 3.58 a143.57 ± 5.14 b114.80 ± 4.93 c0.000 0.715 0.000
ALB D8.27 ± 0.12 c10.50 ± 0.20 a10.10 ± 0.10 b9.80 ± 0.10 b7.20 ± 0.26 d0.000 0.026 0.222
LDH B751.93 ± 23.11 d1037.03 ± 28.85 b1398.83 ± 20.26 a941.77 ± 24.41 c925.3 ± 27.77 c0.000 0.754 0.001
BUN A0.99 ± 0.03 c1.66 ± 0.06 a1.55 ± 0.04 a1.21 ± 0.08 b1.11 ± 0.08 b0.000 0.272 0.501
INS E20.18 ± 0.88 c22.09 ± 0.32 b23.76 ± 0.49 a19.13 ± 0.19 d18.51 ± 0.47 d0.000 0.048 0.003
GC F9.17±0.06 c8.71±0.06 d7.70±0.08 e9.42±0.08 b10.05±0.03 a0.000 0.054 0.000
ADPN G57.18 ± 1.29 c63.85 ± 1.60 b84.15 ± 2.29 a66.42 ± 2.74 b66.27 ± 2.89 b0.000 0.725 0.167
LEP G0.12 ± 0.01 e0.24 ± 0.01 d0.31 ± 0.01 c0.49 ± 0.01 a0.37 ± 0.03 b0.000 0.000 0.000
Note: a–e Values in the same row with different letters indicate significant differences (p < 0.05). A = mmol/L, B = U/L, C = umol/L, D = g/L, E = mU/L, F = pg/ml, G = µg/L.
Table 5. Effects of dietary days on glucose and lipid metabolism of liver in largemouth bass fed high starch (mean ± SD, n = 9).
ItemsDays of high starch diet
D0D1D3D5D7ANLTQT
GLUT2 A3.84 ± 0.38 c4.26 ± 0.17 bc4.86 ± 0.20 b7.88 ± 0.62 a7.60 ± 0.15 a0.000 0.000 0.000
GCK A0.26 ± 0.03 d0.44 ± 0.02 c0.53 ± 0.02 b0.73 ± 0.04 a0.53 ± 0.06 b0.000 0.003 0.000
PFK B0.47 ± 0.02 e0.89 ± 0.07 d1.48 ± 0.08 c2.11 ± 0.11 b2.33 ± 0.10 a0.000 0.000 0.000
PK C0.08 ± 0.02 d0.09 ± 0.01 cd0.11 ± 0.01 c0.16 ± 0.01 b0.2 ± 0.02 a0.000 0.000 0.000
LDH C0.51 ± 0.01 c0.78 ± 0.03 b0.78 ± 0.08 b0.81 ± 0.01 b0.98 ± 0.01 a0.000 0.156 0.001
PEPC D4.14 ± 0.09 e6.84 ± 0.14 d8.38 ± 0.66 c9.9 ± 0.42 b14.33 ± 0.37 a0.000 0.000 0.000
FBP E27.42 ± 0.79 c27.94 ± 0.84 c33.02 ± 1.00 b35.98 ± 0.87 a32.00 ± 0.84 b0.000 0.002 0.000
G6Pase A7.11 ± 0.18 d10.13 ± 0.33 c14.46 ± 0.66 a14.05 ± 0.58 a11.34 ± 0.27 b0.000 0.002 0.001
GCS F31.41 ± 0.99 c41.20 ± 0.86 b41.16 ± 1.59 b50.32 ± 1.08 a33.32 ± 1.56 c0.000 0.066 0.085
GBE G16.49 ± 0.18 c16.30 ± 0.32 c25.45 ± 0.90 a17.81 ± 0.67 b17.06 ± 0.43 bc0.000 0.082 0.019
GDE G32.51 ± 1.28 a23.84 ± 1.28 b23.14 ± 1.05 b21.12 ± 1.34 bc19.16 ± 1.46 cd0.000 0.024 0.000
LAG H48.25 ± 0.60 e85.80 ± 0.11 d102.08 ± 0.90 c104.97 ± 0.59 b109.49 ± 0.13 a0.000 0.000 0.000
LA I0.52 ± 0.01 d0.77 ± 0.02 c0.97 ± 0.01 a0.9 ± 0.01 b0.75 ± 0.01 c0.000 0.085 0.000
PA J0.1 ± 0.01 d0.19 ± 0.01 c0.36 ± 0.01 a0.37 ± 0.01 a0.3 ± 0.01 b0.000 0.002 0.000
Ac-CoA A4.50 ± 0.38 c4.15 ± 1.21 c5.04 ± 0.08 c9.56 ± 0.83 b10.90 ± 0.19 a0.000 0.475 0.000
ACC K1.27 ± 0.04 d1.27 ± 0.03 d1.44 ± 0.02 c1.53 ± 0.03 b2.01 ± 0.03 a0.000 0.000 0.000
FAS L48.00 ± 0.71 e81.69 ± 0.36 d102.68 ± 0.79 a93.87 ± 0.56 c98.08 ± 0.73 b0.000 0.000 0.000
Mal-CoA J287.40 ± 24.89 d335.78 ± 11.55 c366.26 ± 13.63 bc443.40 ± 15.15 a392.92 ± 25.33 ab0.000 0.000 0.034
LTAG I0.13 ± 0.02 c0.13 ± 0.01 c0.21 ± 0.01 b0.25 ± 0.01 a0.23 ± 0.01 ab0.000 0.001 0.000
Note: a–e Values in the same row with different letters indicate significant differences (p < 0.05). A = ng/mg prot, B = U/mg, C = U/g prot, D = IU/L, E = U/mg prot, F = nmol/min/mg prot, G = IU/g prot, H = mg/g, I = mmol/g prot, J = μmol/mg prot, K = mmol/h/mg prot, L = U/L.
Table 6. Effects of dietary days on the antioxidative and oxidative indices of liver in largemouth bass fed high starch (mean ± SD, n = 9).
ItemsDays of High Starch Diet
D0D1D3D5D7ANLTQT
T-SOD A17.34 ± 0.50 a12.81 ± 0.80 b12.79 ± 0.54 b12.94 ± 0.51 b10.72 ± 0.61 c0.000 0.2280.065
CAT A18.62 ± 1.00 a15.13 ± 0.62 b13.27 ± 0.94 bc11.78 ± 1.47 c12.01 ± 0.57 c0.000 0.0040.000
GST A45.24 ± 1.78 c42.79 ± 1.15 c47.71 ± 1.90 c61.04 ± 2.67 b73.63 ± 2.68 a0.000 0.000 0.000
ROS B5.08 ± 0.13 a6.57 ± 0.14 b7.69 ± 0.13 c8.26 ± 0.15 d7.74 ± 0.15 c0.000 0.000 0.000
H2O2 C16.11 ± 0.12 e20.01 ± 0.21 d22.59 ± 0.31 c34.04 ± 0.47 a27.74 ± 0.65 b0.000 0.0000.022
T-AOC C0.56 ± 0.06 a0.47 ± 0.09 ab0.44 ± 0.07 ab0.36 ± 0.08 bc0.26 ± 0.07 c0.000 0.014 0.000
MDA D9.52 ± 0.49 c12.81 ± 0.80 b12.79 ± 0.54 b12.94 ± 0.51 b17.34 ± 0.50 a0.002 0.012 0.032
Note: a–e Values in the same row with different letters indicate significant differences (p < 0.05). A = U/mg prot, B = mg/mL, C = mmol/g prot, D = nmol/mg prot.
Table 7. Effects of dietary days on the anti-inflammatory and pro-inflammatory cytokines of liver in largemouth bass fed high starch (mean ± SD, n = 9).
ItemsDays of High Starch Diet
D0D1D3D5D7ANLTQT
TNF-α A160.77 ± 11.54 e280.00 ± 7.69 d644.10 ± 8.01 c704.36 ± 18.18 b749.23 ± 10.18 a0.000 0.000 0.000
IL-6 A86.49 ± 3.94 d155.24 ± 3.94 c239.27 ± 3.61 a190.31 ± 5.80 b192.40 ± 9.26 b0.000 0.013 0.000
IL-8 B77.13 ± 1.21 c106.21 ± 2.26 b124.71 ± 1.39 a126.67 ± 4.28 a106.32 ± 3.92 b0.000 0.034 0.000
IL-12 A106.48 ± 1.44 b159.62 ± 1.63 a165.28 ± 9.98 a164.34 ± 6.19 a166.86 ± 4.84 a0.000 0.006 0.000
IFN-γ A67.16 ± 4.31 b65.93 ± 11.77 b69.12 ± 13.07 b106.65 ± 3.77 a115.44 ± 4.41 a0.000 0.000 0.000
IL-17 A6.20 ± 0.85 e19.83 ± 0.26 d43.21 ± 1.29 b51.35 ± 1.06 a29.59 ± 0.95 c0.000 0.010 0.000
IL-1β A25.06 ± 3.27 d36.00 ± 1.78 c52.88 ± 2.42 a54.48 ± 2.85 a47.30 ± 1.15 b0.000 0.001 0.000
Note: a–e Values in the same row with different letters indicate significant differences (p < 0.05). A = ng/L, B = pg/L.
Disclaimer/Publisher’s Note: The statements, opinions and data contained in all publications are solely those of the individual author(s) and contributor(s) and not of MDPI and/or the editor(s). MDPI and/or the editor(s) disclaim responsibility for any injury to people or property resulting from any ideas, methods, instructions or products referred to in the content.

