Calcitriol Supplementation Causes Decreases in Tumorigenic Proteins and Different Proteomic and Metabolomic Signatures in Right versus Left-Sided Colon Cancer

Abstract
:
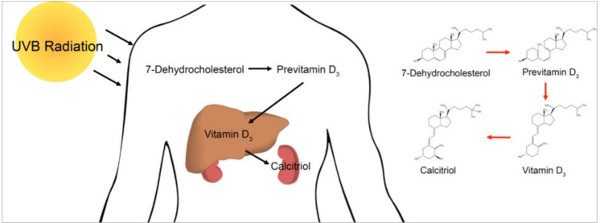
1. Introduction
2. Results
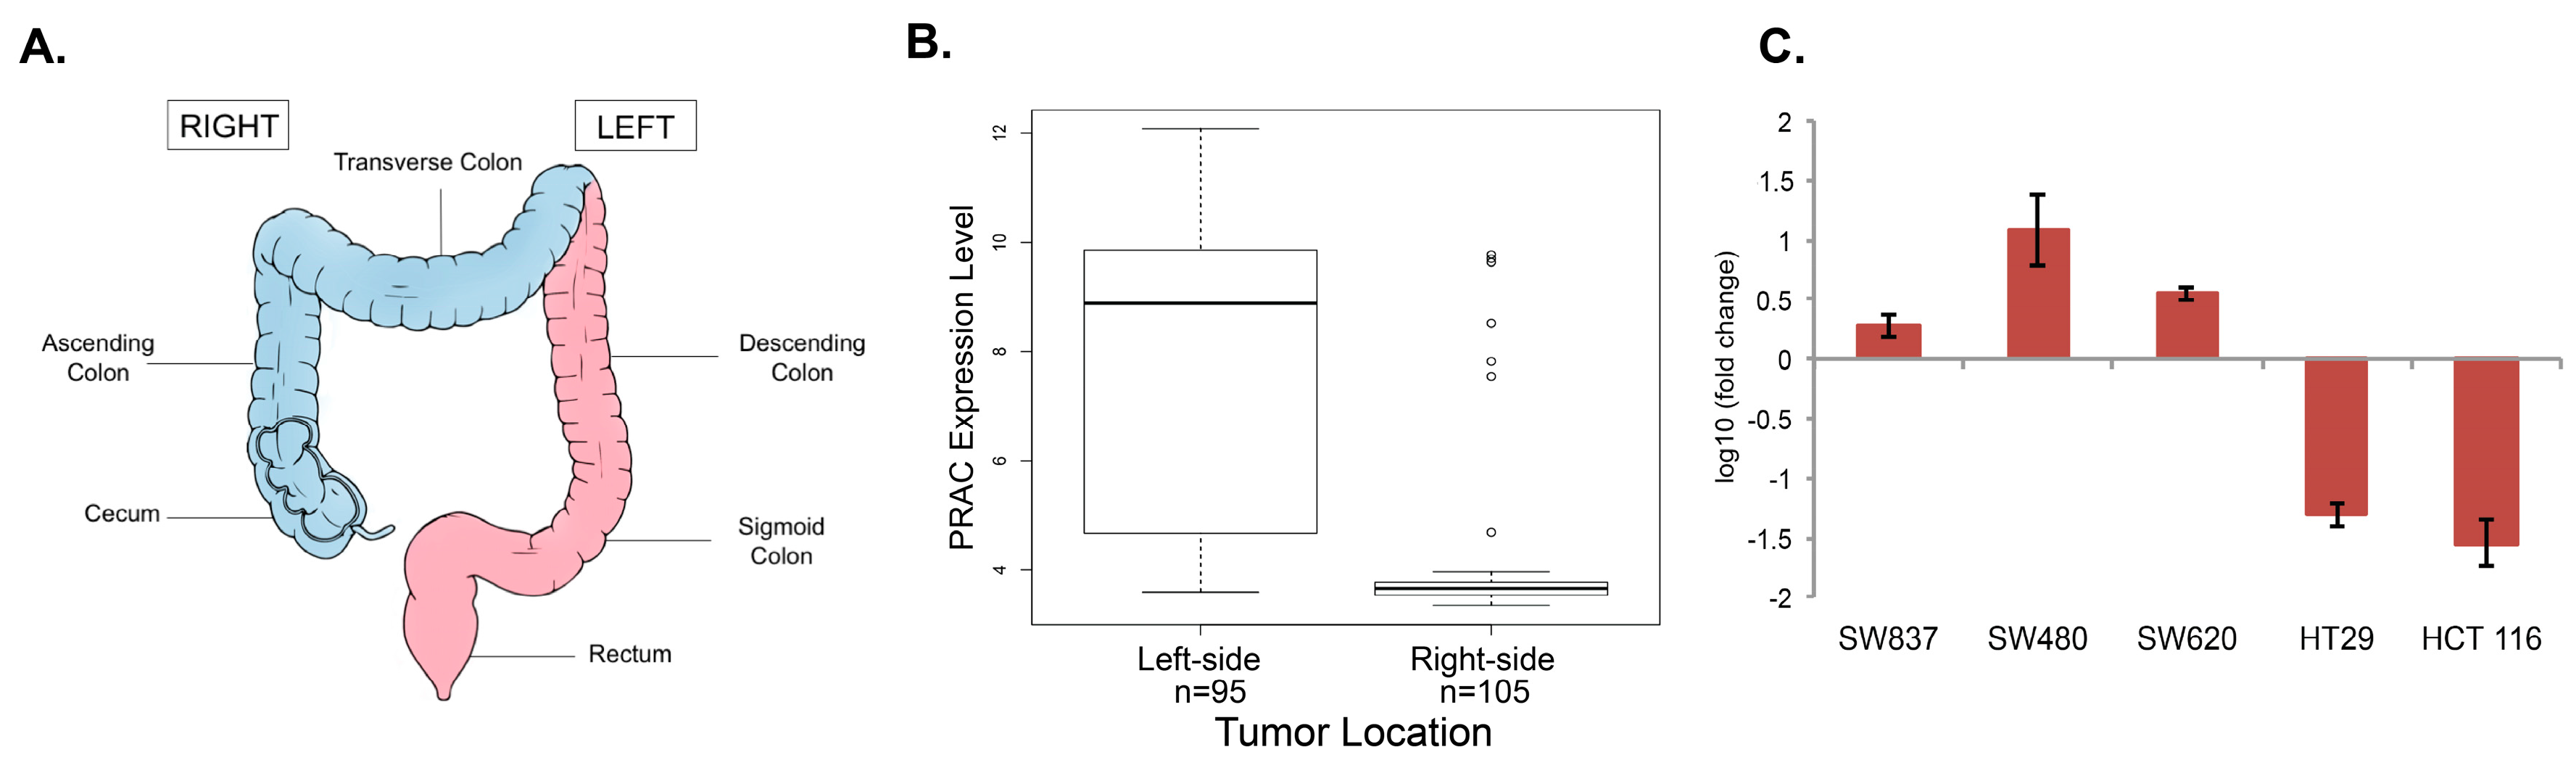
2.1. Analysis of PRAC Expression in Human Colorectal Cancer Cell Lines to Determine Tissue Origin
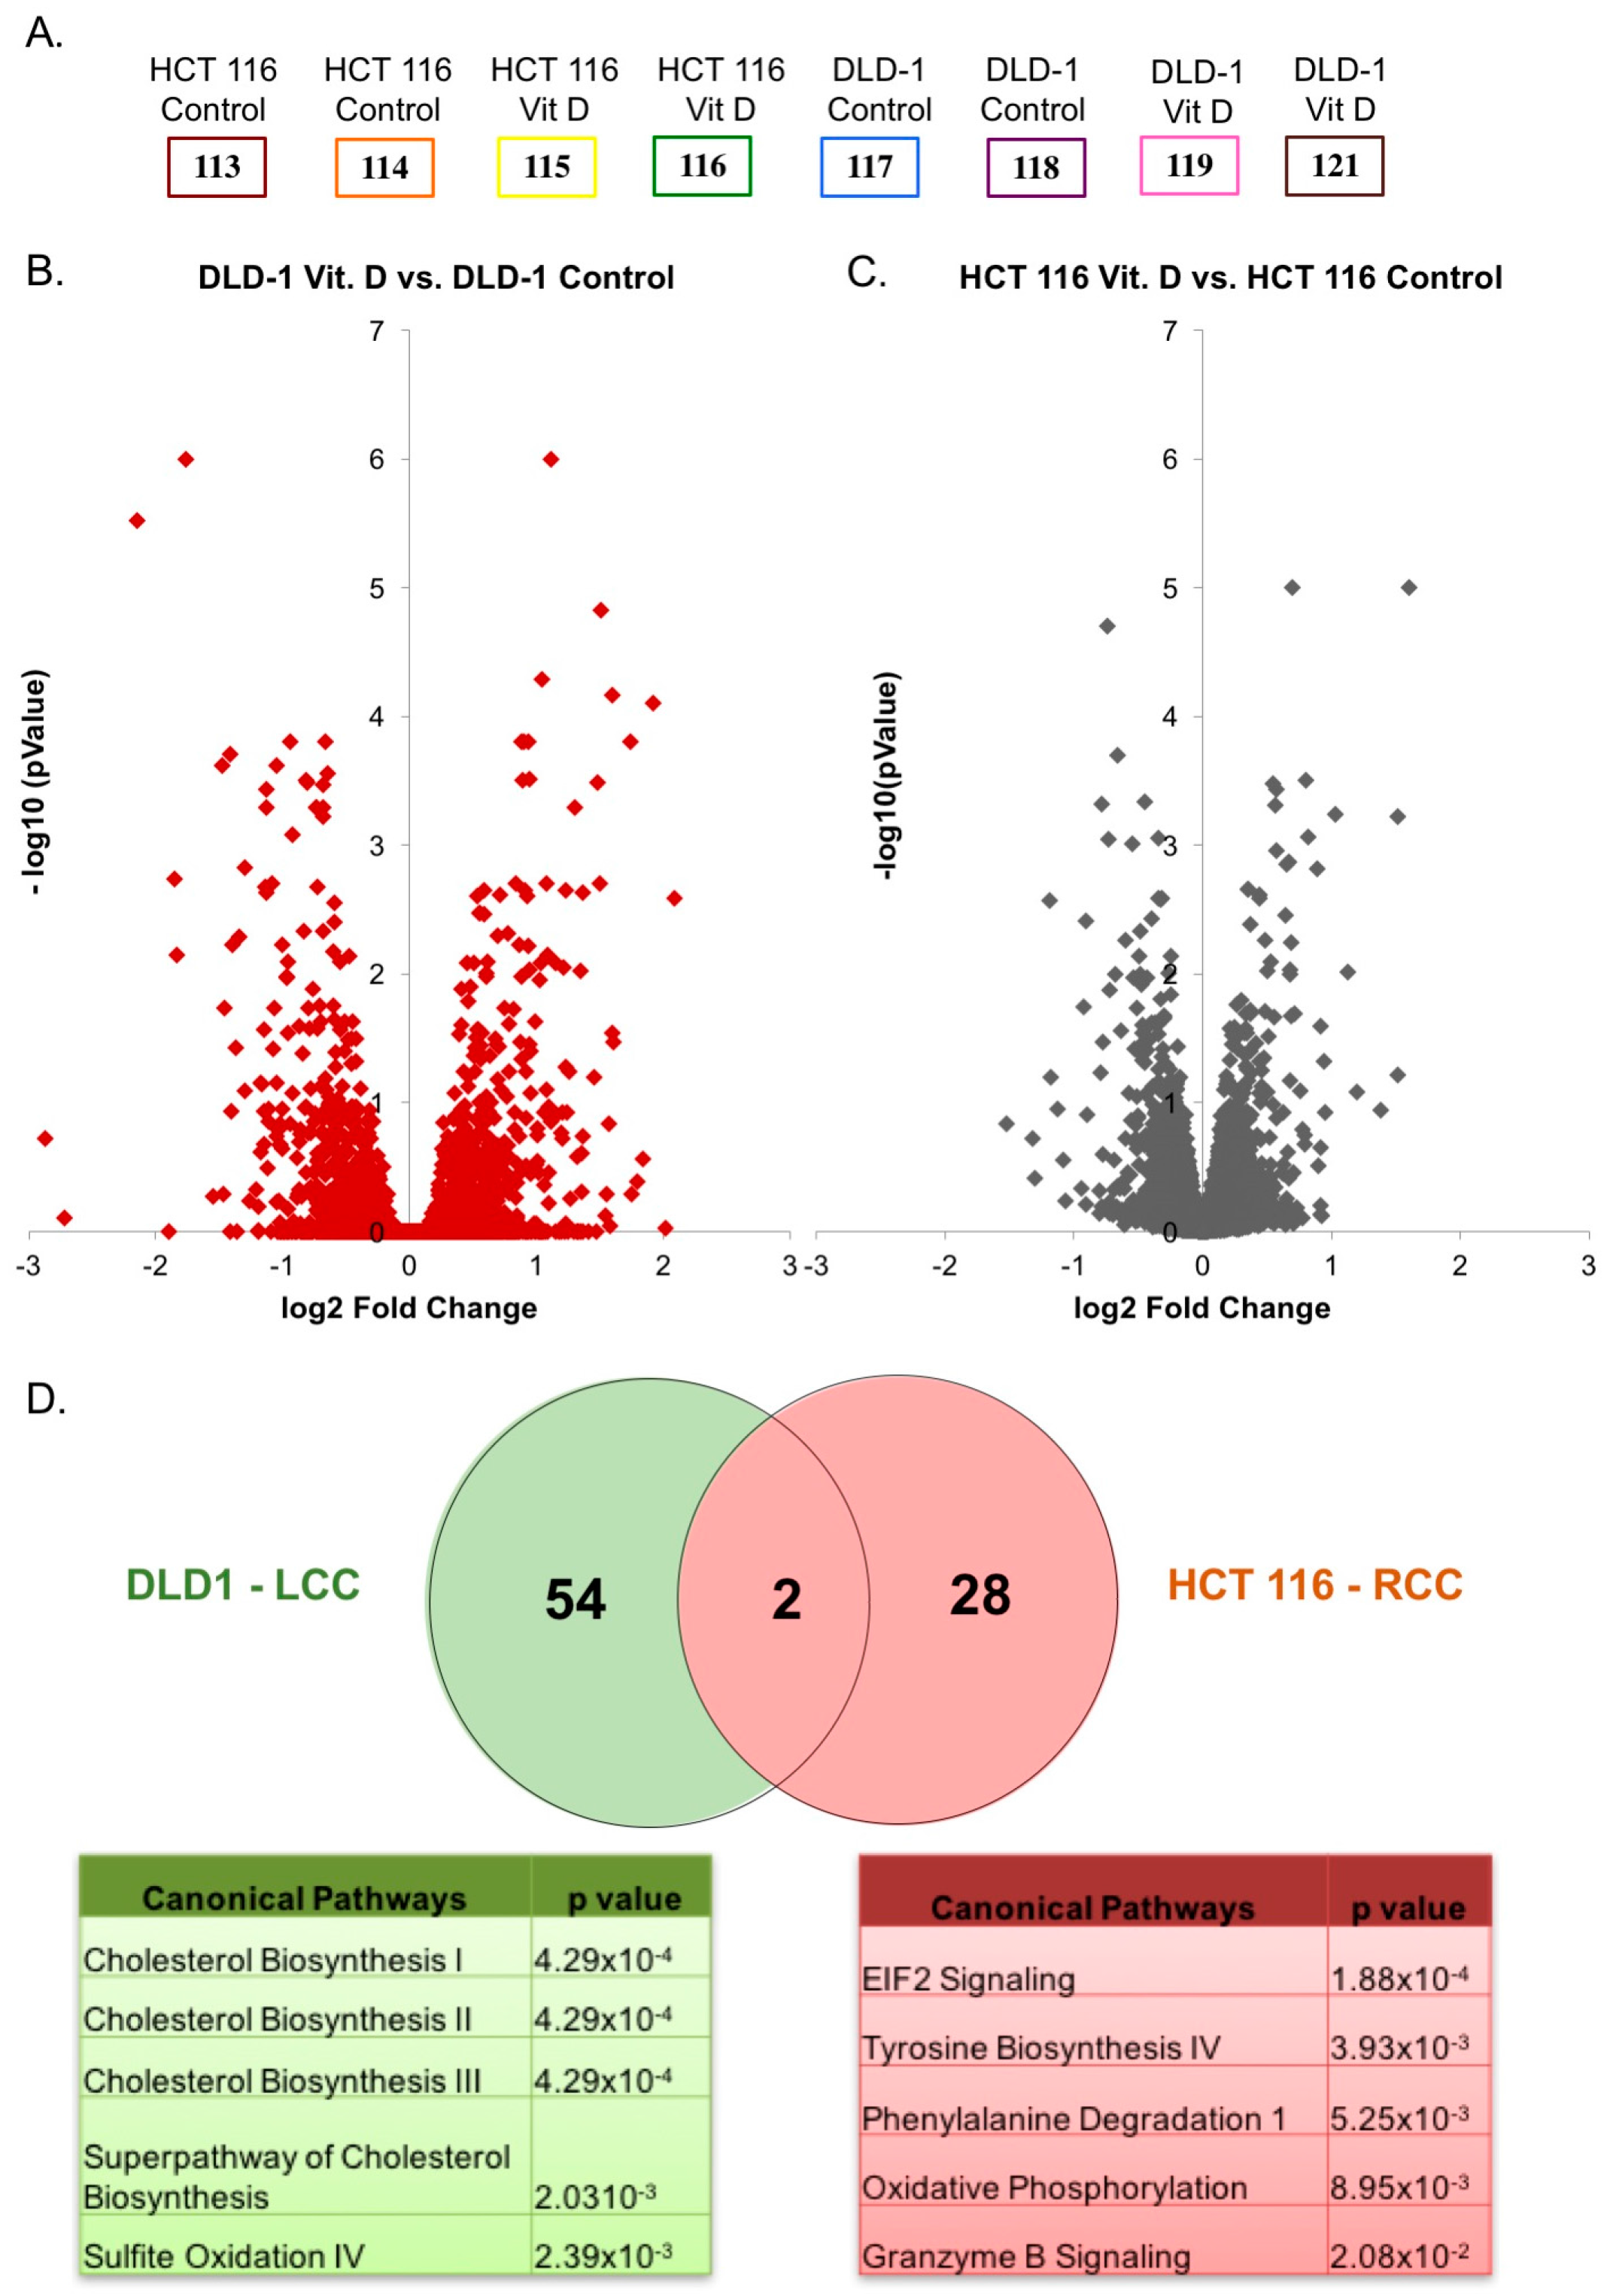
2.2. Proteomic Analysis of Differentially Regulated Proteins in Response to Calcitriol Treatment in RCC and LCC
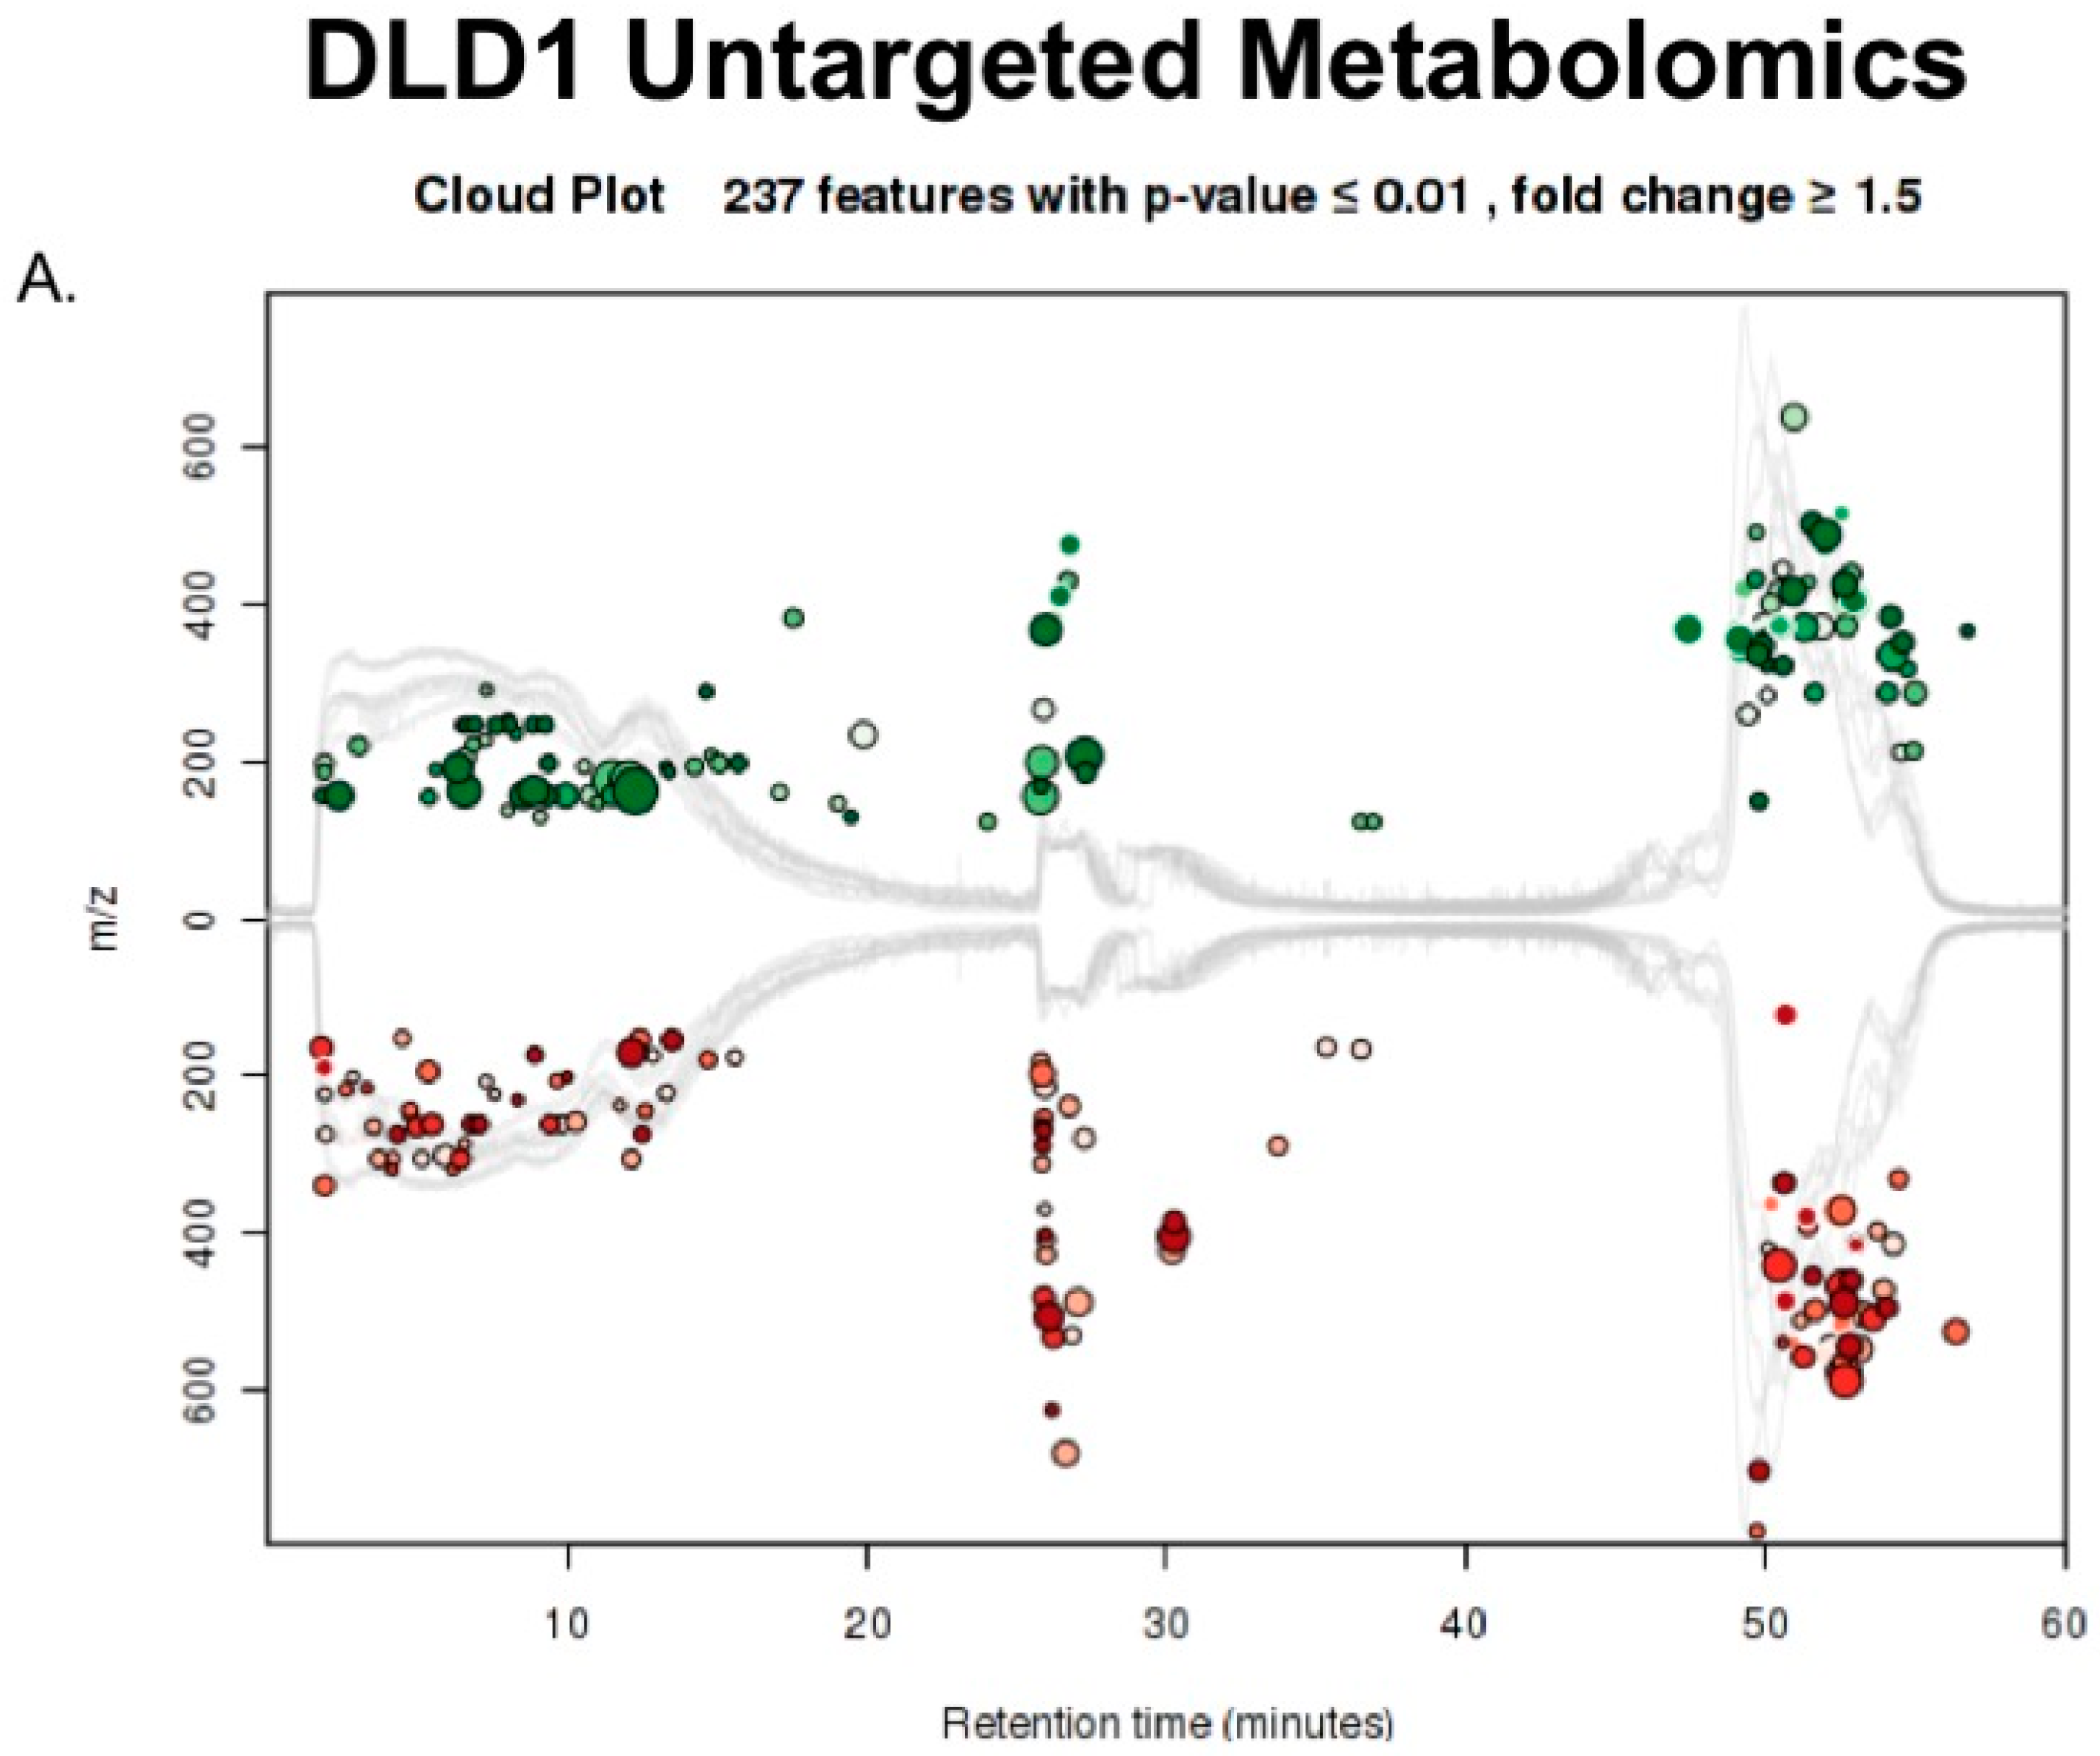
2.3. Untargeted Metabolomics to Determine Differentially Expressed Metabolites in LCC and RCC in Response to Treatment with Calcitriol
3. Discussion
4. Materials and Methods
4.1. Cell Culture Growth and Treatment
4.2. Microarray Dataset of Colon Cancer
4.3. RT-PCR PRAC Expression
4.4. Sample Preparation for Proteomic Analysis
4.5. SCX Fractionation
4.6. Peptide Desalting
4.7. UPLC-ESI-MS/MS Analysis
4.8. Proteomic Data Analysis
4.9. Small Molecule Extraction for Untargeted Metabolomics
4.10. Metabolomic UPLC-ESI-MS/MS Analysis
4.11. Data Analysis Workflow
4.12. Statistical Analyses
Supplementary Materials
Acknowledgments
Author Contributions
Conflicts of Interest
References
- Deeb, K.K.; Trump, D.L.; Johnson, C.S. Vitamin D signalling pathways in cancer: Potential for anticancer therapeutics. Nat. Rev. Cancer 2007, 7, 684–700. [Google Scholar] [CrossRef] [PubMed]
- Feldman, D.; Krishnan, A.V.; Swami, S.; Giovannucci, E.; Feldman, B.J. The role of vitamin D in reducing cancer risk and progression. Nat. Rev. Cancer 2014, 14, 342–357. [Google Scholar] [CrossRef] [PubMed]
- Díaz, L.; Díaz-Muñoz, M.; García-Gaytán, A.C.; Méndez, I. Mechanistic effects of calcitriol in cancer biology. Nutrients 2015, 7, 5020–5050. [Google Scholar] [CrossRef] [PubMed]
- Donaldson, M.S. Nutrition and cancer: A review of the evidence for an anti-cancer diet. Nutr. J. 2004, 3, 19. [Google Scholar] [CrossRef] [PubMed] [Green Version]
- Garland, C.F.; Garland, F.C. Do sunlight and vitamin D reduce the likelihood of colon cancer? Int. J. Epidemiol. 1980, 9, 227–231. [Google Scholar] [CrossRef] [PubMed]
- Pibiri, F.; Kittles, R.A.; Sandler, R.S.; Keku, T.O.; Kupfer, S.S.; Xicola, R.M.; Llor, X.; Ellis, N.A. Genetic variation in vitamin D-related genes and risk of colorectal cancer in African Americans. Cancer Causes Control 2014, 25, 561–570. [Google Scholar] [CrossRef] [PubMed]
- Klampfer, L. Vitamin D and colon cancer. World J. Gastrointest. Oncol. 2014, 6, 430–437. [Google Scholar] [CrossRef] [PubMed]
- Vuolo, L.; Di Somma, C.; Faggiano, A.; Colao, A. Vitamin D and cancer. Front. Endocrinol. (Lausanne) 2012, 3, 58. [Google Scholar] [CrossRef] [PubMed]
- Narvaez, C.J.; Matthews, D.; LaPorta, E.; Simmons, K.M.; Beaudin, S.; Welsh, J. The impact of vitamin D in breast cancer: Genomics, pathways, metabolism. Front. Physiol. 2014, 5, 213. [Google Scholar] [CrossRef] [PubMed]
- Giammanco, M.; Di Majo, D.; La Guardia, M.; Aiello, S.; Crescimannno, M.; Flandina, C.; Tumminello, F.M.; Leto, G. Vitamin D in cancer chemoprevention. Pharm. Biol. 2015, 53, 1399–1434. [Google Scholar] [CrossRef] [PubMed] [Green Version]
- Lee, G.H.; Malietzis, G.; Askari, A.; Bernardo, D.; Al-Hassi, H.O.; Clark, S.K. Is right-sided colon cancer different to left-sided colorectal cancer?—A systematic review. Eur. J. Surg. Oncol. 2015, 41, 300–308. [Google Scholar] [CrossRef] [PubMed]
- Nawa, T.; Kato, J.; Kawamoto, H.; Okada, H.; Yamamoto, H.; Kohno, H.; Endo, H.; Shiratori, Y. Differences between right- and left-sided colon cancer in patient characteristics, cancer morphology and histology. J. Gastroenterol. Hepatol. 2008, 23, 418–423. [Google Scholar] [CrossRef] [PubMed]
- Weiss, J.M.; Pfau, P.R.; O’Connor, E.S.; King, J.; LoConte, N.; Kennedy, G.; Smith, M.A. Mortality by stage for right- versus left-sided colon cancer: Analysis of surveillance, epidemiology, and end results—Medicare data. J. Clin. Oncol. 2011, 29, 4401–4409. [Google Scholar] [CrossRef] [PubMed]
- Meguid, R.A.; Slidell, M.B.; Wolfgang, C.L.; Chang, D.C.; Ahuja, N. Is there a difference in survival between right- versus left-sided colon cancers? Ann. Surg. Oncol. 2011, 15, 2388–2394. [Google Scholar] [CrossRef] [PubMed]
- Yahagi, M.; Okabayashi, K.; Hasegawa, H.; Tsuruta, M.; Kitagawa, Y. The worse prognosis of right-sided compared with left-sided colon cancers: A systematic review and meta-analysis. J. Gastrointest. Surg. 2016, 20, 648–655. [Google Scholar] [CrossRef] [PubMed]
- Glebov, O.K.; Rodriguez, L.M.; Nakahara, K.; Jenkins, J.; Cliatt, J.; Humbyrd, C.; DeNobile, J.; Soballe, P.; Simon, R.; Wright, G.; et al. Distinguishing right from left colon by the pattern of gene expression. Cancer Epidemiol. Biomark. Prev. 2003, 12, 755–762. [Google Scholar]
- Loupakis, F.; Yang, D.; Yau, L.; Feng, S.; Cremolini, C.; Zhang, W.; Maus, M.K.; Antoniotti, C.; Langer, C.; Scherer, S.J.; et al. Primary tumor location as a prognostic factor in metastatic colorectal cancer. J. Natl. Cancer Inst. 2015, 107. [Google Scholar] [CrossRef] [PubMed]
- Bleeker, W.A.; Hayes, V.M.; Karrenbeld, A.; Hofstra, R.M.W.; Hermans, J.; Buys, C.; Plukker, J.T. Impact of KRAS and TP53 mutations on survival in patients with left- and right-sided Dukes’ C colon cancer. Am. J. Gastroenterol. 2000, 95, 2953–2957. [Google Scholar] [CrossRef] [PubMed]
- Shang, J.; Zhang, Z.; Song, W.; Zhou, B.; Zhang, Y.; Li, G.; Qiu, S. S100A10 as a novel biomarker in colorectal cancer. Tumor Biol. 2013, 34, 3785–3790. [Google Scholar] [CrossRef] [PubMed]
- Dexter, D.L.; Spremulli, E.N.; Fligiel, Z.; Barbosa, J.A.; Vogel, R.; VanVoorhees, A.; Calabresi, P. Heterogeneity of cancer cells from a single human colon carcinoma. Am. J. Med. 1981, 71, 949–956. [Google Scholar] [CrossRef]
- Liu, X.F.; Olsson, P.; Wolfgang, C.D.; Bera, T.K.; Duray, P.; Lee, B.; Pastan, I. PRAC: A novel small nuclear protein that is specifically expressed in human prostate and colon. Prostate 2001, 47, 125–131. [Google Scholar] [CrossRef] [PubMed]
- Pelosof, L.; Yerram, S.R.; Ahuja, N.; Delmas, A.; Herman, J.G.; Azad, N.S. CHFR silencing or microsatellite instability is associated with increased anti-tumor activity of docetaxel or gemcitabine in colorectal cancer. Int. J. Cancer 2013, 134, 1–23. [Google Scholar] [CrossRef]
- Shen, Y.; Yu, D.; Qi, P.; Wang, X.; Guo, X.; Zhang, A. Calcitriol induces cell senescence of kidney cancer through JMJD3 mediated histone demethylation. Oncotarget 2017, 8, 100187–100195. [Google Scholar] [CrossRef] [PubMed]
- Koren, R.; Wacksberg, S.; Weitsman, G.E.; Ravid, A. Calcitriol sensitizes colon cancer cells to H2O2-induced cytotoxicity while inhibiting caspase activation. J. Steroid Biochem. Mol. Biol. 2006, 101, 151–160. [Google Scholar] [CrossRef] [PubMed]
- Thornberry, N.A.; Rano, T.A.; Peterson, P.; Rasper, D.M.; Timkey, T.; Garcia-Calvo, M.; Houtzager, V.M.; Nordstrom, P.A.; Roy, S.; Vaillancourt, J.P.; et al. A combinatorial approach defines specificities of members of the caspase family and granzyme B: Functional relationships established for key mediators of apoptosis. J. Biol. Chem. 1997, 272, 17907–17911. [Google Scholar] [CrossRef] [PubMed]
- Lai, M.D.; Xu, J. Ribosomal proteins and colorectal cancer. Curr. Genom. 2007, 8, 43–49. [Google Scholar] [CrossRef]
- Loging, W.T.; Reisman, D. Elevated Expression of ribosomal protein genes L37, RPP-1, and S2 in the presence of mutant p53. Cancer Epidemiol. Biomark. Prev. 1999, 8, 1011–1016. [Google Scholar]
- Vaarala, M.H.; Porvari, K.S.; Kyllönen, A.P.; Mustonen, M.V.J.; Lukkarinen, O.; Vihko, P.T. Several genes encoding ribosomal proteins are over-expressed in prostate-cancer cell lines: Confirmation of L7a and L37 over-expression in prostate-cancer tissue samples. Int. J. Cancer 1998, 78, 27–32. [Google Scholar] [CrossRef]
- Donato, R. Intracellular and extracellular roles of S100 proteins. Microsc. Res. Tech. 2003, 60, 540–551. [Google Scholar] [CrossRef] [PubMed]
- Hildenbrand, R.; Allgayer, H.; Marx, A.; Stroebel, P. Modulators of the urokinase-type plasminogen activation system for cancer. Expert Opin. Investig. Drugs 2010, 19, 641–652. [Google Scholar] [CrossRef] [PubMed]
- Patti, G.J.; Yanes, O.; Siuzdak, G. Metabolomics: The apogee or the omic trilolgy. Nat. Rev. Mol. Cell Biol. 2013, 13, 263–269. [Google Scholar] [CrossRef] [PubMed]
- Smith, C.A.; Want, E.J.; O’Maille, G.; Abagyan, R.; Siuzdak, G. XCMS: Processing mass spectrometry data for metabolite profiling using nonlinear peak alignment, matching, and identification. Anal. Chem. 2006, 78, 779–787. [Google Scholar] [CrossRef] [PubMed]
- Siegel, R.L.; Miller, K.D.; Fedewa, S.A.; Ahnen, D.J.; Meester, R.G.S.; Barzi, A.; Jemal, A. Colorectal cancer statistics, 2017. CA Cancer J. Clin. 2017, 67, 177–193. [Google Scholar] [CrossRef] [PubMed]
- Zhang, B.; Wang, J.; Wang, X.; Zhu, J.; Liu, Q.; Shi, Z.; Chambers, M.C.; Zimmerman, L.J.; Shaddox, K.F.; Kim, S.; et al. Proteogenomic characterization of human colon and rectal cancer. Nature 2014, 513, 382–387. [Google Scholar] [CrossRef] [PubMed]
- Yang, K.; Kurihara, N.; Fan, K.; Newmark, H.; Rigas, B.; Bancroft, L.; Corner, G.; Livote, E.; Lesser, M.; Edelmann, W.; et al. Dietary induction of colonic tumors in a mouse model of sporadic colon cancer. Cancer Res. 2008, 68, 7803–7810. [Google Scholar] [CrossRef] [PubMed]
- Newmark, H.L.; Yang, K.; Kurihara, N.; Fan, K.; Augenlicht, L.H.; Lipkin, M. Western-style diet-induced colonic tumors and their modulation by calcium and vitamin D in C57Bl/6 mice: A preclinical model for human sporadic colon cancer. Carcinogenesis 2009, 30, 88–92. [Google Scholar] [CrossRef] [PubMed]
- Finley, G.G.; Schulz, N.T.; Hill, S.A.; Geiser, J.R.; Pipas, J.M.; Meisler, A.I. Expression of the myc gene family in different stages of human colorectal cancer. Oncogene 1989, 4, 963–971. [Google Scholar] [PubMed]
- Nesbit, C.E.; Tersak, J.M.; Prochownik, E.V. MYC oncogenes and human neoplastic disease. Oncogene 1999, 18, 3004–3016. [Google Scholar] [CrossRef] [PubMed]
- Salehi-Tabar, R.; Nguyen-Yamamoto, L.; Tavera-Mendoza, L.E.; Quail, T.; Dimitrov, V.; An, B.-S.; Glass, L.; Goltzman, D.; White, J.H. Vitamin D receptor as a master regulator of the c-MYC/MXD1 network. Proc. Natl. Acad. Sci. USA 2012, 109, 18827–18832. [Google Scholar] [CrossRef] [PubMed]
- Abu el Maaty, M.A.; Wölfl, S. Vitamin D as a novel regulator of tumor metabolism: insights on potential mechanisms and implications for anti-cancer therapy. Int. J. Mol. Sci. 2017, 18, 2184. [Google Scholar] [CrossRef] [PubMed]
- Schwartz, J. Effects of Vitamin D Supplementation in atorvastatin-treated patients: A new drug interaction with an unexpected consequence. Clin. Pharmacol. Ther. 2009, 85, 198–203. [Google Scholar] [CrossRef] [PubMed]
- Chandrasekharan, J.A.; Sharma-Wali, N. Lipoxins: Nature’s way to resolve inflammation. J. Inflamm. Res. 2015, 8, 181–192. [Google Scholar] [CrossRef] [PubMed]
- Jorissen, R.N.; Lipton, L.; Gibbs, P.; Chapman, M.; Desai, J.; Ian, T.; Yeatman, T.J.; East, P.; Tomlinson, I.P.; Verspaget, H.W.; et al. DNA copy-number alterations underlie gene expression differences between microsatellite stable and unstable colorectal cancers. Clin. Cancer Res. 2008, 14, 8061–8069. [Google Scholar] [CrossRef] [PubMed]
- Schroll, M.M.; Liu, X.; Herzog, S.K.; Skube, S.B.; Hummon, A.B. Nutrient Restriction of Glucose or Serum Results in Similar Proteomic Expression Changes in 3D Colon Cancer Cell Cultures. Nutr. Res. 2016, 36, 1068–1080. [Google Scholar] [CrossRef] [PubMed]
- Schroll, M.M.; LaBonia, G.J.; Ludwig, K.R.; Hummon, A.B. Glucose restriction combined with autophagy inhibition and chemotherapy in HCT 116 spheroids decreases cell clonogenicity and viability regulated by tumor suppressor genes. J. Proteome Res. 2017, 16, 3009–3018. [Google Scholar] [CrossRef] [PubMed]
- Efstathiou, G.; Antonakis, A.N.; Pavlopoulos, G.A.; Theodosiou, T.; Divanach, P.; Trudgian, D.C.; Thomas, B.; Papanikolaou, N.; Aivaliotis, M.; Acuto, O.; et al. ProteoSign: An end-user online differential proteomics statistical analysis platform. Nucleic Acids Res. 2017, 45, W300–W306. [Google Scholar] [CrossRef] [PubMed]


© 2018 by the authors. Licensee MDPI, Basel, Switzerland. This article is an open access article distributed under the terms and conditions of the Creative Commons Attribution (CC BY) license (http://creativecommons.org/licenses/by/4.0/).
Share and Cite
Schroll, M.M.; Ludwig, K.R.; Bauer, K.M.; Hummon, A.B. Calcitriol Supplementation Causes Decreases in Tumorigenic Proteins and Different Proteomic and Metabolomic Signatures in Right versus Left-Sided Colon Cancer. Metabolites 2018, 8, 5. https://doi.org/10.3390/metabo8010005
Schroll MM, Ludwig KR, Bauer KM, Hummon AB. Calcitriol Supplementation Causes Decreases in Tumorigenic Proteins and Different Proteomic and Metabolomic Signatures in Right versus Left-Sided Colon Cancer. Metabolites. 2018; 8(1):5. https://doi.org/10.3390/metabo8010005
Chicago/Turabian StyleSchroll, Monica M., Katelyn R. Ludwig, Kerry M. Bauer, and Amanda B. Hummon. 2018. "Calcitriol Supplementation Causes Decreases in Tumorigenic Proteins and Different Proteomic and Metabolomic Signatures in Right versus Left-Sided Colon Cancer" Metabolites 8, no. 1: 5. https://doi.org/10.3390/metabo8010005