Evidence That Parietal Lobe Fatty Acids May Be More Profoundly Affected in Moderate Alzheimer’s Disease (AD) Pathology Than in Severe AD Pathology

 , , ,
, , ,  and
and 
Abstract
:1. Introduction
2. Results
3. Discussion
4. Materials and Methods
4.1. Reagents and Analytical Standards
4.2. Human Post-Mortem Tissue
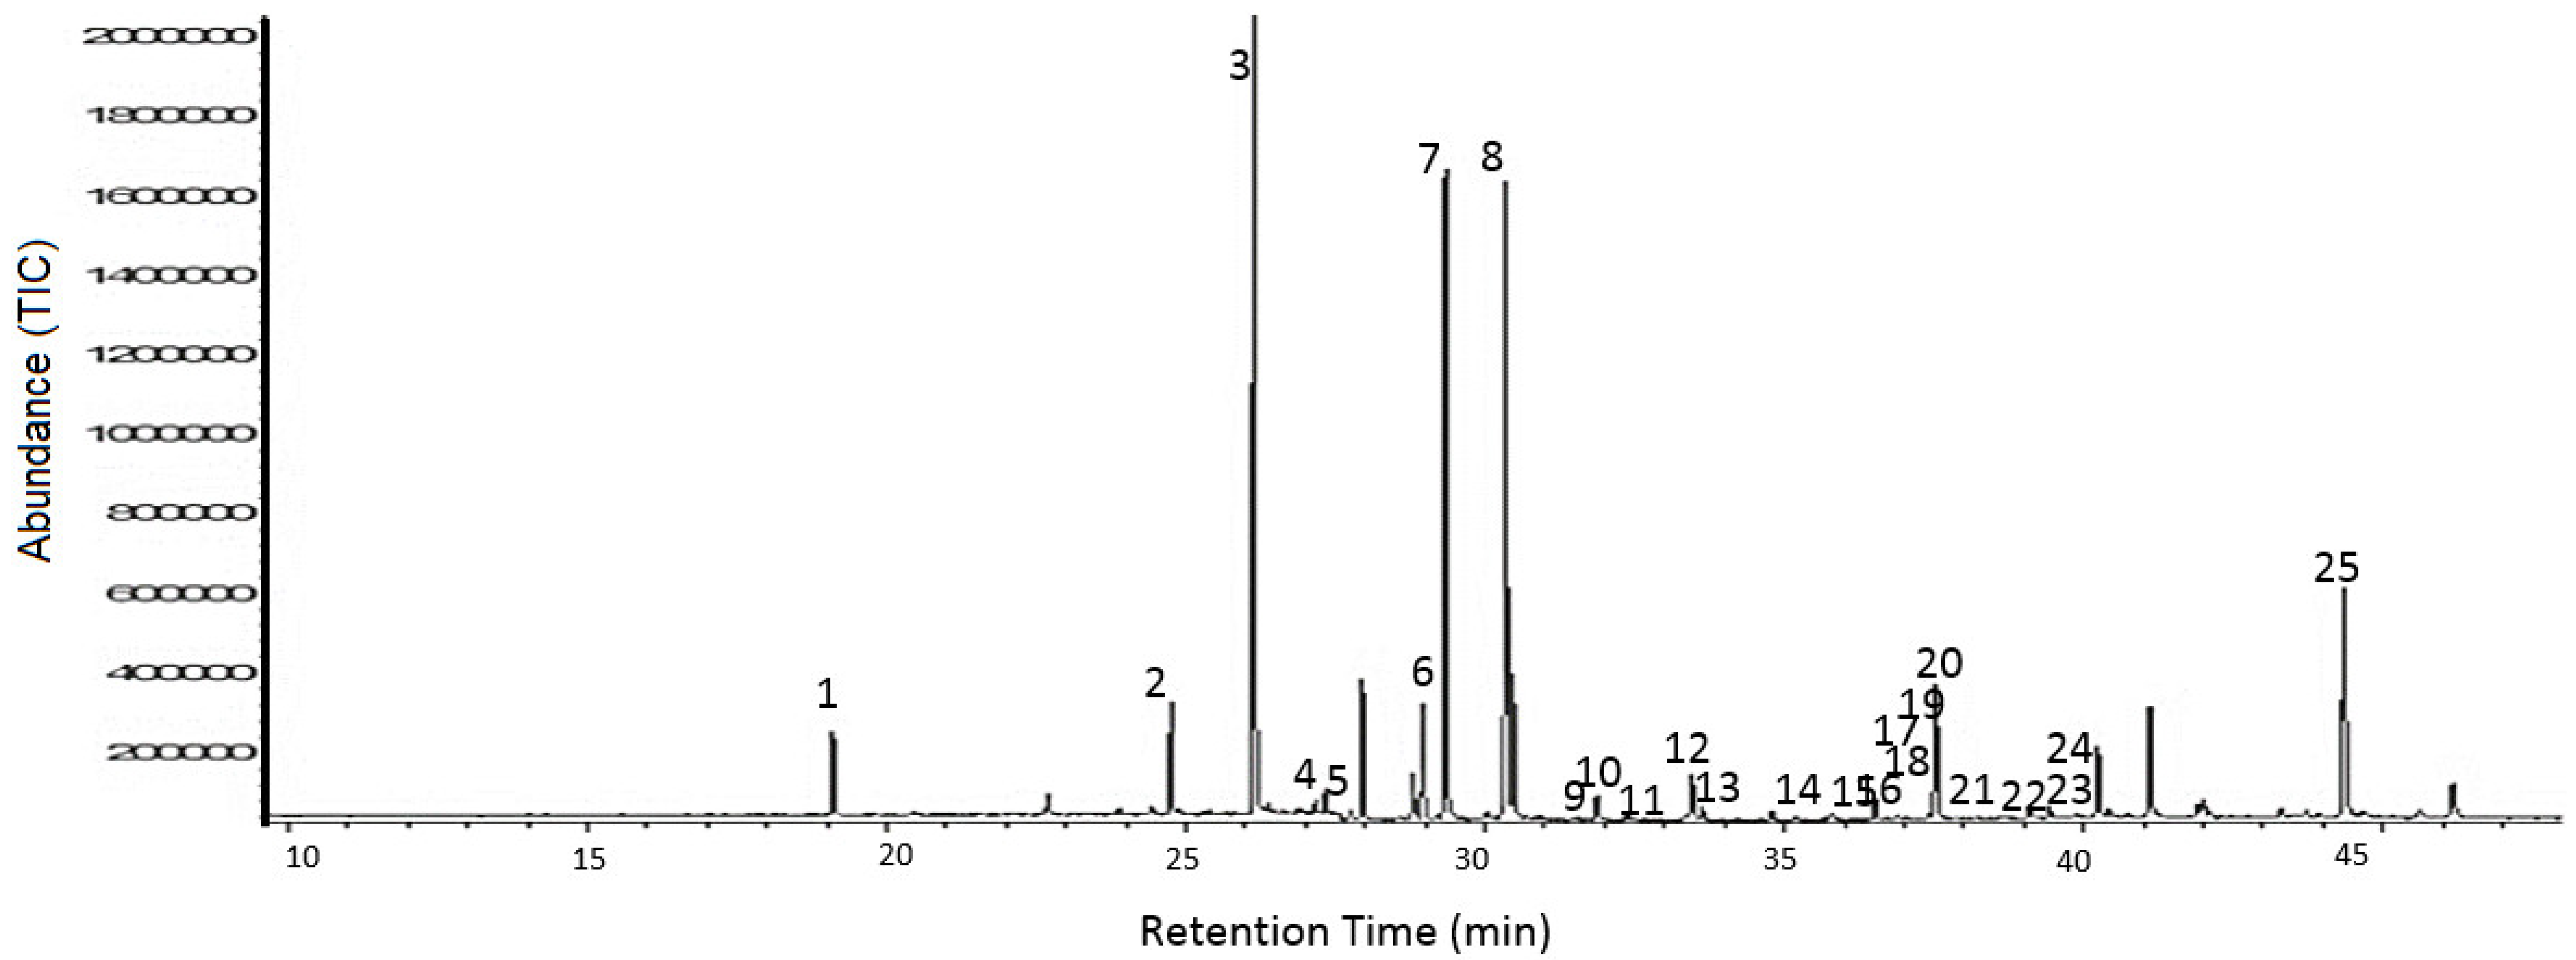
4.3. Sample Preparation and GC-MS Analysis
4.4. Data Analysis
Supplementary Materials
Author Contributions
Funding
Acknowledgments
Conflicts of Interest
References
- Prince, M.; Bryce, R.; Albanese, E.; Wimo, A.; Ribeiro, W.; Ferri, C.P. The global prevalence of dementia: A systematic review and metaanalysis. Alzheimers Dement. 2013, 9, 63–75. [Google Scholar] [CrossRef] [PubMed]
- Karran, E.; Mercken, M.; De Strooper, B. The amyloid cascade hypothesis for Alzheimer’s disease: An appraisal for the development of therapeutics. Nat. Rev. Drug Discov. 2011, 10, 698–712. [Google Scholar] [CrossRef] [PubMed]
- Ittner, L.M.; Gotz, J. Amyloid-beta and tau-a toxic pas de deux in Alzheimer’s disease. Nat. Rev. Neurosci. 2011, 12, 65–72. [Google Scholar] [CrossRef] [PubMed]
- Touboul, D.; Gaudin, M. Lipidomics of Alzheimer’s disease. Bioanalysis 2014, 6, 541–561. [Google Scholar] [CrossRef] [PubMed]
- Abu-Saad, K.; Shahar, D.R.; Vardi, H.; Fraser, D. Importance of ethnic foods as predictors of and contributors to nutrient intake levels in a minority population. Eur. J. Clin. Nutr. 2010, 64, S88–S94. [Google Scholar] [CrossRef] [PubMed]
- Cutler, R.G.; Kelly, J.; Storie, K.; Pedersen, W.A.; Tammara, A.; Hatanpaa, K.; Troncoso, J.C.; Mattson, M.P. Involvement of oxidative stress-induced abnormalities in ceramide and cholesterol metabolism in brain aging and Alzheimer’s disease. Proc. Natl. Acad. Sci. USA 2004, 101, 2070–2075. [Google Scholar] [CrossRef] [PubMed]
- Yanagisawa, K.; Odaka, A.; Suzuki, N.; Ihara, Y. GM1 ganglioside-bound amyloid beta-protein (A beta): A possible form of preamyloid in Alzheimer’s disease. Nat. Med. 1995, 1, 1062–1066. [Google Scholar] [CrossRef] [PubMed]
- Berridge, M.J. Inositol trisphosphate and calcium signaling. Ann. N. Y. Acad. Sci. 1995, 766, 31–43. [Google Scholar] [CrossRef] [PubMed]
- Yuan, Q.; Zhao, S.; Wang, F.; Zhang, H.; Chen, Z.J.; Wang, J.; Wang, Z.; Du, Z.; Ling, E.A.; Liu, Q.; et al. Palmitic acid increases apoptosis of neural stem cells via activating c-Jun N-terminal kinase. Stem Cell Res. 2013, 10, 257–266. [Google Scholar] [CrossRef] [PubMed] [Green Version]
- Takenawa, T.; Itoh, T. Phosphoinositides, key molecules for regulation of actin cytoskeletal organization and membrane traffic from the plasma membrane. Biochim. Biophys. Acta 2001, 1533, 190–206. [Google Scholar] [CrossRef]
- Wenk, M.R.; De Camilli, P. Protein-lipid interactions and phosphoinositide metabolism in membrane traffic: Insights from vesicle recycling in nerve terminals. Proc. Natl. Acad. Sci. USA 2004, 101, 8262–8269. [Google Scholar] [CrossRef] [PubMed] [Green Version]
- Nasaruddin, M.L.; Holscher, C.; Kehoe, P.; Graham, S.F.; Green, B.D. Wide-ranging alterations in the brain fatty acid complement of subjects with late Alzheimer’s disease as detected by GC-MS. Am. J. Transl. Res. 2016, 8, 154–165. [Google Scholar] [PubMed]
- Martin, V.; Fabelo, N.; Santpere, G.; Puig, B.; Marin, R.; Ferrer, I.; Diaz, M. Lipid alterations in lipid rafts from Alzheimer’s disease human brain cortex. J. Alzheimers Dis. 2010, 19, 489–502. [Google Scholar] [CrossRef] [PubMed]
- Wood, P.L. Lipidomics of Alzheimer’s disease: Current status. Alzheimers Res. Ther. 2012, 4, 5. [Google Scholar] [CrossRef] [PubMed]
- Wang, D.C.; Sun, C.H.; Liu, L.Y.; Sun, X.H.; Jin, X.W.; Song, W.L.; Liu, X.Q.; Wan, X.L. Serum fatty acid profiles using GC-MS and multivariate statistical analysis: Potential biomarkers of Alzheimer’s disease. Neurobiol. Aging 2012, 33, 1057–1066. [Google Scholar] [CrossRef] [PubMed]
- Fraser, T.; Tayler, H.; Love, S. Fatty Acid Composition of Frontal, Temporal and Parietal Neocortex in the Normal Human Brain and in Alzheimer’s Disease. Neurochem. Res. 2010, 35, 503–513. [Google Scholar] [CrossRef] [PubMed]
- Igarashi, M.; Ma, K.; Gao, F.; Kim, H.W.; Rapoport, S.I.; Rao, J.S. Disturbed choline plasmalogen and phospholipid fatty acid concentrations in Alzheimer’s disease prefrontal cortex. J. Alzheimers Dis. 2011, 24, 507–517. [Google Scholar] [CrossRef] [PubMed]
- Pan, X.; Nasaruddin, M.B.; Elliott, C.T.; McGuinness, B.; Passmore, A.P.; Kehoe, P.G.; Holscher, C.; McClean, P.L.; Graham, S.F.; Green, B.D. Alzheimer’s disease-like pathology has transient effects on the brain and blood metabolome. Neurobiol. Aging 2016, 38, 151–163. [Google Scholar] [CrossRef] [PubMed] [Green Version]
- Cunnane, S.C.; Schneider, J.A.; Tangney, C.; Tremblay-Mercier, J.; Fortier, M.; Bennett, D.A.; Morris, M.C. Plasma and brain fatty acid profiles in mild cognitive impairment and Alzheimer’s disease. J. Alzheimers Dis. 2012, 29, 691–697. [Google Scholar] [CrossRef] [PubMed]
- Roher, A.E.; Weiss, N.; Kokjohn, T.A.; Kuo, Y.M.; Kalback, W.; Anthony, J.; Watson, D.; Luehrs, D.C.; Sue, L.; Walker, D.; et al. Increased A beta peptides and reduced cholesterol and myelin proteins characterize white matter degeneration in Alzheimer’s disease. Biochemistry 2002, 41, 11080–11090. [Google Scholar] [CrossRef] [PubMed]
- Soderberg, M.; Edlund, C.; Kristensson, K.; Dallner, G. Fatty-Acid Composition of Brain Phospholipids in Aging and in Alzheimers-Disease. Lipids 1991, 26, 421–425. [Google Scholar] [CrossRef] [PubMed]
- Wang, G.; Zhou, Y.; Huang, F.J.; Tang, H.D.; Xu, X.H.; Liu, J.J.; Wang, Y.; Deng, Y.L.; Ren, R.J.; Xu, W.; et al. Plasma metabolite profiles of Alzheimer’s disease and mild cognitive impairment. J. Proteome Res. 2014, 13, 2649–2658. [Google Scholar] [CrossRef] [PubMed]
- Skinner, E.R.; Watt, C.; Besson, J.A.; Best, P.V. Differences in the fatty acid composition of the grey and white matter of different regions of the brains of patients with Alzheimer’s disease and control subjects. Brain 1993, 116, 717–725. [Google Scholar] [CrossRef] [PubMed]
- Corrigan, F.M.; Horrobin, D.F.; Skinner, E.R.; Besson, J.A.; Cooper, M.B. Abnormal content of n-6 and n-3 long-chain unsaturated fatty acids in the phosphoglycerides and cholesterol esters of parahippocampal cortex from Alzheimer’s disease patients and its relationship to acetyl CoA content. Int. J. Biochem. Cell Biol. 1998, 30, 197–207. [Google Scholar] [CrossRef]
- Pamplona, R.; Dalfo, E.; Ayala, V.; Bellmunt, M.J.; Prat, J.; Ferrer, I.; Portero-Otin, M. Proteins in human brain cortex are modified by oxidation, glycoxidation, and lipoxidation: Effects of Alzheimer disease and identification of lipoxidation targets. J. Biol. Chem. 2005, 280, 21522–21530. [Google Scholar] [CrossRef] [PubMed]
- Guan, Z.Z.; Soderberg, M.; Sindelar, P.; Edlund, C. Content and fatty acid composition of cardiolipin in the brain of patients with Alzheimer’s disease. Neurochem. Int. 1994, 25, 295–300. [Google Scholar] [CrossRef]
- Astarita, G.; Jung, K.M.; Vasilevko, V.; Dipatrizio, N.V.; Martin, S.K.; Cribbs, D.H.; Head, E.; Cotman, C.W.; Piomelli, D. Elevated stearoyl-CoA desaturase in brains of patients with Alzheimer’s disease. PLoS ONE 2011, 6, e24777. [Google Scholar] [CrossRef] [PubMed]
- Patil, S.; Chan, C. Palmitic and stearic fatty acids induce Alzheimer-like hyperphosphorylation of tau in primary rat cortical neurons. Neurosci. Lett. 2005, 384, 288–293. [Google Scholar] [CrossRef] [PubMed]
- Ronnemaa, E.; Zethelius, B.; Vessby, B.; Lannfelt, L.; Byberg, L.; Kilander, L. Serum fatty-acid composition and the risk of Alzheimer’s disease: A longitudinal population-based study. Eur. J. Clin. Nutr. 2012, 66, 885–890. [Google Scholar] [CrossRef] [PubMed]
- Schmitz, G.; Ecker, J. The opposing effects of n-3 and n-6 fatty acids. Prog. Lipid Res. 2008, 47, 147–155. [Google Scholar] [CrossRef] [PubMed]
- Wall, R.; Ross, R.P.; Fitzgerald, G.F.; Stanton, C. Fatty acids from fish: The anti-inflammatory potential of long-chain omega-3 fatty acids. Nutr. Rev. 2010, 68, 280–289. [Google Scholar] [CrossRef] [PubMed]
- Patterson, E.; Wall, R.; Fitzgerald, G.F.; Ross, R.P.; Stanton, C. Health implications of high dietary omega-6 polyunsaturated Fatty acids. J. Nutr. Metab. 2012, 2012, 539426. [Google Scholar] [CrossRef] [PubMed]
- Sanchez-Mejia, R.O.; Mucke, L. Phospholipase A2 and arachidonic acid in Alzheimer’s disease. Biochim. Biophys. Acta 2010, 1801, 784–790. [Google Scholar] [CrossRef] [PubMed]
- Serhan, C.N.; Arita, M.; Hong, S.; Gotlinger, K. Resolvins, docosatrienes, and neuroprotectins, novel omega-3-derived mediators, and their endogenous aspirin-triggered epimers. Lipids 2004, 39, 1125–1132. [Google Scholar] [CrossRef] [PubMed]
- Youdim, K.A.; Martin, A.; Joseph, J.A. Essential fatty acids and the brain: Possible health implications. Int. J. Dev. Neurosci. 2000, 18, 383–399. [Google Scholar] [CrossRef]
- Brooksbank, B.W.; Martinez, M. Lipid abnormalities in the brain in adult Down’s syndrome and Alzheimer’s disease. Mol. Chem. Neuropathol. 1989, 11, 157–185. [Google Scholar] [CrossRef] [PubMed]
- Prasad, M.R.; Lovell, M.A.; Yatin, M.; Dhillon, H.; Markesbery, W.R. Regional membrane phospholipid alterations in Alzheimer’s disease. Neurochem. Res. 1998, 23, 81–88. [Google Scholar] [CrossRef] [PubMed]
- Lukiw, W.J.; Cui, J.G.; Marcheselli, V.L.; Bodker, M.; Botkjaer, A.; Gotlinger, K.; Serhan, C.N.; Bazan, N.G. A role for docosahexaenoic acid-derived neuroprotectin D1 in neural cell survival and Alzheimer disease. J. Clin. Investig. 2005, 115, 2774–2783. [Google Scholar] [CrossRef] [PubMed] [Green Version]
- Hong, S.; Gronert, K.; Devchand, P.R.; Moussignac, R.L.; Serhan, C.N. Novel docosatrienes and 17S-resolvins generated from docosahexaenoic acid in murine brain, human blood, and glial cells. Autacoids in anti-inflammation. J. Biol. Chem. 2003, 278, 14677–14687. [Google Scholar] [CrossRef] [PubMed]
- Bagga, D.; Wang, L.; Farias-Eisner, R.; Glaspy, J.A.; Reddy, S.T. Differential effects of prostaglandin derived from omega-6 and omega-3 polyunsaturated fatty acids on COX-2 expression and IL-6 secretion. Proc. Natl. Acad. Sci. USA 2003, 100, 1751–1756. [Google Scholar] [CrossRef] [PubMed]
- Lucke, C.; Gantz, D.L.; Klimtchuk, E.; Hamilton, J.A. Interactions between fatty acids and alpha-synuclein. J. Lipid Res. 2006, 47, 1714–1724. [Google Scholar] [CrossRef] [PubMed]
- George, J.M.; Jin, H.; Woods, W.S.; Clayton, D.F. Characterization of a novel protein regulated during the critical period for song learning in the zebra finch. Neuron 1995, 15, 361–372. [Google Scholar] [CrossRef]
- Hashimoto, M.; Masliah, E. Alpha-synuclein in Lewy body disease and Alzheimer’s disease. Brain Pathol. 1999, 9, 707–720. [Google Scholar] [CrossRef] [PubMed]
- Sharon, R.; Bar-Joseph, I.; Frosch, M.P.; Walsh, D.M.; Hamilton, J.A.; Selkoe, D.J. The formation of highly soluble oligomers of alpha-synuclein is regulated by fatty acids and enhanced in Parkinson’s disease. Neuron 2003, 37, 583–595. [Google Scholar] [CrossRef]
- Sharon, R.; Bar-Joseph, I.; Mirick, G.E.; Serhan, C.N.; Selkoe, D.J. Altered fatty acid composition of dopaminergic neurons expressing alpha-synuclein and human brains with alpha-synucleinopathies. J. Biol. Chem. 2003, 278, 49874–49881. [Google Scholar] [CrossRef] [PubMed]
- Broersen, K.; van den Brink, D.; Fraser, G.; Goedert, M.; Davletov, B. Alpha-synuclein adopts an alpha-helical conformation in the presence of polyunsaturated fatty acids to hinder micelle formation. Biochemistry 2006, 45, 15610–15616. [Google Scholar] [CrossRef] [PubMed]
- Graham, S.F.; Nasaruddin, M.B.; Carey, M.; Holscher, C.; McGuinness, B.; Kehoe, P.G.; Love, S.; Passmore, P.; Elliott, C.T.; Meharg, A.A.; et al. Age-associated changes of brain copper, iron, and zinc in Alzheimer’s disease and dementia with Lewy bodies. J. Alzheimers Dis. 2014, 42, 1407–1413. [Google Scholar] [CrossRef] [PubMed]
- Montine, T.J.; Phelps, C.H.; Beach, T.G.; Bigio, E.H.; Cairns, N.J.; Dickson, D.W.; Duyckaerts, C.; Frosch, M.P.; Masliah, E.; Mirra, S.S.; et al. National Institute on A and Alzheimer’s A. National Institute on Aging-Alzheimer’s Association guidelines for the neuropathologic assessment of Alzheimer’s disease: A practical approach. Acta Neuropathol. 2012, 123, 1–11. [Google Scholar] [CrossRef] [PubMed]
- McKeith, I.G.; Dickson, D.W.; Lowe, J.; Emre, M.; O’Brien, J.T.; Feldman, H.; Cummings, J.; Duda, J.E.; Lippa, C.; Perry, E.K.; et al. Diagnosis and management of dementia with Lewy bodies: Third report of the DLB Consortium. Neurology 2005, 65, 1863–1872. [Google Scholar] [CrossRef] [PubMed]
- Hansen, L.A.; Daniel, S.E.; Wilcock, G.K.; Love, S. Frontal cortical synaptophysin in Lewy body diseases: Relation to Alzheimer’s disease and dementia. J. Neurol. Neurosurg. Psychiatry 1998, 64, 653–656. [Google Scholar] [CrossRef] [PubMed]
- Folch, J.; Lees, M.; Sloane-Stanley, G.H. A simple method for the isolation and purification of total lipides from animal tissues. J. Biol. Chem. 1957, 226, 497–509. [Google Scholar] [PubMed]


| Fatty Acid | Control | Moderate AD | |||||||||
|---|---|---|---|---|---|---|---|---|---|---|---|
| Name | Lipid No. | RT | Mass | Mean ± SD | Q1 | Median | Q3 | Mean ± SD | Q1 | Median | Q3 |
| Docosahexanoic Acid | C22:6Δ4,7,10,13,16,19 | 45.01 | 342.51 | 24.77 ± 6.695 | 18.830 | 24.640 | 30.200 | 30.184 ± 4.215 | 27.600 | 28.540 | 33.130 |
| Nervonic Acid | C24:1Δ15 | 40.68 | 380.65 | 3.925 ± 1.527 | 3.331 | 3.686 | 5.014 | 5.517 ± 2.549 | 4.795 | 5.706 | 7.311 |
| Lignoceric Acid | C24:0 | 39.55 | 382.66 | 0.767 ± 0.317 | 0.657 | 0.756 | 0.851 | 1.187 ± 0.256 | 1.003 | 1.126 | 1.404 |
| cis-13,16-Docosadienoic acid | C22:2Δ13,16 | 38.89 | 350.58 | 0.103 ± 0.052 | 0.065 | 0.091 | 0.125 | 0.146 ± 0.044 | 0.122 | 0.156 | 0.178 |
| Arachidonic acid | C20:4Δ5,8,11,14 | 38.08 | 318.49 | 10.81 ± 3.309 | 8.280 | 10.270 | 13.600 | 14.04 ± 1.244 | 12.950 | 14.480 | 15.050 |
| Tricosanoic Acid | C23:0 | 37.42 | 368.64 | 0.165 ± 0.140 | 0.024 | 0.138 | 0.248 | 0.218 ± 0.207 | 0.014 | 0.285 | 0.417 |
| cis-11,14,17-Eicosatrienoic acid | C20:3Δ11,14,17 | 28.93 | 320.51 | 0.565 ± 0.292 | 0.322 | 0.656 | 0.807 | 1.098 ± 0.242 | 0.937 | 1.139 | 1.294 |
| Erucic acid | C22:1Δ13 | 35.60 | 352.59 | 0.409 ± 0.188 | 0.260 | 0.427 | 0.514 | 0.627 ± 0.145 | 0.539 | 0.653 | 0.720 |
| cis-8,11,14-Eicosatreinoic acid | C20:3Δ8,11,14 | 37.05 | 320.51 | 1.010 ± 0.389 | 0.729 | 1.031 | 1.245 | 1.253 ± 0.523 | 1.262 | 1.295 | 1.519 |
| Behenic acid | C22:0 | 35.18 | 354.61 | 0.160 ± 0.085 | 0.095 | 0.177 | 0.211 | 0.273 ± 0.060 | 0.222 | 0.258 | 0.323 |
| cis-11,14-Eicosadienoic acid | C20:2 Δ11,14 | 35.18 | 308.50 | 0.549 ± 0.482 | 0.253 | 0.357 | 0.629 | 0.534 ± 0.411 | 0.242 | 0.449 | 0.648 |
| Heneicosanoic acid | C21:0 | 34.39 | 340.58 | 0.018 ± 0.007 | 0.011 | 0.020 | 0.024 | 0.026 ± 0.009 | 0.022 | 0.026 | 0.030 |
| Linolenic acid | C18:3Δ9,12,15 | 34.20 | 294.26 | 3.514 ± 1.315 | 2.469 | 4.067 | 4.613 | 5.401 ± 1.048 | 4.564 | 5.209 | 6.059 |
| cis-11-Eicosanoic acid | C20:1 Δ11 | 33.45 | 310.50 | 2.010 ± 0.803 | 1.539 | 2.016 | 2.597 | 2.616 ± 1.266 | 2.075 | 2.905 | 3.513 |
| Arachidic acid | C20:0 | 32.85 | 326.56 | 0.200 ± 0.070 | 0.165 | 0.216 | 0.247 | 0.292 ± 0.047 | 0.259 | 0.288 | 0.315 |
| Linoleic acid | c-C18:2Δ9,12 | 32.38 | 294.47 | 0.702 ± 0.478 | 0.386 | 0.777 | 1.012 | 0.941 ± 0.593 | 0.751 | 0.989 | 1.327 |
| Linolelaidic acid | t-C18:2Δ9,12 | 31.29 | 294.47 | 0.019 ± 0.009 | 0.012 | 0.016 | 0.024 | 0.023 ± 0.011 | 0.014 | 0.023 | 0.029 |
| Oleic acid | c-C18:1Δ9 | 30.82 | 297.49 | 22.92 ± 6.249 | 19.400 | 23.560 | 27.370 | 30.664 ± 4.219 | 27.490 | 29.960 | 33.460 |
| Stearic acid | C18:0 | 29.79 | 298.50 | 20.37 ± 5.037 | 15.730 | 21.290 | 23.950 | 25.985 ± 2.407 | 24.770 | 26.170 | 26.770 |
| cis-10-Heptadecanoic acid | C17:1Δ10 | 29.30 | 284.48 | 2.275 ± 0.918 | 1.720 | 2.144 | 2.537 | 3.054 ± 0.485 | 2.631 | 2.965 | 3.532 |
| Heptadecanoic acid | C17:0 | 28.21 | 283.48 | 0.308 ± 0.104 | 0.254 | 0.300 | 0.366 | 0.366 ± 0.035 | 0.344 | 0.372 | 0.396 |
| Palmitoleic acid | C16:1Δ9 | 27.77 | 270.45 | 0.842 ± 0.322 | 0.653 | 0.790 | 1.062 | 1.046 ± 0.221 | 0.928 | 1.113 | 1.186 |
| Palmitic acid | C16:0 | 26.60 | 270.45 | 18.09 ± 4.308 | 14.450 | 18.110 | 21.500 | 22.670 ± 1.848 | 21.080 | 22.680 | 23.820 |
| Pentadecanoic acid | C15:0 | 24.91 | 256.42 | 0.159 ± 0.061 | 0.118 | 0.165 | 0.184 | 0.174 ± 0.028 | 0.154 | 0.184 | 0.192 |
| Fatty Acid | Severe AD | DLB | p-Value | ||||||||||
|---|---|---|---|---|---|---|---|---|---|---|---|---|---|
| Name | Lipid No. | RT | Mass | Mean ± SD | Q1 | Median | Q3 | Mean ± SD | Q1 | Median | Q3 | KW | FDR |
| Docosahexanoic Acid | C22:6Δ4,7,10,13,16,19 | 45.01 | 342.51 | 27.694 ± 9.311 | 20.090 | 26.970 | 34.740 | 32.329 ± 9.102 | 26.010 | 31.960 | 36.140 | 0.0328 | 0.0525 |
| Nervonic Acid | C24:1Δ15 | 40.68 | 380.65 | 4.352 ± 2.385 | 2.747 | 4.633 | 5.775 | 5.348 ± 2.763 | 4.417 | 5.547 | 6.530 | DLB | 0.0251 |
| Lignoceric Acid | C24:0 | 39.55 | 382.66 | 0.942 ± 0.442 | 0.576 | 0.924 | 1.125 | 1.023 ± 2.384 | 0.846 | 0.990 | 1.243 | 0.0009 | 0.0027 |
| cis-13,16-Docosadienoic acid | C22:2Δ13,16 | 38.89 | 350.58 | 0.116 ± 0.059 | 0.084 | 0.102 | 0.140 | 0.144 ± 0.049 | 0.114 | 0.129 | 0.161 | 0.0014 | 0.0034 |
| Arachidonic acid | C20:4Δ5,8,11,14 | 38.08 | 318.49 | 10.83 ± 4.169 | 7.929 | 10.660 | 13.790 | 14.43 ± 5.755 | 12.040 | 14.930 | 16.070 | 0.0008 | 0.0027 |
| Tricosanoic Acid | C23:0 | 37.42 | 368.64 | 0.219 ± 0.154 | 0.139 | 0.209 | 0.336 | 0.238 ± 3.177 | 0.011 | 0.292 | 0.391 | 0.5651 | 0.5651 |
| cis-11,14,17-Eicosatrienoic acid | C20:3Δ11,14,17 | 28.93 | 320.51 | 0.684 ± 0.508 | 0.299 | 0.527 | 1.008 | 1.105 ± 7.267 | 0.942 | 1.042 | 1.267 | 0.0001 | 0.0006 |
| Erucic acid | C22:1Δ13 | 35.60 | 352.59 | 0.421 ± 0.217 | 0.276 | 0.429 | 0.559 | 0.633 ± 5.170 | 0.517 | 0.636 | 0.707 | 0.0001 | 0.0006 |
| cis-8,11,14-eicosatreinoic acid | C20:3Δ8,11,14 | 37.05 | 320.51 | 1.193 ± 0.371 | 0.990 | 1.227 | 1.419 | 1.211 ± 4.636 | 0.969 | 1.176 | 1.531 | 0.0535 | 0.0755 |
| Behenic acid | C22:0 | 35.18 | 354.61 | 0.202 ± 0.098 | 0.142 | 0.207 | 0.266 | 0.258 ± 8.088 | 0.213 | 0.255 | 0.325 | 0.0001 | 0.0006 |
| cis-11,14-eicosadienoic acid | C20:2 Δ11,14 | 35.18 | 308.50 | 0.687 ± 0.629 | 0.222 | 0.429 | 1.083 | 0.856 ± 9.508 | 0.435 | 0.859 | 1.369 | 0.2064 | 0.2431 |
| Heneicosanoic acid | C21:0 | 34.39 | 340.58 | 0.021 ± 0.008 | 0.015 | 0.021 | 0.026 | 0.023 ± 8.009 | 0.017 | 0.024 | 0.028 | 0.0312 | 0.0525 |
| Linolenic acid | C18:3Δ9,12,15 | 34.20 | 294.26 | 3.954 ± 1.650 | 2.722 | 3.979 | 4.928 | 5.195 ± 9.834 | 4.679 | 5.519 | 5.528 | 0.0001 | 0.0006 |
| cis-11-Eicosanoic acid | C20:1 Δ11 | 33.45 | 310.50 | 1.842 ± 1.316 | 0.377 | 1.975 | 2.640 | 2.137 ± 2.357 | 1.123 | 2.669 | 2.845 | 0.1439 | 0.1919 |
| Arachidic acid | C20:0 | 32.85 | 326.56 | 0.224 ± 0.079 | 0.169 | 0.239 | 0.266 | 0.250 ± 9.088 | 0.216 | 0.257 | 0.287 | 0.0005 | 0.0020 |
| Linoleic acid | c-C18:2Δ9,12 | 32.38 | 294.47 | 0.641 ± 0.576 | 0.016 | 0.743 | 0.988 | 0.720 ± 9.747 | 0.020 | 0.730 | 1.283 | 0.3740 | 0.3903 |
| Linolelaidic acid | t-C18:2Δ9,12 | 31.29 | 294.47 | 0.017 ± 0.010 | 0.011 | 0.041 | 0.019 | 0.021 ± 1.009 | 0.013 | 0.020 | 0.028 | 0.2111 | 0.2413 |
| Oleic acid | c-C18:1Δ9 | 30.82 | 297.49 | 26.416 ± 8.524 | 21.350 | 28.260 | 32.480 | 30.818 ± 8.451 | 28.110 | 29.720 | 31.870 | 0.0003 | 0.0014 |
| Stearic acid | C18:0 | 29.79 | 298.50 | 22.679 ± 5.695 | 17.820 | 23.630 | 25.710 | 25.708 ± 6.692 | 23.420 | 24.240 | 25.580 | 0.0011 | 0.0029 |
| cis-10-Heptadecanoic acid | C17:1Δ10 | 29.30 | 284.48 | 2.932 ± 1.470 | 1.874 | 2.621 | 3.898 | 3.177 ± 5.925 | 2.671 | 2.826 | 3.444 | 0.0021 | 0.0046 |
| Heptadecanoic acid | C17:0 | 28.21 | 283.48 | 0.320 ± 0.094 | 0.248 | 0.321 | 0.397 | 0.375 ± 5.073 | 0.333 | 0.366 | 0.386 | 0.0448 | 0.0672 |
| Palmitoleic acid | C16:1Δ9 | 27.77 | 270.45 | 0.855 ± 0.409 | 0.647 | 0.895 | 1.098 | 0.760 ± 1.489 | 0.289 | 0.722 | 1.282 | 0.1736 | 0.2193 |
| Palmitic acid | C16:0 | 26.60 | 270.45 | 20.953 ± 5.023 | 17.150 | 21.220 | 23.920 | 22.929 ± 7.392 | 20.150 | 22.230 | 24.660 | 0.0036 | 0.0072 |
| Pentadecanoic acid | C15:0 | 24.91 | 256.42 | 0.165 ± 0.051 | 0.133 | 0.163 | 0.199 | 0.187 ± 3.048 | 0.152 | 0.173 | 0.223 | 0.2345 | 0.2558 |
| Fatty Acid | p-Values | |||||
|---|---|---|---|---|---|---|
| Control vs. Moderate AD | Control vs. Severe AD | Control vs. DLB | Moderate AD vs. Severe AD | Moderate AD vs. DLB | Severe AD vs. DLB | |
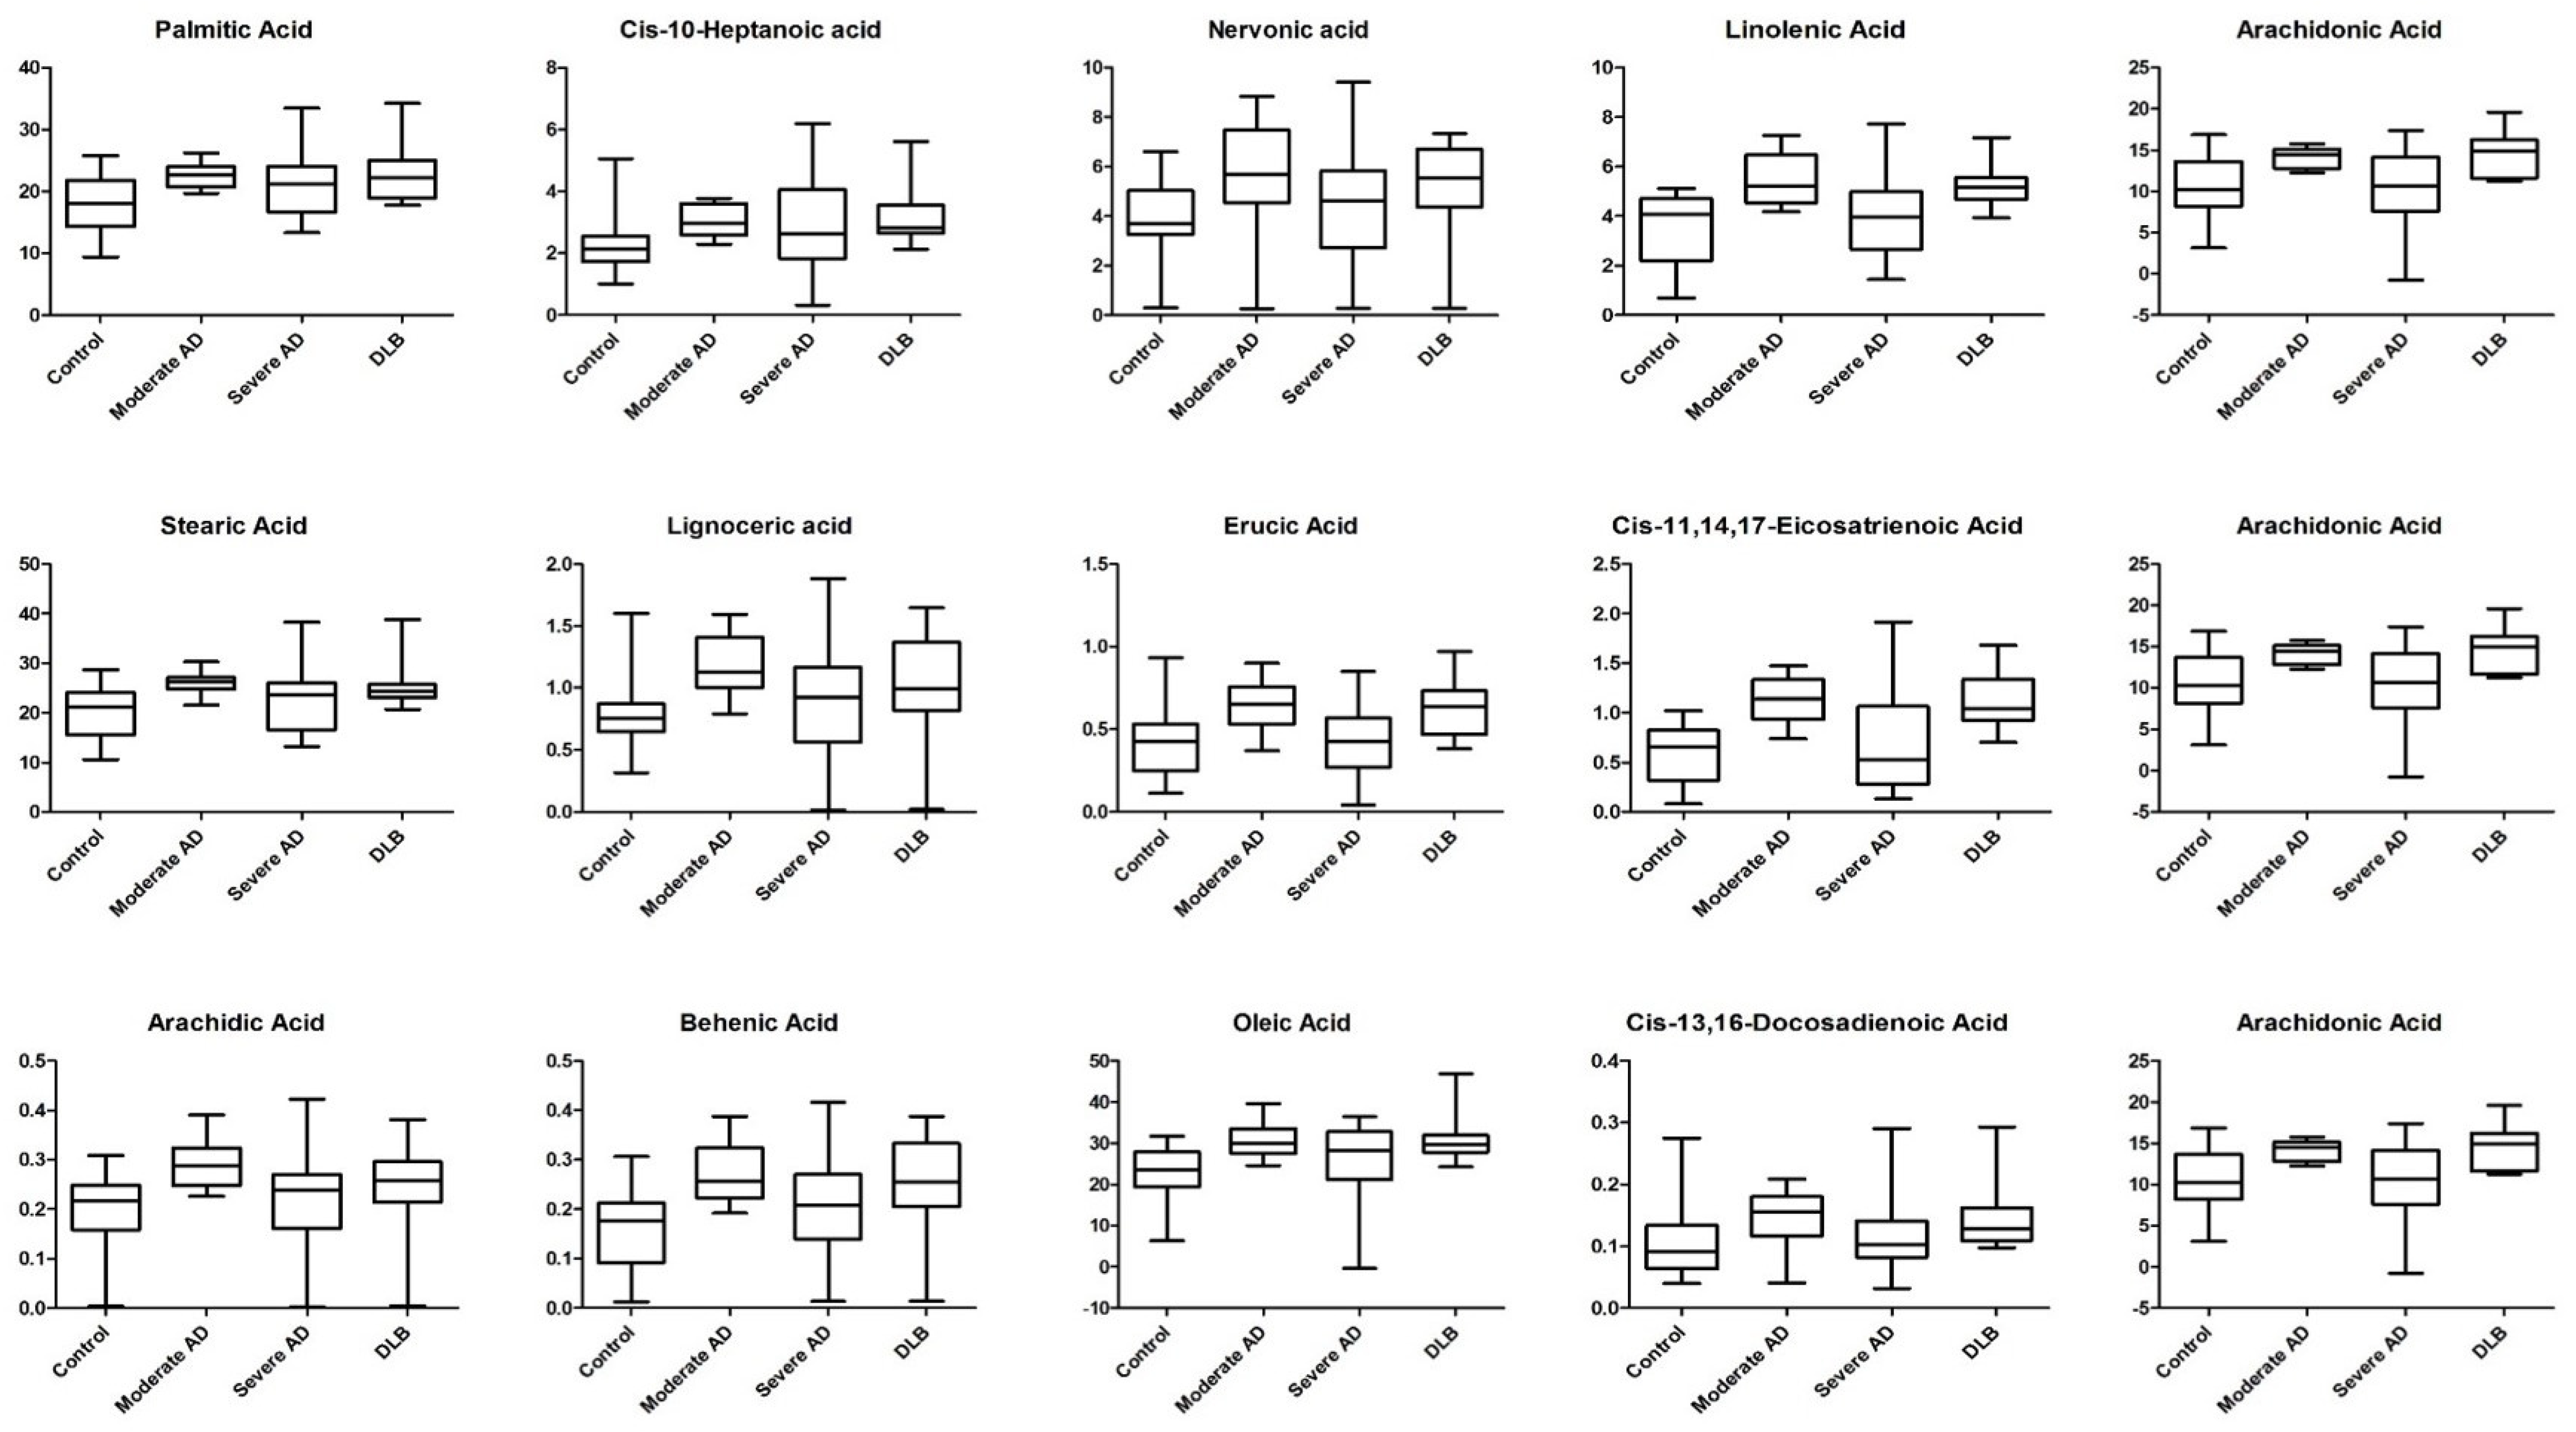
| Nervonic acid (mono) | 0.0453 | 0.7397 | 0.0453 | 0.1811 | 0.9578 | 0.1811 |
| Erucic acid (mono) | 0.0011 | 1 | 0.0011 | 0.0022 | 1 | 0.0022 |
| Oleic acid (mono) | 0.0006 | 0.0337 | 0.0011 | 0.1912 | 0.8664 | 0.1917 |
| cis-10-Heptanoic acid (mono) | 0.0049 | 0.0899 | 0.0068 | 0.3476 | 0.8887 | 0.3476 |
| cis-13,16-Docosadienoic acid (poly) | 0.0036 | 0.5416 | 0.0104 | 0.0331 | 0.7307 | 0.0707 |
| Arachidonic acid (poly) | 0.0094 | 1 | 0.0094 | 0.0128 | 1 | 0.0128 |
| cis-11,14,17-Eicosatrienoic acid (poly) | 0.0001 | 0.4203 | 0.0001 | 0.0004 | 0.9930 | 0.0004 |
| Linolenic acid (poly) | 0.0003 | 0.6126 | 0.0004 | 0.0029 | 0.8786 | 0.0039 |
| Lignoceric acid (saturated) | 0.0004 | 0.1263 | 0.0333 | 0.0514 | 0.4317 | 0.4317 |
| Behenic acid (saturated) | 0.0002 | 0.1151 | 0.0006 | 0.0186 | 0.7104 | 0.0455 |
| Arachidic acid (saturated) | 0.0001 | 0.3774 | 0.0783 | 0.0046 | 0.2069 | 0.3774 |
| Stearic acid (saturated) | 0.0006 | 0.2969 | 0.0344 | 0.0344 | 0.3416 | 0.3416 |
| Palmitic acid (saturated) | 0.0065 | 0.0902 | 0.0143 | 0.4114 | 0.7813 | 0.4832 |
| Number of FAs significantly different | 13 | 1 | 12 | 9 | 0 | 5 |
© 2018 by the authors. Licensee MDPI, Basel, Switzerland. This article is an open access article distributed under the terms and conditions of the Creative Commons Attribution (CC BY) license (http://creativecommons.org/licenses/by/4.0/).
Share and Cite
Nasaruddin, M.L.; Pan, X.; McGuinness, B.; Passmore, P.; Kehoe, P.G.; Hölscher, C.; Graham, S.F.; Green, B.D. Evidence That Parietal Lobe Fatty Acids May Be More Profoundly Affected in Moderate Alzheimer’s Disease (AD) Pathology Than in Severe AD Pathology. Metabolites 2018, 8, 69. https://doi.org/10.3390/metabo8040069
Nasaruddin ML, Pan X, McGuinness B, Passmore P, Kehoe PG, Hölscher C, Graham SF, Green BD. Evidence That Parietal Lobe Fatty Acids May Be More Profoundly Affected in Moderate Alzheimer’s Disease (AD) Pathology Than in Severe AD Pathology. Metabolites. 2018; 8(4):69. https://doi.org/10.3390/metabo8040069
Chicago/Turabian StyleNasaruddin, Muhammad L., Xiaobei Pan, Bernadette McGuinness, Peter Passmore, Patrick G. Kehoe, Christian Hölscher, Stewart F. Graham, and Brian D. Green. 2018. "Evidence That Parietal Lobe Fatty Acids May Be More Profoundly Affected in Moderate Alzheimer’s Disease (AD) Pathology Than in Severe AD Pathology" Metabolites 8, no. 4: 69. https://doi.org/10.3390/metabo8040069