Untargeted Metabolic Profiling Cell-Based Approach of Pulmonary Artery Smooth Muscle Cells in Response to High Glucose and the Effect of the Antioxidant Vitamins D and E


Abstract
:1. Introduction
Antioxidants
2. Results
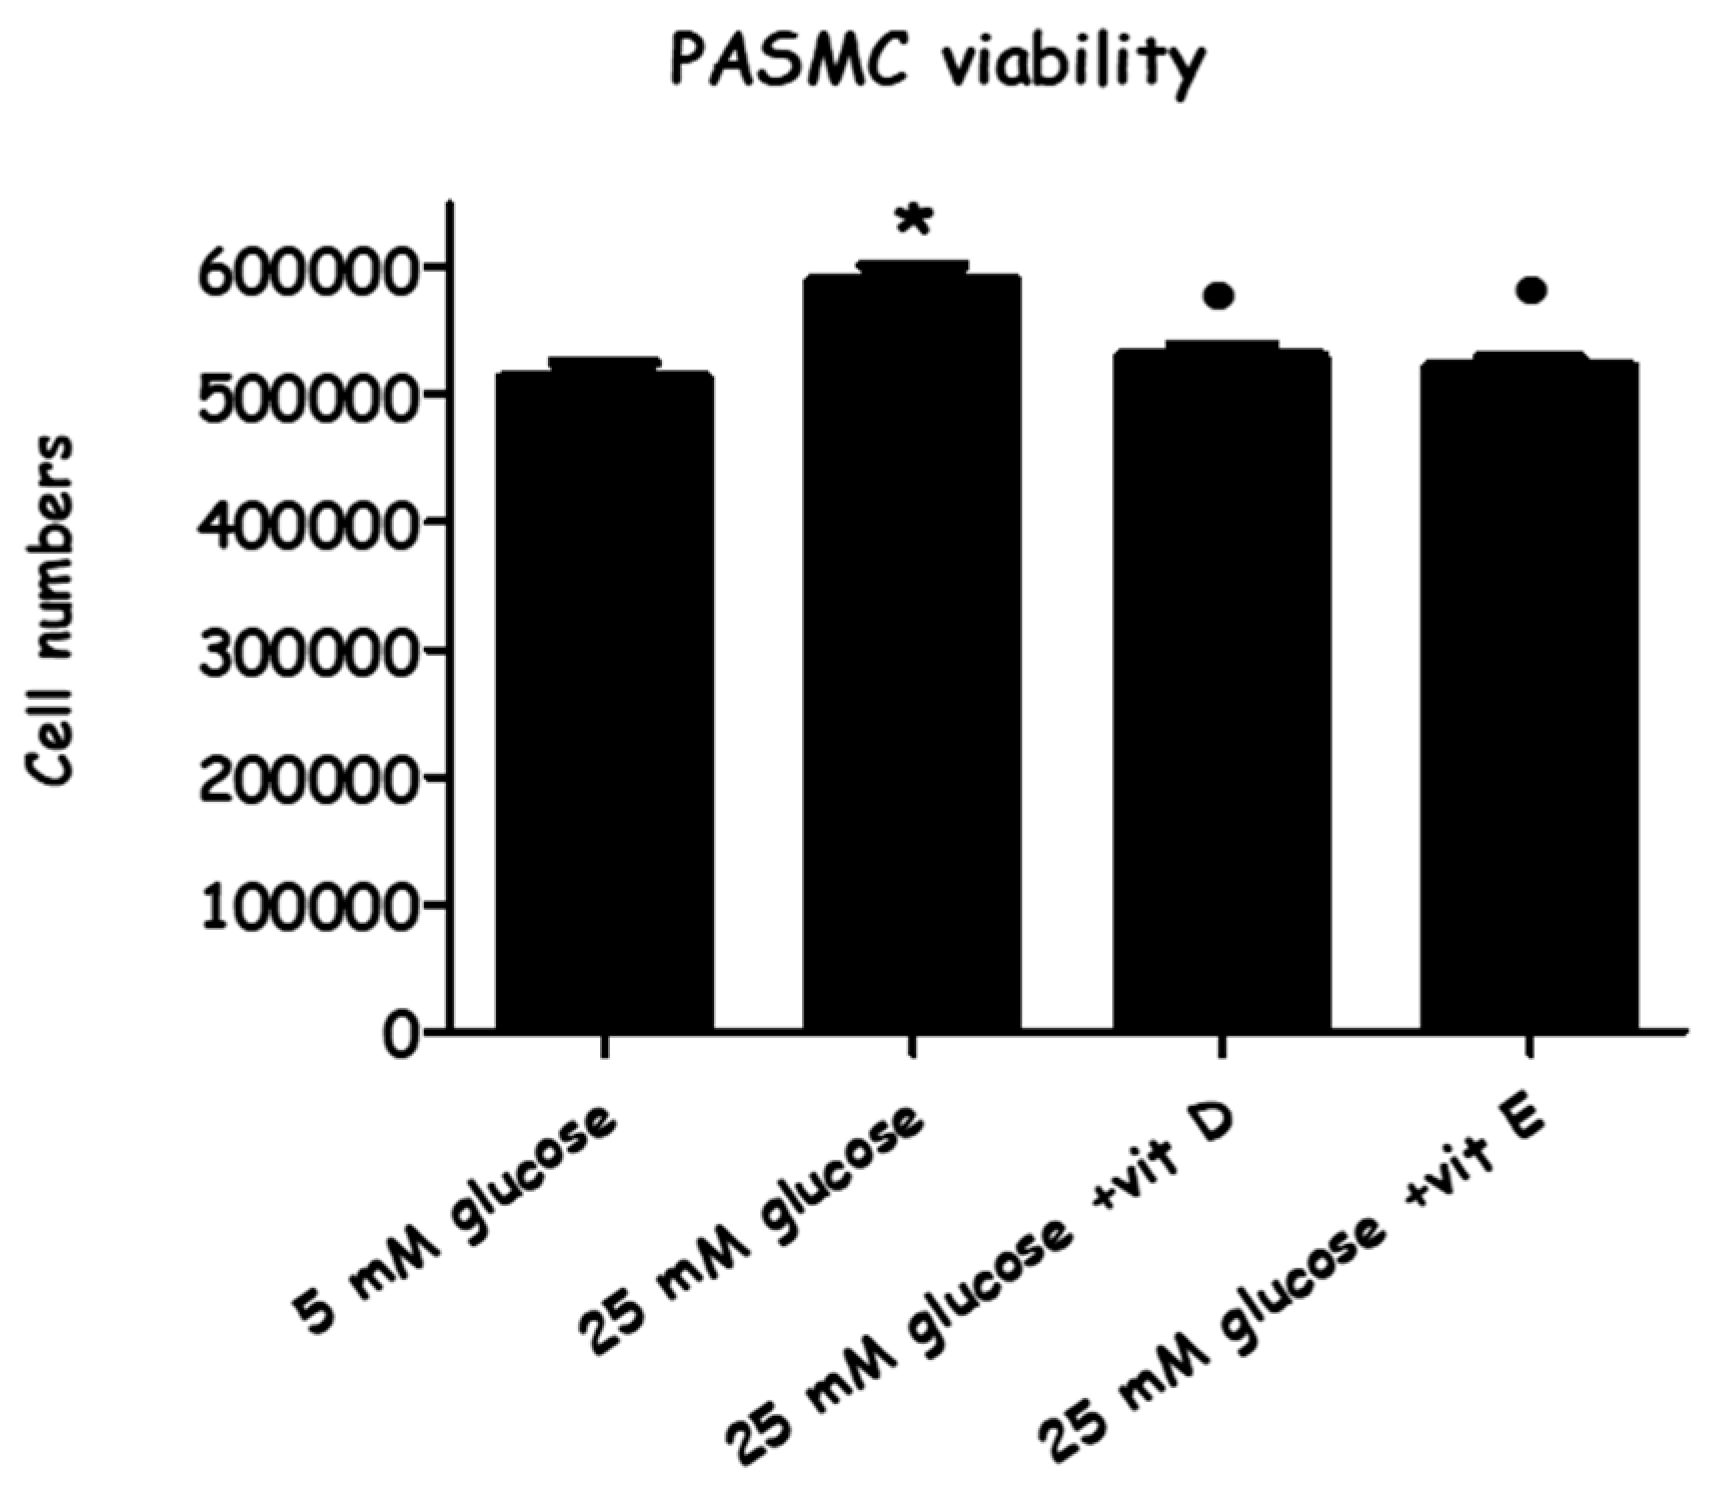
2.1. Effect of High-Glucose Media Alone, with Vitamin D, or with Vitamin E, on Cell Viability
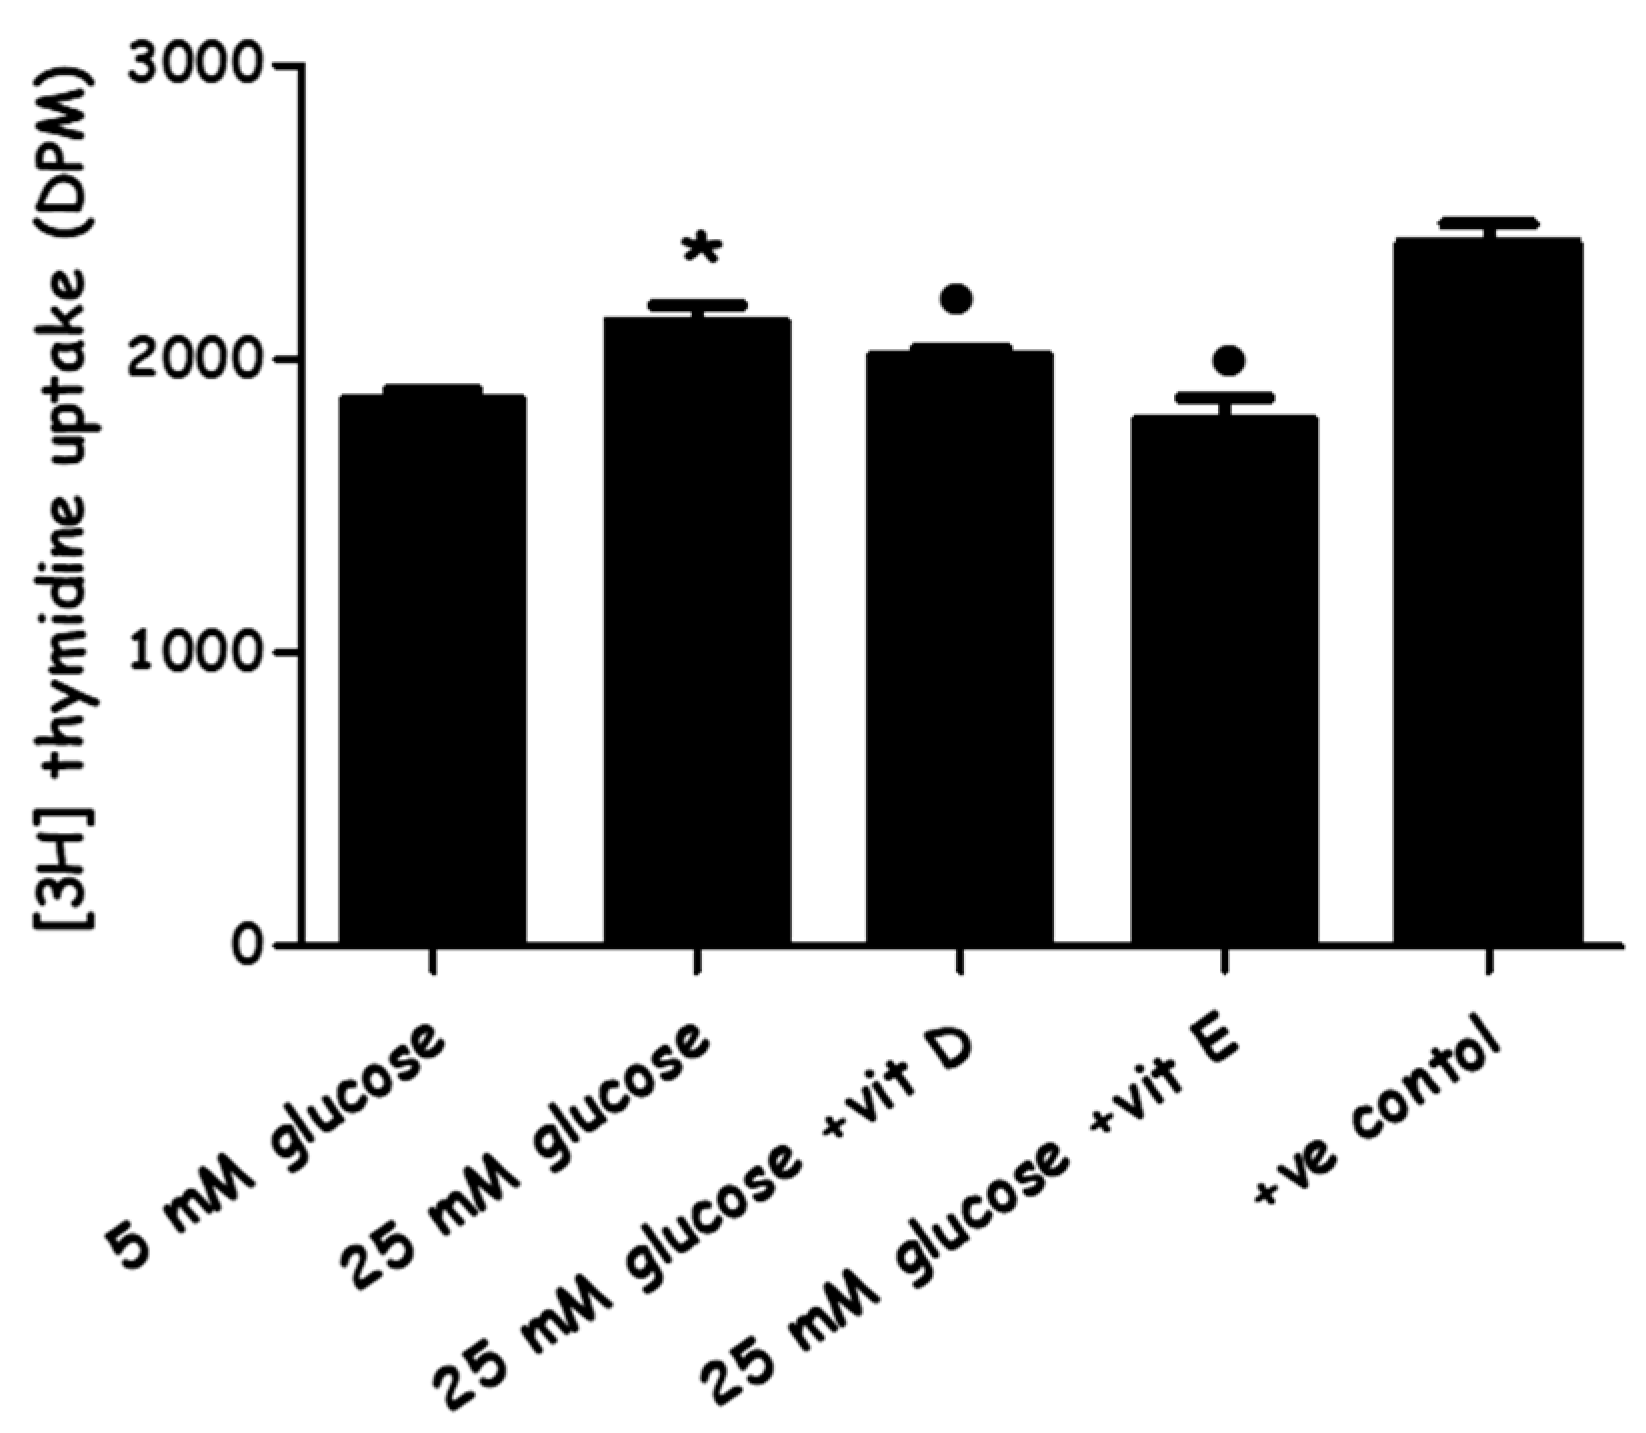
2.2. Effect of High-Glucose Media Alone, with Vitamin D, or with Vitamin E on PASMCs’ Proliferation
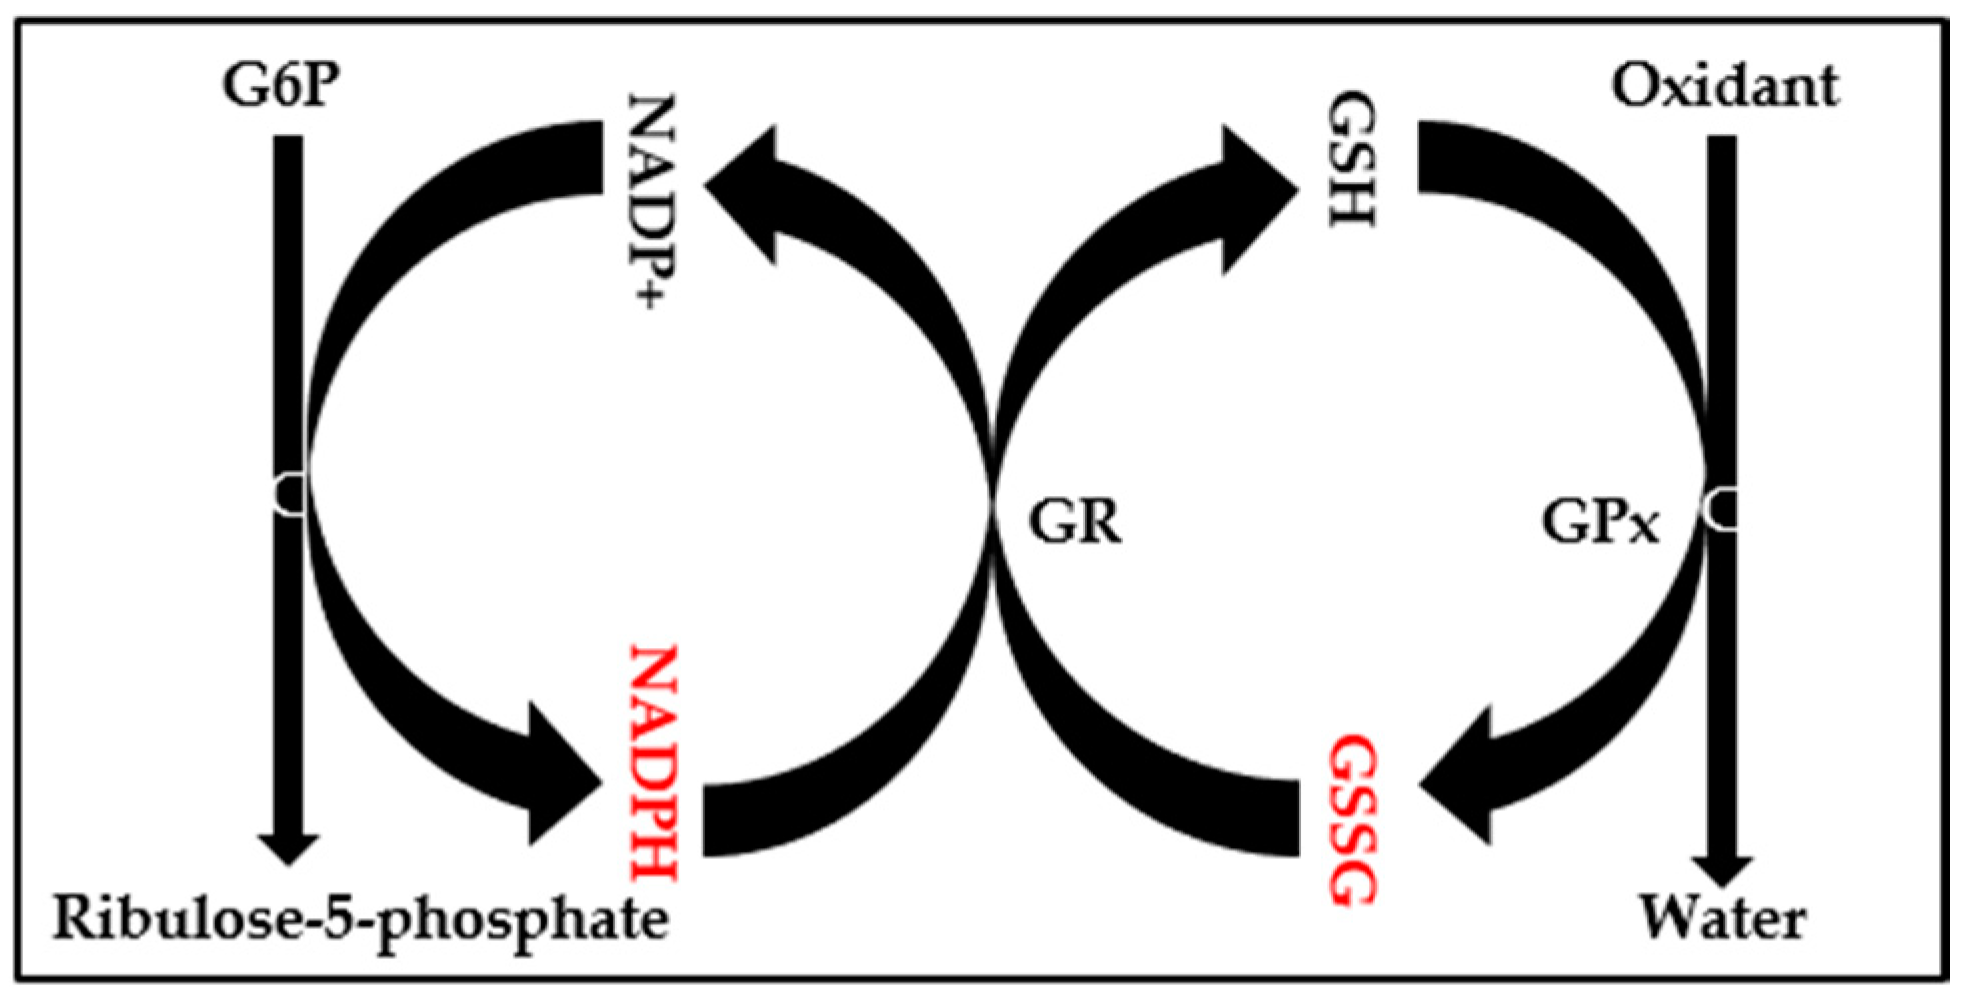
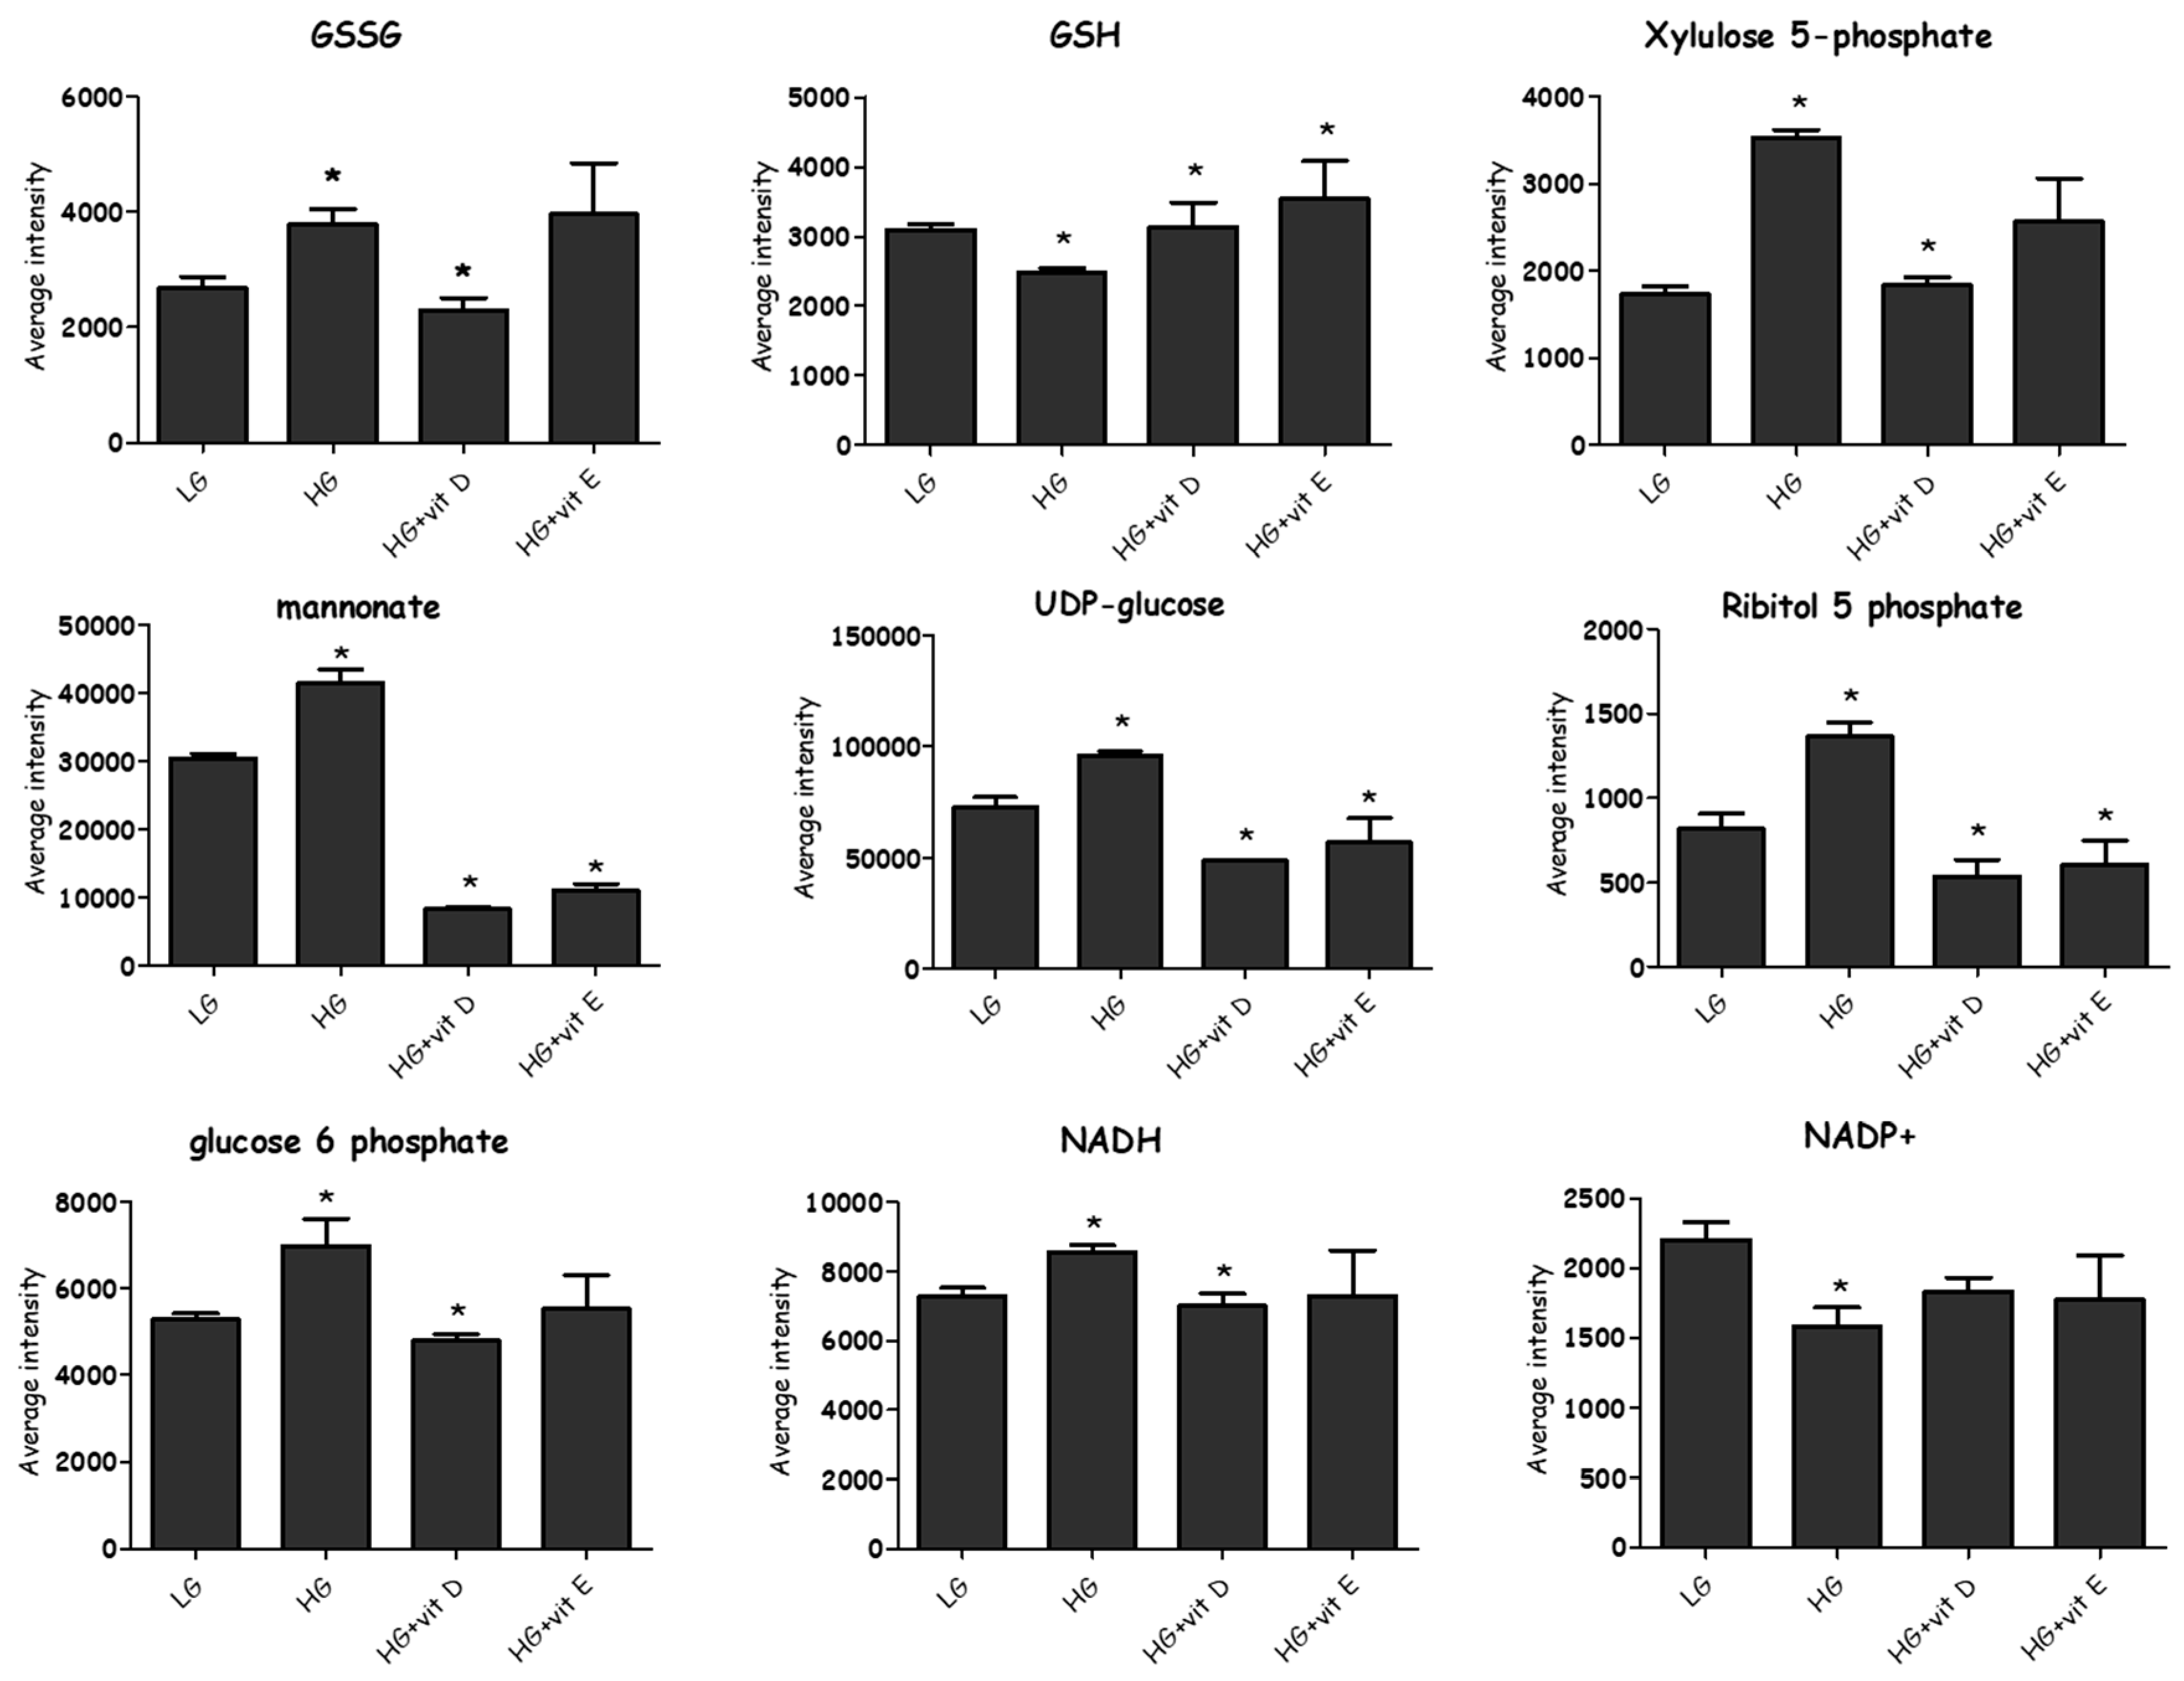
2.3. Evaluation of Oxidative Stress
2.4. Metabolomics
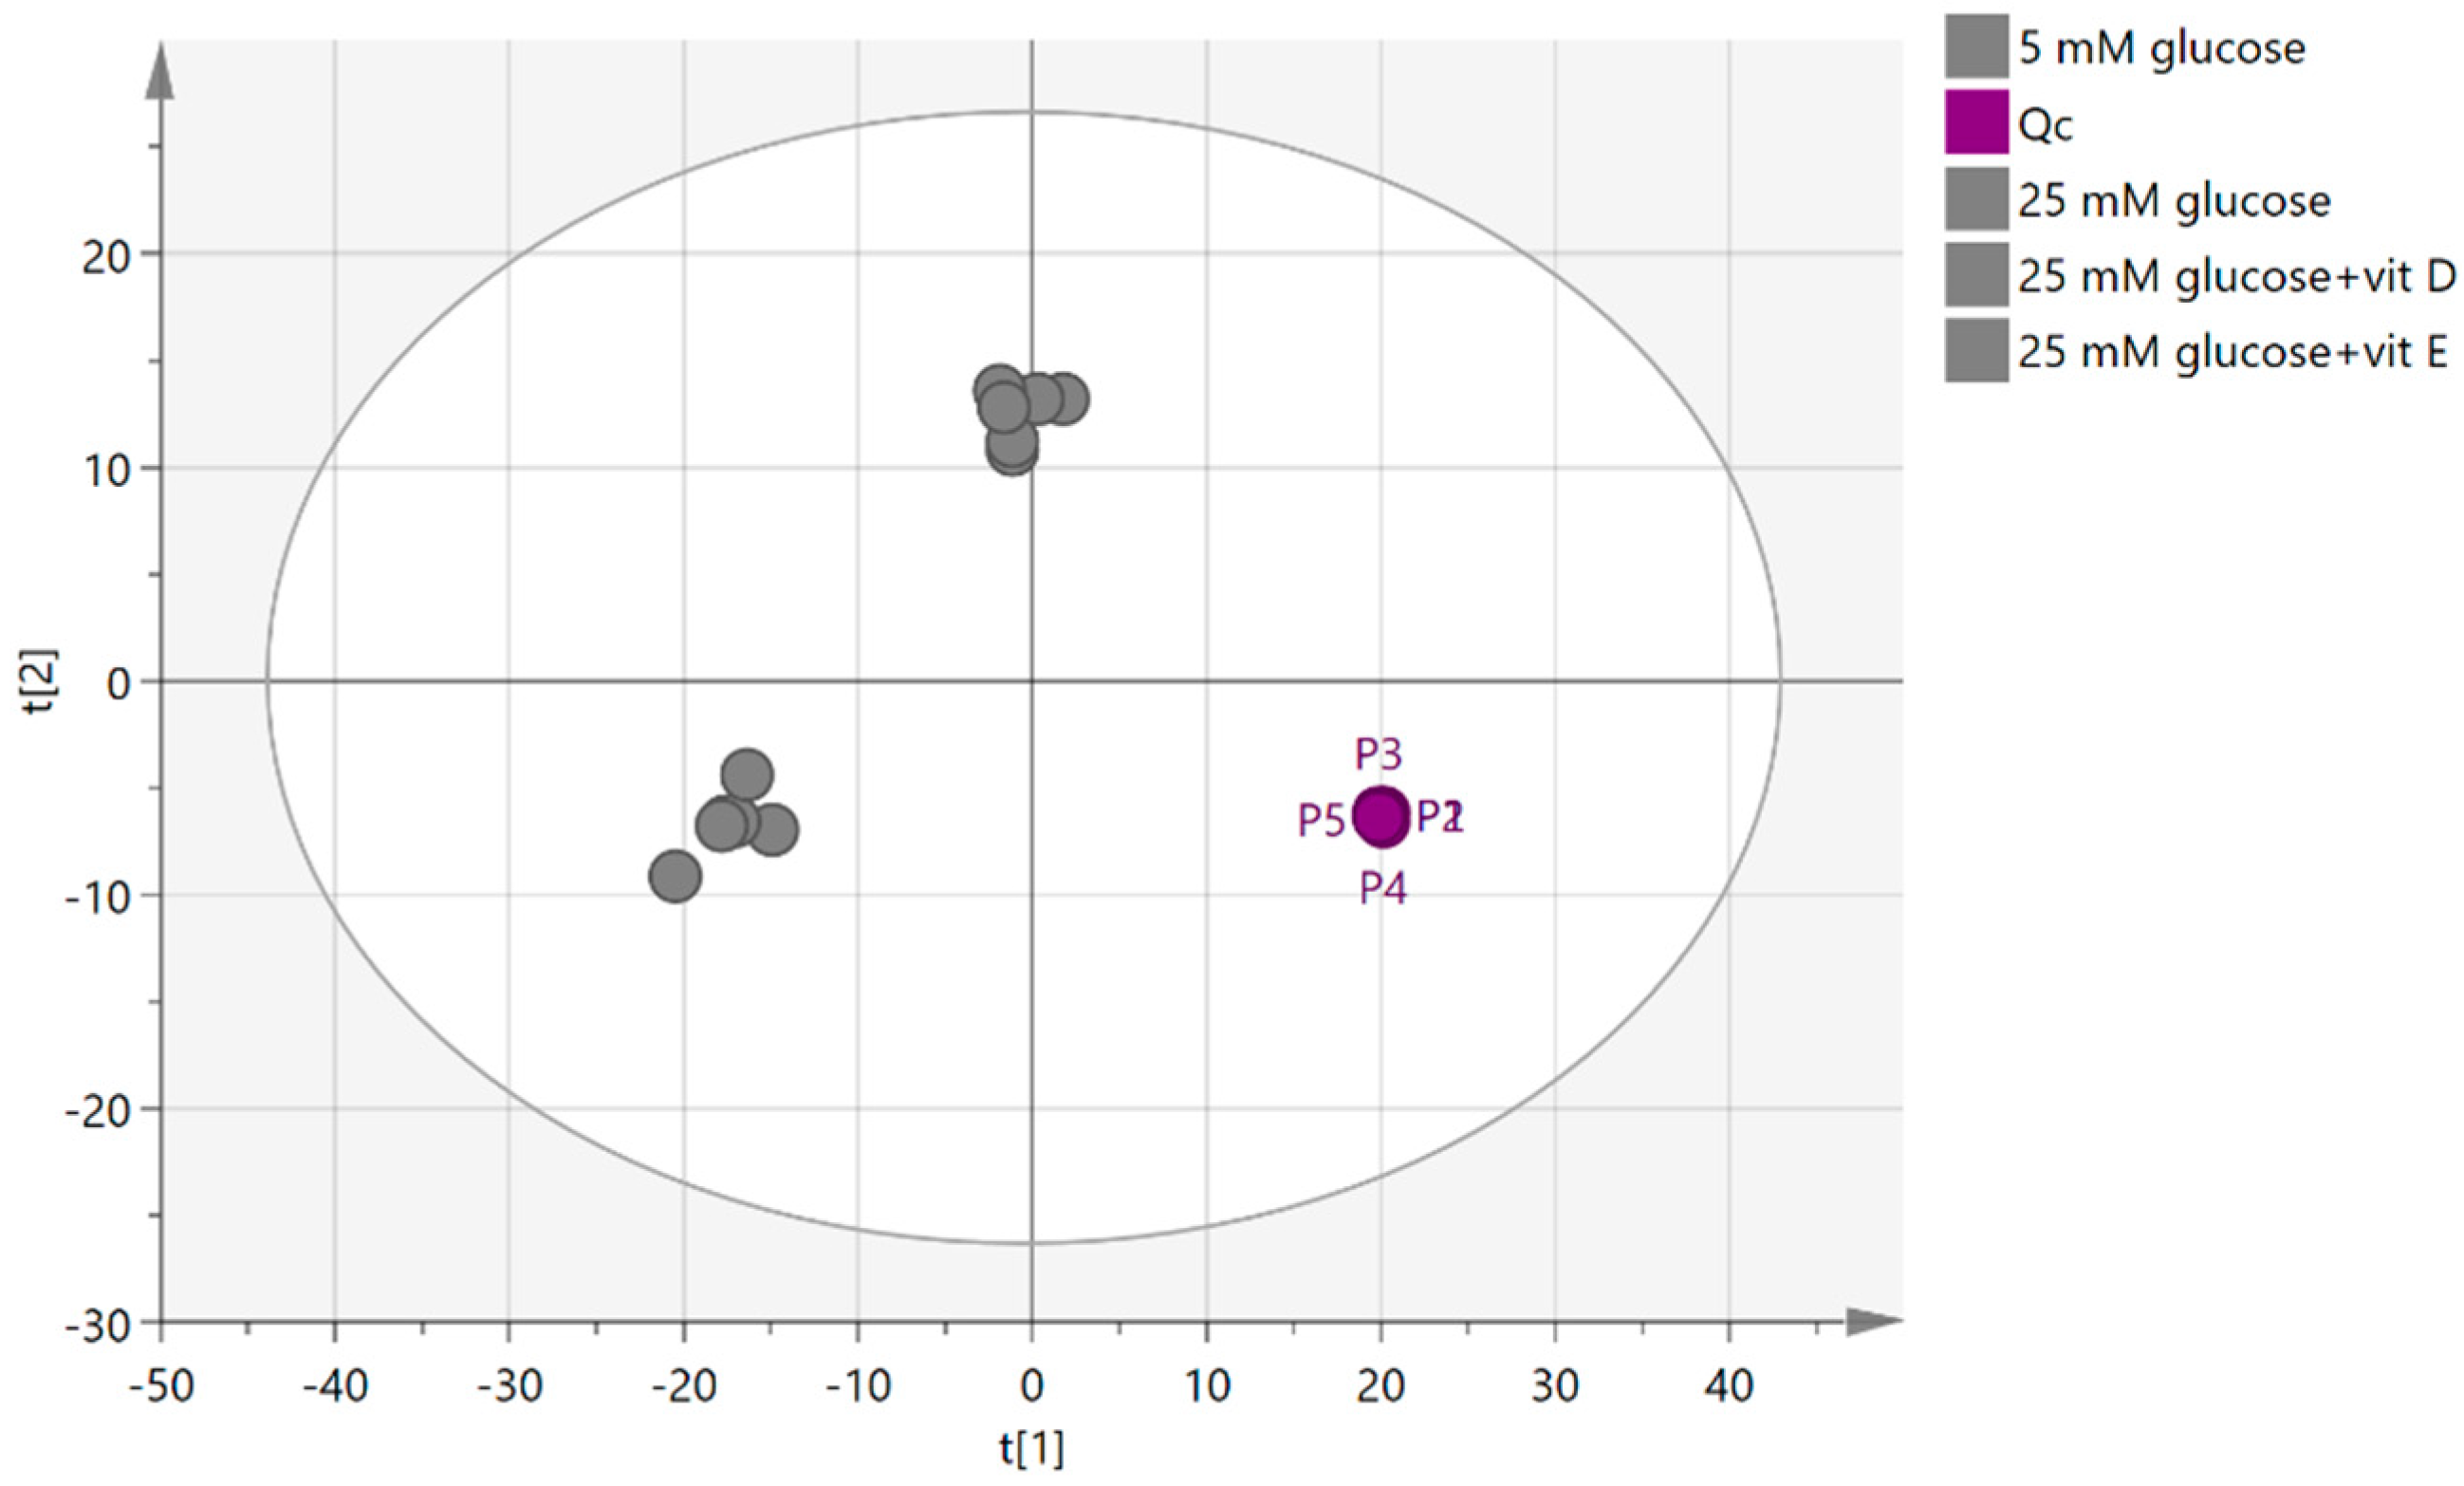
2.4.1. Quality Control Samples (Pooled)
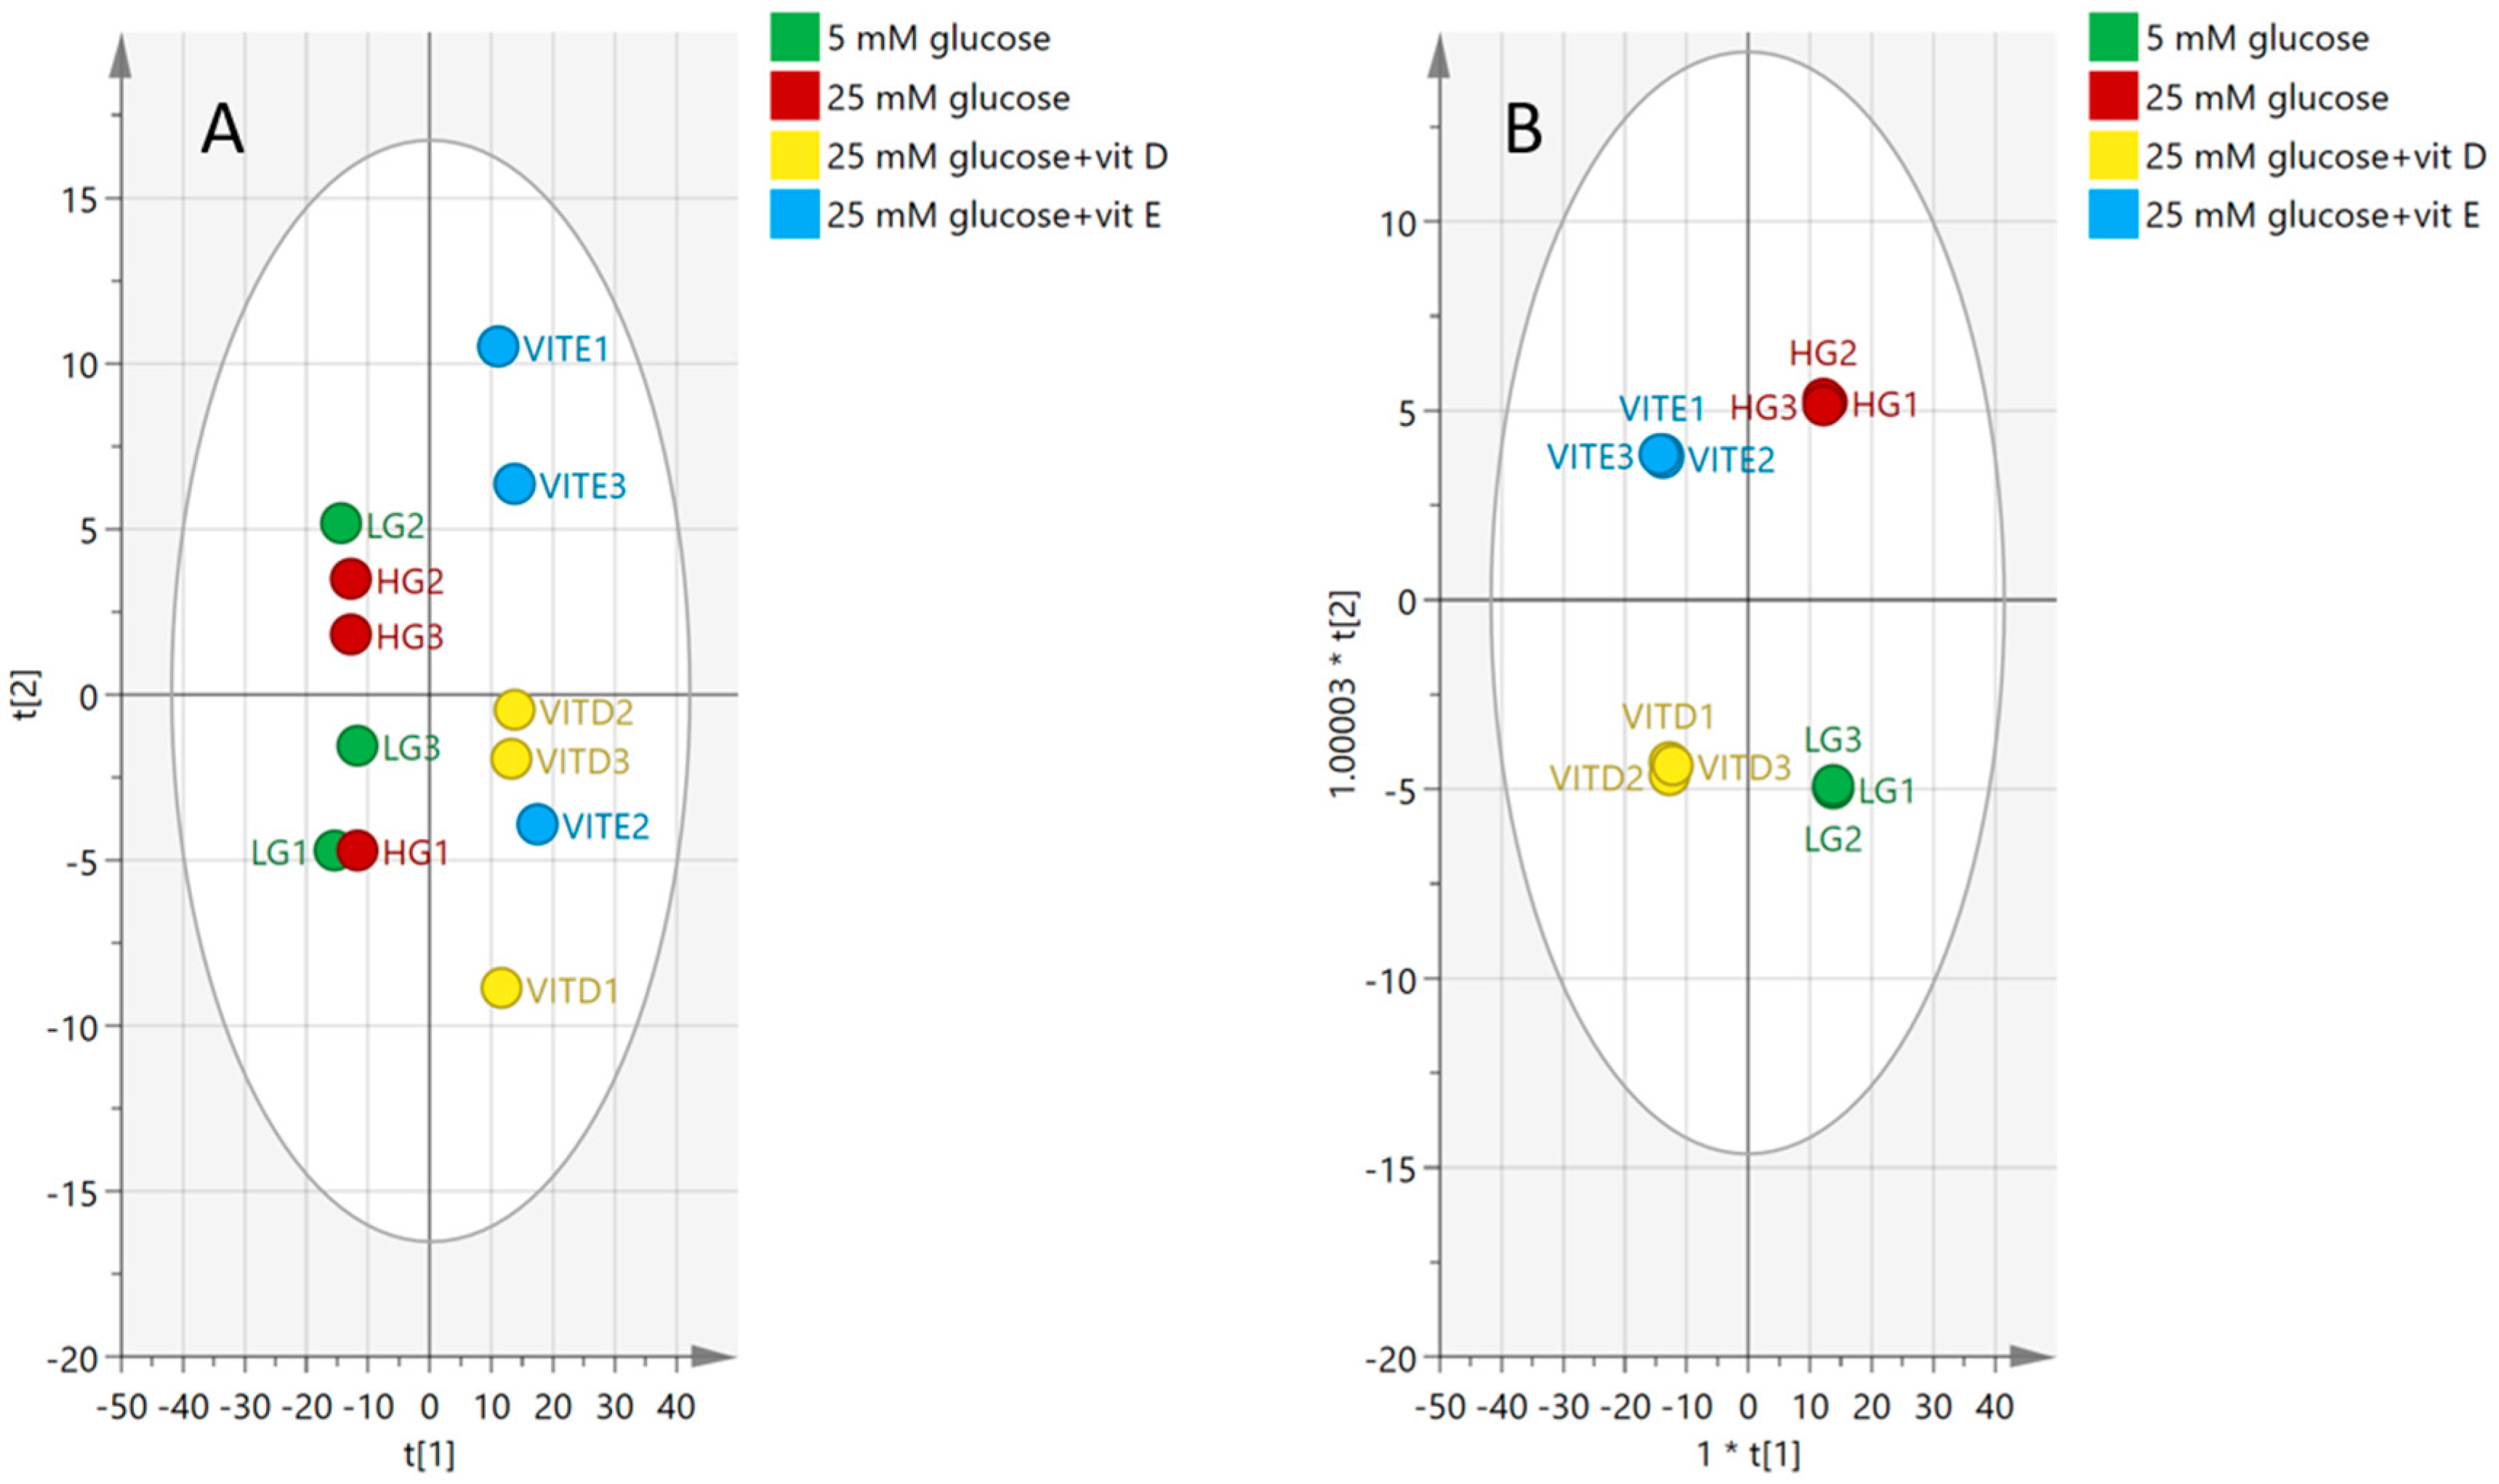
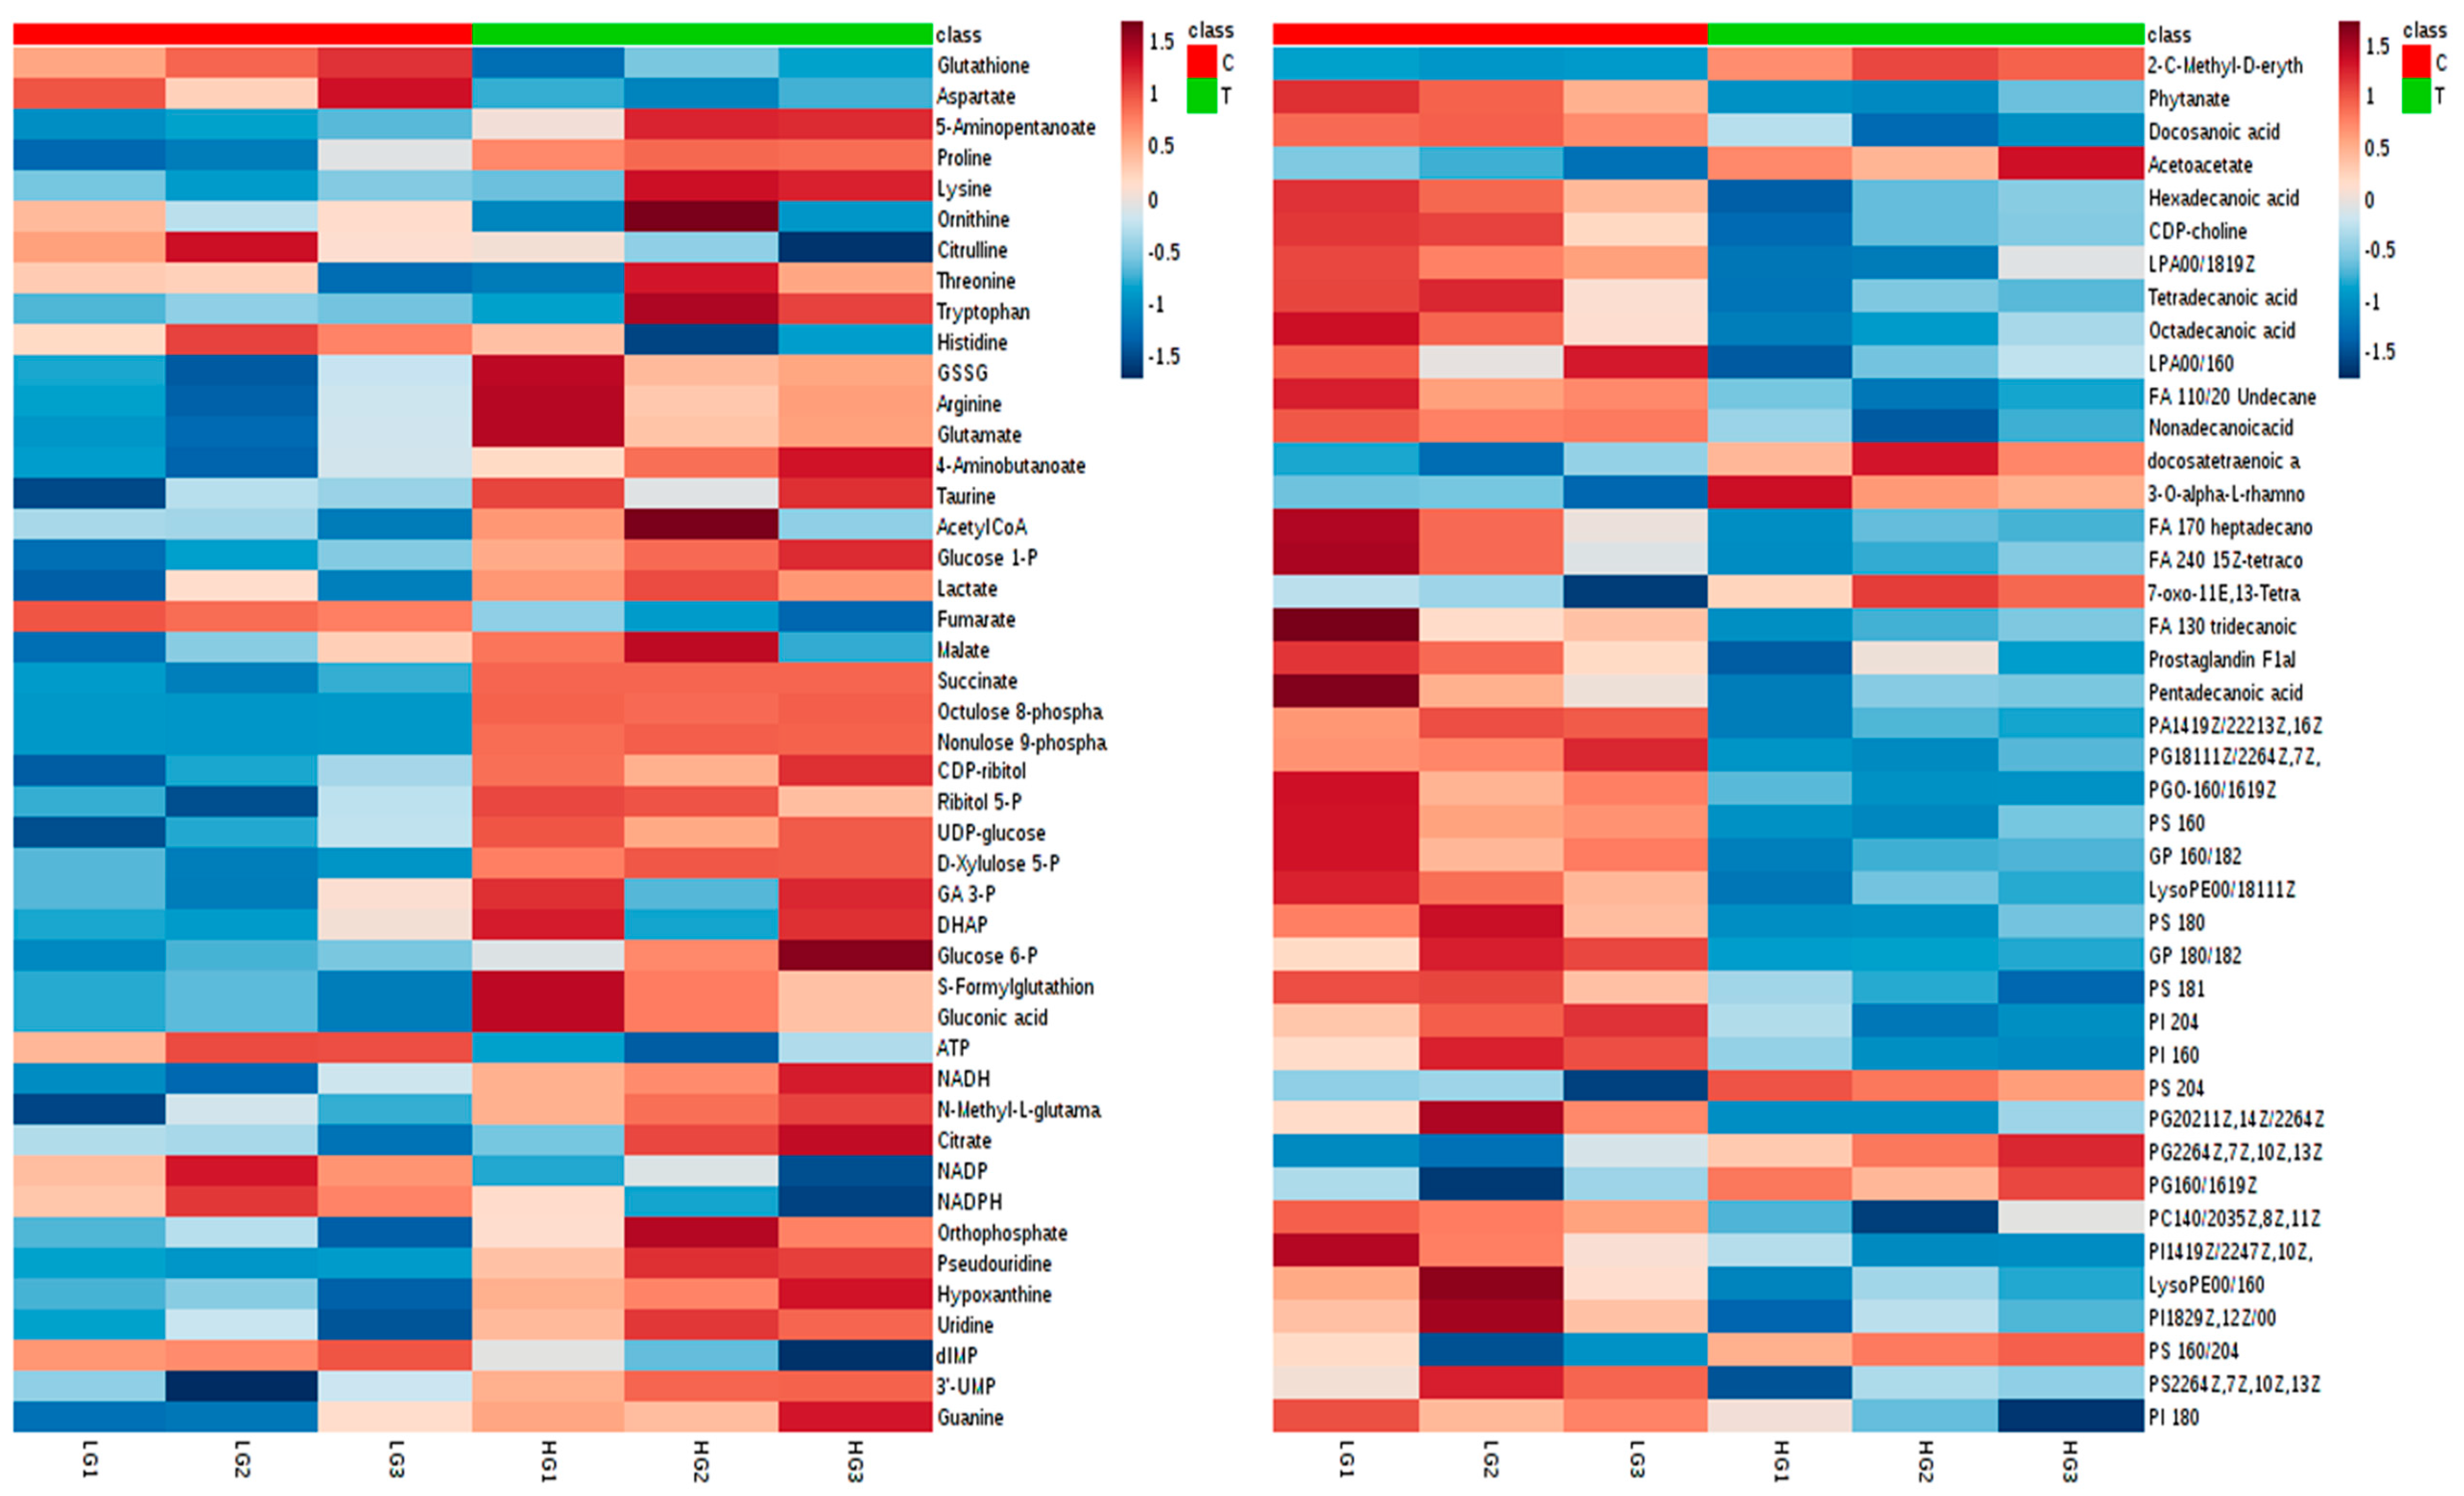
2.4.2. Visualization and Biomarkers Identification
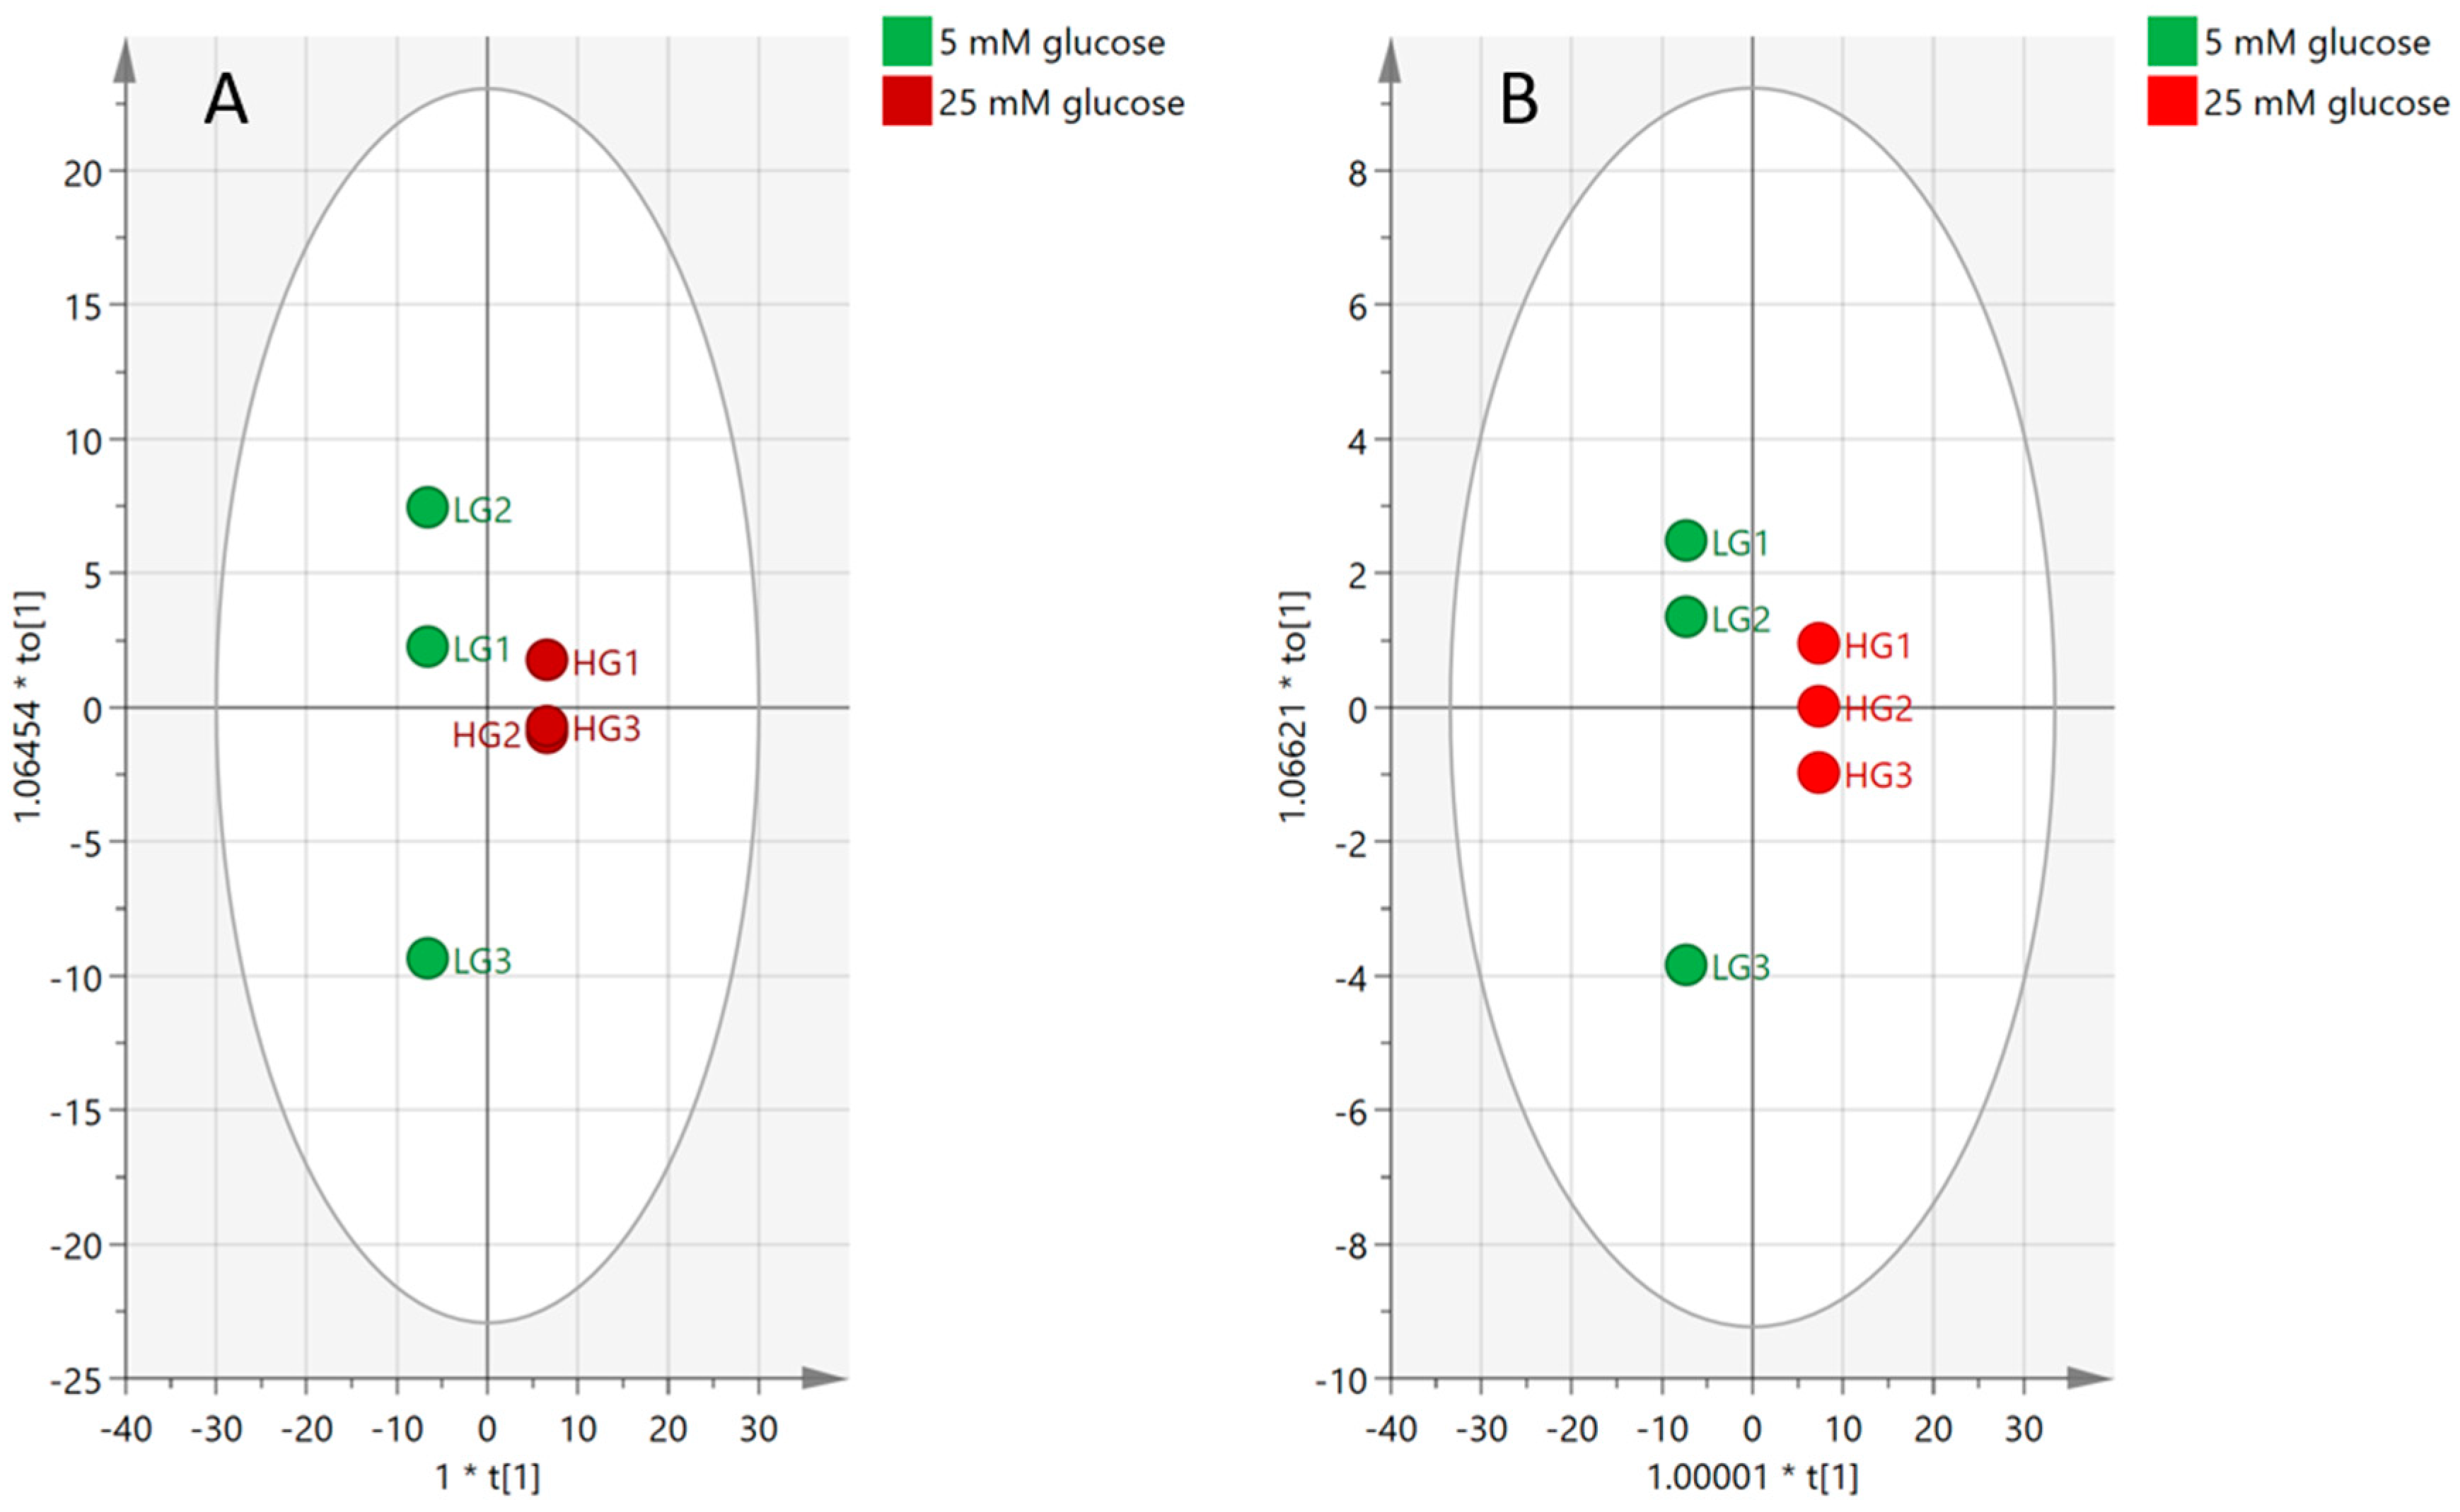
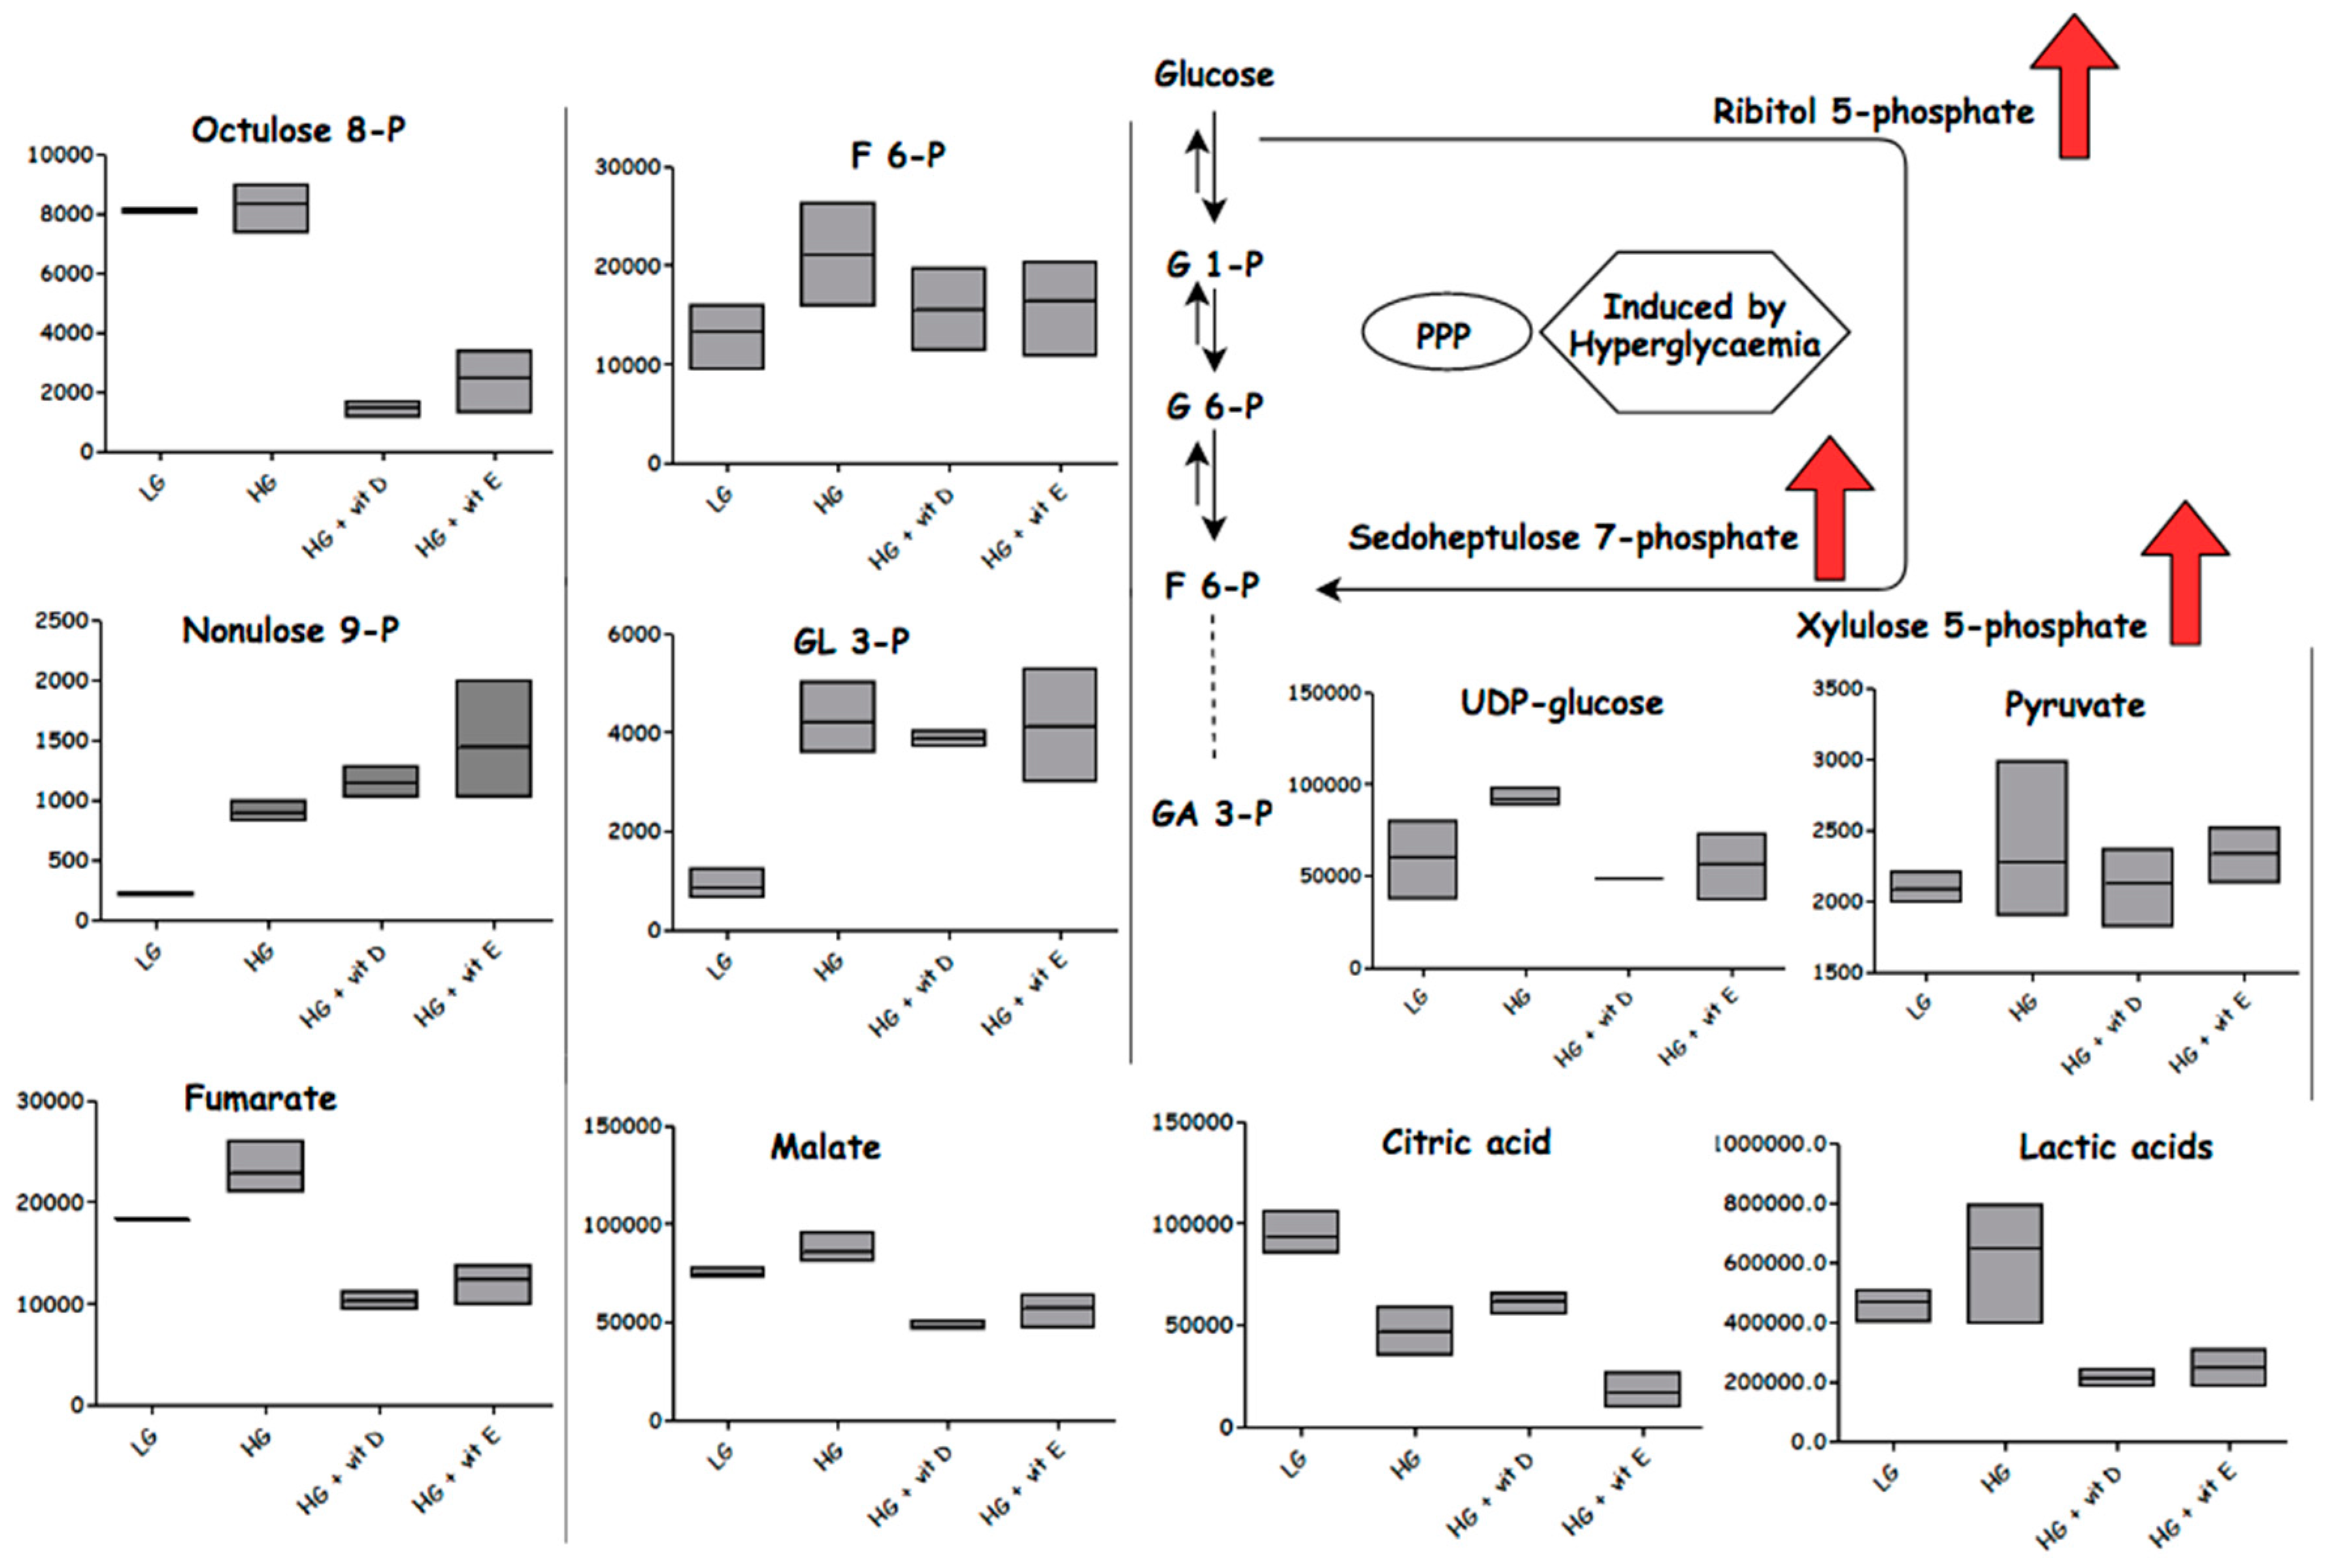
2.4.3. Effect of High-Glucose Media
2.5. Antioxidants
3. Discussion
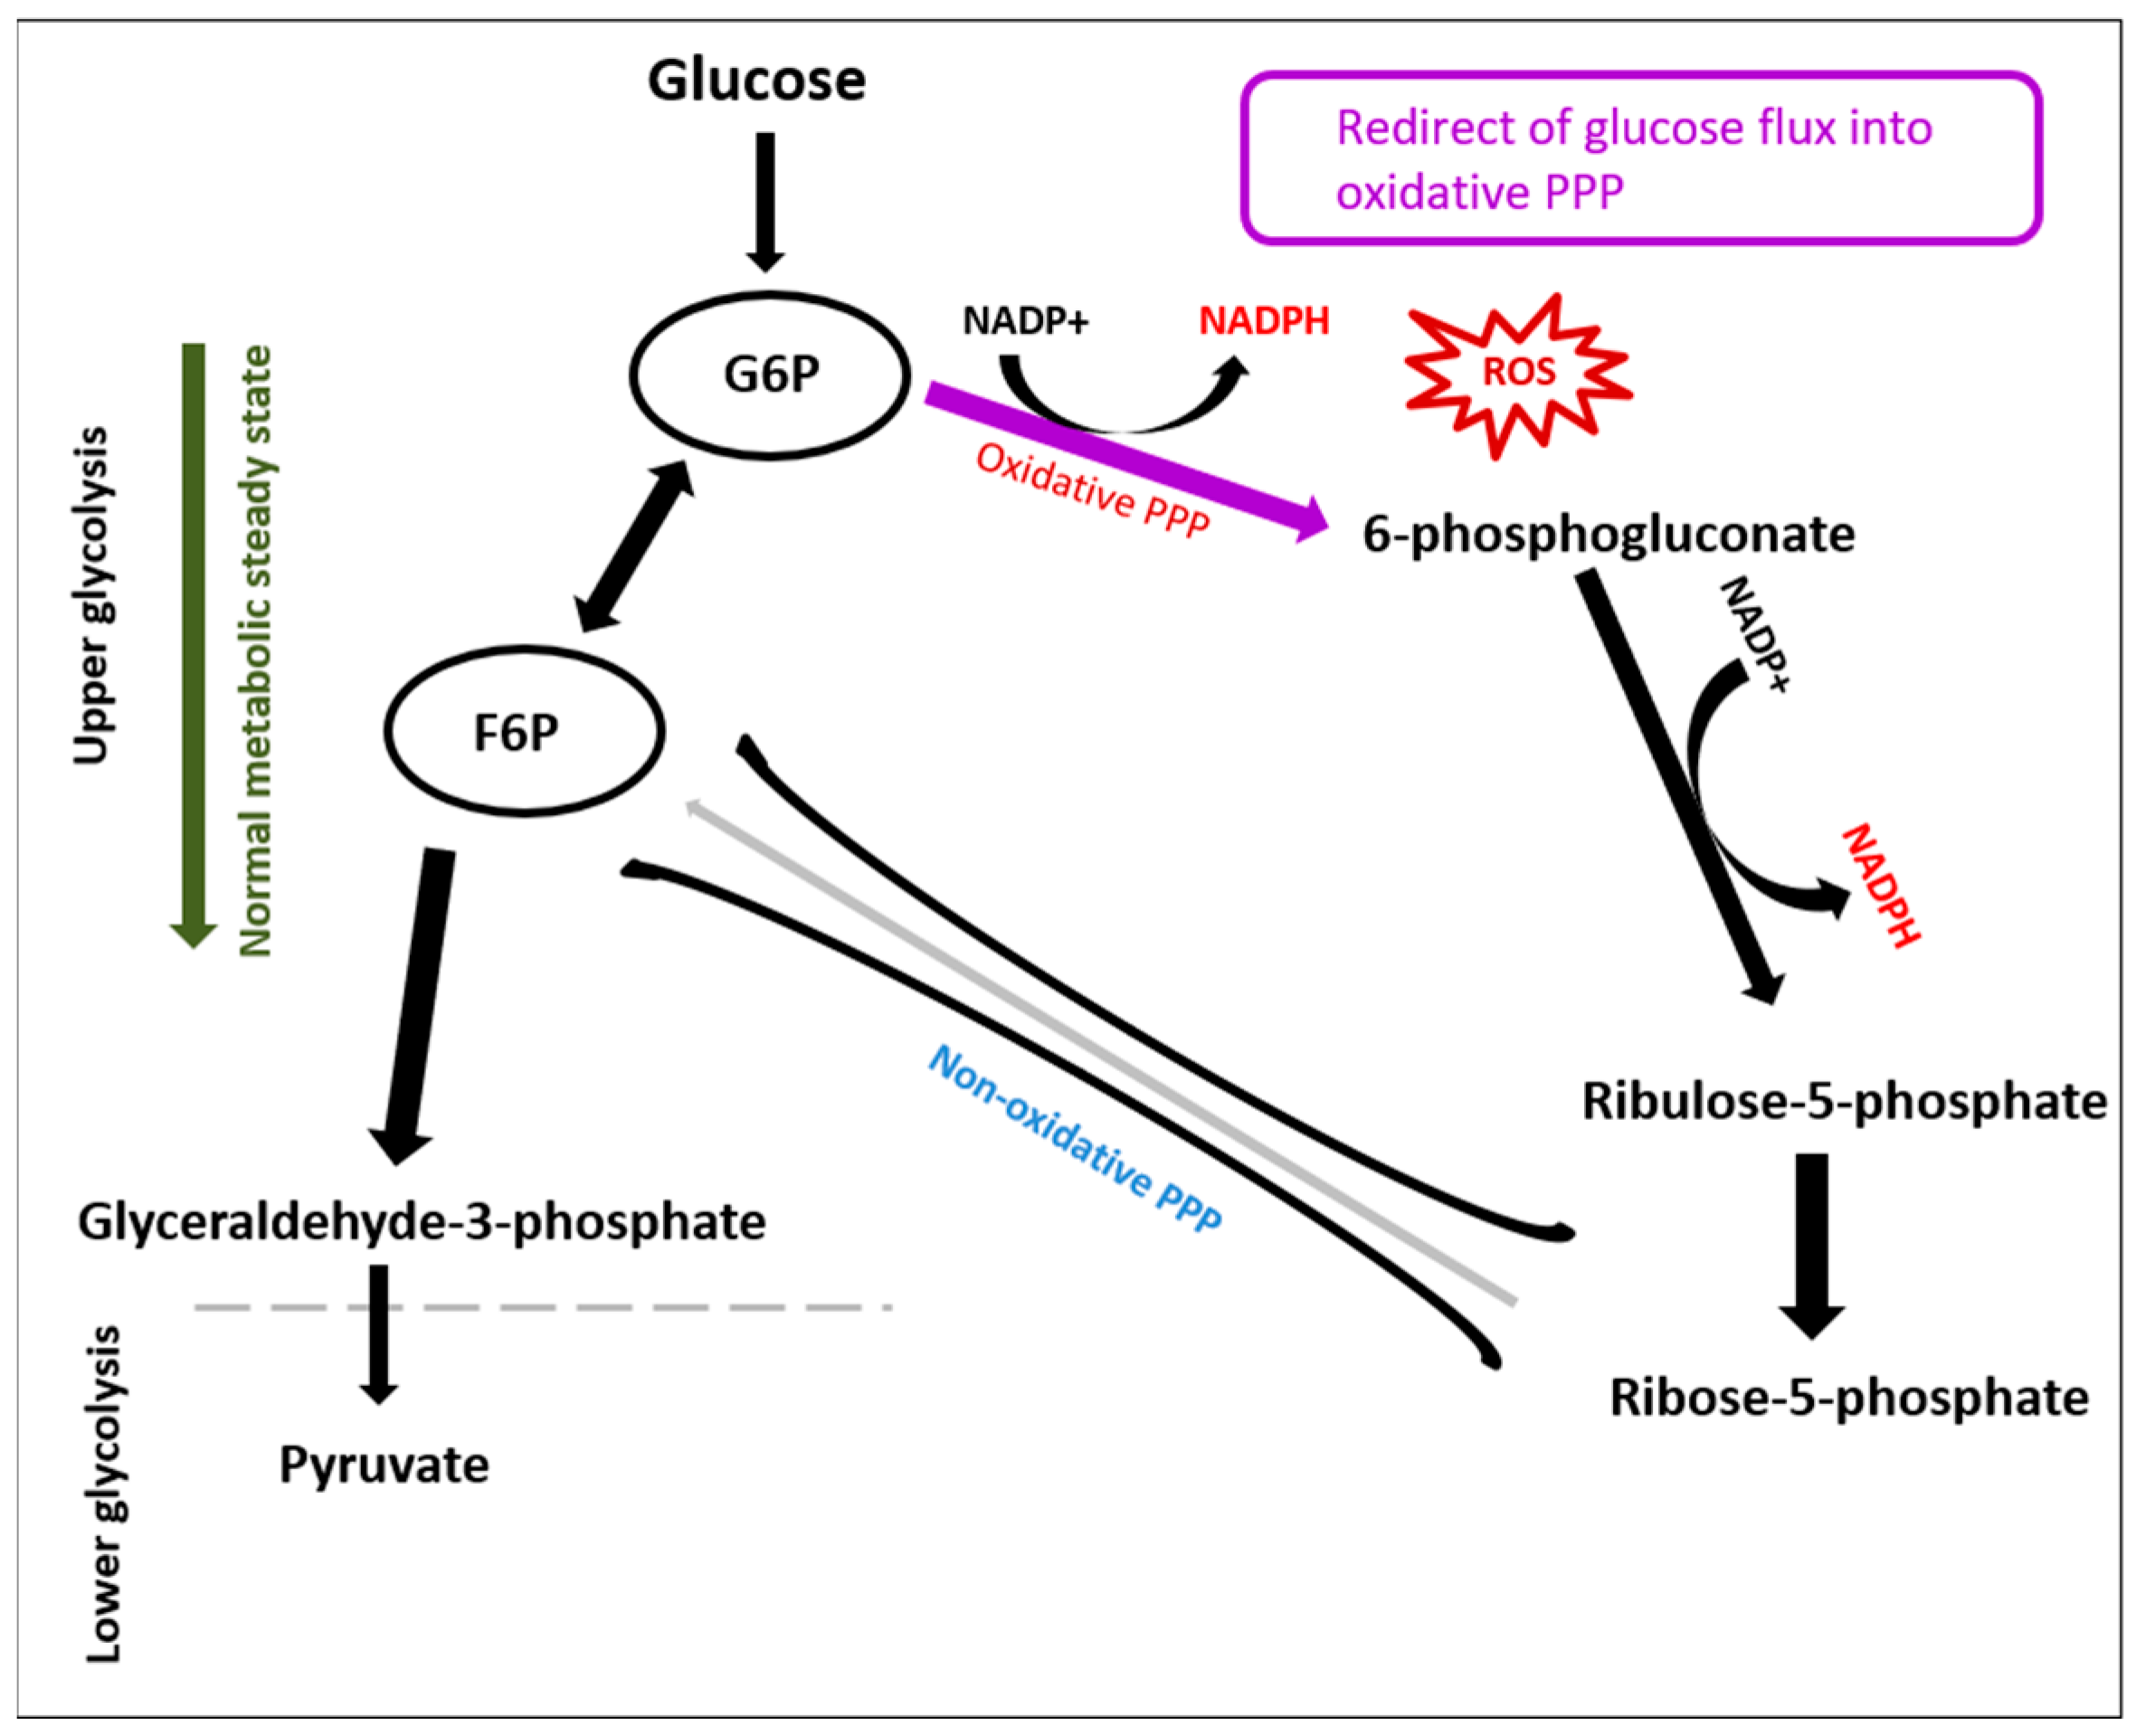
3.1. Glycolysis
3.2. Amino Acids
3.3. Lipids
3.4. Nucleotides
4. Materials and Methods
4.1. Cell Culture
4.2. Cell Viability
4.3. PASMC Proliferation Assay
4.4. Reactive Oxygen Species Experiment
4.5. Metabolic Profiling Sample Preparation
4.6. Samples Analysis (LC/MS)
4.7. Data Extraction and Analysis
5. Conclusions
Limitations and Future Prospects
Supplementary Materials
Author Contributions
Funding
Acknowledgments
Conflicts of Interest
References
- Humbert, M.; Sitbon, O.; Chaouat, A.; Bertocchi, M.; Habib, G.; Gressin, V.; Yaïci, A.; Weitzenblum, E.; Cordier, J.F.; Chabot, F.; et al. Survival in Patients With Idiopathic, Familial, and Anorexigen-Associated Pulmonary Arterial Hypertension in the Modern Management Era. Circulation 2010, 122, 156–163. [Google Scholar] [CrossRef] [PubMed] [Green Version]
- McLaughlin, V.V.; Archer, S.L.; Badesch, D.B.; Barst, R.J.; Farber, H.W.; Lindner, J.R.; Mathier, M.A.; McGoon, M.D.; Park, M.H.; Rosenson, R.S.; et al. ACCF/AHA 2009 expert consensus document on pulmonary hypertension a report of the American College of Cardiology Foundation Task Force on Expert Consensus Documents and the American Heart Association. J. Am. Coll. Cardiol. 2009, 53, 1573–1619. [Google Scholar] [CrossRef] [PubMed]
- Raphael, C.; Briscoe, C.; Davies, J.; Whinnett, Z.I.; Manisty, C.; Sutton, R.; Mayet, J.; Francis, D.P. Limitations of the New York Heart Association functional classification system and self-reported walking distances in chronic heart failure. Heart 2007, 93, 476–482. [Google Scholar] [CrossRef] [PubMed] [Green Version]
- Simonneau, G.; Gatzoulis, M.A.; Adatia, I.; Celermajer, D.; Denton, C.; Ghofrani, A.; Sanchez, M.A.; Kumar, R.K.; Landzberg, M.; Machado, R.F.; et al. Updated Clinical Classification of Pulmonary Hypertension. J. Am. Coll. Cardiol. 2013, 62, D34–D41. [Google Scholar] [CrossRef] [PubMed] [Green Version]
- Ling, Y.; Johnson, M.K.; Kiely, D.G.; Condliffe, R.; Elliot, C.A.; Gibbs, J.S.; Howard, L.S.; Pepke-Zaba, J.; Sheares, K.K.; Corris, P.A.; et al. Changing Demographics, Epidemiology, and Survival of Incident Pulmonary Arterial Hypertension. Am. J. Respir. Crit. Care Med. 2012, 186, 790–796. [Google Scholar] [CrossRef] [PubMed]
- Abernethy, A.D.; Stackhouse, K.; Hart, S.; Devendra, G.; Bashore, T.M.; Dweik, R.; Krasuski, R.A. Impact of Diabetes in Patients with Pulmonary Hypertension. Pulm. Circ. 2015, 5, 117–123. [Google Scholar] [CrossRef] [PubMed] [Green Version]
- Benson, L.; Brittain, E.L.; Pugh, M.E.; Austin, E.D.; Fox, K.; Wheeler, L.; Robbins, I.M.; Hemnes, A.R. Impact of diabetes on survival and right ventricular compensation in pulmonary arterial hypertension. Pulm. Circ. 2014, 4, 311–318. [Google Scholar] [CrossRef] [PubMed]
- Gopal, D.M.; Santhanakrishnan, R.; Wang, Y.-C.; Ayalon, N.; Donohue, C.; Rahban, Y.; Perez, A.J.; Downing, J.; Liang, C.S.; Gokce, N.; et al. Impaired right ventricular hemodynamics indicate preclinical pulmonary hypertension in patients with metabolic syndrome. J. Am. Heart Assoc. 2015, 4, e001597. [Google Scholar] [CrossRef] [PubMed]
- Lai, Y.-C.; Tabima, D.M.; Dube, J.J.; Hughan, K.S.; Goncharov, D.A.; Vanderpool, R.R.; Croix, C.M.; Garcia-Ocaña, A.; Goncharova, E.A.; Tofovic, S.P.; et al. SIRT3-AMPK Activation by Nitrite and Metformin Improves Hyperglycemia and Normalizes Pulmonary Hypertension Associated with Heart Failure with Preserved Ejection Fraction (PH-HFpEF). Circulation 2016, 133, 717–731. [Google Scholar] [CrossRef] [PubMed]
- Giacco, F.; Brownlee, M. Oxidative stress and diabetic complications. Circ. Res. 2010, 107, 1058–1070. [Google Scholar] [CrossRef] [PubMed]
- Brownlee, M. The pathobiology of diabetic complications: A unifying mechanism. Diabetes 2005, 54, 1615–1625. [Google Scholar] [CrossRef] [PubMed]
- Wallace, D.C. Diseases of the Mitochondrial DNA. Annu. Rev. Biochem. 1992, 61, 1175–1212. [Google Scholar] [CrossRef] [PubMed]
- Birben, E.; Sahiner, U.M.; Sackesen, C.; Erzurum, S.; Kalayci, O. Oxidative stress and antioxidant defense. World Allergy Organ. J. 2012, 5, 9–19. [Google Scholar] [CrossRef] [PubMed]
- Maxwell, S.R.; Thomason, H.; Sandler, D.; Leguen, C.; Baxter, M.A.; Thorpe, G.H.; Jones, A.F.; Barnett, A.H. Antioxidant status in patients with uncomplicated insulin-dependent and non-insulin-dependent diabetes mellitus. Eur. J. Clin. Investig. 1997, 27, 484–490. [Google Scholar] [CrossRef]
- Baynes, J.W. Role of oxidative stress in development of complications in diabetes. Diabetes 1991, 40, 405–412. [Google Scholar] [CrossRef] [PubMed]
- Masella, R.; Di Benedetto, R.; Varì, R.; Filesi, C.; Giovannini, C. Novel mechanisms of natural antioxidant compounds in biological systems: Involvement of glutathione and glutathione-related enzymes. J. Nutr. Biochem. 2005, 16, 577–586. [Google Scholar] [CrossRef] [PubMed]
- Whiting, P.H.; Kalansooriya, A.; Holbrook, I.; Haddad, F.; Jennings, P.E. The relationship between chronic glycaemic control and oxidative stress in type 2 diabetes mellitus. Br. J. Biomed. Sci. 2008, 65, 71–74. [Google Scholar] [CrossRef] [PubMed]
- Sundaram, R.K.; Bhaskar, A.; Vijayalingam, S.; Viswanathan, M.; Mohan, R.; Shanmugasundaram, K.R. Antioxidant status and lipid peroxidation in type II diabetes mellitus with and without complications. Clin. Sci. 1996, 90, 255–260. [Google Scholar] [CrossRef] [PubMed]
- Pastore, A.; Federici, G.; Bertini, E.; Piemonte, F. Analysis of glutathione: Implication in redox and detoxification. Clin. Chim. Acta 2003, 333, 19–39. [Google Scholar] [CrossRef]
- Hakki Kalkan, I.; Suher, M. The relationship between the level of glutathione, impairment of glucose metabolism and complications of diabetes mellitus. Pak. J. Med. Sci. 2013, 29, 938–942. [Google Scholar] [PubMed]
- Eaton, J.W.; Qian, M. Molecular bases of cellular iron toxicity. Free Radic. Biol. Med. 2002, 32, 833–840. [Google Scholar] [CrossRef]
- Porter, N.A.; Caldwell, S.E.; Mills, K.A. Mechanisms of free radical oxidation of unsaturated lipids. Lipids 1995, 30, 277–290. [Google Scholar] [CrossRef] [PubMed]
- Slatter, D.A.; Bolton, C.H.; Bailey, A.J. The importance of lipid-derived malondialdehyde in diabetes mellitus. Diabetologia 2000, 43, 550–557. [Google Scholar] [CrossRef] [PubMed]
- Wiseman, H. Vitamin D is a membrane antioxidant. Ability to inhibit iron-dependent lipid peroxidation in liposomes compared to cholesterol, ergosterol and tamoxifen and relevance to anticancer action. FEBS Lett. 1993, 326, 285–288. [Google Scholar] [CrossRef]
- Taheri, E.; Djalali, M.; Djazayeri, A.; Qorbani, M.; Rajab, A.; Larijani, B. Vitamin D status and its association with antioxidant profiles in diabetic patients: A cross-sectional study in Iran. Indian J. Med. Sci. 2013, 67, 29–37. [Google Scholar] [CrossRef] [PubMed]
- Shen, Z.; Zhang, X.; Tang, J.; Kasiappan, R.; Jinwal, U.; Li, P.; Hann, S.; Nicosia, S.V.; Wu, J.; Zhang, X.; et al. The coupling of epidermal growth factor receptor down regulation by 1alpha,25-dihydroxyvitamin D3 to the hormone-induced cell cycle arrest at the G1-S checkpoint in ovarian cancer cells. Mol. Cell. Endocrinol. 2011, 338, 58–67. [Google Scholar] [CrossRef] [PubMed] [Green Version]
- Fedirko, V.; Bostick, R.M.; Long, Q.; Flanders, W.D.; McCullough, M.L.; Sidelnikov, E.; Daniel, C.R.; Rutherford, R.E.; Shaukat, A. Effects of Supplemental Vitamin D and Calcium on Oxidative DNA Damage Marker in Normal Colorectal Mucosa: A Randomized Clinical Trial. Cancer Epidemiol. Prev. Biomark. 2010, 19, 280–291. [Google Scholar] [CrossRef] [PubMed] [Green Version]
- Virtamo, J.; Rapola, J.M.; Ripatti, S.; Heinonen, O.P.; Taylor, P.R.; Albanes, D.; Huttunen, J.K. Effect of Vitamin E and Beta Carotene on the Incidence of Primary Nonfatal Myocardial Infarction and Fatal Coronary Heart Disease. Arch. Intern. Med. 1998, 158, 668–675. [Google Scholar] [CrossRef] [PubMed]
- Sacco, M.; Pellegrini, F.; Roncaglioni, M.C.; Avanzini, F.; Tognoni, G.; Nicolucci, A. Primary prevention of cardiovascular events with low-dose aspirin and vitamin E in type 2 diabetic patients: Results of the Primary Prevention Project (PPP) trial. Diabetes Care 2003, 26, 3264–3272. [Google Scholar] [CrossRef] [PubMed]
- Chae, C.U.; Albert, C.M.; Moorthy, M.V.; Lee, I.-M.; Buring, J.E. Vitamin E Supplementation and the Risk of Heart Failure in Women. Circ. Heart Fail. 2012, 5, 176–182. [Google Scholar] [CrossRef] [PubMed] [Green Version]
- Schieber, M.; Chandel, N.S. ROS Function in Redox Signaling and Oxidative Stress. Curr. Biol. 2014, 24, R453–R462. [Google Scholar] [CrossRef] [PubMed]
- Heart Outcomes Prevention Evaluation Study Investigators; Yusuf, S.; Dagenais, G.; Pogue, J.; Bosch, J.; Sleight, P. Vitamin E Supplementation and Cardiovascular Events in High-Risk Patients. N. Engl. J. Med. 2000, 342, 154–160. [Google Scholar] [CrossRef] [PubMed]
- Gæde, P.; Vedel, P.; Larsen, N.; Jensen, G.V.H.; Parving, H.-H.; Pedersen, O. Multifactorial Intervention and Cardiovascular Disease in Patients with Type 2 Diabetes. N. Engl. J. Med. 2003, 348, 383–393. [Google Scholar] [CrossRef] [PubMed]
- Lonn, E.; Yusuf, S.; Hoogwerf, B.; Pogue, J.; Yi, Q.; Zinman, B.; Bosch, J.; Dagenais, G.; Mann, J.F.; Gerstein, H.C. Effects of vitamin E on cardiovascular and microvascular outcomes in high-risk patients with diabetes: Results of the HOPE study and MICRO-HOPE substudy. Diabetes Care 2002, 25, 1919–1927. [Google Scholar] [CrossRef] [PubMed]
- Skyrme-Jones, R.A.; O’Brien, R.C.; Berry, K.L.; Meredith, I.T. Vitamin E supplementation improves endothelial function in type I diabetes mellitus: A randomized, placebo-controlled study. J. Am. Coll. Cardiol. 2000, 36, 94–102. [Google Scholar] [CrossRef]
- Beckman, J.A.; Goldfine, A.B.; Gordon, M.B.; Garrett, L.A.; Keaney, J.F.; Creager, M.A. Oral antioxidant therapy improves endothelial function in Type 1 but not Type 2 diabetes mellitus. Am. J. Physiol. Circ. Physiol. 2003, 285, H2392–H2398. [Google Scholar] [CrossRef] [PubMed]
- Gaede, P.; Poulsen, H.E.; Parving, H.H.; Pedersen, O. Double-blind, randomised study of the effect of combined treatment with vitamin C and E on albuminuria in Type 2 diabetic patients. Diabet. Med. 2001, 18, 756–760. [Google Scholar] [CrossRef] [PubMed]
- Alipui, C.; Ramos, K.; Tenner, T.E. Alterations of rabbit aortic smooth muscle cell proliferation in diabetes mellitus. Cardiovasc. Res. 1993, 27, 1229–1232. [Google Scholar] [CrossRef] [PubMed]
- Oikawa, S.; Hayasaka, K.; Hashizume, E.; Kotake, H.; Midorikawa, H.; Sekikawa, A.; Kikuchi, A.; Toyota, T. Human arterial smooth muscle cell proliferation in diabetes. Diabetes 1996, 45 (Suppl. 3), S114–S116. [Google Scholar] [CrossRef] [PubMed]
- Yoo, H.J.; Yu, S.H.; Cho, Y.J.; Nam, H.W.; Kang, D.H. Effects of Homocysteine and Hyperglycemia on the Proliferation of Aortic Vascular Smooth Muscle Cells of Obese Type 2 Diabetes Rat. Ann. Geriatr. Med. Res. 2017, 21, 78–85. [Google Scholar] [CrossRef] [Green Version]
- Mitsuhashi, T.; Morris, R.C.; Ives, H.E.; Ives, H.E. 1,25-dihydroxyvitamin D3 modulates growth of vascular smooth muscle cells. J. Clin. Investig. 1991, 87, 1889–1895. [Google Scholar] [CrossRef] [PubMed]
- Carthy, E.P.; Yamashita, W.; Hsu, A.; Ooi, B.S. 1,25-Dihydroxyvitamin D3 and rat vascular smooth muscle cell growth. Hypertens 1989, 13 Pt 2, 954–959. [Google Scholar] [CrossRef]
- Boscoboinik, D.; Szewczyk, A.; Hensey, C.; Azzi, A. Inhibition of cell proliferation by alpha-tocopherol. Role of protein kinase C. J. Biol. Chem. 1991, 266, 6188–6194. [Google Scholar] [PubMed]
- Labudzynskyi, D.O.; Zaitseva, O.V.; Latyshko, N.V.; Gudkova, O.O.; Veliky, M.M. Vitamin D3 contribution to the regulation of oxidative metabolism in the liver of diabetic mice. Ukr. Biochem. J. 2015, 87, 75–90. [Google Scholar] [CrossRef] [PubMed]
- Kono, K.; Fujii, H.; Nakai, K.; Goto, S.; Kitazawa, R.; Kitazawa, S.; Shinohara, M.; Hirata, M.; Fukagawa, M.; Nishi, S. Anti-Oxidative Effect of Vitamin D Analog on Incipient Vascular Lesion in Non-Obese Type 2 Diabetic Rats. Am. J. Nephrol. 2013, 37, 167–174. [Google Scholar] [CrossRef] [PubMed]
- Greń, A. Effects of Vitamin E, C and D Supplementation on Inflammation and Oxidative Stress in Streptozotocin-Induced Diabetic Mice. Int. J. Vitam. Nutr. Res. 2013, 83, 168–175. [Google Scholar] [CrossRef] [PubMed]
- Gavazza, M.; Catalá, A. The effect of alpha-tocopherol on the lipid peroxidation of mitochondria and microsomes obtained from rat liver and testis. Mol. Cell. Biochem. 2001, 225, 121–128. [Google Scholar] [CrossRef] [PubMed]
- Archer, S.L.; Weir, E.K.; Wilkins, M.R. Basic science of pulmonary arterial hypertension for clinicians: New concepts and experimental therapies. Circulation 2010, 121, 2045–2066. [Google Scholar] [CrossRef] [PubMed]
- Monnier, L.; Mas, E.; Ginet, C.; Michel, F.; Villon, L.; Cristol, J.P.; Colette, C. Activation of Oxidative Stress by Acute Glucose Fluctuations Compared With Sustained Chronic Hyperglycemia in Patients With Type 2 Diabetes. JAMA 2006, 295, 1681–1687. [Google Scholar] [CrossRef] [PubMed]
- Sochor, M.; Gonzalez, A.M.; McLean, P. Regulation of alternative pathways of glucose metabolism in rat heart in alloxan diabetes: Changes in the pentose phosphate pathway. Biochem. Biophys. Res. Commun. 1984, 118, 110–116. [Google Scholar] [CrossRef]
- Andreyev, A.Y.; Kushnareva, Y.E.; Starkov, A.A. Mitochondrial metabolism of reactive oxygen species. Biochemistry 2005, 70, 200–214. [Google Scholar] [CrossRef] [PubMed]
- Gaudin, M.; Panchal, M.; Auzeil, N.; Duyckaerts, C.; Brunelle, A.; Laprévote, O.; Touboul, D. Choline-containing phospholipids in microdissected human Alzheimer’s disease brain senile plaque versus neuropil. Bioanalysis 2012, 4, 2153–2159. [Google Scholar] [CrossRef] [PubMed]
- Steenken, S.; Jovanovic, S.V. How Easily Oxidizable Is DNA? One-Electron Reduction Potentials of Adenosine and Guanosine Radicals in Aqueous Solution. J. Am. Chem. Soc. 1997, 119, 617–618. [Google Scholar] [CrossRef]
- Hira, H.S.; Samal, P.; Kaur, A.; Kapoor, S. Plasma level of hypoxanthine/xanthine as markers of oxidative stress with different stages of obstructive sleep apnea syndrome. Ann. Saudi Med. 2014, 34, 308–313. [Google Scholar] [CrossRef] [PubMed]
- Reis, G.S.; Augusto, V.S.; Silveira, A.P.C.; Jordao, A.A., Jr.; Baddini-Martinez, J.; Neto, O.P.; Rodrigues, A.J.; Evora, P.R. Oxidative-stress biomarkers in patients with pulmonary hypertension. Pulm. Circ. 2013, 3, 856–861. [Google Scholar] [CrossRef] [PubMed]
- Sekhar, R.V.; McKay, S.V.; Patel, S.G.; Guthikonda, A.P.; Reddy, V.T.; Balasubramanyam, A.; Jahoor, F. Glutathione synthesis is diminished in patients with uncontrolled diabetes and restored by dietary supplementation with cysteine and glycine. Diabetes Care 2011, 34, 162–167. [Google Scholar] [CrossRef] [PubMed]
- Zhao, Y.; Peng, J.; Lu, C.; Hsin, M.; Mura, M.; Wu, L.; Chu, L.; Zamel, R.; Machuca, T.; Waddell, T.; et al. Metabolomic heterogeneity of pulmonary arterial hypertension. PLoS ONE. 2014, 9, e88727. [Google Scholar] [CrossRef] [PubMed] [Green Version]
- Helkin, A.; Stein, J.J.; Lin, S.; Siddiqui, S.; Maier, K.G.; Gahtan, V. Dyslipidemia Part 1—Review of Lipid Metabolism and Vascular Cell Physiology. Vasc. Endovasc. Surg. 2016, 50, 107–118. [Google Scholar] [CrossRef] [PubMed]
- Whiley, L.; Sen, A.; Heaton, J.; Proitsi, P.; García-Gómez, D.; Leung, R.; Smith, N.; Thambisetty, M.; Kloszewska, I.; Mecocci, P.; et al. Evidence of altered phosphatidylcholine metabolism in Alzheimer’s disease. Neurobiol. Aging 2014, 35, 271–278. [Google Scholar] [CrossRef] [PubMed]
- Hong, J.H.; Kang, J.W.; Kim, D.K.; Baik, S.H.; Kim, K.H.; Shanta, S.R.; Jung, J.H.; Mook-Jung, I.; Kim, K.P. Global changes of phospholipids identified by MALDI imaging mass spectrometry in a mouse model of Alzheimer’s disease. J. Lipid Res. 2016, 57, 36–45. [Google Scholar] [CrossRef] [PubMed]
- Erlinge, D. Extracellular ATP: A Growth Factor for Vascular Smooth Muscle Cells. Gen. Pharmacol. Vasc. Syst. 1998, 31, 1–8. [Google Scholar] [CrossRef]
- Buse, M.G. Hexosamines, insulin resistance, and the complications of diabetes: Current status. Am. J. Physiol. Endocrinol. Metab. 2006, 290, E1–E8. [Google Scholar] [CrossRef] [PubMed]
- Copeland, R.J.; Bullen, J.W.; Hart, G.W. Cross-talk between GlcNAcylation and phosphorylation: Roles in insulin resistance and glucose toxicity. Am. J. Physiol. Endocrinol. Metab. 2008, 295, E17–E28. [Google Scholar] [CrossRef] [PubMed]
- Zhang, R.; Watson, D.G.; Wang, L.; Westrop, G.D.; Coombs, G.H.; Zhang, T. Evaluation of mobile phase characteristics on three zwitterionic columns in hydrophilic interaction liquid chromatography mode for liquid chromatography-high resolution mass spectrometry based untargeted metabolite profiling of Leishmania parasites. J. Chromatogr. A 2014, 1362, 168–179. [Google Scholar] [CrossRef] [PubMed]
- Creek, D.J.; Jankevics, A.; Burgess, K.E.V.; Breitling, R.; Barrett, M.P. IDEOM: An Excel interface for analysis of LC–MS-based metabolomics data. Bioinformatics 2012, 28, 1048–1049. [Google Scholar] [CrossRef] [PubMed]


| Model | SS | DF | MS | F | p Value | SD |
|---|---|---|---|---|---|---|
| Total corr. | 33 | 33 | 1 | - | - | 1 |
| Regression | 27.15 | 30 | 0.905 | 0.465028 | 0.885 | 0.9514 |
| Residual | 5.840 | 3 | 1.946 | - | - | 1.3952 |
© 2018 by the authors. Licensee MDPI, Basel, Switzerland. This article is an open access article distributed under the terms and conditions of the Creative Commons Attribution (CC BY) license (http://creativecommons.org/licenses/by/4.0/).
Share and Cite
Alamri, A.; Burzangi, A.S.; Coats, P.; Watson, D.G. Untargeted Metabolic Profiling Cell-Based Approach of Pulmonary Artery Smooth Muscle Cells in Response to High Glucose and the Effect of the Antioxidant Vitamins D and E. Metabolites 2018, 8, 87. https://doi.org/10.3390/metabo8040087
Alamri A, Burzangi AS, Coats P, Watson DG. Untargeted Metabolic Profiling Cell-Based Approach of Pulmonary Artery Smooth Muscle Cells in Response to High Glucose and the Effect of the Antioxidant Vitamins D and E. Metabolites. 2018; 8(4):87. https://doi.org/10.3390/metabo8040087
Chicago/Turabian StyleAlamri, Abdulwahab, Abdulhadi S. Burzangi, Paul Coats, and David G. Watson. 2018. "Untargeted Metabolic Profiling Cell-Based Approach of Pulmonary Artery Smooth Muscle Cells in Response to High Glucose and the Effect of the Antioxidant Vitamins D and E" Metabolites 8, no. 4: 87. https://doi.org/10.3390/metabo8040087