Article

Spatial Analysis of Linear Structures in the Exploration of Groundwater

College of Automation, Harbin Engineering University, Harbin 150001, Heilongjiang, China
*
Author to whom correspondence should be addressed.
ISPRS Int. J. Geo-Inf. 2017, 6(11), 335; https://doi.org/10.3390/ijgi6110335
Submission received: 21 September 2017 / Revised: 18 October 2017 / Accepted: 25 October 2017 / Published: 2 November 2017

Abstract

:
The analysis of linear structures on major geological formations plays a crucial role in resource exploration in the Inner Niger Delta. Highlighting and mapping of the large lithological units were carried out using image fusion, spectral bands (RGB coding), Principal Component Analysis (PCA), and band ratio methods. The automatic extraction method of linear structures has permitted the obtaining of a structural map with 82,659 linear structures, distributed on different stratigraphic stages. The intensity study shows an accentuation in density over 12.52% of the total area, containing 22.02% of the linear structures. The density and nodes (intersections of fractures) formed by the linear structures on the different lithologies allowed to observe the behavior of the region’s aquifers in the exploration of subsoil resources. The central density, in relation to the hydrographic network of the lowlands, shows the conditioning of the flow and retention of groundwater in the region, and in-depth fluids. The node areas and high-density linear structures, have shown an ability to have rejections in deep (pores) that favor the formation of structural traps for oil resources.

Graphical Abstract

1. Introduction

Knowledge of the geological nature of a given region, and its natural fracture networks, greatly affect the possibilities in analyzing and resolving many current problems, such as the exploration of subsoil resources and the rehabilitation of aquifers [1]. Remote sensing is used in the exploration of underground resources as a prerequisite for various studies, such as geological studies and geophysical studies (gravimetric, magnetometric, seismic, reflection, and refraction) [2,3]. It is, therefore, the research of geological structures in relief, because current technologies do not directly detect subsoil resources. By knowing these different aspects, the study of linear structures has become indispensable in resource exploration. Remote sensing, with its global view and geographical locations, is used to identify and orient linear structures. These linear structures are susceptible to reach in-depth rejections at a minimum of 2 km. The development of very high secondary porosities along the deep fault plane may favor the formation of structural traps for oil resources. Remote sensing, through its synoptic vision for studying vast geographical fields, is well adapted to the mapping of structures and lithologies in outcroppings [4,5]. Indeed, the processing of satellite data greatly contributes to the inventory and evaluation of natural resources and surface geological mapping. Remote sensing is also used for the visualization of linear structures and the lithologies of different zones. This facilitates the development and production of linear Structures maps and landfill maps, which are classified according to different lithologies.
The main objective of this work was to develop a map of linear structures (fractures, faults, etc.) and geological outcroppings (litho-structural map) from Landsat 7 images of the Inner Delta of Niger. The aim was to create an inventory of the linear structures and to trace the contours of the various geological formations in order to help the relevant authorities to make decisions regarding underground resource exploration of the region.

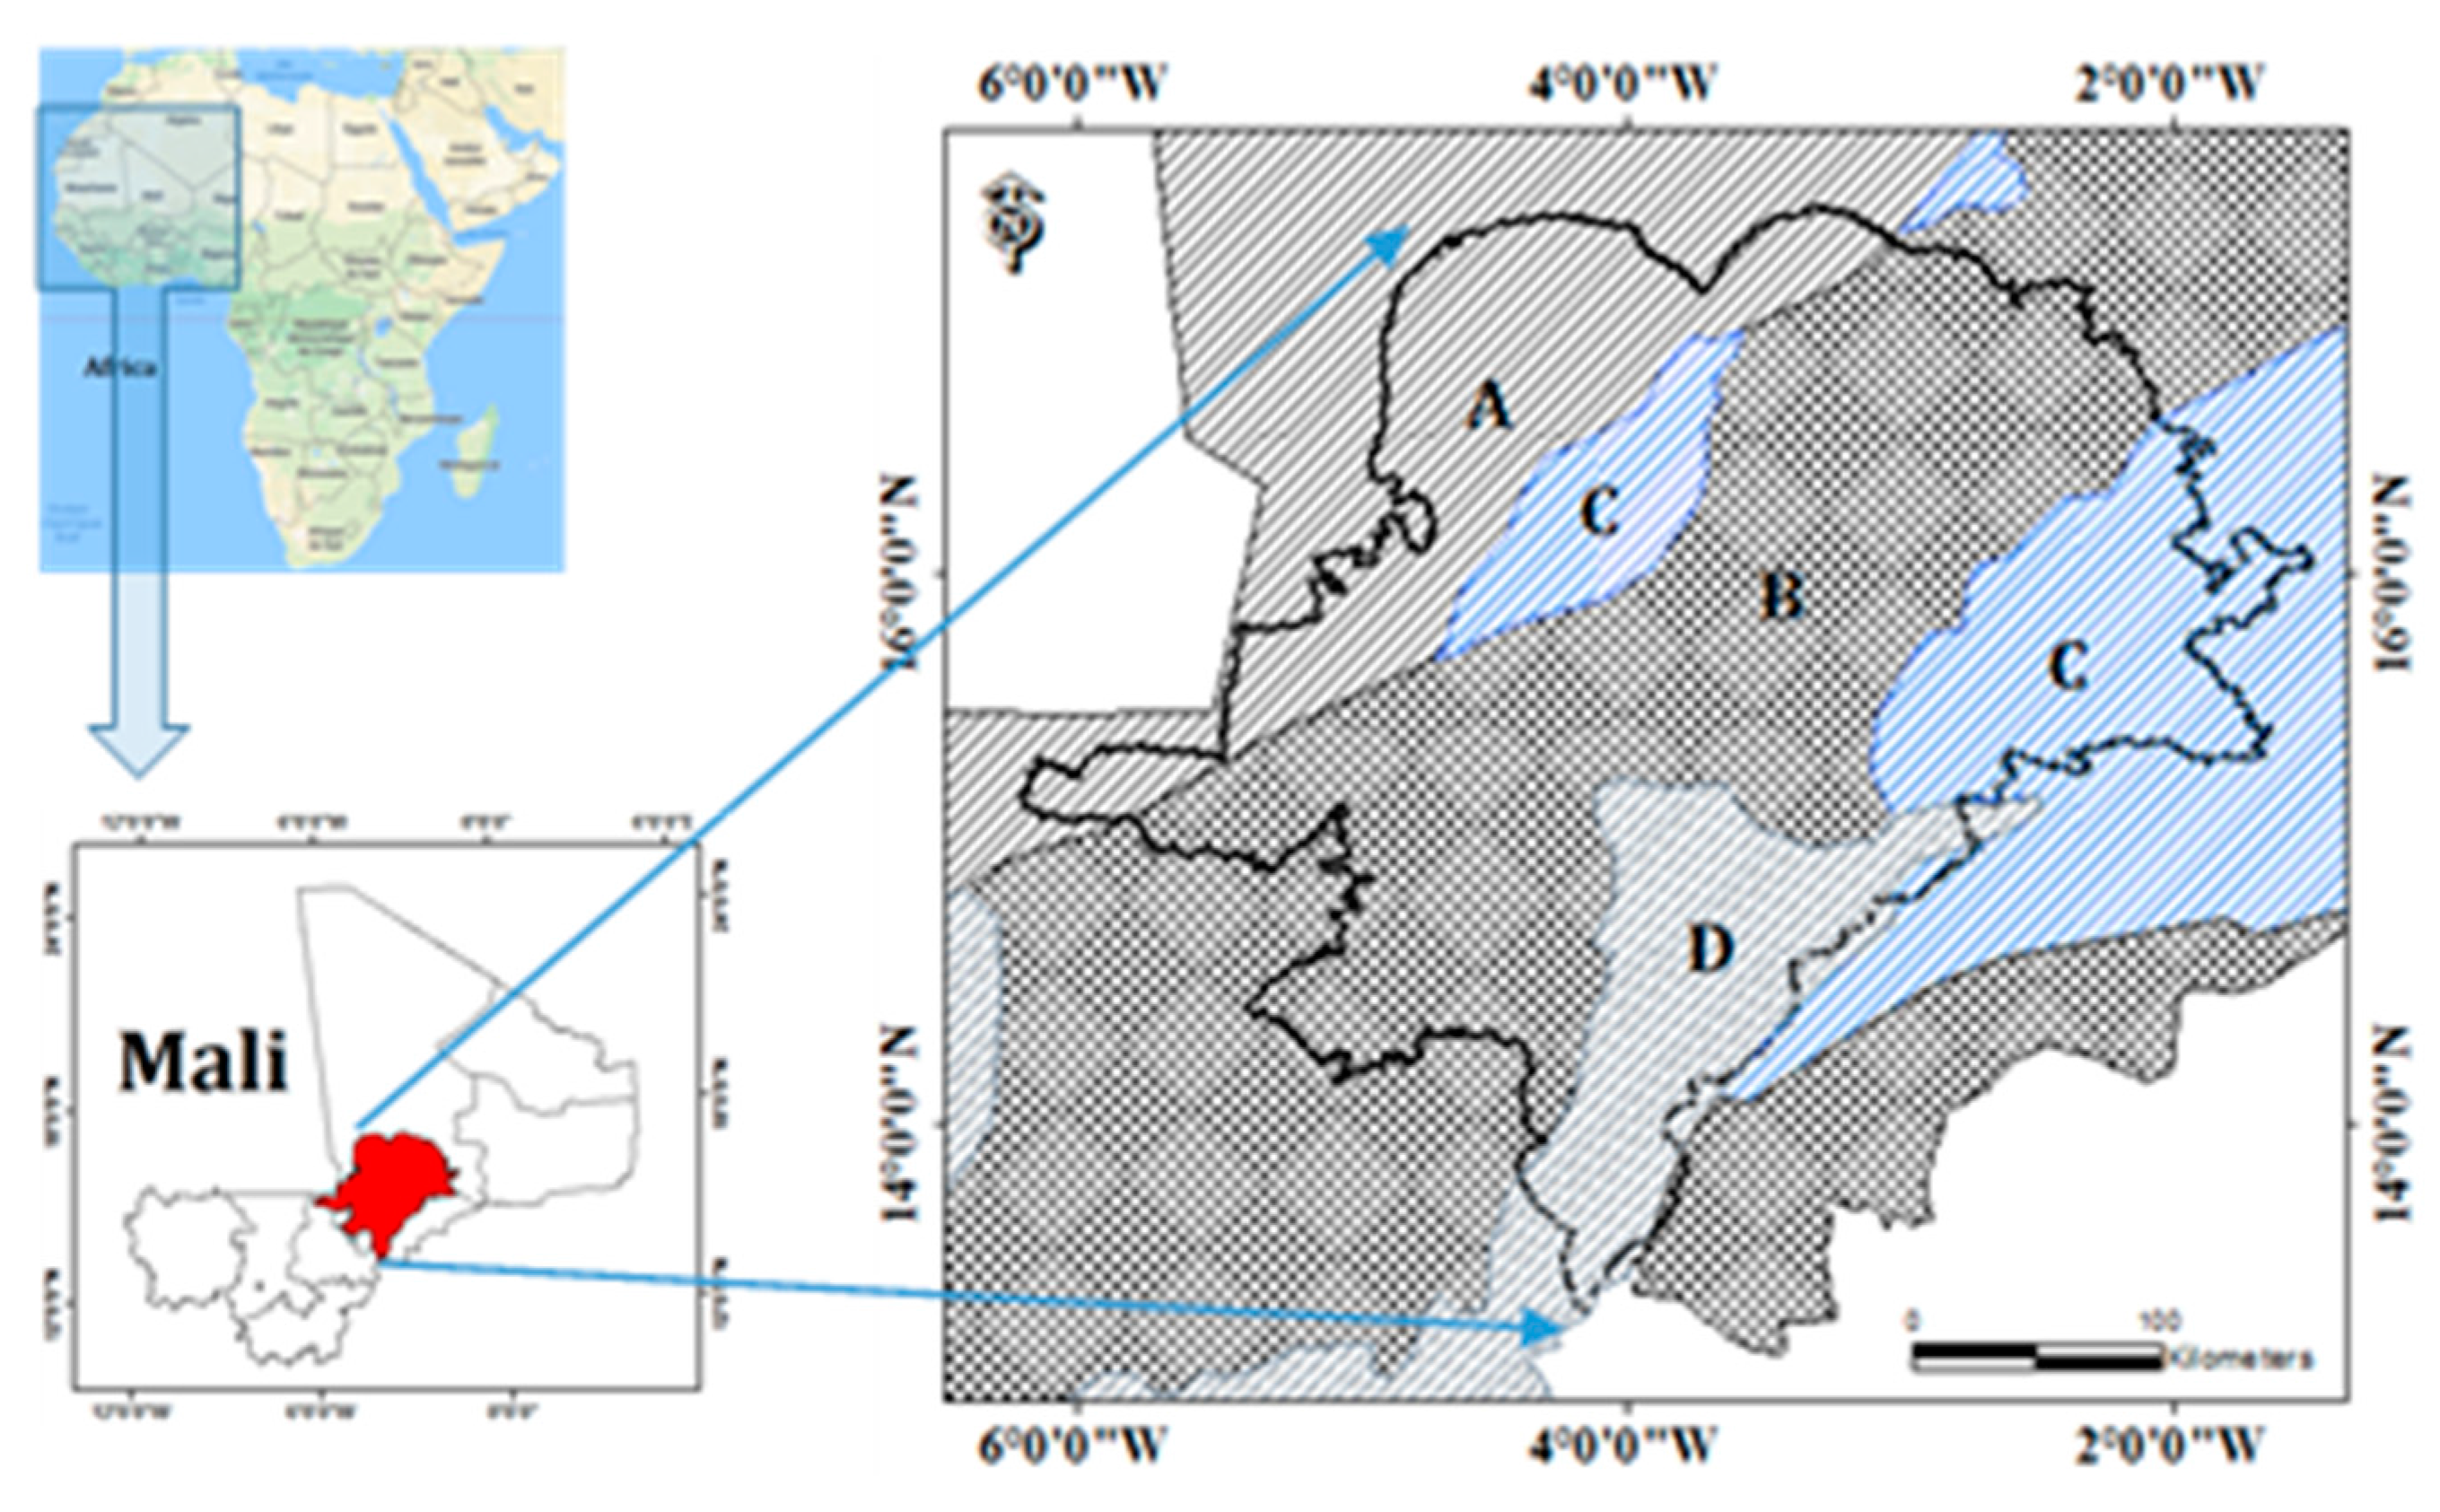
2. Data and Study Area
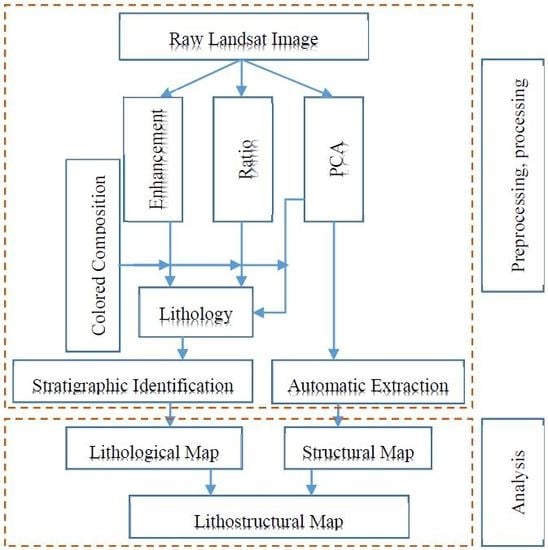
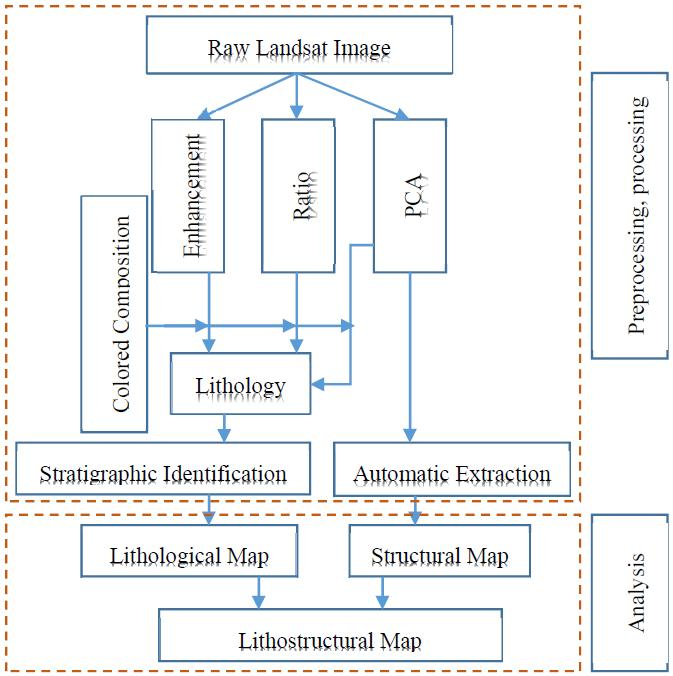
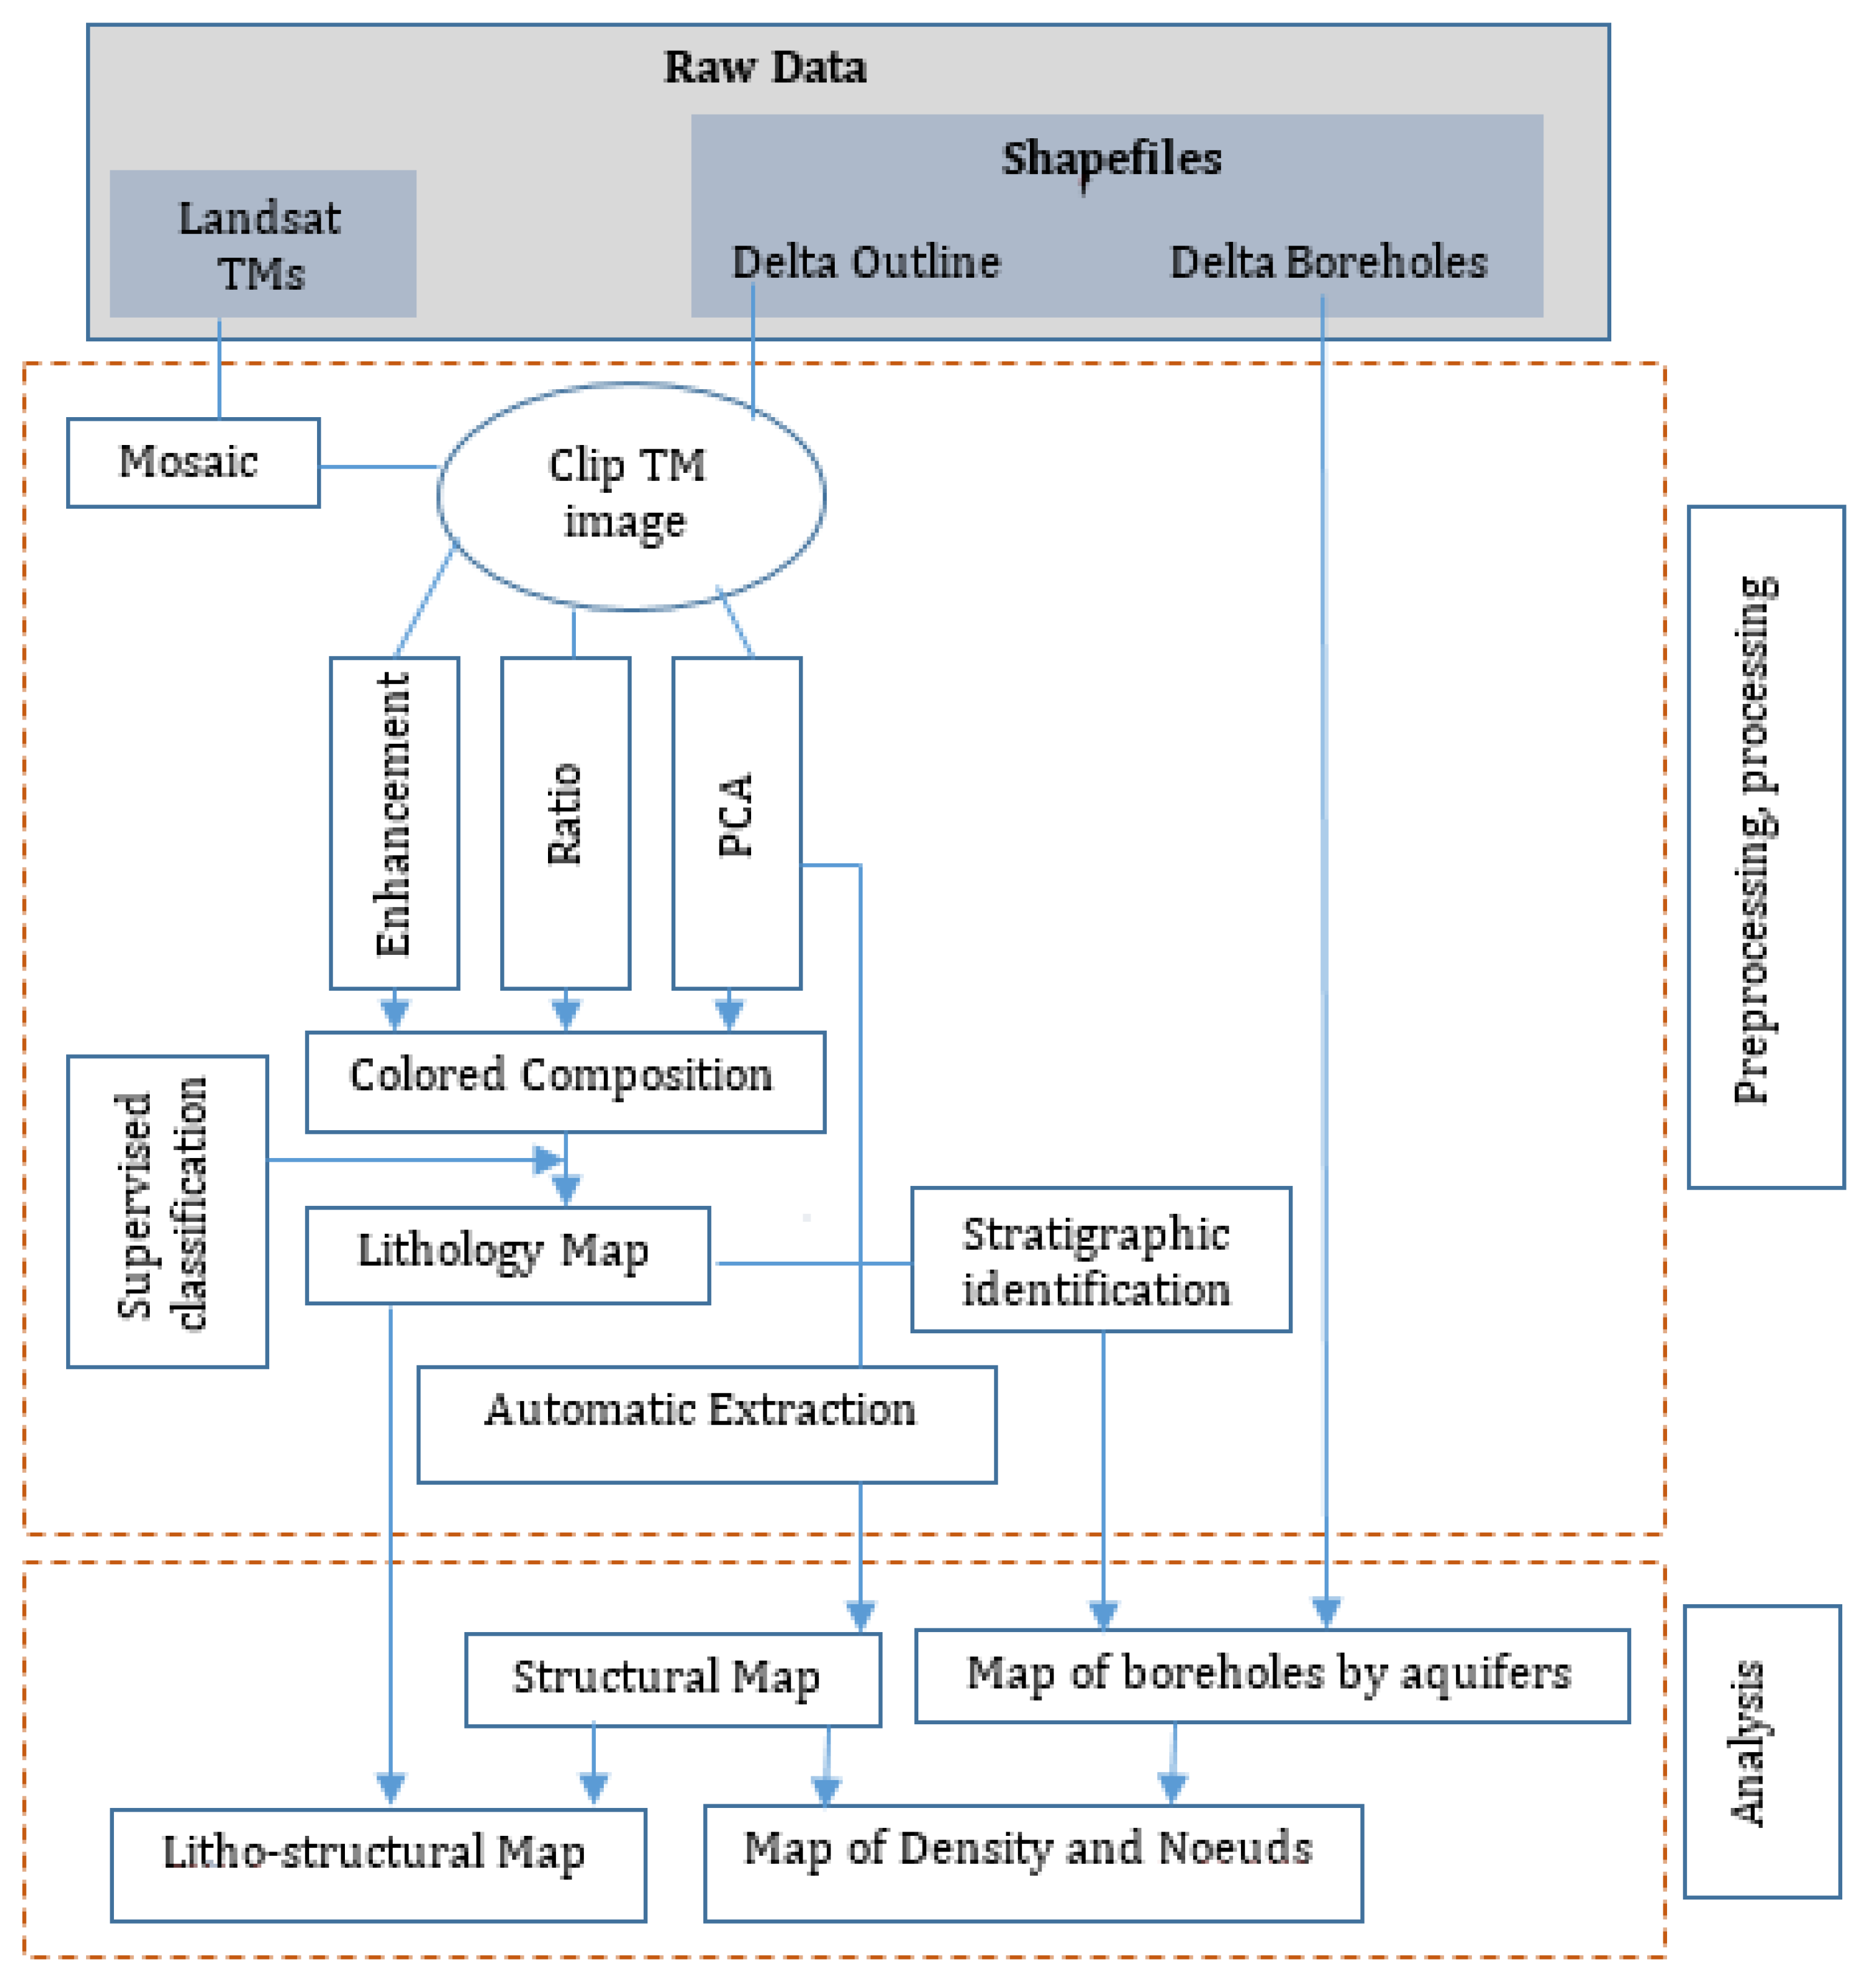
Located in the center of Mali, the study area is approximately limited from west to east by the coordinates −6.20° and −1.50°, and, from south to north, by the coordinates 13.32° and 17.34° (Figure 1). With an area of 131,886.607 km2, it is a depressed north–northwest dip zone [6], located in the transition zone between the Precambrian tabular of the Mandingo Plateau in the south, and the Precambrian folded of the Gourma in the north. And at northwest are accumulated the formations of continental terminal/Intercalary. The underlying primary formations include southwest/south-east oriented folds and west/east to northwest/south-east fractures that occur on the outcrops of Goundam Hills, the Bandiagara sandy plateaus, and outcrop sandstone to the south of Debo Lake. The geology of the shallow delta (flood zone) is mainly marked by continental or desert sedimentary deposits, comprising, from bottom to top, the following formations: The continental intercalary, continental terminal, and the quaternary [7].
The entire area is covered by a mosaic of 14 Landsat TM scenes, ranging from path 198 row 48 to path 196 row 51, of 2010. The images were taken from the database of the United States Geological Survey (USGS), and were acquired from their website. These raster images are meshed images forming a block of cells, and each of them contains information concerning the occupied space through the mean of the spectral signature of the objects in place. These images have a spatial resolution of 30 m and the appropriate bands for their spectral enhancement facilitate significant discrimination of the fracture networks. ENVI 4.5, Geomatica 2017, Arc Map 10.1, and RockWorks15 were used for preprocessing, processing and analyses.

3. Methodology

The adopted methodology in this work is based on two points. It begins with the application of remote sensing methods for lithological and structural mapping, and is followed by the characterization and analysis of linear structures and geologic formations. Figure 2 shows the elaboration and analysis of the litho-structural map.
Enhanced images make it possible to extract maximum lithological information. Several methods of investigation were applied in the discrimination of lithological units [8,9]; namely, spectral bands (enhancement), Principal Component Analysis (PCA), ratio bands (TM4/TM5, TM4/TM3 and TM4/TM7). In all cases, the application fusion using RGB coding was used first to merge the multispectral images of the visible (TM1, 2, 3) and then with the infrared images (TM4, 5, 7). The images resulting from these different processing methods were used for the realization of additive trichromatic synthesis. From the bands of the Principal Component (PC), a clear colored composition permits to discriminate the different lithological units, especially the PC band for automatic extraction of linear structures. The automatic extracting system of material is equipped with morphological processing operators, in which the directional criterion is directly integrated in order to automatically identify anisotropic structuring elements (rectilinear, curvilinear segments) [10,11]. Thus, the proposed extraction method adopted the following characteristics from Table 1 for the sought linear structures. Then, a split line at the vertices was applied for each of the vector files of the observed geological structures. Additionally, certain structures escaping automatic extraction were traced manually. The attribute information (coordinates of the two vertices of each linear structure) permitted the generation of statistics of the frequencies and lengths of the fractures. Density analysis of the linear structures of the lithology formations were the object of understanding of the subsoil state of groundwater and fluids.

4. Results

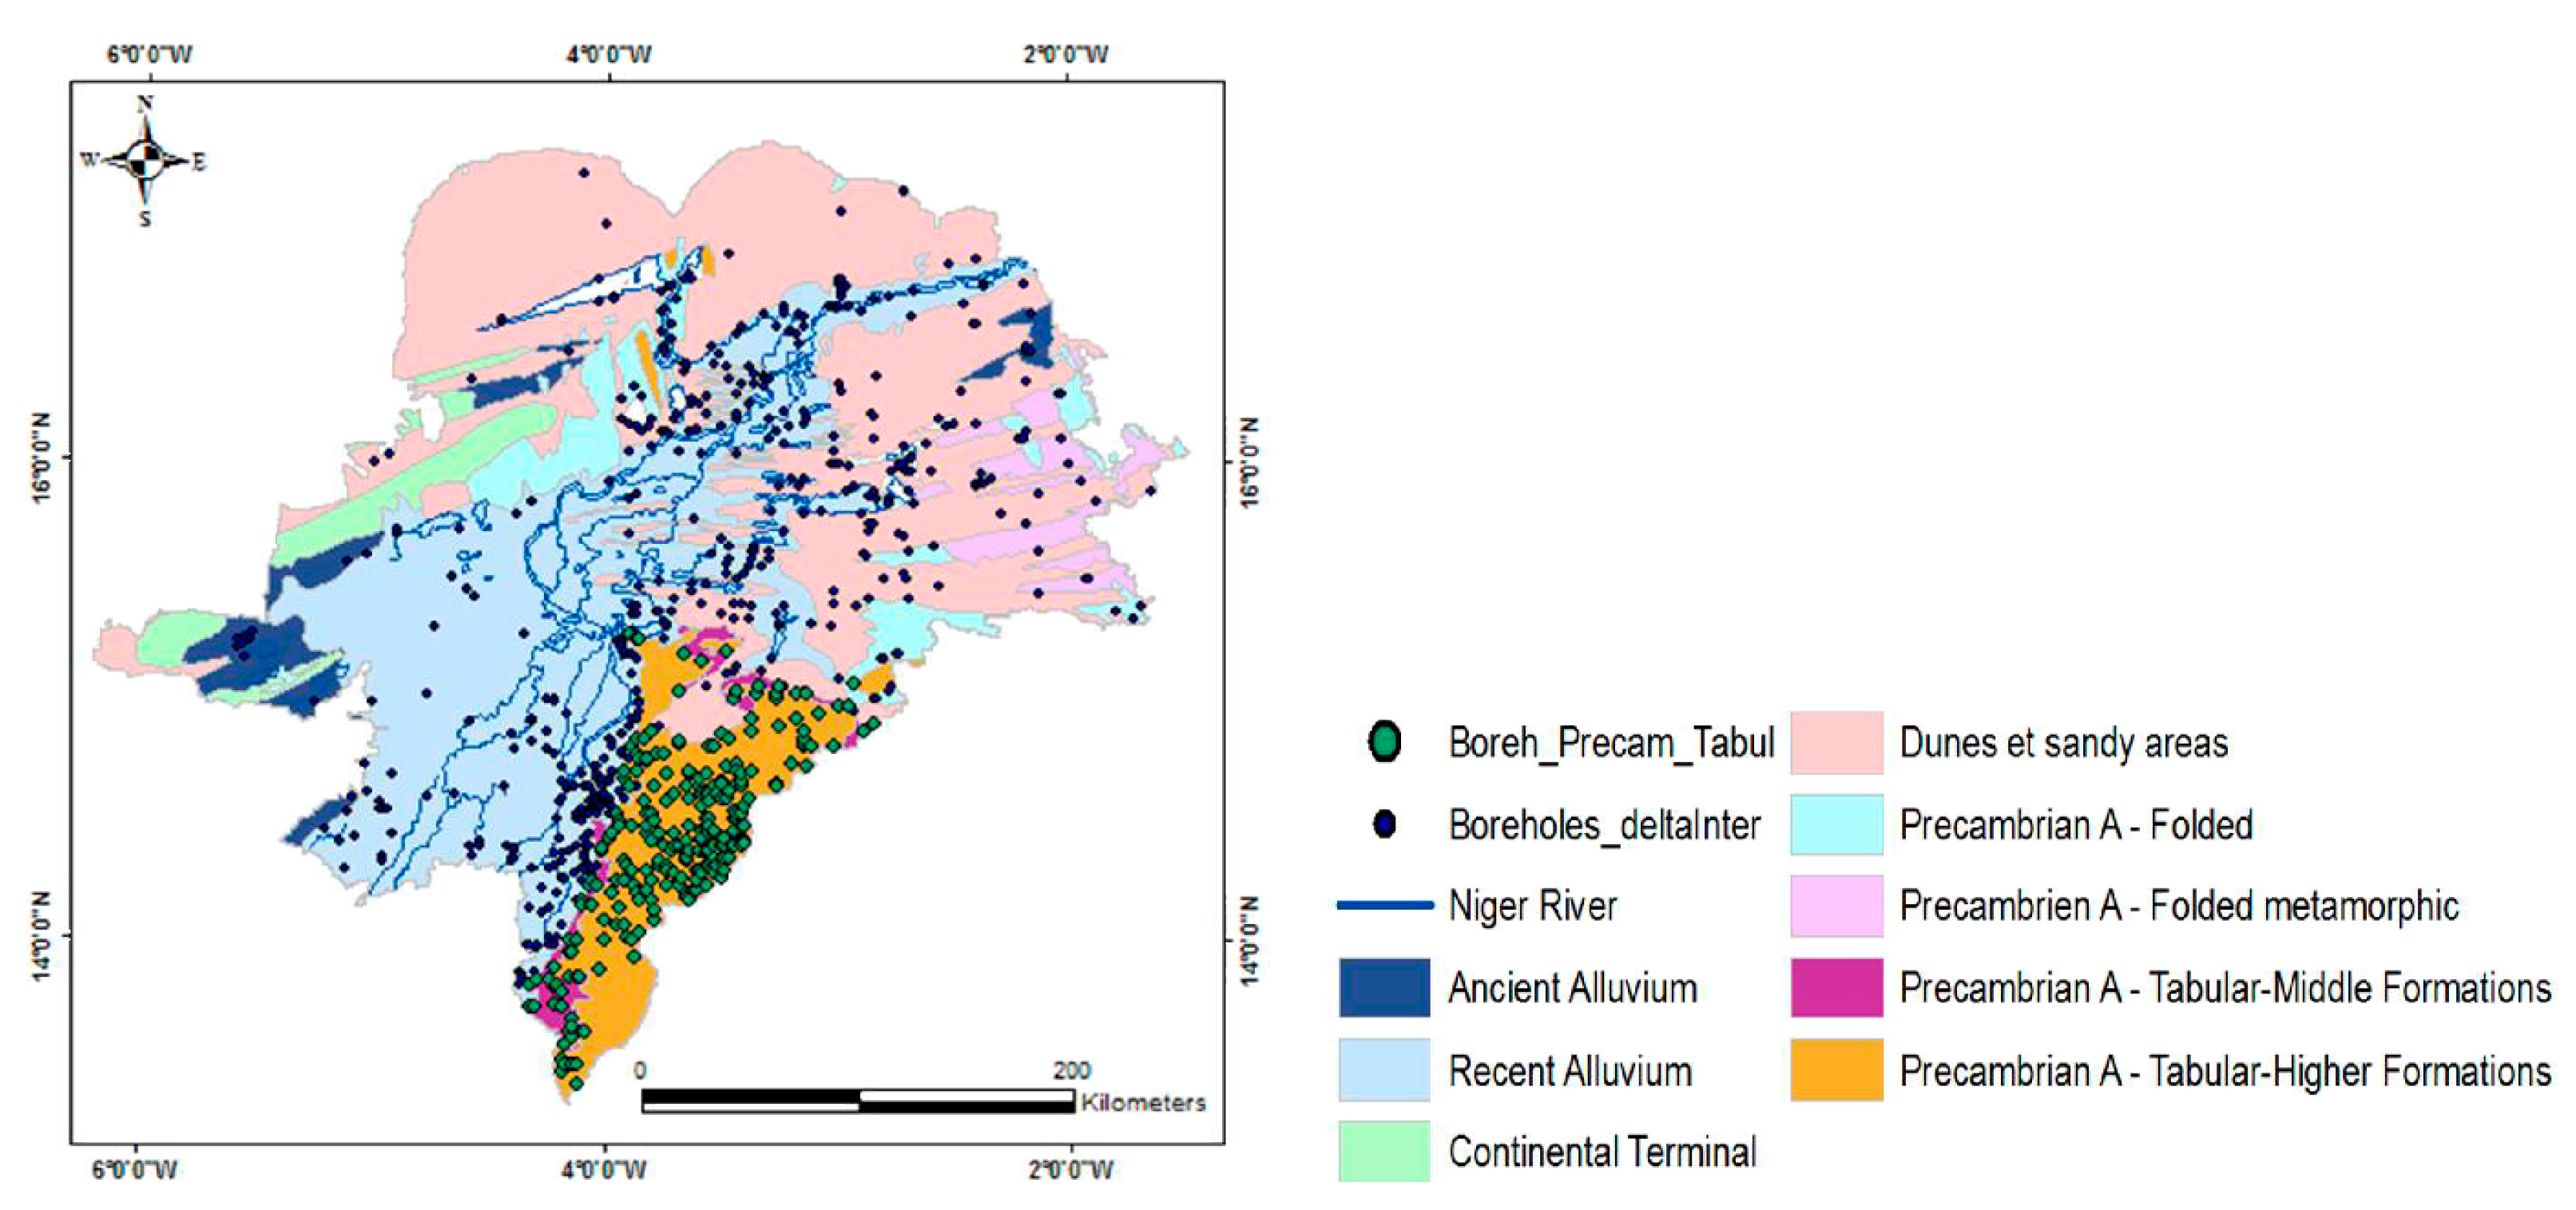
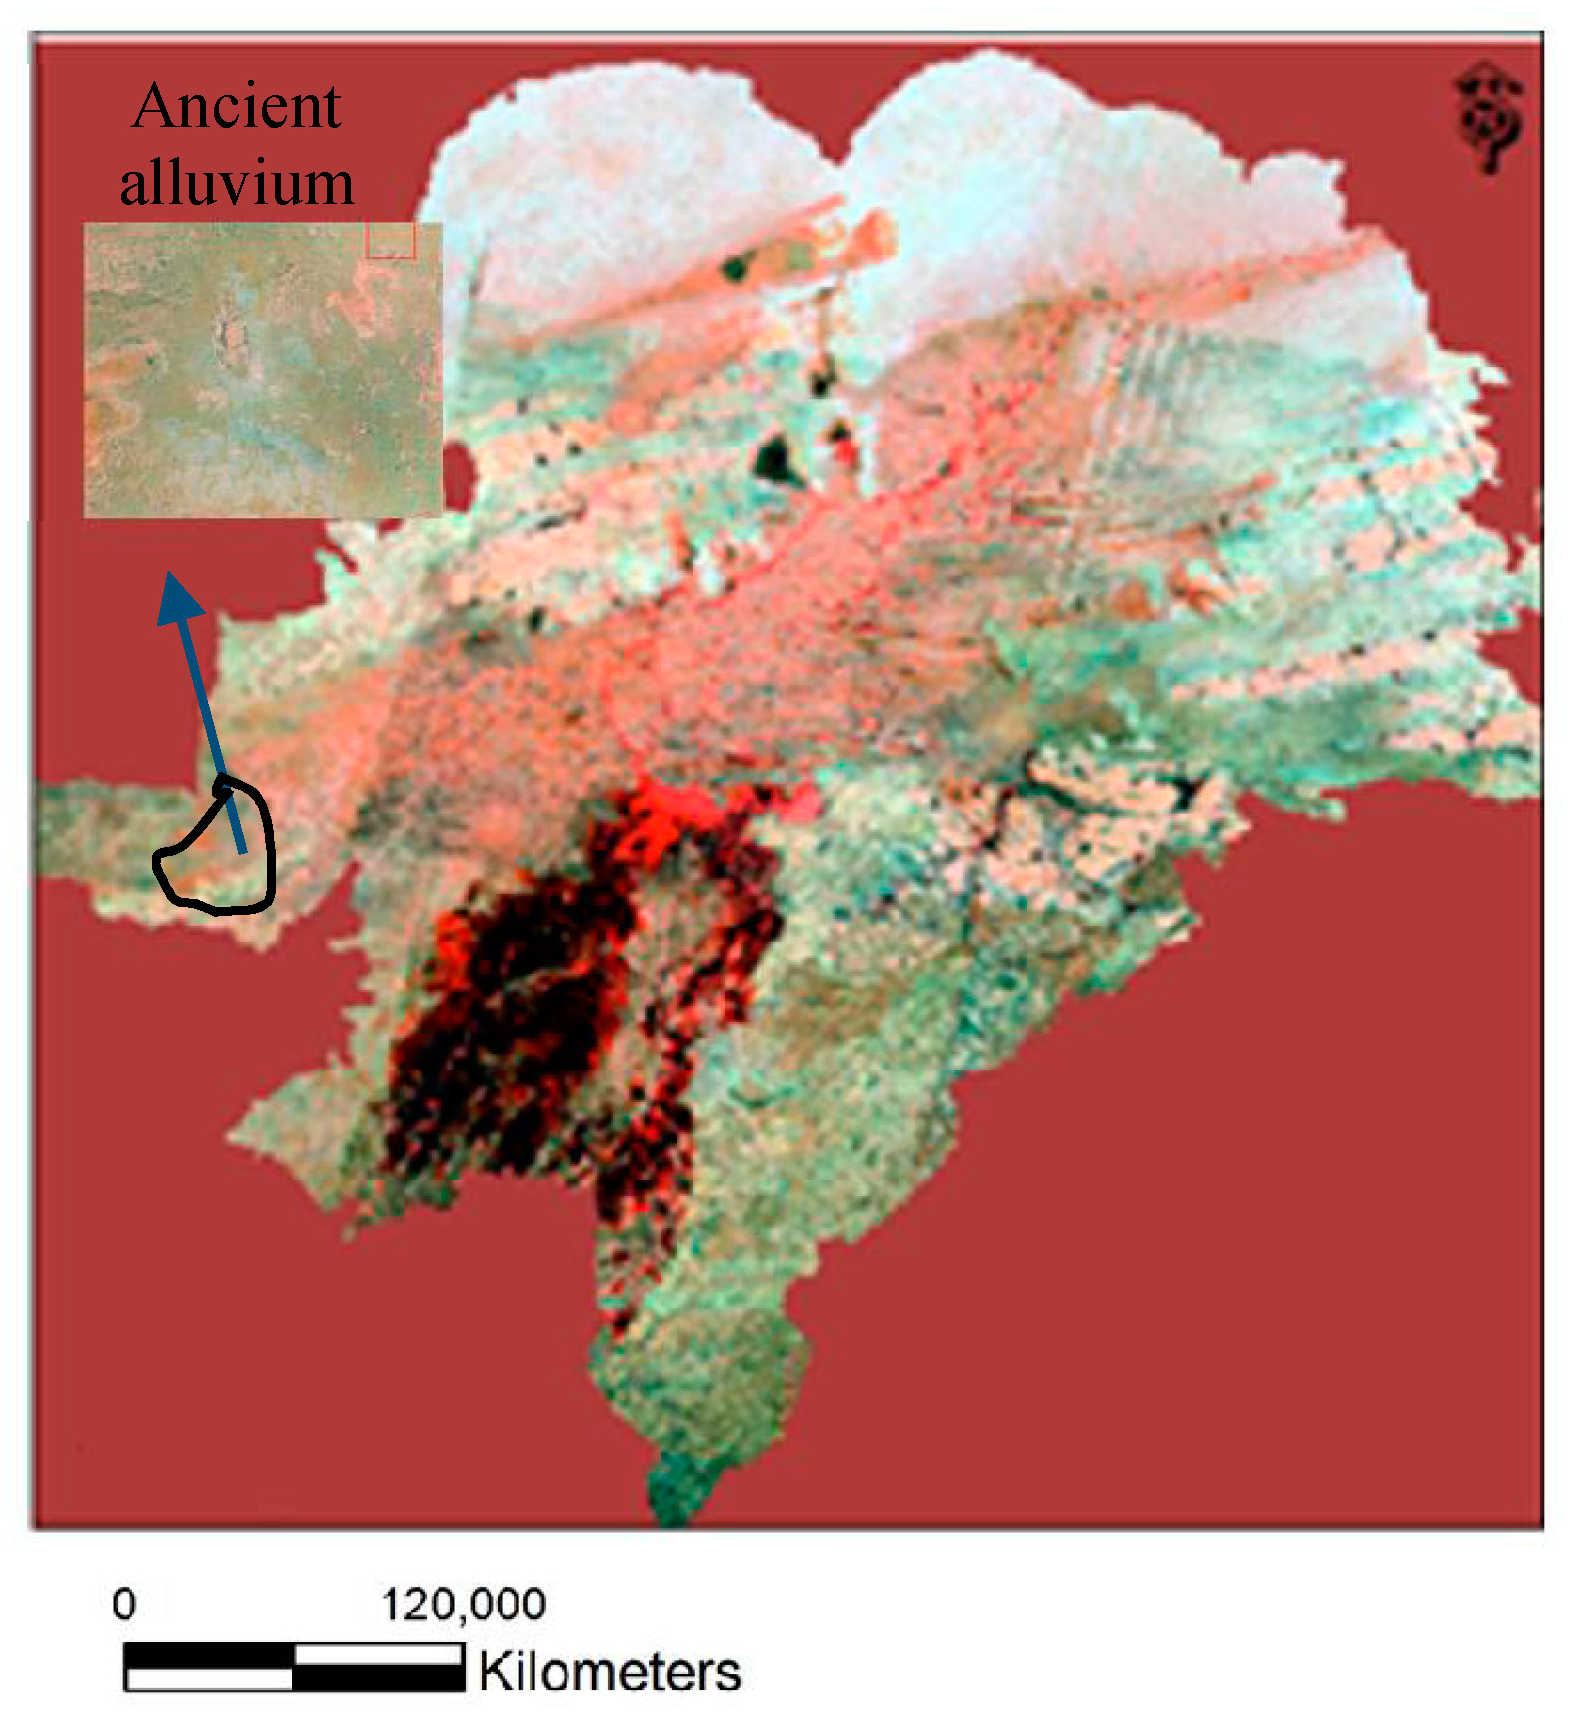
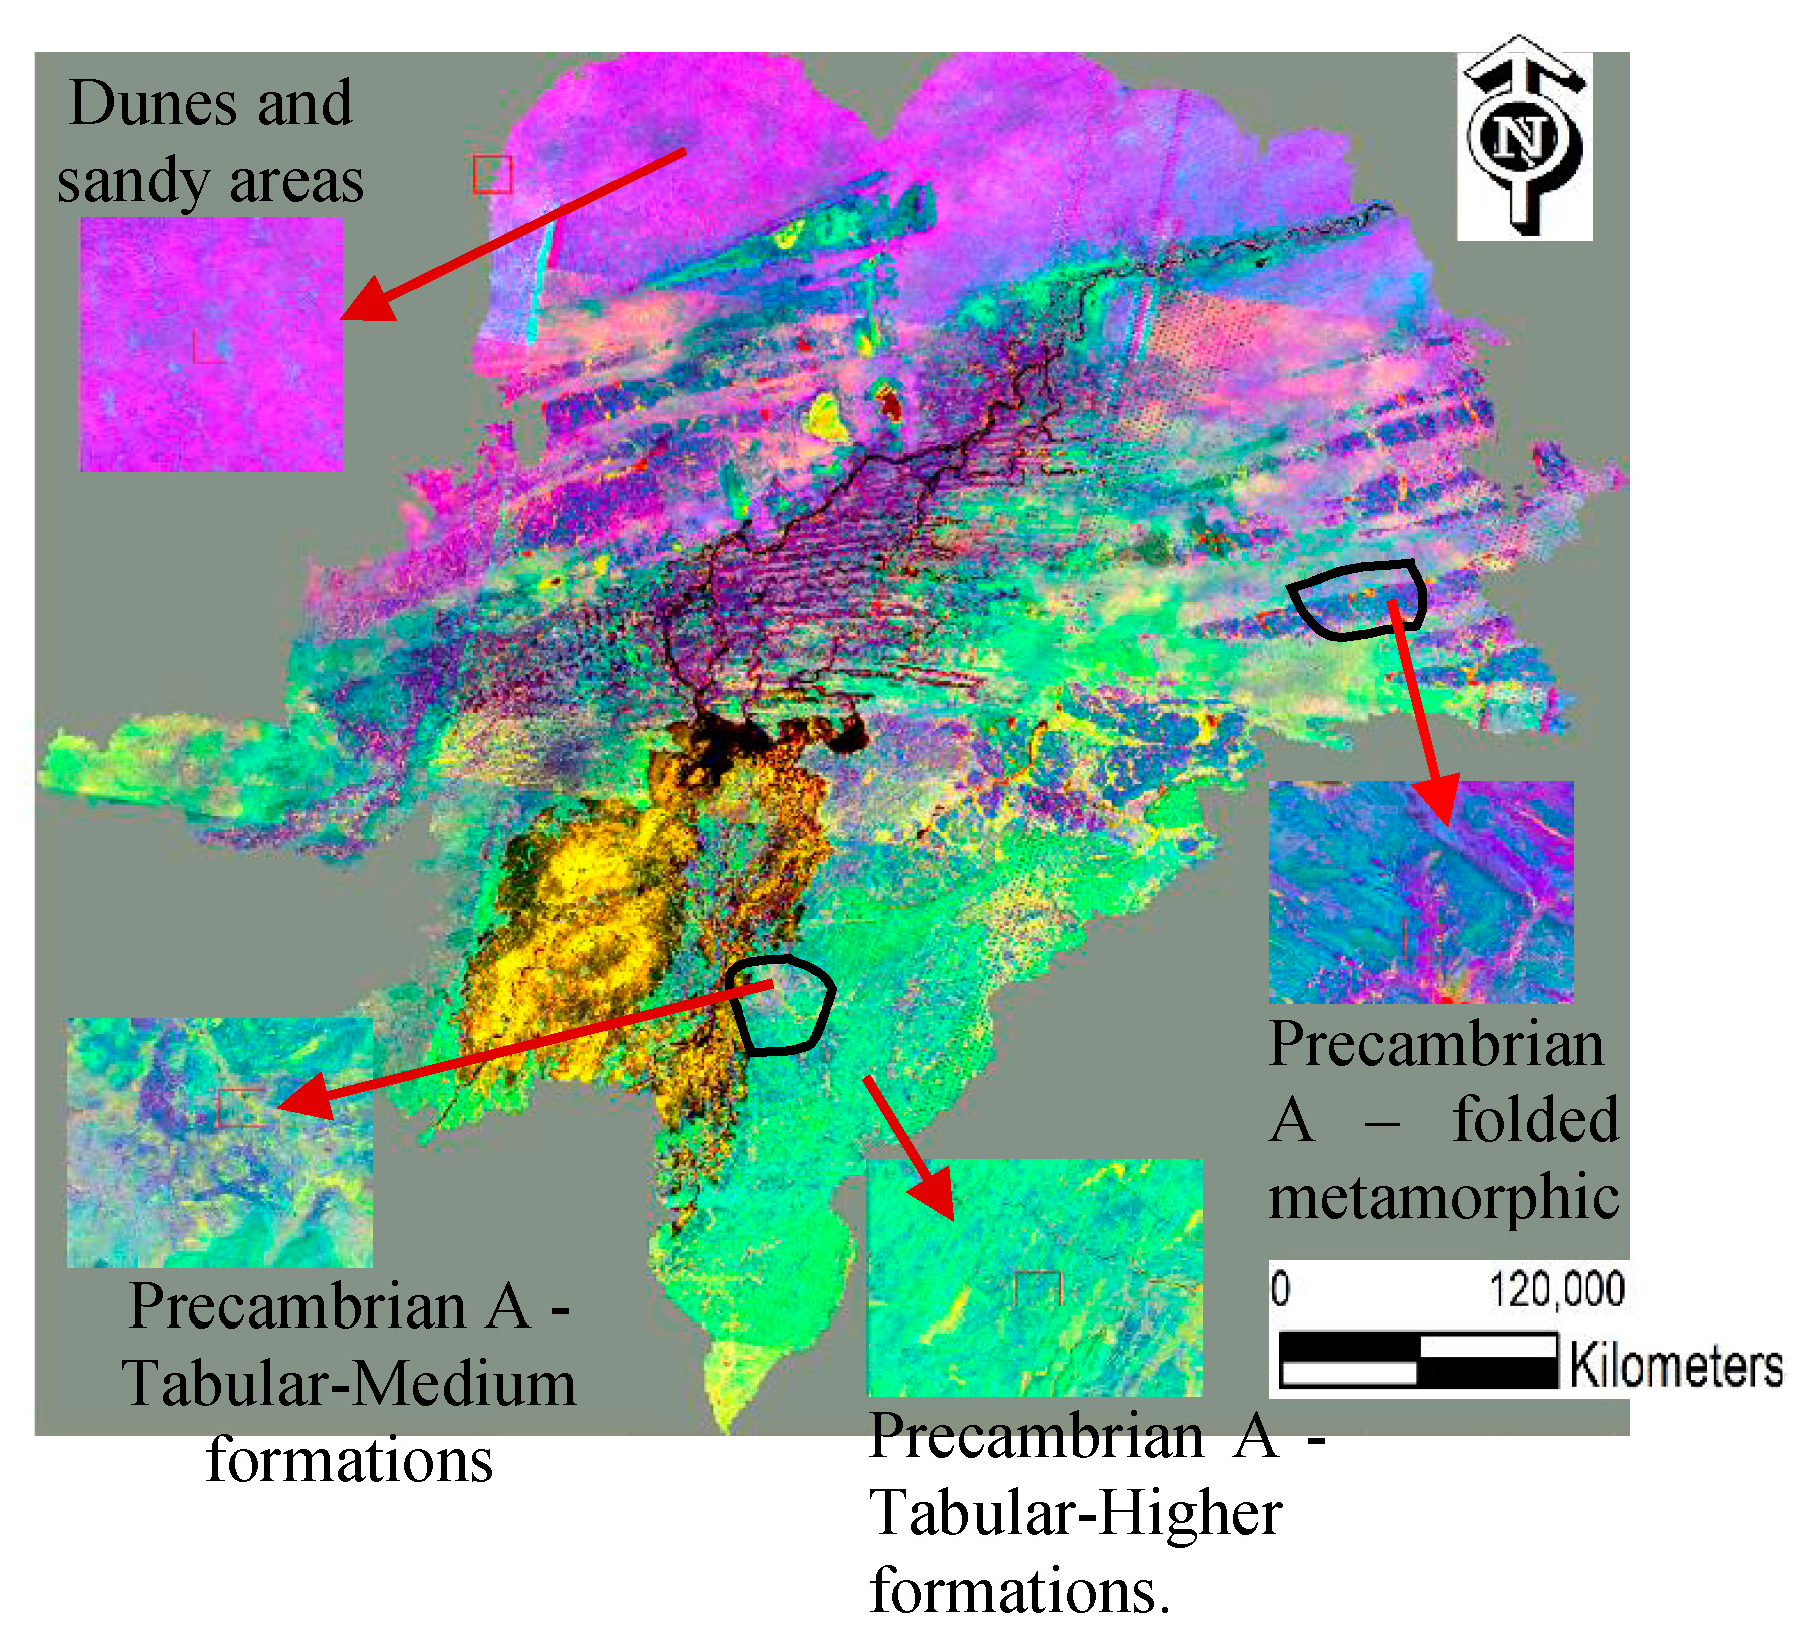
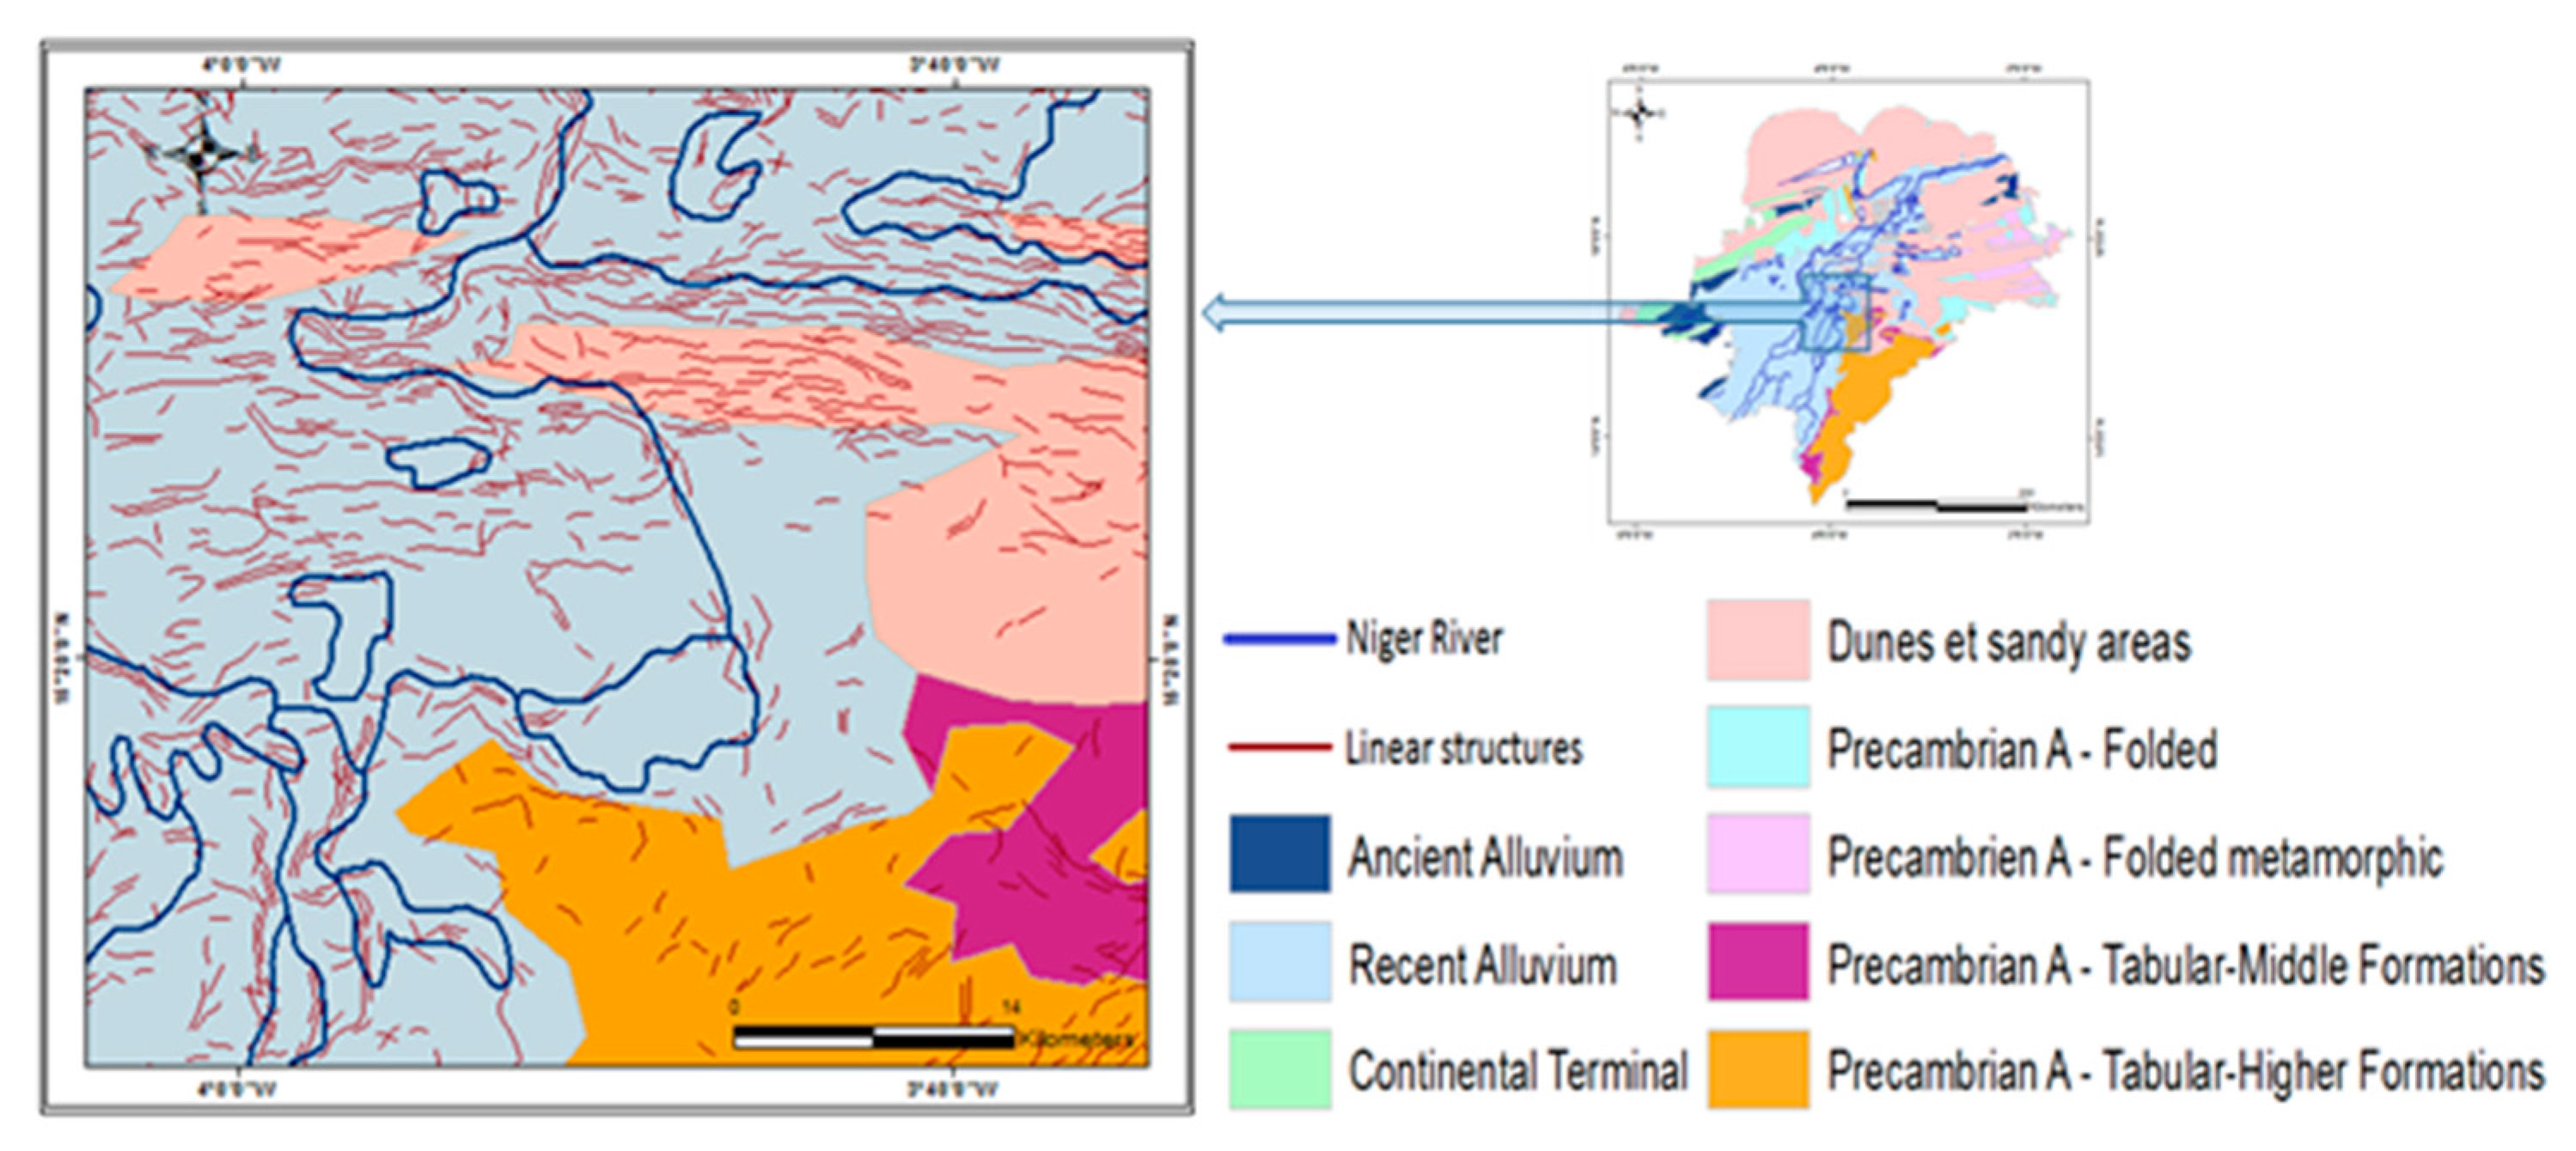
4.1. Lithological Mapping

Observation of the tones, textures, and arrangement of the various thematic objects contained in the image revealed the geological formations, as compared with pre-existing geological data of the area of interest. Figure 3 shows a color composition produced from the spectral bands, resulting from the application of image fusion techniques; namely, spectral enhancement (TM2, TM4, TM6). The three main areas of color represent the relevant regions for the analysis of this image.
In the central part of the study area can be clearly observed as a domain of degraded texture. This texture extended from the south to the northeast and was more widened to the south. The quaternary of dominant sandy lithology showed variable dispersed granules, gravels, clay sands and sandy clays in the pools of ponds and lakes [12,13]. Unlike the sandy formations in areas adjacent to floodplains, clay-dominated components in lowlands, ponds, and lakes tended to limit water exchange between flood waters and the underlying formations of the continental terminal, and play a fundamental role in the hydrology of the delta [14,15]. To the west of the study area, there were some small areas with coarse textures. This is the continental terminal, with “sandy” as the dominant lithology. Often, local lenticular layers, with layers of interstratified clays, laterite horizons of hard cuirass, or gravel, are also interstratified. Marls and lacustrine clays are formed locally in the lithological series. The thickness of the continental terminal is quite variable. The eastern part of the image shows a field in texture that is less smooth and less coarse, and is light brown in color. With a rounded form, it was identified as the formation of calcareous and quartzite of lenticular forms, which, together, correspond to Precambrian A-folded.
Band ratios based on the notion of reflectance reduced the topography effects and enhanced the contrast reflections between mineral surfaces [16,17,18]. Ratios TM4/TM3, TM4/TM5, and TM4/TM7 were realized, and the colored compositions generated from the neo-bands allowed lithological identification (Figure 4). A less-rough texture of blue-green was observed in the southwest part, with an extension towards the north. The identified lithology corresponded to limo-sandy alluvium (ancient alluvium).
Principal Component Analysis (PCA) consists of defining new channels that summarize the information contained in an image in multispectral space [19,20]. This method aims to maximize (statistically) the amount of information (or variance) of original data in a restricted number of components [11,21]. From the bands of Principal Components (PCs), a clear colored composition discriminated the different lithological units, and those same bands are specially used for the automatic extraction of linear structures (Figure 5). The smooth textured area was mostly located in the north and was the pink and blue color. The generated lithology was a mixture of dune and sand. A scratched structure, dark blue, was located to the east. These longitudinal textures on the eastern coast were identified as metamorphic schists. These metamorphic schists are part of the Precambrian A-folded metamorphic. Two different textures were identified in the south-east, the first a greenish color, and the second in violet crossed by yellow. The first occupied more space to the south and was also spread across some areas to the north-east of the study area. The existing lithology is schistose sandstone. The second was observed to the south in certain small areas representing granules of sandstone as its lithology. Considering the arrangement of these two lithological formations, they belong to the same stratigraphic family of the Precambrian A-Tabular [22]. The first (schistose sandstone) is Precambrian A-Tabular of higher formations, and the second (sandstone of granules) is Precambrian A-Tabular of medium formations.

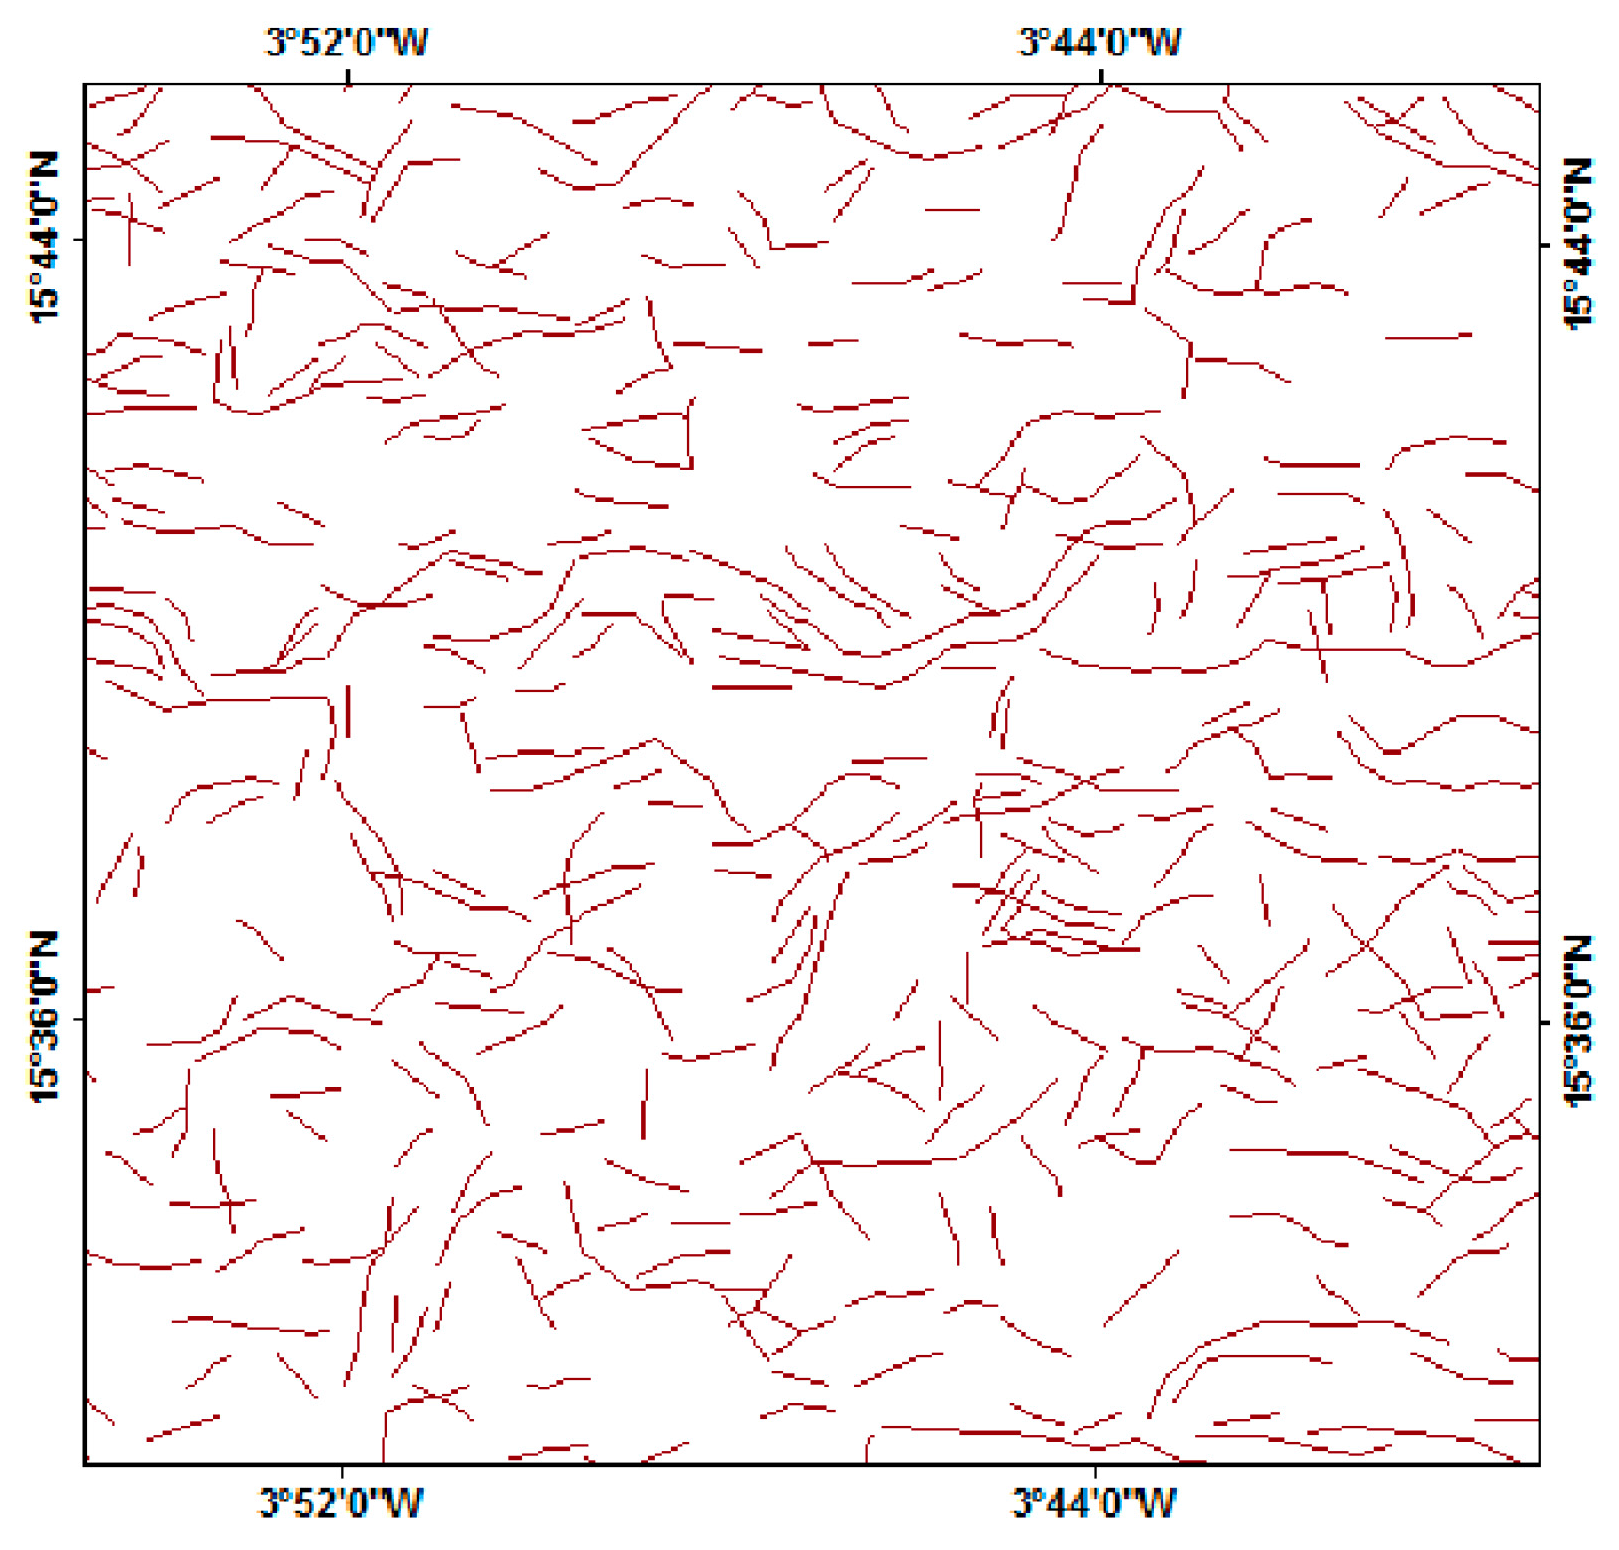
4.2. Structural Mapping

PCA images also allow the highlighting of linear structure networks, and, possibly, the geological accidents associated with it. Numerous regional linear structures have, thus, been automatically extracted from the geological formations of the PCA image. This leads to the formation of main corridors by the linear structure densities located from the center to the north and to the southeast. Figure 6 illustrates a linear structural map of the interior delta region.
This mode of extraction, based on a few parameters, was the object of vectorization of an important network of linear structures, ranging from a few meters to several kilometers. This map resulted from the exploitation of raw and derived images, which led to the delimitation of geological formations [23]. This map will be used to generate the litho-structural map. Based on this knowledge, the characterization of geological formations and hydrological analyses were carried out.

4.3. Characterization of the Aquifers

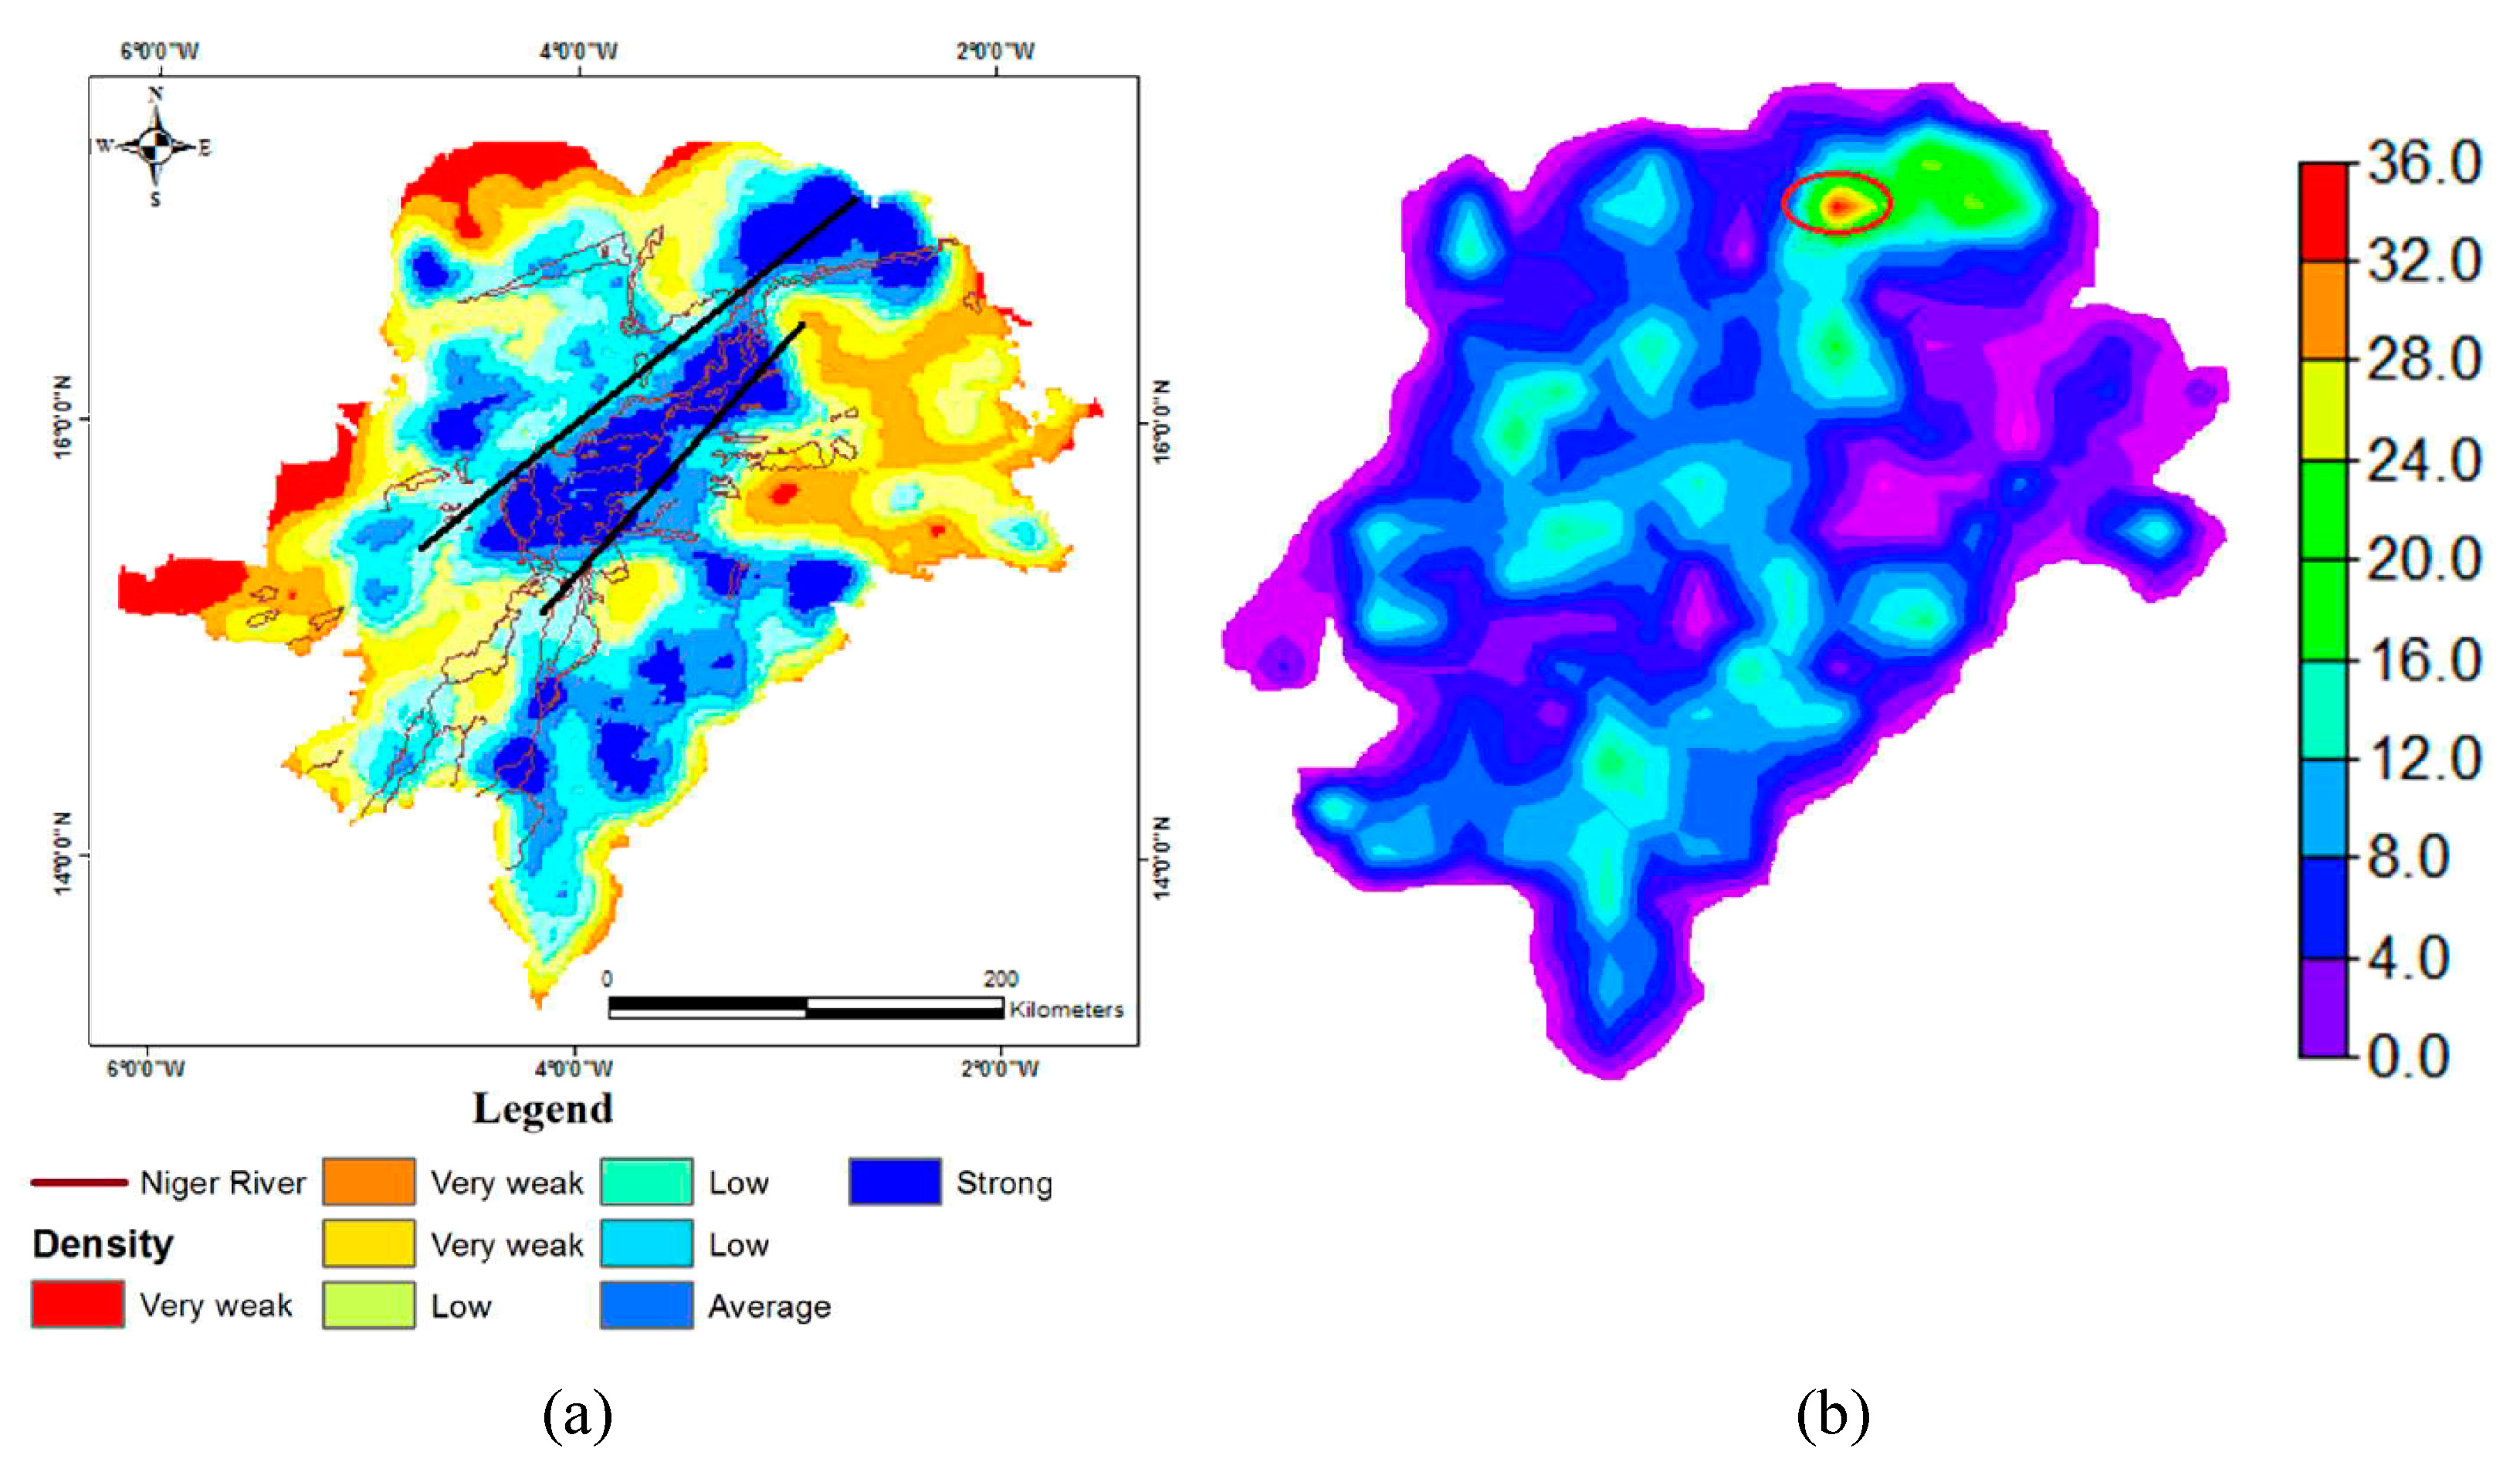
4.3.1. Study of the Intensity of Linear Structures

The realization of iso-value maps of fracture density distribution using stratigraphic layers permits better observation of this relationship. A global analysis of this map showed that high-density areas occupy less than a quarter of the studied surface. These high-density fractures occupy 16,507.84 km2 (12.52%) of the total area that covers the study area (Figure 7a). High-densities form two large blocks, located in the north and center areas, while still occupying the central hinge of the study area with extensions in the center/east and the east/south directions. A medium density zone in terms of the number of fractures clearly appeared along the regional axis Djene–Mopti–Bandjagara–Douentza. Low-density areas surrounded high-density areas and are located on South/east, east/center and center/north directions.
From a geological point of view, the high fracturing intensities corresponded mainly to the fields of recent alluvium deposits. An area with a high structural tendency, identified using remote sensing in the south of Tombouctou (in dunes and sandy areas) was also a high-density area of intersection of fractures (Figure 7b). The area of high densities corresponded to an underground corridor, which is expressed by the existence of low-lands, housing the Niger River and its tributaries, and by a large number of linear structures. The least-structured parts were identified as: On the one hand, precambrian A-folded metamorphic, the sand dunes and the sandy zones in the Gourma-rharous; and, on the other hand, in ancient alluvium, the continental terminal, and in one part of the recent alluvium deposits at Niono.

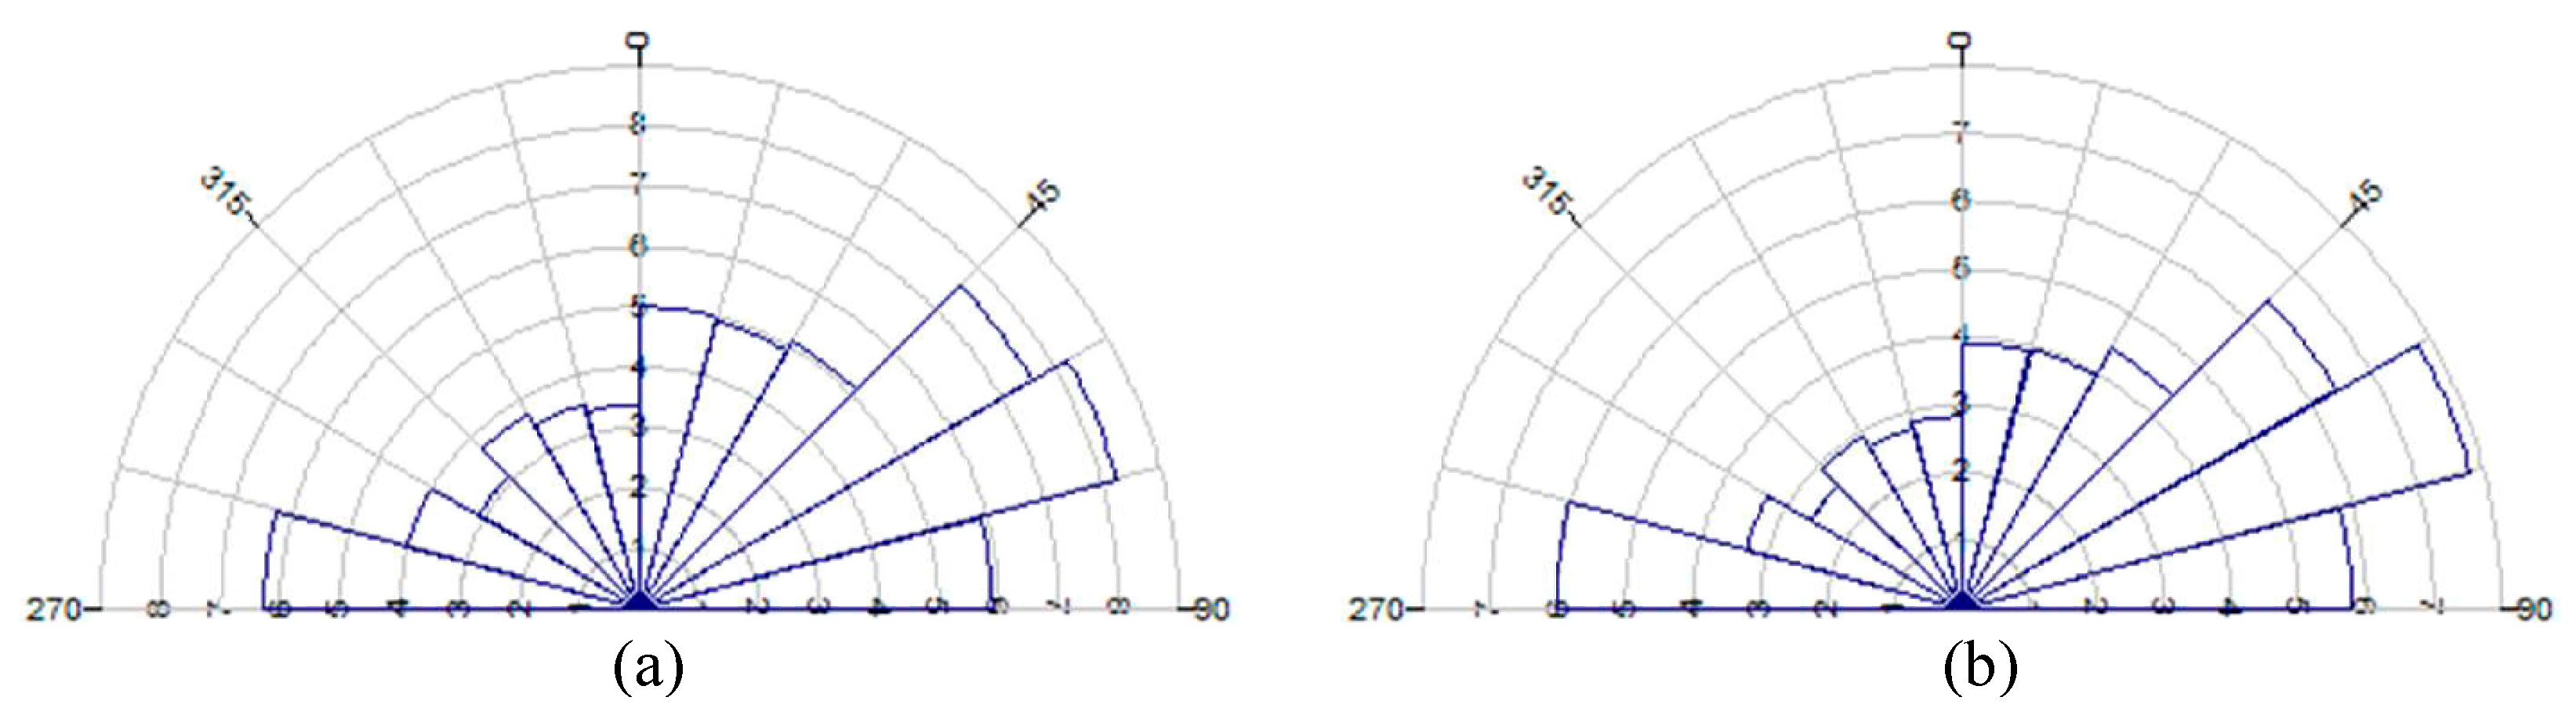
4.3.2. Statistical Analysis of Linear Structures

The fracture map obtained after various processing stages had approximately 82,869 linear structures of varying sizes, at an interval of 0.03 km; 9.069 km, with a mean of 0.648 km, a median of 0.524 km and a standard deviation of 0.410 km. Beyond the mean length of 0.648 km, are listed the majority of the linear structures which represent 64.06%. 84.35% of linear structures are less than 1 km, 99.98% are less than 5 km, which means only 15.63% of the linear structures have a length between 1 km and 5 km. Therefore, a low density of structures was located at the edges of the study area. This proved that high-density areas were suitable for groundwater circulation, including the central–north corridor with its contribution of watercourses. The rejection of these fractures, at great depths, shows a great influence on the retention of fluids.
Linear structures were grouped according to their orientation into 12 classes by an angular crescent of 15 degrees. The frequency and density of the fractures, per orientation class, were calculated. The directional fracturing rosettes, expressed in number and in length, are shown in Figure 8. The distribution of the fracturing on the directional rosette was almost homogeneous. Frequencies oscillated between 3% and 8.25%, and no family of fractures exceeded 9% in frequency. However, some families stood out, with frequencies close to 9%. These fragments were N60–75, N45–60, and N270–285 with frequencies between 5.5% and 9%, and N0–15, N15–30, N285–300 with frequencies between 4% and 5.5%. Apart from these families, the other frequencies were less than 4%. The analyses showed a strong similarity between length and frequency distributions of fractures. This result shows that the main directional classes of identified fractures appeared to be the longest. In other words, the most abundant fractures in frequency are also the longest.

4.3.3. Systems of Aquifers

The study area has five deep aquifer systems that correspond to main stratigraphic stages. They were classified into three categories, according to the type of groundwater deposit:
  • Crack-type aquifers are semi-continuous or discontinuous, depending on the density, extension, and degree of interconnection of cracking networks, which affect the host rock and its hydraulic relationship with surface layers in the overlay [24,25]. Cracked aquifers are represented by crystalline and sedimentary formations of the Precambrian.
  • Generalized aquifers are associated with low or unconsolidated formations with intergranular porosities, mainly consisting of deposits of continental origin, accumulated in large sedimentary basins from the Secondary to the quaternary.
  • These deep aquifer systems are covered by superficial aquifers located in lateritic alteration formations on the surface of plateaus or in the alluvial and colluvial deposits of the plains and valley bottoms. Depending on the thickness of the upper layer, and the local geomorphological and rainfall conditions, these superficial aquifers can be semi-continuous and in hydraulic connection with deep or discontinuous aquifers.
● Cracked Aquifers
Sedimentary, metamorphic, and Precambrian formations are characterized by very low intrinsic permeability. Water resources are almost exclusively associated with secondary permeability, originating, on the one hand, from cracking in the deep part of these formations, and, on the other hand, from alterations of their upper parts [26].
- Aquifer of the Precambrian Tabular
With an area of 15,374.8 km2 (Table 2), the Precambrian Tabular is the most important cracked aquifer in the region, and the most exploited, with 313 boreholes on a total of 970 boreholes of the study area (Figure 9). This subdivided aquifer corresponded to the sandstone strip occupying the southeastern part of the study area in the Sudano-Sahelian climatic zone. With the exception of the Dogon Plateau, where sandstones are flush, the Precambrian is almost completely covered by lateritic formations. The Precambrian is made up of monoclinal griseo-schistous formations, which were characterized by an important development of secondary permeability, with an average main water flow of 48 m, average alteration thicknesses of 16.6 m, and an average static level of 48 m/ground.
- Aquifer of the Precambrian folded Metamorphic
The Precambrian folded covers a total area of 11,558.71 km2 (Table 2). The aquifer of the Precambrian folded metamorphic has a width of 4061.68 km2, and differs from the Precambrian Tabular due to of its hydrogeological characteristics, with Gourma-Rharous beings the most extensive unit.
● Generalized Aquifers
These aquifers are characterized by permeability of intergranular types and by a continuous tablecloth covering of the major part of the study area (Sahelian and desert region), making up a total area of more than 59,883.81 km2 (45.41% of the study area). They are essentially constituted by detrital formations of continental origin, which accumulated since the secondary period in the Niger Basin.
- Aquifer of the Continental Terminal/Quaternary
This aquifer covers the vast alluvial plains that extend on either side of the Niger River. With a total area of around 54,746.69 km2 (Table 2), it is mainly located in the climatic and sub-desert zones of the sahalian area. The hydrogeological characteristics of this aquifer are related to the presence of permanent surface waters and the extension of the flood zones covered by the Niger River [25]. The continental terminal of the aquifer is composed of a mix of clays, sandy clays, and fine and coarse sands, often in lenticular and locally-gresified layers. Quartz and clay gravel or concretionary lateritic horizons are frequently intercalated in different parts of continental formations.
- Aquifer of the Continental Intercalary/Continental Terminal
This aquifer occupies certain portions in the western part of the study area, located in Niono, Niafunke, Tenekoun and Gorma-rharous, covering a total area of nearly 5137.12 km2, i.e., 3.90%. These ancient continental series are covered by quaternary dunes and, locally, by Holocene lacustrine deposits exposed in inter-dune valleys. Due to the depressed piezometry, which characterizes this aquifer system, the continental terminal and quaternary formations are generally de-watered and water resources are, therefore, mainly contained in the aquifer of the intercalary Continental [27]. These aquifer formations consist of local coarse sands and sandstone, with intercalations of more-or-less sandy clays. The water levels are deep with an average measurement of 45 m and a maximum depth of 60 m.
● Superficial Aquifers
Superficial Aquifers are recent formations, generally unconsolidated, of varying ages and origins. They play an important hydrogeological role as they constitute the first reservoir intercepting infiltration water generated by precipitation and runoff. The average thickness of the superficial aquifer is about 10 m. This aquifer is concentrated on the layers of superficial alteration (eluvial and colluvial) of other formations, and can be more-or-less thick and permeable, according to the nature of the original rock and fracture intensities. The presence of superficial alteration layers may be important in the vicinity of rivers because these rivers often settle in zones with a substratum, but also because of better feeding conditions.

5. Discussion

The application of processing and preprocessing techniques resulted in a radiometric enhancement of images, making them more expressive and finer for mapping structural and lithological factors. Based on the stratigraphic boundaries of the existing geological map, the images were enhanced to delineate the different geological formations. The colored composition, produced by the fusion of the images of the different parts of the electromagnetic spectrum, improved the differences in the spectral properties of various lithological formations, which facilitate their mapping. The analysis and interpretation of all these derived images resulted in the updating of the map of certain geological formations of the interior delta region of Niger. This update affected all geological formations, including central limits (gravel and laterites), north/east and south/west. Some formations are imposed by a high density of linear structures, extended in the south/east, east/center and center/north directions. Similarly, some northwest boundaries are defined by the stratigraphic formation of the terminal/quaternary continental. Few linear structures were extracted at this regional level, from Niono to Goundam. The updating also concerned the boundaries of the Precambrian folded in the East.
The processing of satellite images through combination of ratios of TM4/TM3, TM4/TM5, and TM4/TM7, highlights the biggest part of the ancient alluvium formation in Niono, in the southwest of the study area. This is the case for Precambrian folded formations, in term of structural tendency (weak structural tendency), located in these formations at the edge of the study area.
Processing of the images using the PCA technique followed by color composition permitted to complete the update of the geological map of the inner delta region of Niger. The use of 6 bands of Landsat TM from the total of 7 bands significantly contributed to improvement of the quality of geological discrimination. The improved contrast of the histogram had a positive impact on the images. In fact, the fusion of high-resolution spectral bands generated rich images, of which analysis and interpretation facilitated the identification of geological formations. Despite the richness of the derived images, the differences between certain geological surfaces are sometimes difficult to see. Indeed, in each of these surfaces, there appeared zones in which the variation in color tones was very poor. The contrast remained very low despite image enhancement. Precambrian A-Tabular-Medium formations and Precambrian A-Tabular-Higher formations encountered this difficulty. This is also the case in some formations of cracked aquifers and generalized aquifers, respectively, the metamorphic schist and dunes and sandy areas. These obstacles in identification were overcome using remote sensing and GIS techniques. In the north of the study area has been identified a strong density zone of nodes (intersection of the linear structures), which allows strongly to orientate studies of fluids exploration (oil, gas) in the region. The 672 node areas (8332.19 km2) in the dunes and sandy area units were also assumed to have deep rejects (pores), which condition the flow and retention capacities of fluids (liquid or gas). The litho-structural (Figure 10) mapping, resulting from remote sensing, fixes the lithological boundaries that remain globally similar to those defined in existing maps.

6. Conclusions

The results of this work confirmed interest in the use of numerical imaging in lithological and structural mapping. Indeed, the investigation of lithology in the Delta Interior of Niger using a combination of different methods of digital processing, namely spectral enhancement, Principal Component Analysis, and ratio bands, led to discrimination of different stratigraphic units of the interior delta. PCA neo-bands derived from the elimination of raw image noise (of 95%) also highlighted the linear structures for better automatic extraction. This extraction resulted in the elaboration of a detailed map of the linear structures of the inner delta of Niger after validation of approximately 82,869 fractures. Thus, analysis of the linear structures through their densities and their nodes, in the center and to the north, shows conditioning of mobilization of underground waters, and, more deeply, the flow and retention of fluids. These different processing methods led to the litho-structural mapping of the region, which proposes an update of the old geological map and the creation of a new structural map of the region.

Acknowledgments

This paper was funded by the International Exchange Program of Harbin Engineering University (China) for Innovation-oriented Talents Cultivation. I would like to thank the lab of biomimetic micro robot and system (China), and the lab of water and environment of National School of Engineers (Mali).

Author Contributions

Abdramane Dembele designed the whole study from the framework to the elaboration of a Litho-structural mapping using multiple satellite data. Xiufen Ye revised the paper.

Conflicts of Interest

The authors declare no conflict of interest.

References

  1. Bodin, J.; Razack, M. Image analysis applied to the automatic treatment of fracture fields, “L’analyse d’images appliquée au traitement automatique de champs de fractures. Propriétés géométriques et lois d’échelle” (Geometric properties and laws of scale). Bull. Soc. Géol. Fr. 1999, 170, 579–593. [Google Scholar]
  2. Xue, C.; Fan, X.; Dong, Q.; Liu, J. Using remote sensing products to identify marine association patterns in factors relating to ENSO in the Pacific Ocean. ISPRS Int. J. Geo-Inf. 2017, 6, 32. [Google Scholar] [CrossRef]
  3. Koudou, A.; Assoma, T.V.; Adiaffi, B.; Ta Youan, M.; Kouame, K.F.; Lasm, T. Analyses Statistique Et Geostatistique De La Fracturation Extraite De L’Imagerie Asar Envisat Du Sud-Est De La Côte D‘ Ivoire’. LARHYSS J. 2014, 20, 147–166. [Google Scholar]
  4. Tziachris, P.; Metaxa, E.; Papadopoulos, F.; Papadopoulou, M. Spatial Modelling and Prediction Assessment of Soil Iron Using Kriging Interpolation with pH as Auxiliary Information. ISPRS Int. J. Geo-Inf. 2017, 6, 283. [Google Scholar] [CrossRef]
  5. Gbele, O.; Gnammytchet, B.K.; Bertin, D.Y. The Remote Sensing Imagery, New Challenges For Geological And Mining Mapping In The West African Craton - The Example The First Steps of Remote Sensing Imagery for Geological and Mining Mapping. Int. J. Geogr. Geol. 2013, 1, 1–13. (In French) [Google Scholar]
  6. Olivry, J.; Bricquet, J.P.; Mahe, G. Variabilité de la puissance des crues des grands cours d’eau d’Afrique intertropicale et incidence de la baisse des écoulements de base au cours des deux dernières décennies. In Proceedings of the Abidjan’98 Conference, Abidjan, Côte d’lvoire, November 1998. [Google Scholar]
  7. Zare, A.; Illou, M.; Fossi, S.; Bio, T.M.; Mahe, G.; Paturel, J.E.; Barbier, B. Perception of hydrological changes and adaptation strategies in the Inner Niger Delta in Mali. In Proceedings of the HP1, IAHS-IAPSO-IASPEI Assembly, Gothenburg, Sweden, 22–26 July 2013; Volume 358, pp. 129–130. [Google Scholar]
  8. Taubenböck, H.; Ferstl, J.; Dech, S. Regions Set in Stone—Delimiting and Categorizing Regions in Europe by Settlement Patterns Derived from EO-Data. ISPRS Int. J. Geo-Inf. 2017, 6, 55. [Google Scholar] [CrossRef]
  9. Mwaniki, M.W.; Moeller, M.S.; Schellmann, G.; Hue, I. A comparison of Landsat 8 (OLI) and Landsat 7 (ETM +) in mapping geology and visualising linear structures: A case study of central region Kenya. Int. Arch. Photogramm. Remote Sens. Spat. Inf. Sci. 2015, XL, 11–15. [Google Scholar]
  10. Rimal, B.; Zhang, L.; Keshtkar, H.; Wang, N.; Lin, Y. Monitoring and Modeling of Spatiotemporal Urban Expansion and Land-Use/Land-Cover Change Using Integrated Markov Chain Cellular Automata Model. ISPRS Int. J. Geo-Inf. 2017, 6, 288. [Google Scholar] [CrossRef]
  11. Lucas, G. Investigating the Potential of Landsat 8 OLI Satellite Imagery for Geological Mapping in Namibia. In Proceedings of the Roy Miller Symposium, Windhoek, Namibia, 18–20 August 2014; p. 2005. [Google Scholar]
  12. Kwak, Y. Nationwide Flood Monitoring for Disaster Risk Reduction Using Multiple Satellite Data. ISPRS Int. J. Geo-Inf. 2017, 6, 203. [Google Scholar] [CrossRef]
  13. Censier, C.; Olivry, J.C.; Briquet, J.P. Les Apports Detritiques Terrigenes Dans la Cuvette Lacustre du Niger entre Mopti et Kona (Republique du Mali). In Proceedings of the Great Fluvial Basins, Paris, France, 22–24 November 1993; pp. 22–24. [Google Scholar]
  14. Thibault, M.; Mod, M. Modélisation hydrodynamique couplée 1D-2D du delta intérieur du fleuve Niger. 1D-2D Coupled Hydrodynamic Modeling of the Niger River Inland Delta. Master’s Thesis, Higher institute of Agronomic, Agri-Food, Horticultural and Landscape Sciences, Rennes, France, 2014; p. 41. [Google Scholar]
  15. Li, S.; Cui, Y.; Liu, M.; He, H.; Ravan, S. Integrating Global Open Geo-Information for Major Disaster Assessment: A Case Study of the Myanmar Flood. ISPRS Int. J. Geo-Inf. 2017, 6, 201. [Google Scholar] [CrossRef]
  16. PCI Geomatica. PCI Geomatica user’s Guide Version 9.1; PCI Geomatica: Richmond Hill, ON, Canada, 2001. [Google Scholar]
  17. Schowengerddt, R.A. Technics for Image Processing and Classification in Remote Sensing; Academic Press: New York, NY, USA, 1983. [Google Scholar]
  18. Madani, A. Assessment and Evaluation of Band Ratios, Brovey and HSV Techniques for Lithologic Discrimination and Mapping Using Landsat ETM + and SPOT-5 Data. Int. J. Geosci. 2014, 2014, 5–11. [Google Scholar] [CrossRef]
  19. Estornell, J.; Martí, J.M.; Sebastiá, T.; Mengual, J. Principal Component Analysis applied to remote sensing. Model. Sci. Educ. Learn. 2013, 6, 83–90. [Google Scholar] [CrossRef]
  20. Servat, É.; Paturel, J.E.; Lubès-Niel, H.; Kouamé, B.; Masson, J.M.; Travaglio, M.; Marieu, B. De différents aspects de la variabilité de la pluviométrie en Afrique de l’Ouest et Centrale non sahélienne. Rev. Sci. Eau/J. Water Sci. 1999, 12, 363–387. [Google Scholar] [CrossRef]
  21. Franchi, G.; Angulo, J. Morphological Principal Component Analysis for Hyperspectral Image Analysis †. ISPRS Int. J. Geo-Inf. 2016, 5, 83. [Google Scholar] [CrossRef]
  22. Aranyossy, J.-F.; Njitchoua, R.; Zuppi, G.M. Input of Environmental Isotopes in the Study of the Recharge and the Flow Dynamic of Aquifers; No. ST/pub/747; IAEA: Vienna, Austria, 1995; pp. 309–324. [Google Scholar]
  23. Picouet, C. Géodynamique d’un hydrosysteme tropical peu anthropisé, le bassin supérieur du Niger et son delta intérieur. Ph.D. Thesis, Université de Montpellier II, Montpellier, France, 1999; p. 470. [Google Scholar]
  24. Hydrosyst, G.I.P. “Projet de zone atelier du Delta intérieur du Niger au Mali,” (Inner Delta Workshop Project in Mali). In Proceedings of the Séminaire Franco-Malien du GIP Hydrosystèmes, Paris, France, April 1997; p. 42. [Google Scholar]
  25. Mahe, G.; Orange, D.; Mariko, A.; Bricquet, J.P. Estimation of the flooded area of the Inner Delta of the River Niger in Mali by hydrological balance and satellite data. In Hydro-climatology: Variability and Change; International Association of Hydrological Sciences (IAHS): Wallingford, UK, 2011; pp. 138–143. [Google Scholar]
  26. Randersen, I.; Dione, O.; Holder, M.J.; Olivry, J.C. Le Bassin du Fleuve Niger Vers une Vision de Développement Durable; World Bank: Washington, DC, USA, 2006; p. 172. [Google Scholar]
  27. Mariko, A.; Mahe, G.; Orange, D.; Royer, A.; Nonguierma, A.; Amani, A.; Servat, E. Suivi des Zones D’inondation du Delta Intérieur du Niger (Monitoring Flood Zones in the Niger’s Interior Delta); IRD: Bondy, France, 1999; pp. 231–244.
Figure 1. Presentation of the study area; A: Continental terminal/Intercalary; B: Continental terminal/quaternary; C: Precambrian folded; D: Precambrian tabular.
Ijgi 06 00335 g001
Figure 2. Flow diagram of Study.
Ijgi 06 00335 g002
Figure 3. Spectral enhancement of the composite color image (2, 4, 6).
Ijgi 06 00335 g003
Figure 4. Image RGB obtained with the neo bands generated by the ratios.
Ijgi 06 00335 g004
Figure 5. RGB image obtained with Principal Components (PCs) bands.
Ijgi 06 00335 g005
Figure 6. Map of the linear structures of the inner delta of the Niger.
Ijgi 06 00335 g006
Figure 7. (a) Fracture density forming the Center–North corridor; (b) Intersection of the fractures.
Ijgi 06 00335 g007
Figure 8. Distribution diagrams: (a) Frequency of linear structures; (b) Length of the linear structures.
Ijgi 06 00335 g008
Figure 9. Location of boreholes on the lithological background.
Ijgi 06 00335 g009
Figure 10. Litho-structural Map of Inner Delta of Niger.
Ijgi 06 00335 g010
Table 1. Automatic extraction parameterization element.
NamesParametersValuesUnits
FiRaFilter Radius10Pixels
EGThEdge Gradient threshold60Pixels
CLThCurve length threshold30Pixels
LFEThLine filter error threshold3Pixels
ADThAngular Difference threshold30degrees
LDThLinking distance threshold20Pixels
Table 2. Hydrogeological subdivisions of the aquifers.
Types of AquifersStratigraphic StagesCode AQFLithology DominantArea (km2)Percent %
Generalized aquifersContinental terminal/quaternaryCTQDunes and sandy, Clays Sandy 54,746.741.5
Continental terminal/IntercalaryCTIsandy clays, laterite5,137.1 3.9
Cracked aquifersPrecambrian TabularPCTGranule, schistose sandstone, sandstone of granules15,374.811.7
Precambrian foldedPCFmetamorphic schist, calcareous, quartzites11,558.78.8
Superficial aquifersQuaternaryQATGravels, sandy, laterite45,069.334.2

