1. Introduction
Automatic collection of Global Positioning System (GPS) data is the first step to look into people’s mobility habits [
1]. GPS data facilitates several tasks: visualisation of trips’ origin, destination, trajectory as well as the estimation of travel times, distances and speeds, etc. More importantly, GPS data eliminate individuals’ misperception of travel times and distances, which tend to be rounded to upper values [
2]. In practice, to extract useful information from the massive amount of raw data generated by GPS devices [
3], several processing steps must be carried out.
Nevertheless, the advantages of using GPS technologies in travel studies and the effectiveness of GPS data in capturing trip parameters have already been demonstrated [
4,
5,
6]. Recent studies have evaluated the use of GPS data for both trip tracking and transportation-mode detection without the support of questionnaires [
7,
8]. Results showed that trip identification deviates slightly from the census data, whereas, for mode detection, it was difficult to distinguish transportation modes with similar speed—for example, bus and bike trips. Strongly linked to the processing of GPS points are map-matching methods which are needed to align a sequence of locations (GPS trajectories) with a road network. Map-matching of GPS trajectories allows both the extraction of road features (e.g., road type and surface) and linkage with relevant places (e.g., home, work, school, shop, etc.) in the road network. In [
9], the authors proposed a probabilistic map-matching approach to overcome uncertainty caused by poor quality of the GPS data captured by smartphones. In [
10], location uncertainty caused by missing information of GPS trajectories was addressed. The authors proposed a path finder approach to deal with this issue.
Most research works based on GPS data have focused on traditional bicycles and cars. Studies on user behaviour for e-bike owners are still scarce and report relatively small data sets. In [
11], the authors analysed GPS data generated from a bike sharing system with the goal of comparing safety levels of e-bikes against bikes. This study gathered data from 20 bicycles over a two-year period. In [
12], a larger dataset was used: 1398 Austrians who purchased an e-bike between 2009 and 2011. However, this study contains only survey information with the aim of combining concepts of technology adoption with factors derived from research on mobility behaviour. Results showed that e-bike early adopters are older than 60 and use it for leisure trips. The use of the e-bike for working and shopping trips was influenced by both a supportive social environment and the need for physical activity. Another study on early adopters interviewed 28 e-bike owners in Oregon (United States): it focused on understanding their profile and the reasons behind the purchase of the e-bikes [
13]. The authors found various potential demographic markets for e-bike adoption: women, older adults and people with physical limitations. In addition, e-bikes were not viewed as an alternative for scooters or motorcycles but partially for traditional bicycles. E-bike adoption, in the context of health benefits, was studied in [
14] with the purpose of understanding if sedentary people would consider it as an interesting alternative for daily commuting trips. Results from eighteen people showed how the e-bike could help to overcome major topographical and logistic barriers.
Despite the growing body of knowledge about e-bikes, we agree with Fishman and Cherry [
15], who mentioned a lack of a large-scale analysis on the travel behaviour for e-bikes. The authors highlighted this issue as one of the most critical gaps for emerging research topics related to e-bikes. Another important aspect that is mentioned by Fishman and Cherry concerns the need to quantify the influence of e-bikes on travel behaviour.
To encourage people to do cycling as their daily urban transportation mode and rendering it competitive with other modes, riding a bicycle has to be physically possible, safe and attractive. From here stems the importance of creating an integrated cycling infrastructure and policies that consider cyclists’ needs (e.g., design of the street, continuity of the route, etc.).
To do so, investments in making bike use more appealing (improvement of bicycle paths, introducing bike or e-bike sharing systems, etc.) are necessary, but such interventions should be preceded by an exploratory phase aimed at gaining additional insights about the way people perceive e-bikes as a transportation alternatives, and under which conditions they will favour e-bikes instead of cars for commuting trips. Furthermore, it is important to identify key locations where investment in cycling infrastructure would be most valued, hence improving the overall utilisation of the cycling network in the region. This involves understanding the travel behaviour of cyclists or of potential cyclists and the factors influencing route choices.
This paper contributes to the research line, it provides insights for better understanding e-bike usage (e.g., purpose of the trips, route characteristics, weather conditions) and proposes ideas for policy makers toward improvements of the mobility infrastructure to promote e-bike adoption in urban areas. What makes our research relevant is the large data set of e-bike GPS data. In this article, an extended data set with 10,008 trips is processed. Based on statistical analysis of GPS traces, we evaluate two hypotheses: (i) the usage of e-bikes could meet the expectation of both daily commuting and recreational trips. Consequently, it could highlight the road segments in which a policy intervention might positively influence the rates of e-bikes trips; (ii) due to higher cost of acquisition compared to traditional bicycles and thanks to the assisted pedal, e-bike users might be willing to ride long distances even in adverse weather conditions. Further analysis provides insights about the type of infrastructure needed to promote e-bike usage. Finally, this paper gives a first look at the influence that the weather conditions have on e-bike owners’ mobility habits.
This paper is organised as follows: methods for GPS data acquisition, and processing are presented (
Section 2). The case study, in which our hypotheses are tested, is described (
Section 3). Suggestions about e-bike policies and future research directions are discussed in
Section 4.
2. Methods and Data
In this section, we describe an empirical analysis of GPS data collected as part of the SPRINT project [
16]. This project was launched in Flanders, Belgium at the beginning of 2014 and was aimed at helping the Flemish Government to understand the behaviour of e-bike users. SPRINT objectives include studying if new cycle paths, currently built in Flanders, are suitable for e-bikes and to support the shift from the car to more sustainable transportation means. The target population in this study is general but focuses on e-bike owners and their habits for commuting, business and recreational trips. Features of the study area and target population are shown in
Table 1.
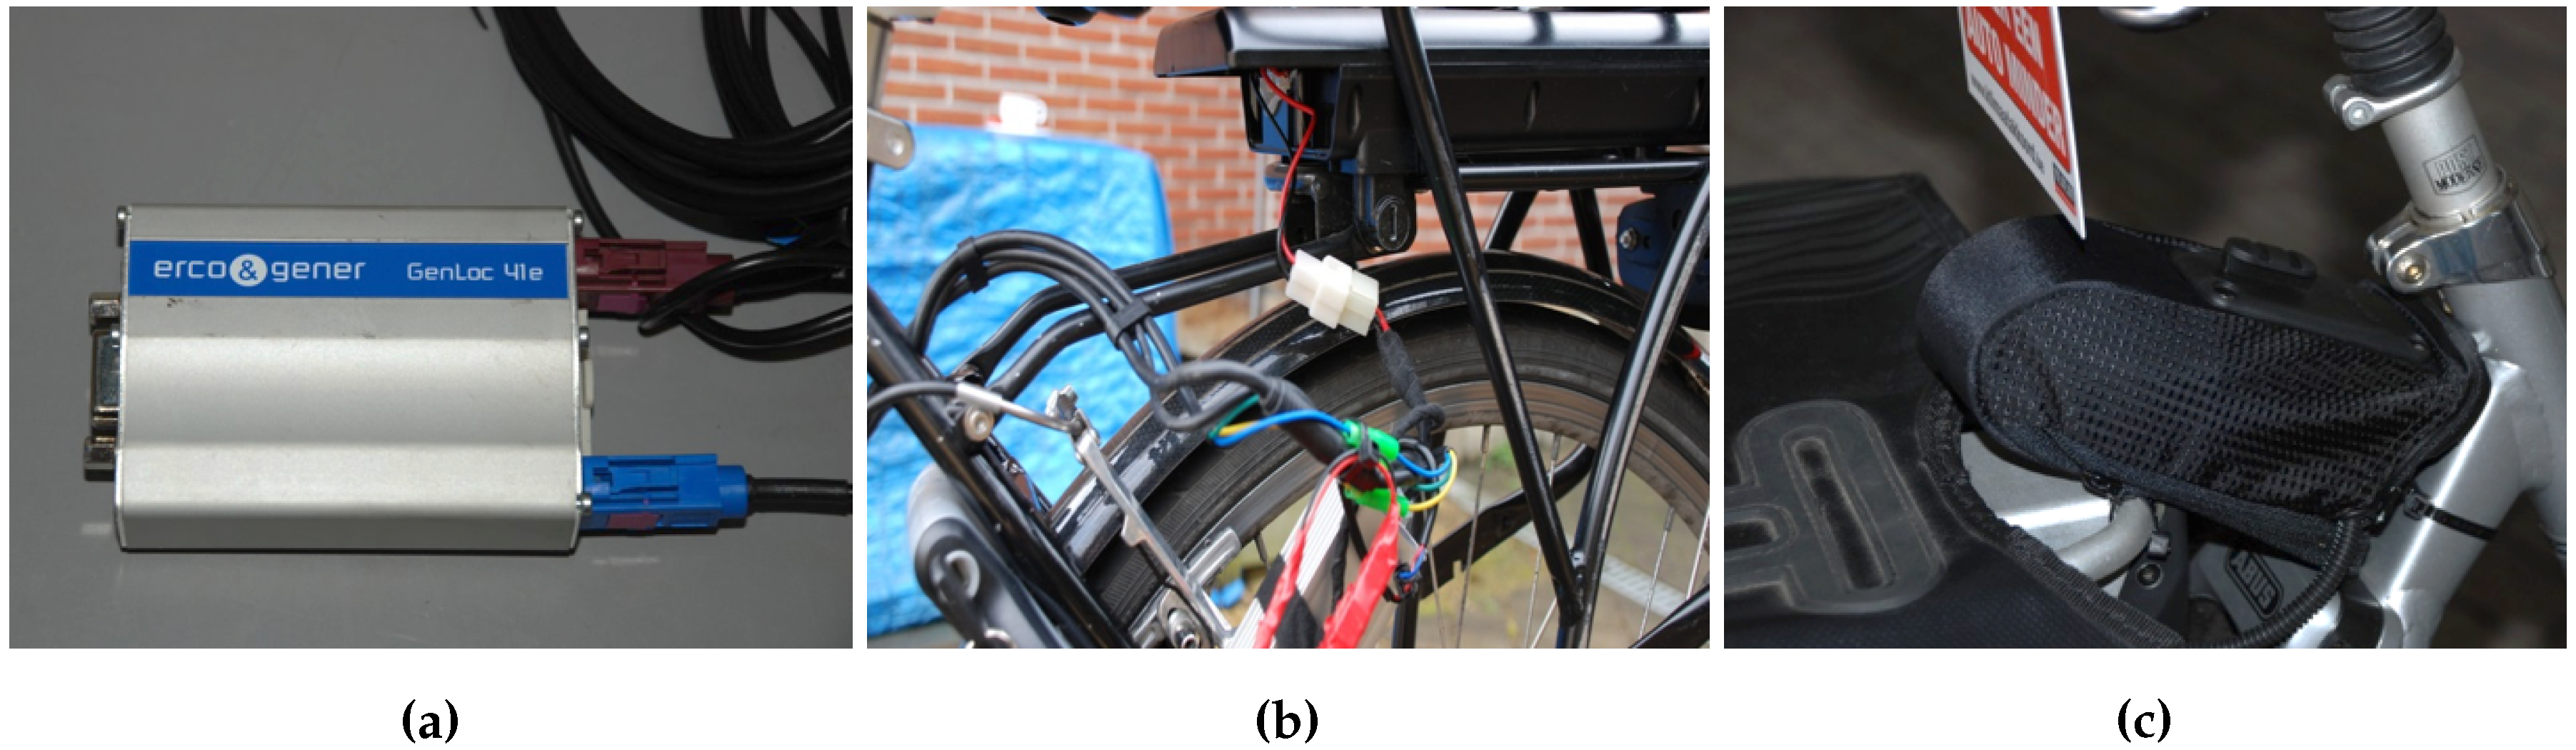
E-bike location data was automatically collected using a GPS tracking device (model GenLoc41e). It was installed on the e-bike of people who volunteered to participate in the SPRINT research programme (
Figure 1). The tracking device records GPS locations at a frequency of 5 Hz and it is activated automatically when the e-bike is in use (i.e., it does not interfere with the normal activities of the participant). On average, participants were tracked for 30 weeks without filling in any travel diary (no user’s annotations).
Our methodology includes the following stages: a processing stage validates the data integrity and filters out invalid location points (
Section 2.1); a segmentation method aggregates the location points into trips (
Section 2.2); a map-matching method binds the e-bike trips with features in the road network (road type and surface) (
Section 2.3); road segments with similar characteristics are grouped (
Section 2.4); finally, we investigate the influence of the weather by combining weather conditions and trip data (
Section 2.5).
2.1. Data Processing
Before performing a complete analysis of e-bike GPS tracks, GPS raw data frames are processed and merged into a single dataset through the following processing chain: (i) verify the data integrity (e.g., checksum), since the data may be compromised due to hardware errors (data transmission or storage); (ii) parse the data frame attributes (e.g., latitude, longitude, speed, accuracy, altitude, date and time); (iii) filter out invalid data frames (i.e., data frames without coordinates or other attributes), including data frames marked as invalid by the data logger when it is not possible to get a GPS location; and (iv) merge the valid data into a single dataset. After these steps, the final dataset is ready to be segmented into trips (i.e., the location points that belong to a specific trajectory).
2.2. Segmentation
Since data collection was done using a GPS tracking device installed on each e-bike, the transportation mode is already set (e-bike mode). However, such data does not include any annotation (travel diary). This means that trip start/end times need to be inferred from the GPS data. In our experiments, sequences of location points are segmented into trips using the dwell time criterion. Trips are processed further to compute features such as travelled time, travelled distance and average speed [
17].
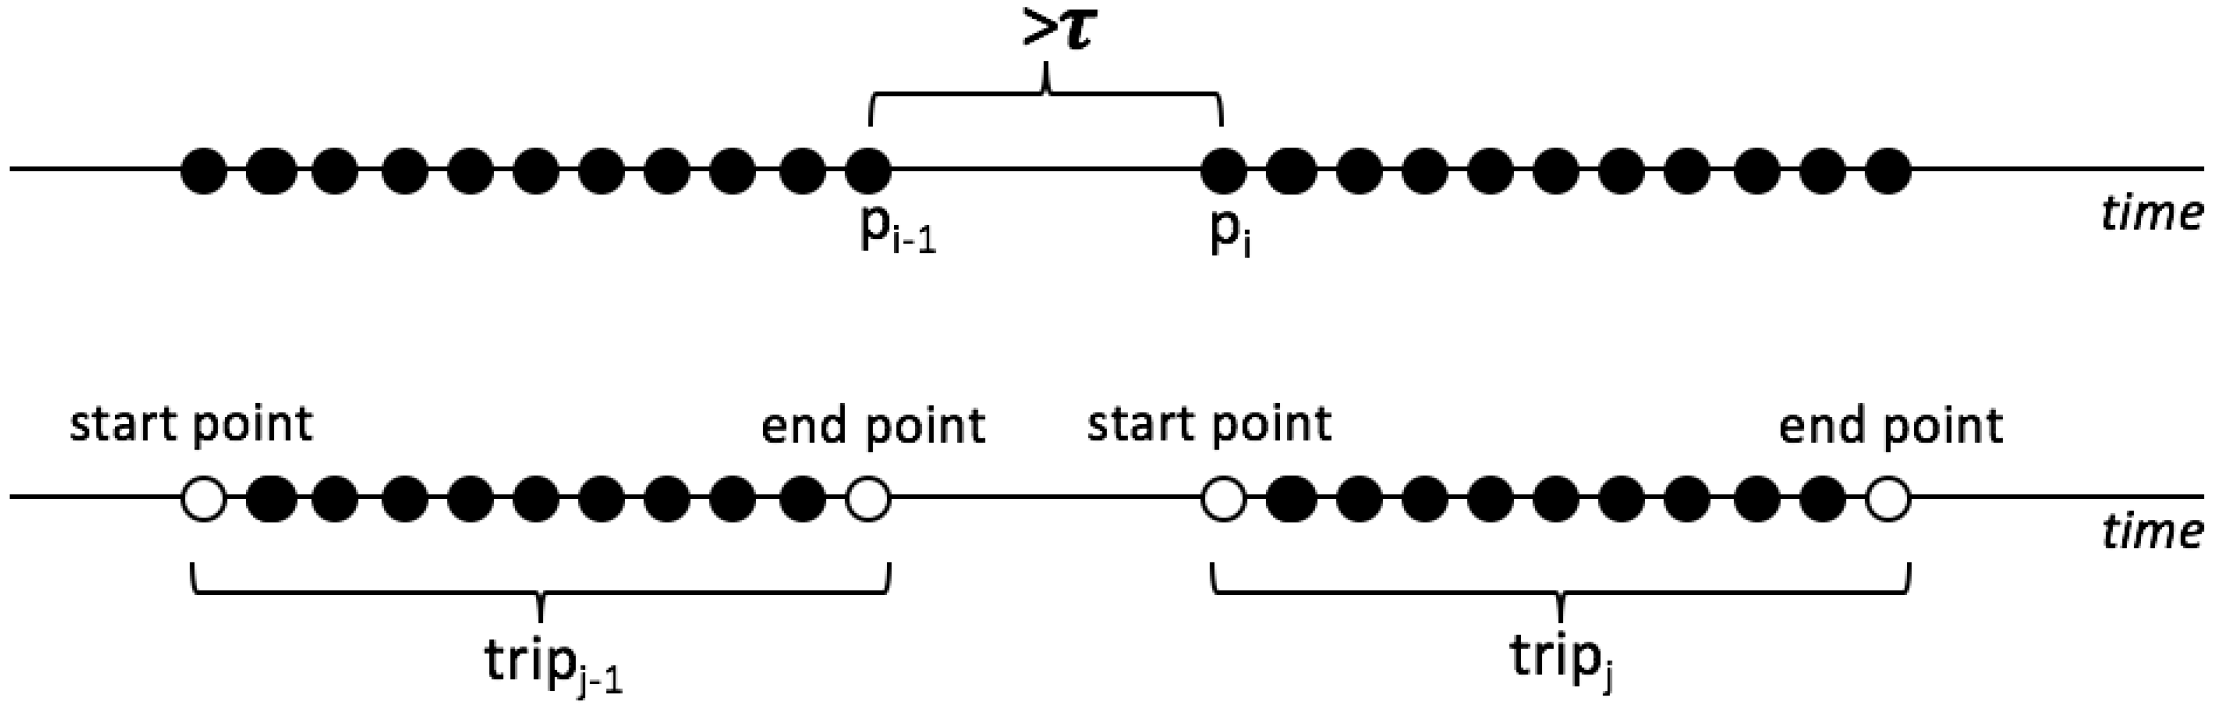
Let
P be a sequence of GPS points
,
that generated from a tracking device, and we can split
P into
(
Figure 2), if the time interval between consecutive points exceeds a certain threshold [
18],
;
, where
is the timestamp at point
and
is the threshold called dwell time.
The dwell time can be defined as the minimum time difference between two GPS points after which it is assumed that an activity took place [
19]. In the literature dwell time values of 45 [
20], 300 [
21] and 900 [
8] seconds have been reported, with most studies applying a 120 seconds threshold. In a previous work [
22], we used a dwell time of 300 seconds, but, for our data set, it turned out that several short trips were actually part of one long trip, an effect known as over-segmentation. This problem is usually related to bad reception of the GPS signal during the trips. In this paper, we employ a higher threshold (600 seconds) given that our data set is basically single modal (e-bike); therefore, a large threshold captures better the user activity.
2.3. Map-Matching
Map-matching methods are used to align a sequence of observed GPS positions to the road network on a digital map. To understand the preferred route choices of the e-bike owners, we performed map-matching between every recorded trip and the OpenStreetMap (OSM) network. OSM is an open access platform for geospatial vector data, and it is often considered more complete and appropriate to be used as a base map for planning studies on non-motorised transportation than commercial counterparts [
23,
24]. The matched road segments are used later on for extracting features from the road-network.
We start the map-matching by getting the candidate road segments (individual roads) from the road network. This step is necessary to reduce the number of roads to be processed. Candidate road segments can be selected either by defining a bounding box that contains all trips or by extracting all segments from the road network that partially or completely overlap a trip. Since the trips in our dataset cover wide areas, we opted for the second option. A ten meter-buffer was placed around the road network representing the average GPS accuracy of data loggers. Then, a set of overlapping segments was obtained by geo-referenced queries to the OSM database.
A problem with this approach is that parallel roads may be matched especially at road junctions. To address this issue, we used the azimuth angle (i.e., the angle between a reference plane and a point) to compare whether or not the segments are aligned correctly. We filtered out road segments with an azimuth angle (between the trip trajectory and the road segment) higher than ten degrees and from the remaining segments features were extracted.
2.4. Groups of Interest
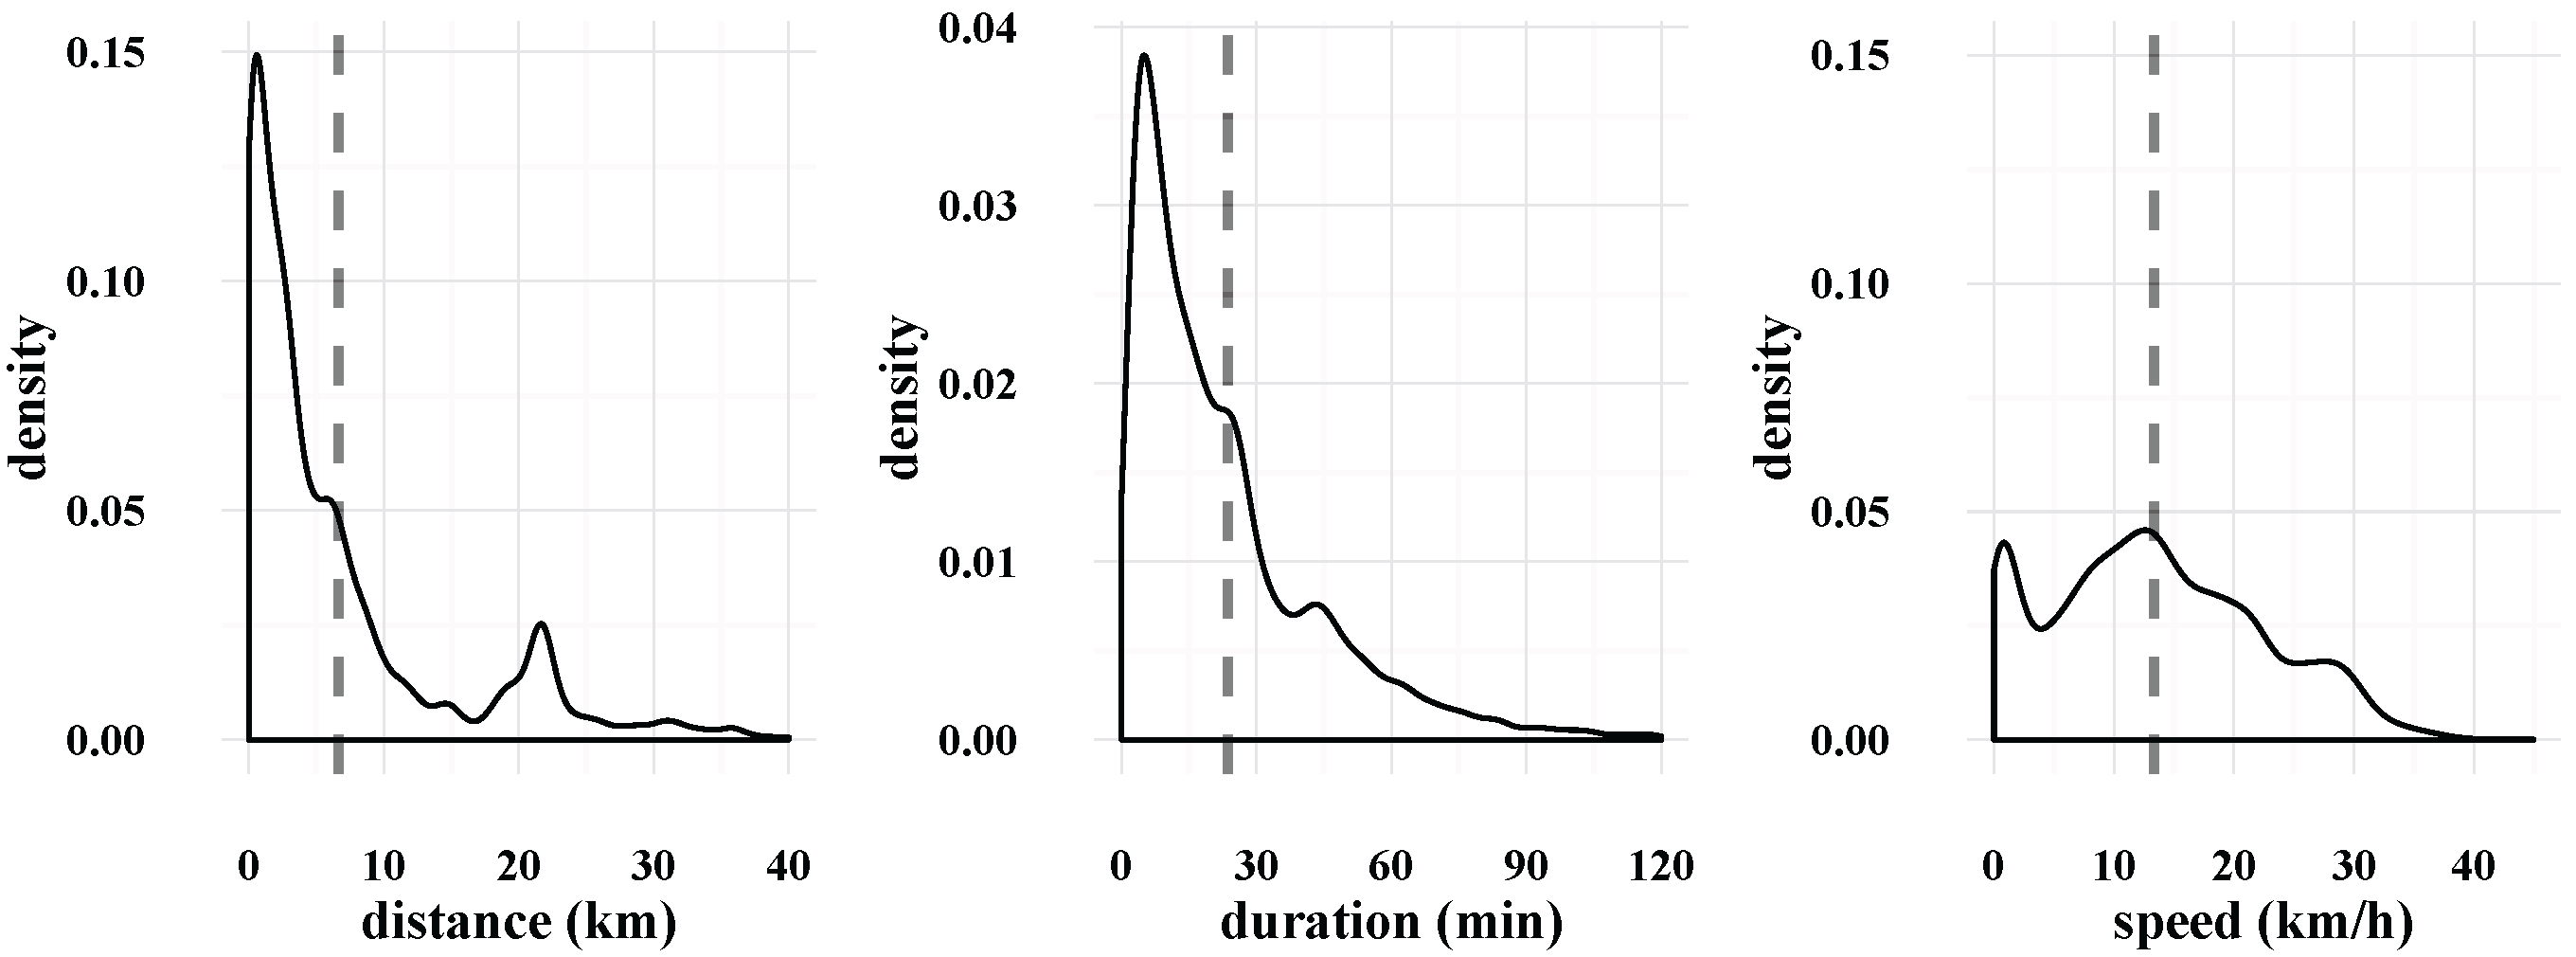
To explore the trip characteristics among SPRINT participants, we looked at travel distances patterns and grouped trips based on their average distance using the Ward Hierarchical clustering approach [
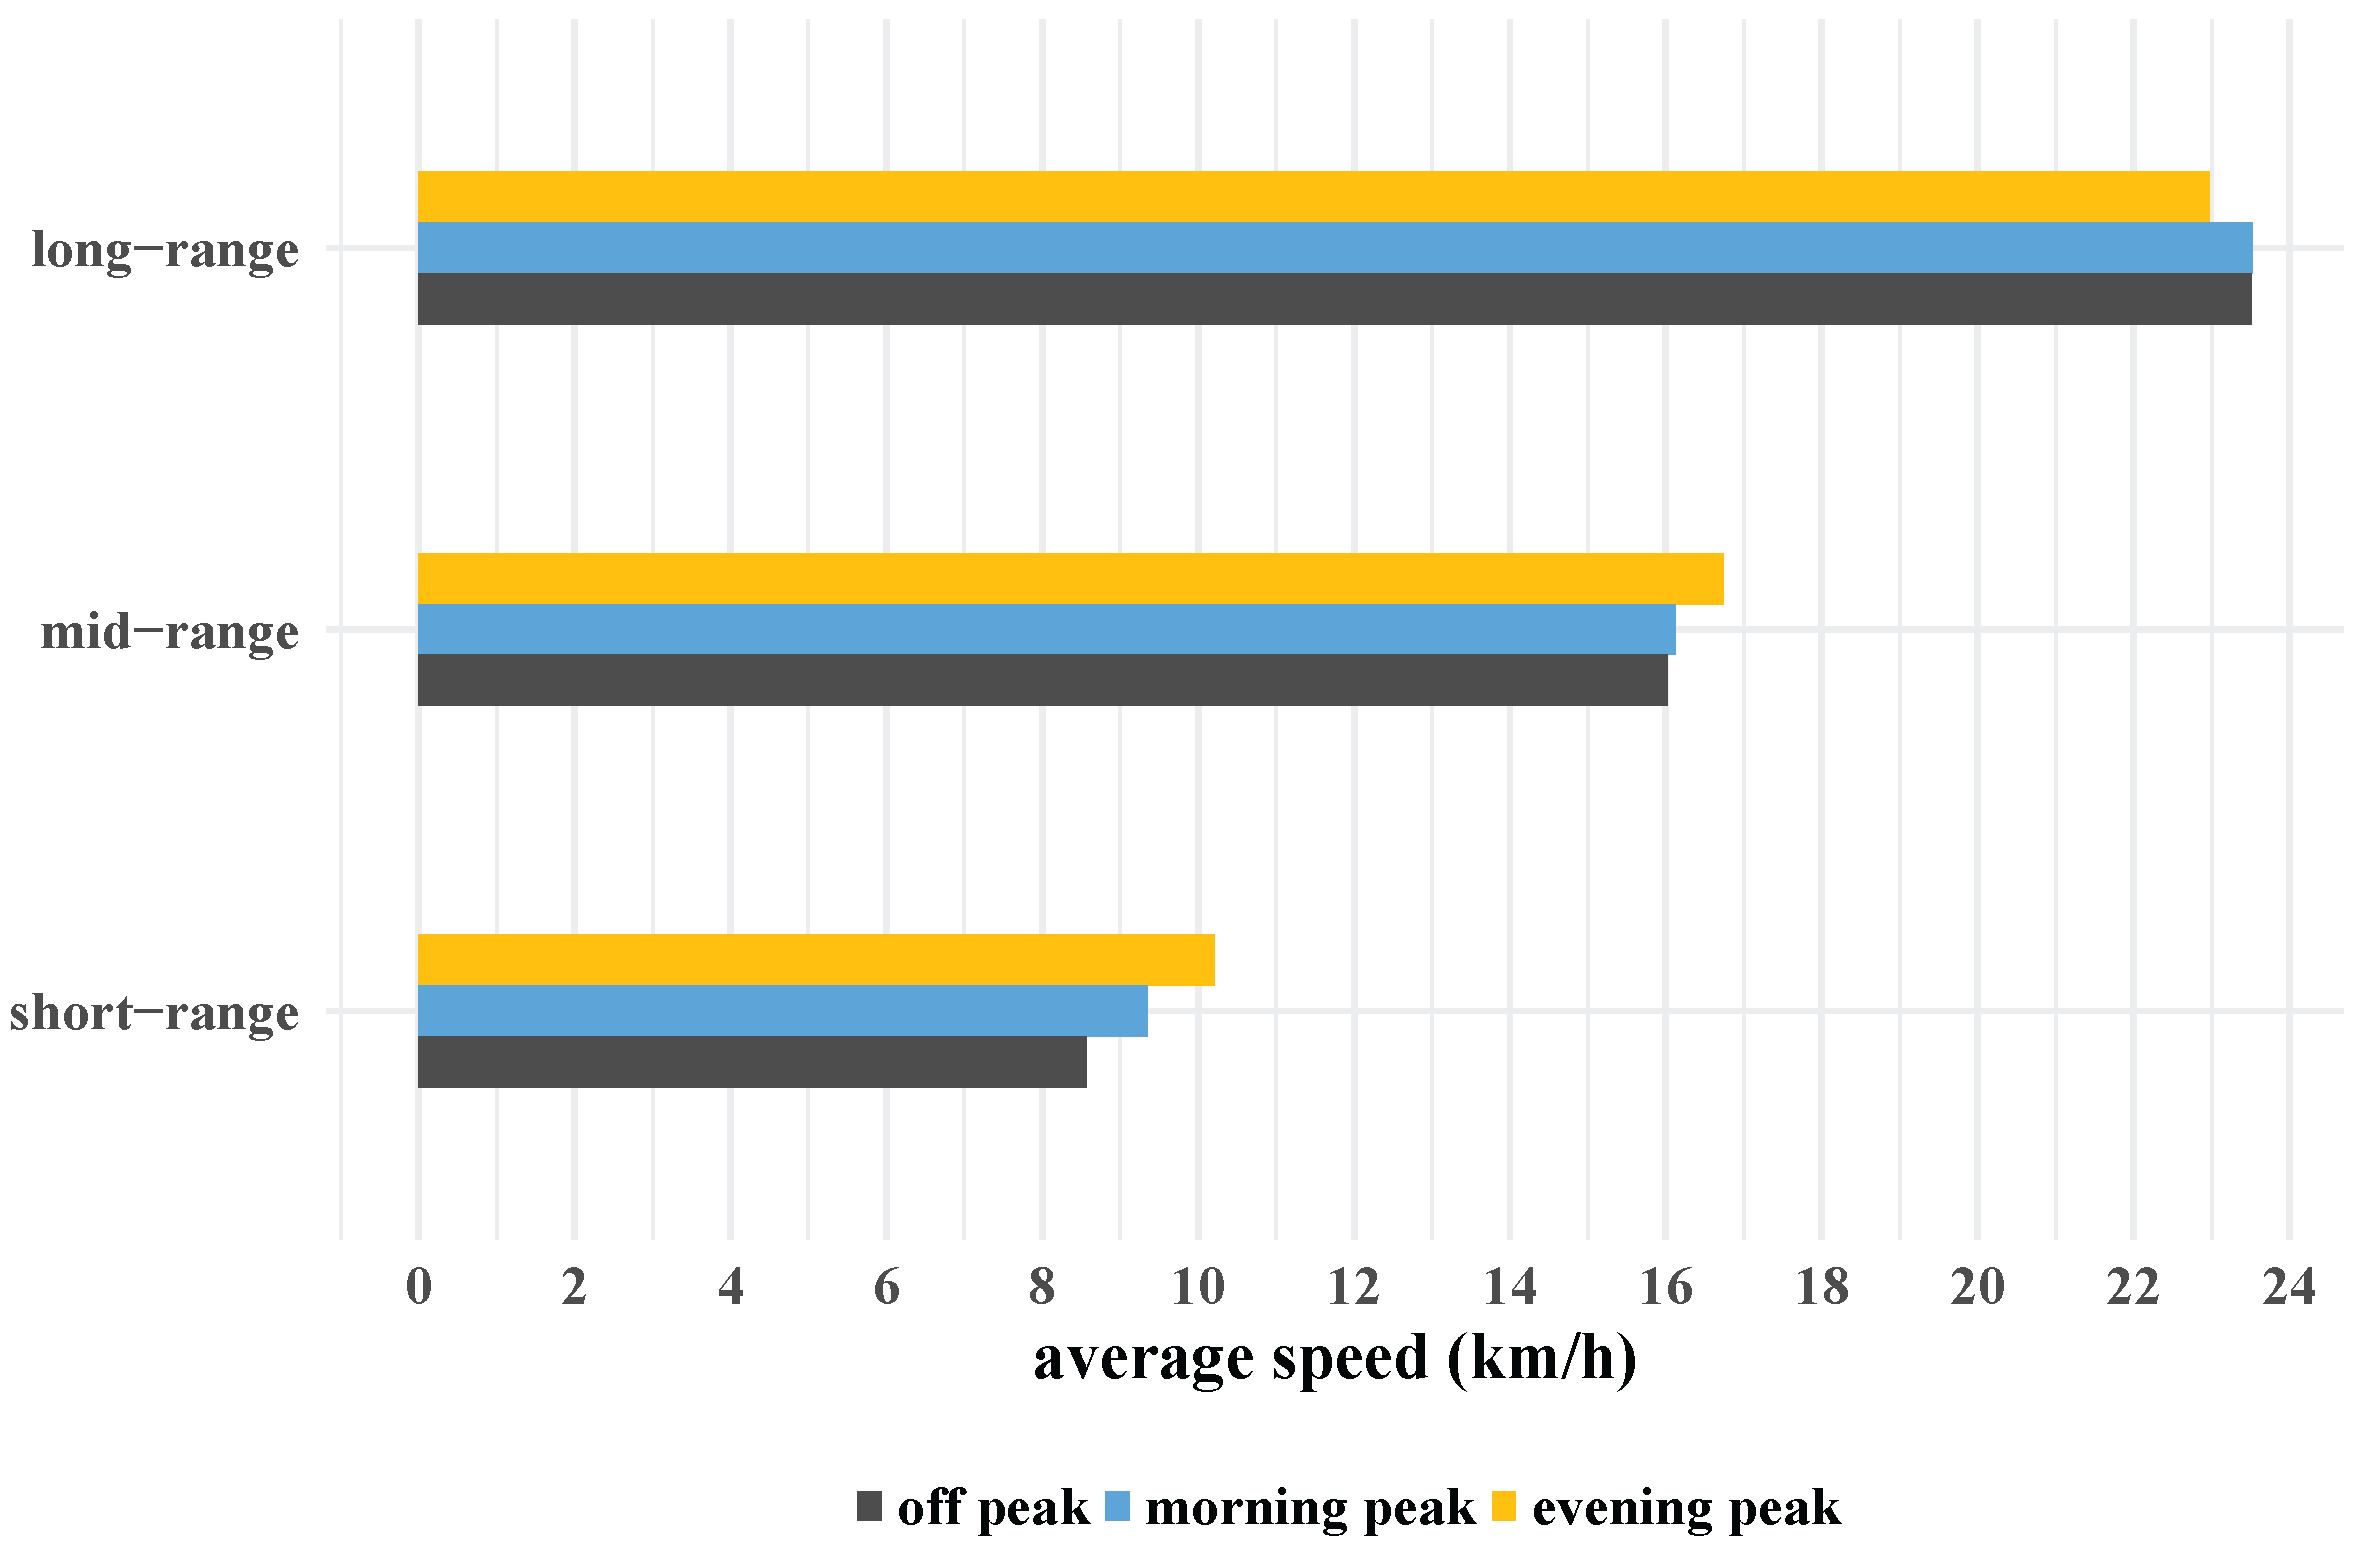
25]. This clustering approach minimises the total within-cluster variance in such fashion that at each step the pair of closest clusters are merged into a new cluster, which leads to the minimum variance among clusters. In our dataset, the clustering method identified four clusters; however, two of them reported a similar average speed (22.7 and 22.6 km/h) and the difference was the travelled distance, which indicates similar cycling behaviour. Furthermore, these two clusters have the same parent node in the hierarchy; thus, we consider only three groups to represent the third hierarchical level.
We refer to these groups of interest as
short-range,
mid-range and
long-range trips. The distance ranges for these groups are shown in (
Table 2).
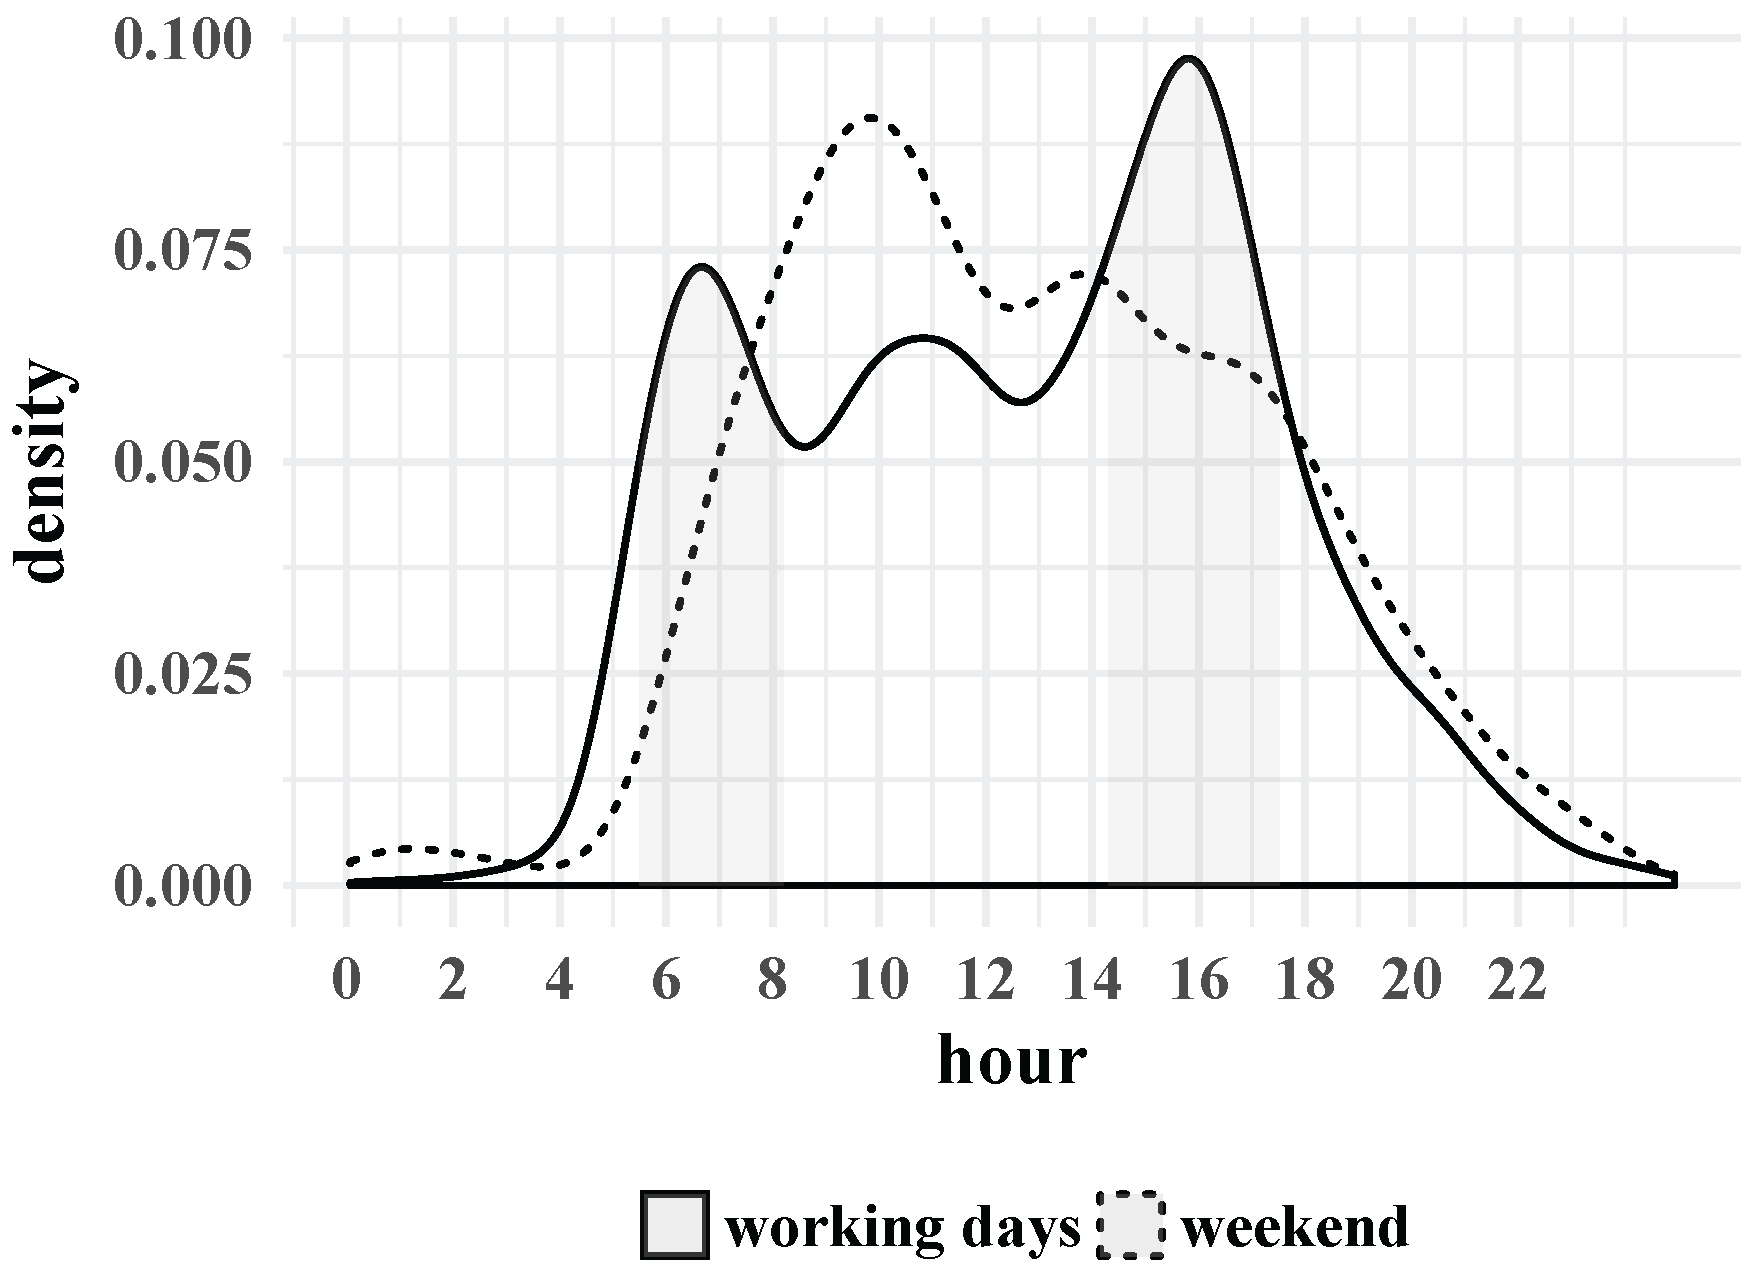
Participants are more willing to ride longer distance during the working days than during the weekend. This suggests a higher usage of the e-bikes for commuting trips (mainly performed during working days) than for recreational ones (mainly performed on weekends). Furthermore, the identification of such groups brings up an example of the potential of e-bikes for commuting trips, particularly for travel distances above the national average (5 km for traditional bicycles) [
26]. We notice that trips within 13 km from the origin are still a viable option for e-bike owners (83.1% of the trips).
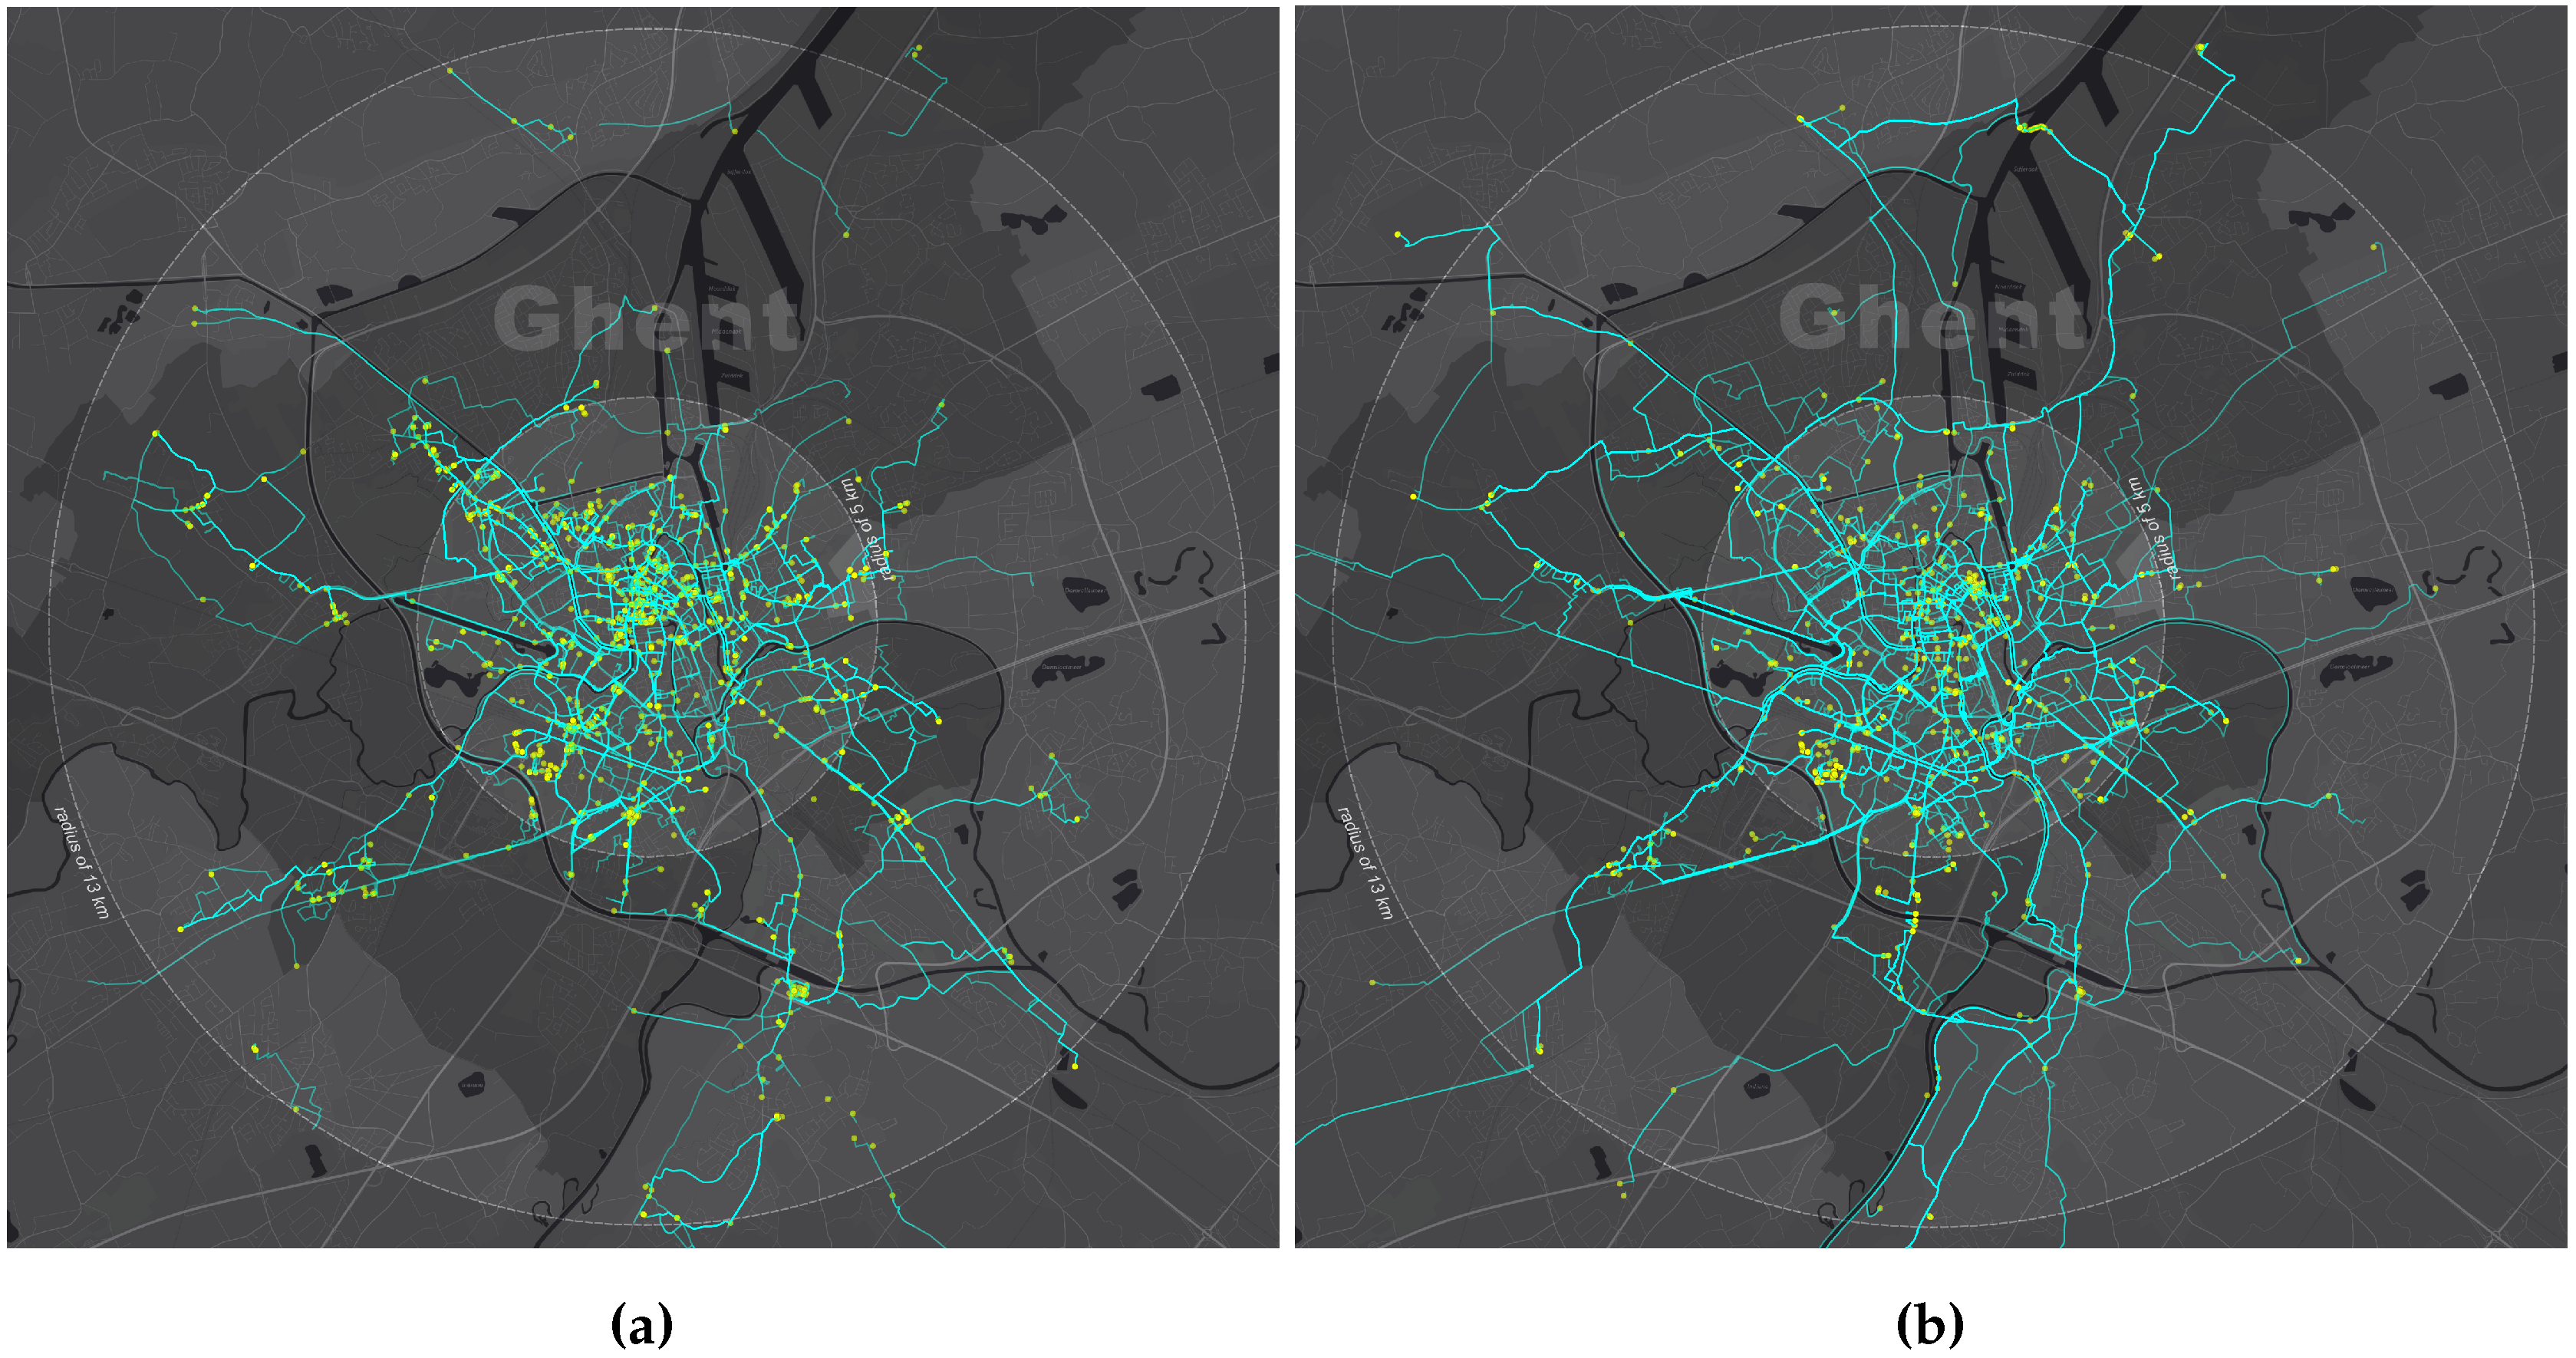
To illustrate the aforementioned user behaviour, in
Figure 3, we show short- and mid-range trips that took place in the mornings during working days (a common time frame for commuters). A large density of trips in both groups includes as a destination the city centre of Ghent, but especially interesting are mid-range trips (
Figure 3b) that reach the city centre from the neighboring communities where using the car is a compelling option in terms of travelled time.
2.5. Weather Analysis
In this section, we focus on studying correlation between the weather conditions and the use of the e-bikes. To the best of our knowledge, this is the first study that provides insights on this issue for e-bikes. The relation between traditional bicycles and weather conditions was addressed in [
27]. The authors found that weather conditions influence cycling for both recreational and commuting purposes. Frequencies are higher for fine weather conditions; however, in cooler weather, commuting by bicycle occurs more frequently than recreational cycling. In the case of rainy weather, this difference is more pronounced: there are 10% more of commuting cyclists than recreational cyclists ride during rainfall. Our expectation was that, in the case of e-bikes, this effect could be smaller due to higher cost of e-bikes. The weather dataset employed for our analysis was obtained from the weatherbase website [
28] and contains 7564 observations about the weather conditions. For the majority of our trips, we got visibility, wind, precipitation and temperature data in the days and time in which trips were performed.
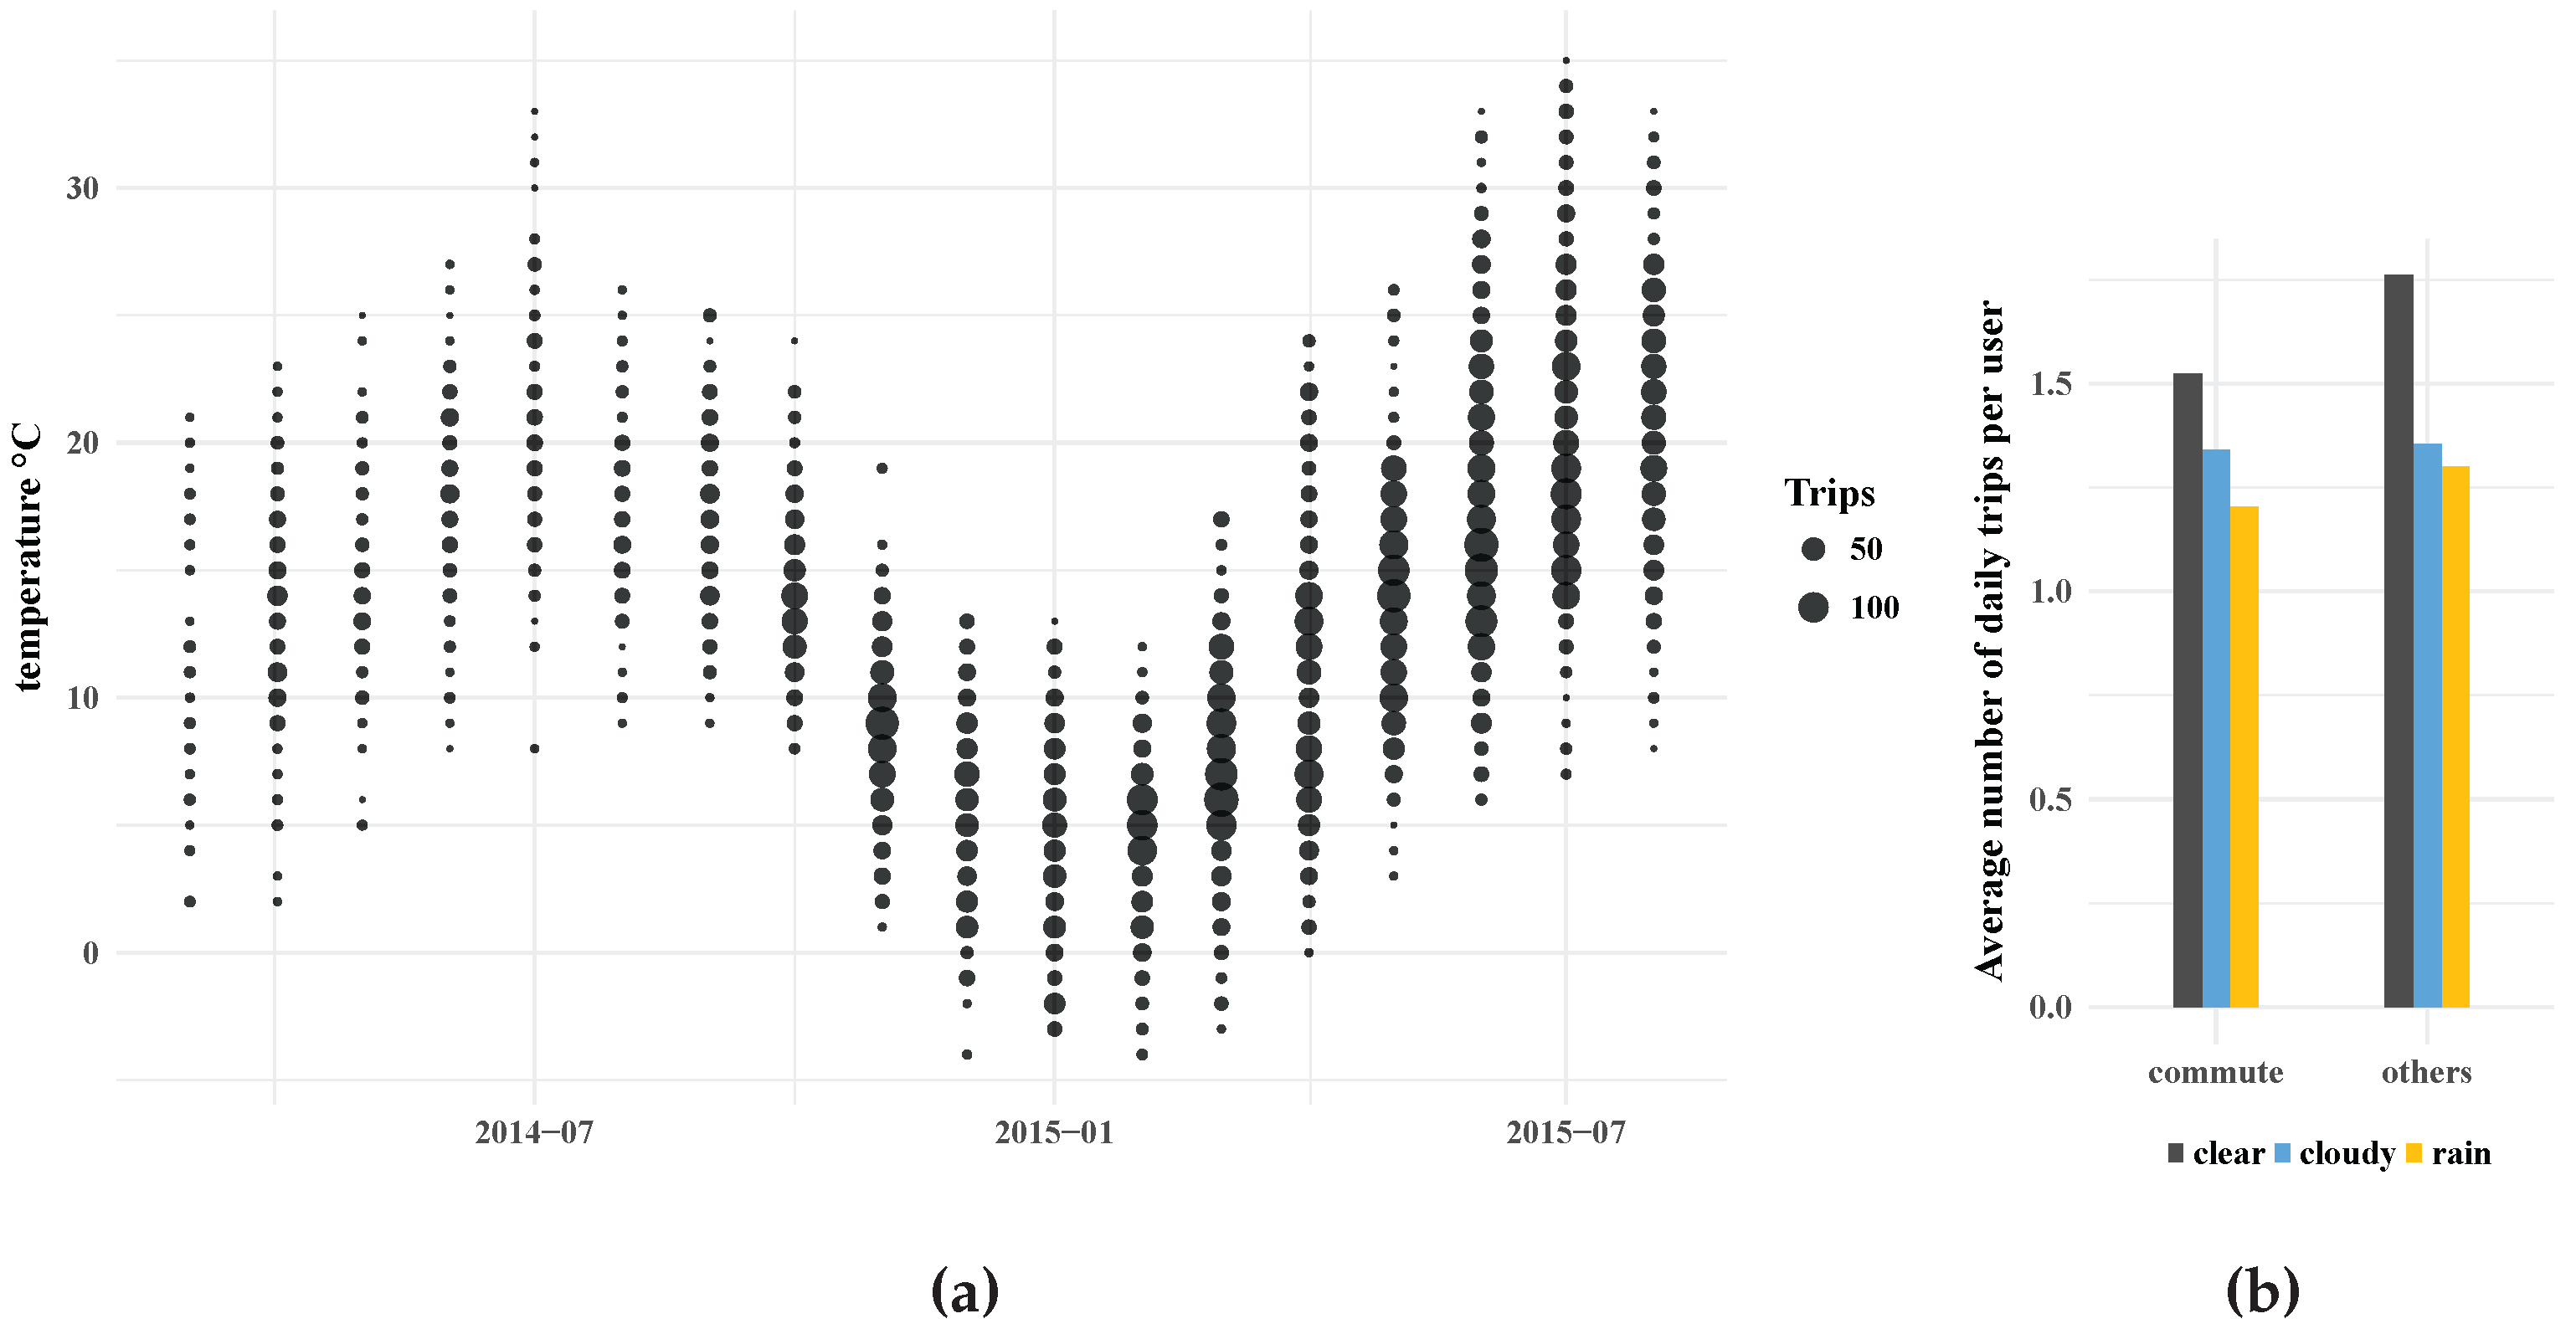
In
Figure 4a, we provide an overview of the weather conditions for the trips included in our sample. In particular, we plot the trip distribution in terms of temperature. The number of trips was larger in year 2015 than in 2014 due to a growth in our sample. For both years, the graph clearly shows that most trips take place in summer months.
We found that 61% of trips are performed in “clear” conditions (by definition of the website) while the 25% and 9% in “mostly cloudy” and “rain” conditions, respectively. Analysing the average number of trips per day (for each person), we obtained two trips per day in clear conditions, 1.5 trip per day in cloudy conditions and 1.4 in rainy conditions. These values show the impact of the weather conditions on the number of trips per day (higher in clear conditions). In order to provide as many details as possible, we also divided our sample into “commuters” and “others”, defining “commuting trips” as all trips performed from Monday to Friday between 6:00 a.m. to 10:00 a.m. and between 4:00 p.m. to 7:00 p.m. The results in
Figure 4b show how in rainy and cloudy conditions that the number of trips per day is basically constant, while, in clear conditions, the number of trips with a purpose different from commuting is larger. This means that weather conditions have more influence on recreational trips than on commuting trips.
4. Discussion
Several studies have focused on cyclists behaviour in Belgium. The OVG (Onderzoek Verplaatsings Gedrag), for example, reported that 80% of all bicycle trips are shorter than 5 km, making cycling a local transportation mode [
26].
In this paper, we gathered GPS data coming from 10,157 trips performed in Belgium (mainly in the Flanders Region) along 2014 and the first half of 2015. Trips with unusual long range and high speed, 149 in total, that presumably were collected while the e-bike was travelling on a train, were excluded from our statistics. Our initial hypothesis (i.e., the e-bike is a valid alternative for commuting) is confirmed in
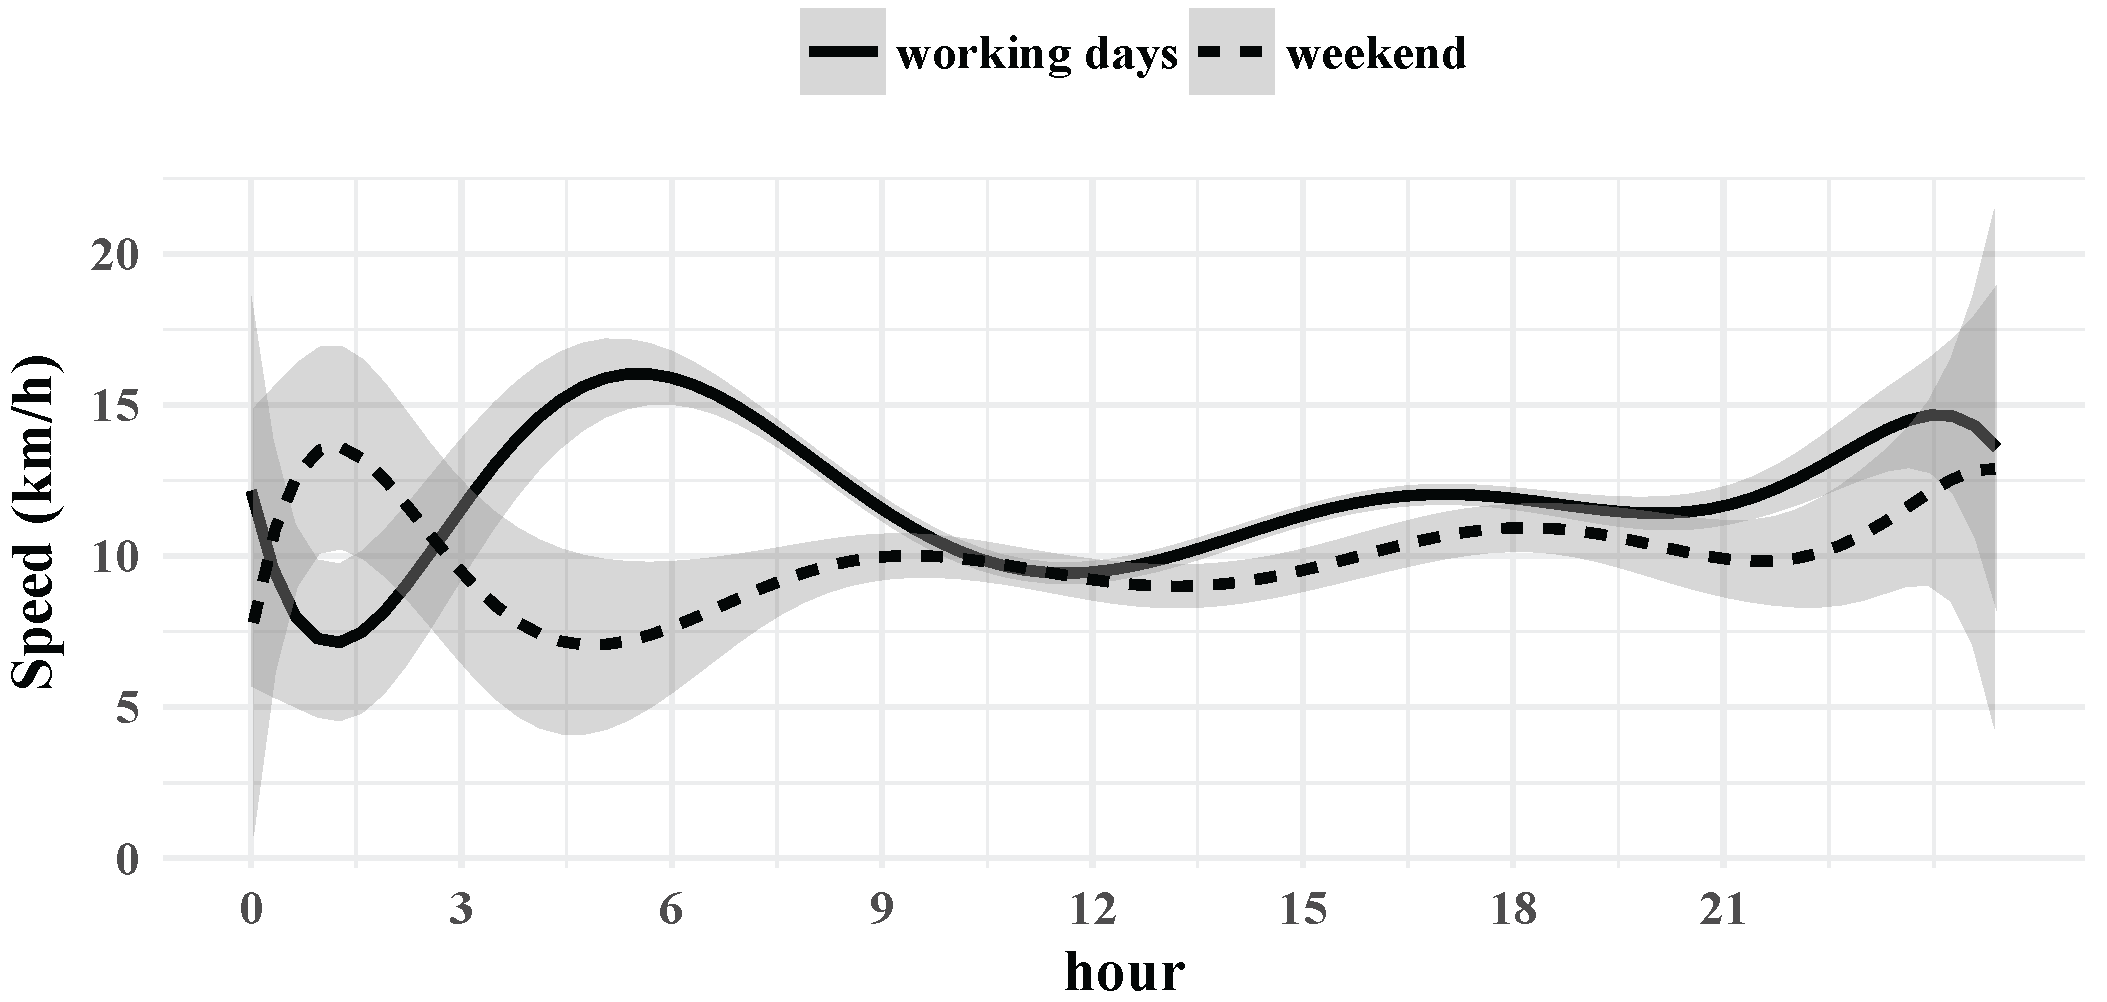
Table 2, which shows how the usage of the e-bike is higher on working days than on weekends. Based on the average speed (
Figure 7), we confirmed our preliminary results [
33] i.e., longer trips are correlated with a higher average speed and that they are performed more often during working days. This suggests a tendency of people to use the e-bike as a commuting mode. Moreover, due to longer distance cycled during working days, this result could also anticipate the interest of people in using e-bikes instead of cars for certain distances (within 13 km). In addition, the hours in which the majority of these trips are performed are the typical hours for having access/egress to work.
Regarding map-matching results using the OSM database, the most preferred road types are, in order, “residential”, “tertiary” and “track”. If we group roads with similar characteristics (speed limits and type of road), we found that most roads belong to “secondary”, “residential” and “cycleway” road networks. If we consider the “cycleway” network only, the roads in which a bicycle path is included (private or shared) are the most commonly used. One-directional roads in which a bicycle path is not included, but for which the access to the bicycles is in both directions, are commonly used too. It must be pointed out that this result could also be due to the nature of our sample. The majority of our users live in some residential areas outside the city center, which lead them to use residential roads to have access/egress to their home.
Unfortunately, the OSM database does not contain enough specific data to reliably identify the surface of most roads in Belgium. For the “cycleway” network, most road segments do not have associated metadata. At the “highway” level network, we found that such segments mainly correspond to “residential”, “primary”, “secondary” and “tertiary” roads. Nonetheless, we were able to infer from OSM that “paved” roads are preferred by e-bike owners. We expected a stronger correlation between the use of certain types of roads and the pavements given the higher speed of the e-bike compared to a traditional bicycle and also considering that it is mostly used during the working days.
The analysis of the relation between the number of daily trips and weather conditions showed how adverse climate conditions may be a deterrent for cyclists. Our results confuted our assumption that e-bike owners could be more minded to ride in adverse weather conditions than non-electric bike users. Moreover, for non-commuting trips, this influence is higher, since, in clear conditions, the number of trips per day tends to increase. We think that improvements of the cycling infrastructure, specifically in terms of surface and the advent of new clothes (closer to moto-style), could represent two possible directions for decreasing the impact of the weather conditions on e-bike rides, in particular when commuting trips are involved.
Future research directions include but are not limited to: the creation of a route choice model through a route set generation (provided by Google direction services and Open Source Routing Machine) or without the route set generation but employing a recursive logit model; the detailed analysis of two difference cities (Ghent and Leuven); the identification of the different purposes employing a cluster approach; the analysis of complementary surveys submitted to our sample and the investigation of safety aspects related to the use of the e-bike.


 ,
, 


