Using Location-Based Social Media Data to Observe Check-In Behavior and Gender Difference: Bringing Weibo Data into Play


Abstract
:1. Introduction
2. Related Work
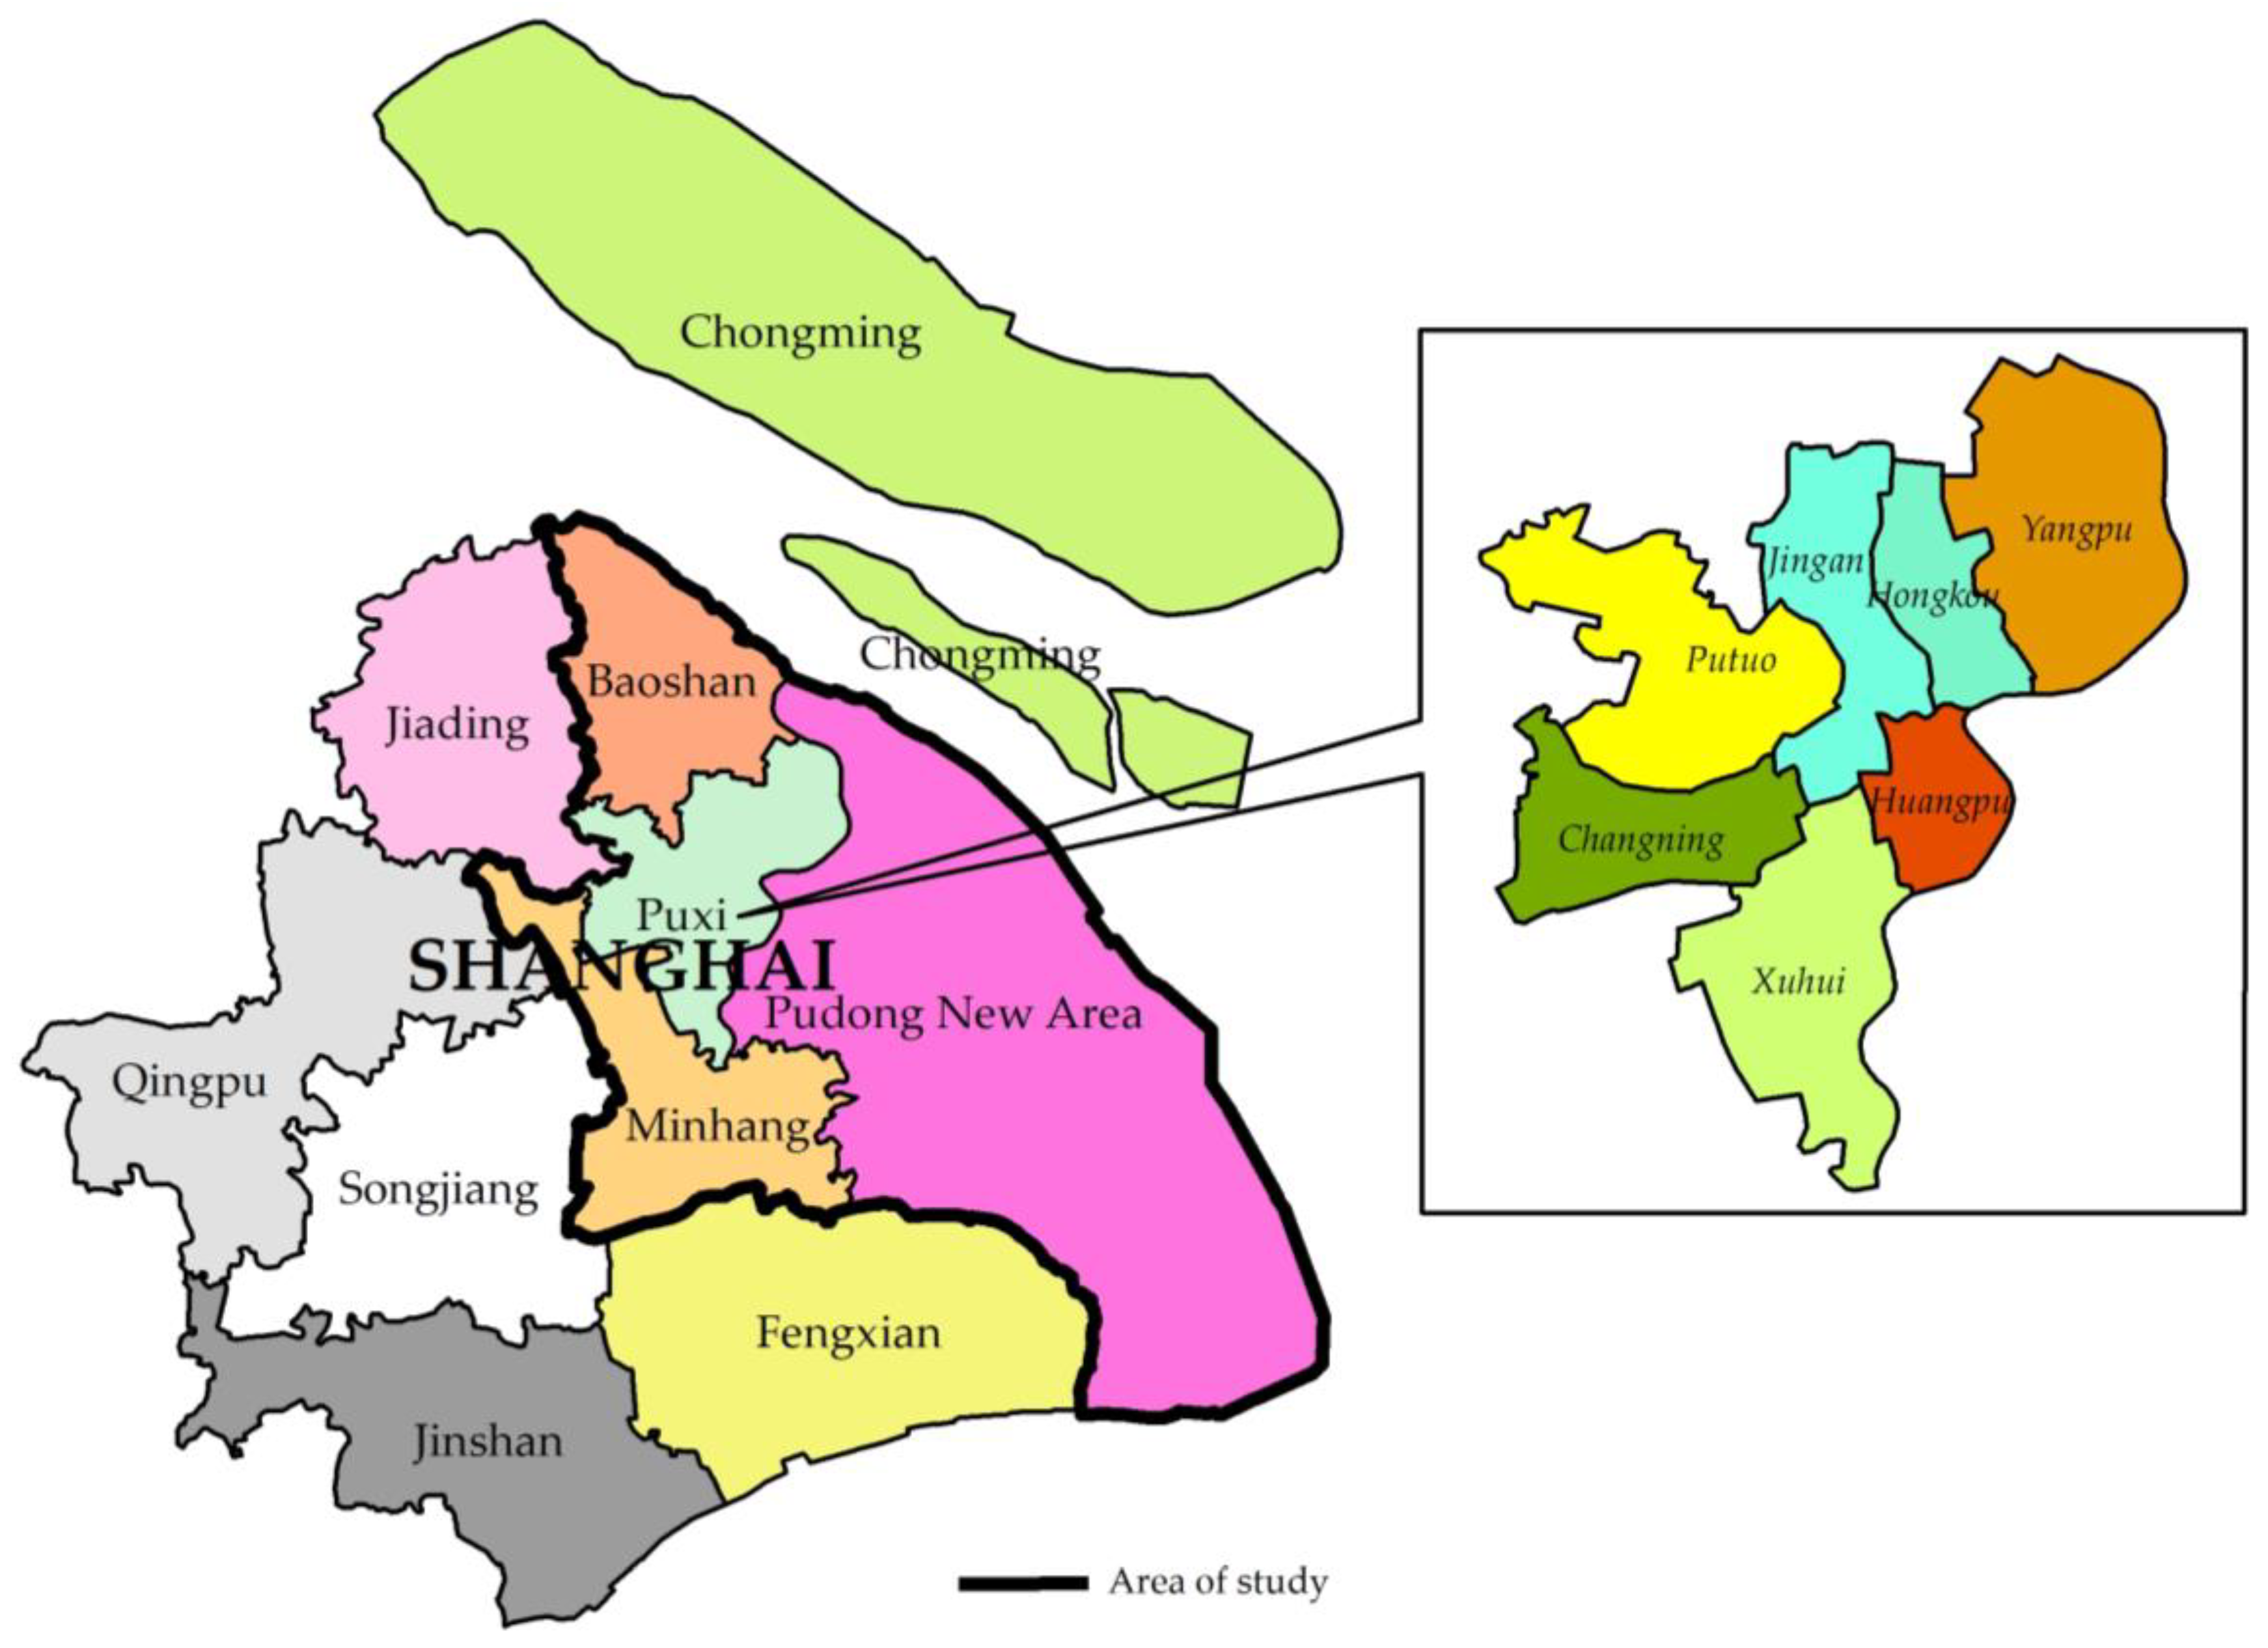
3. Study Area and Data Source
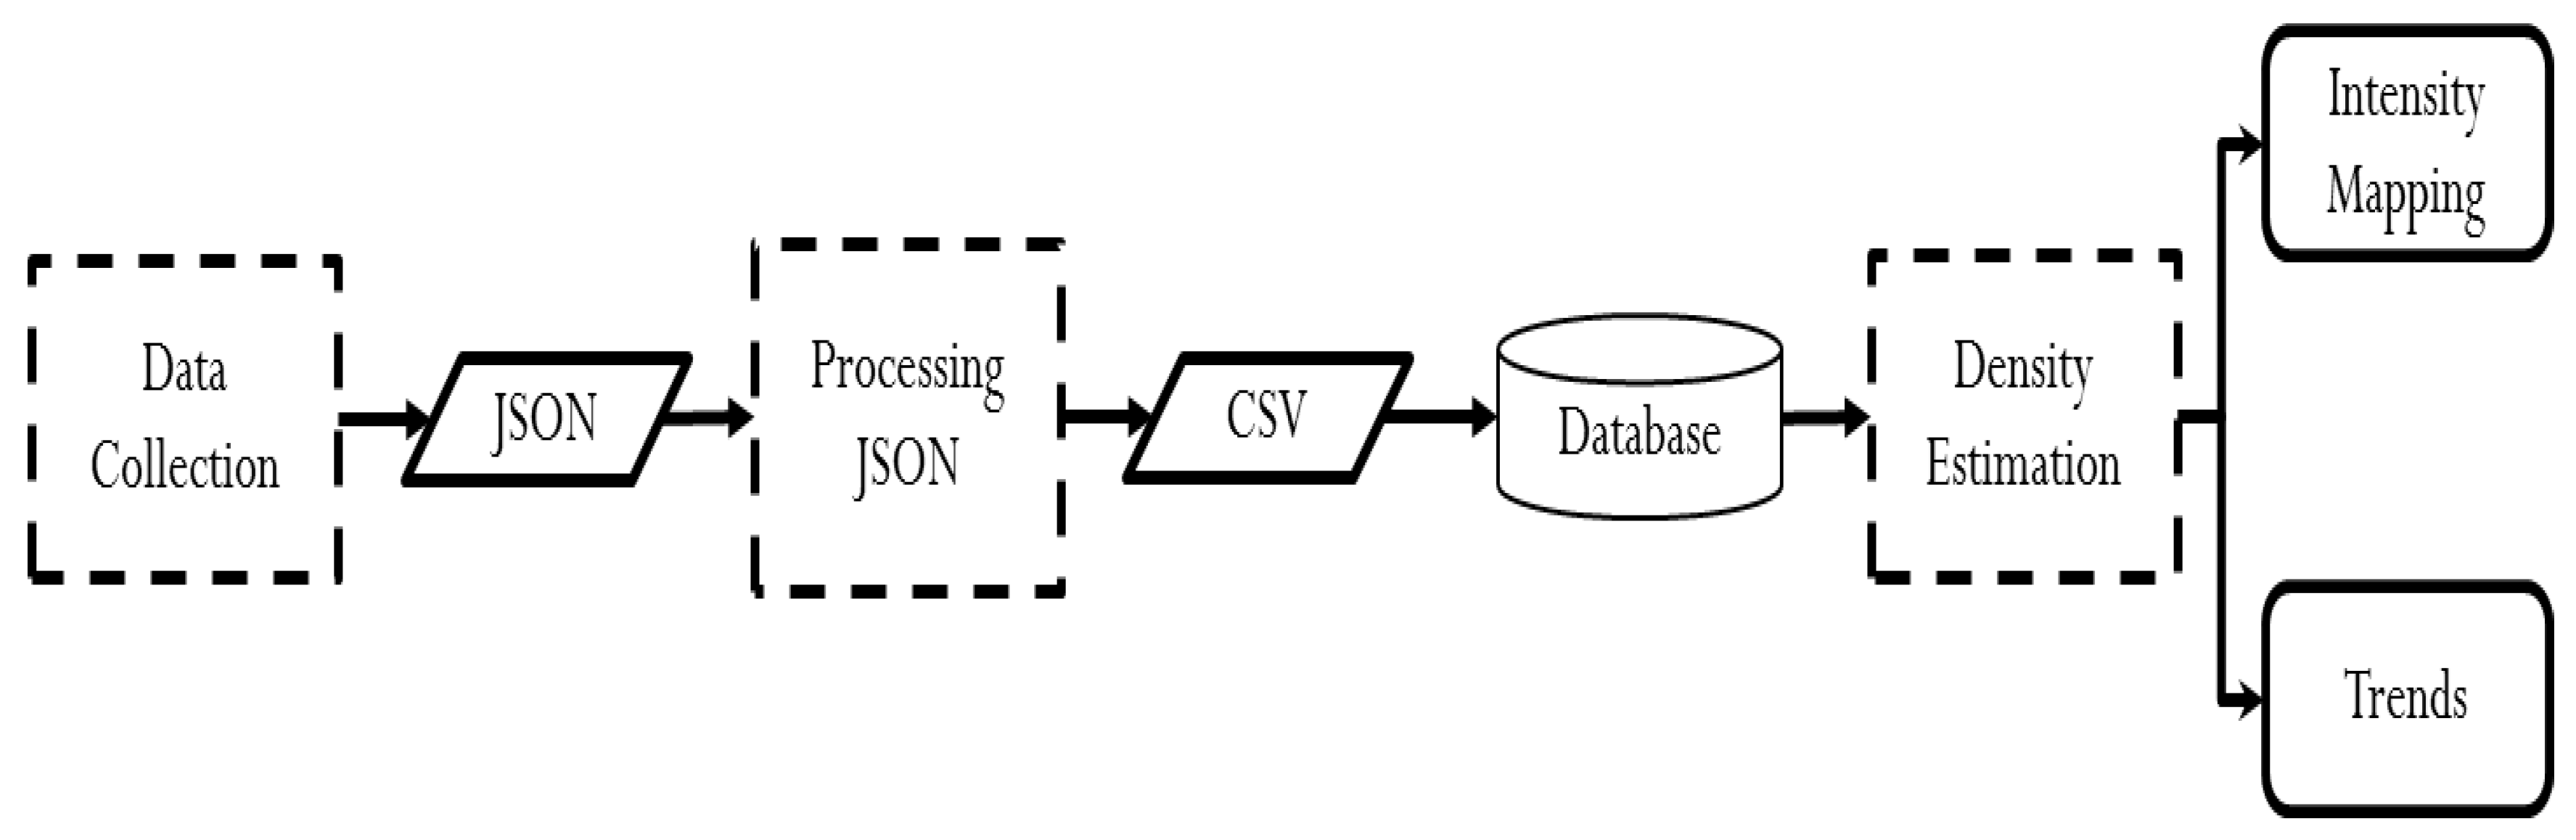
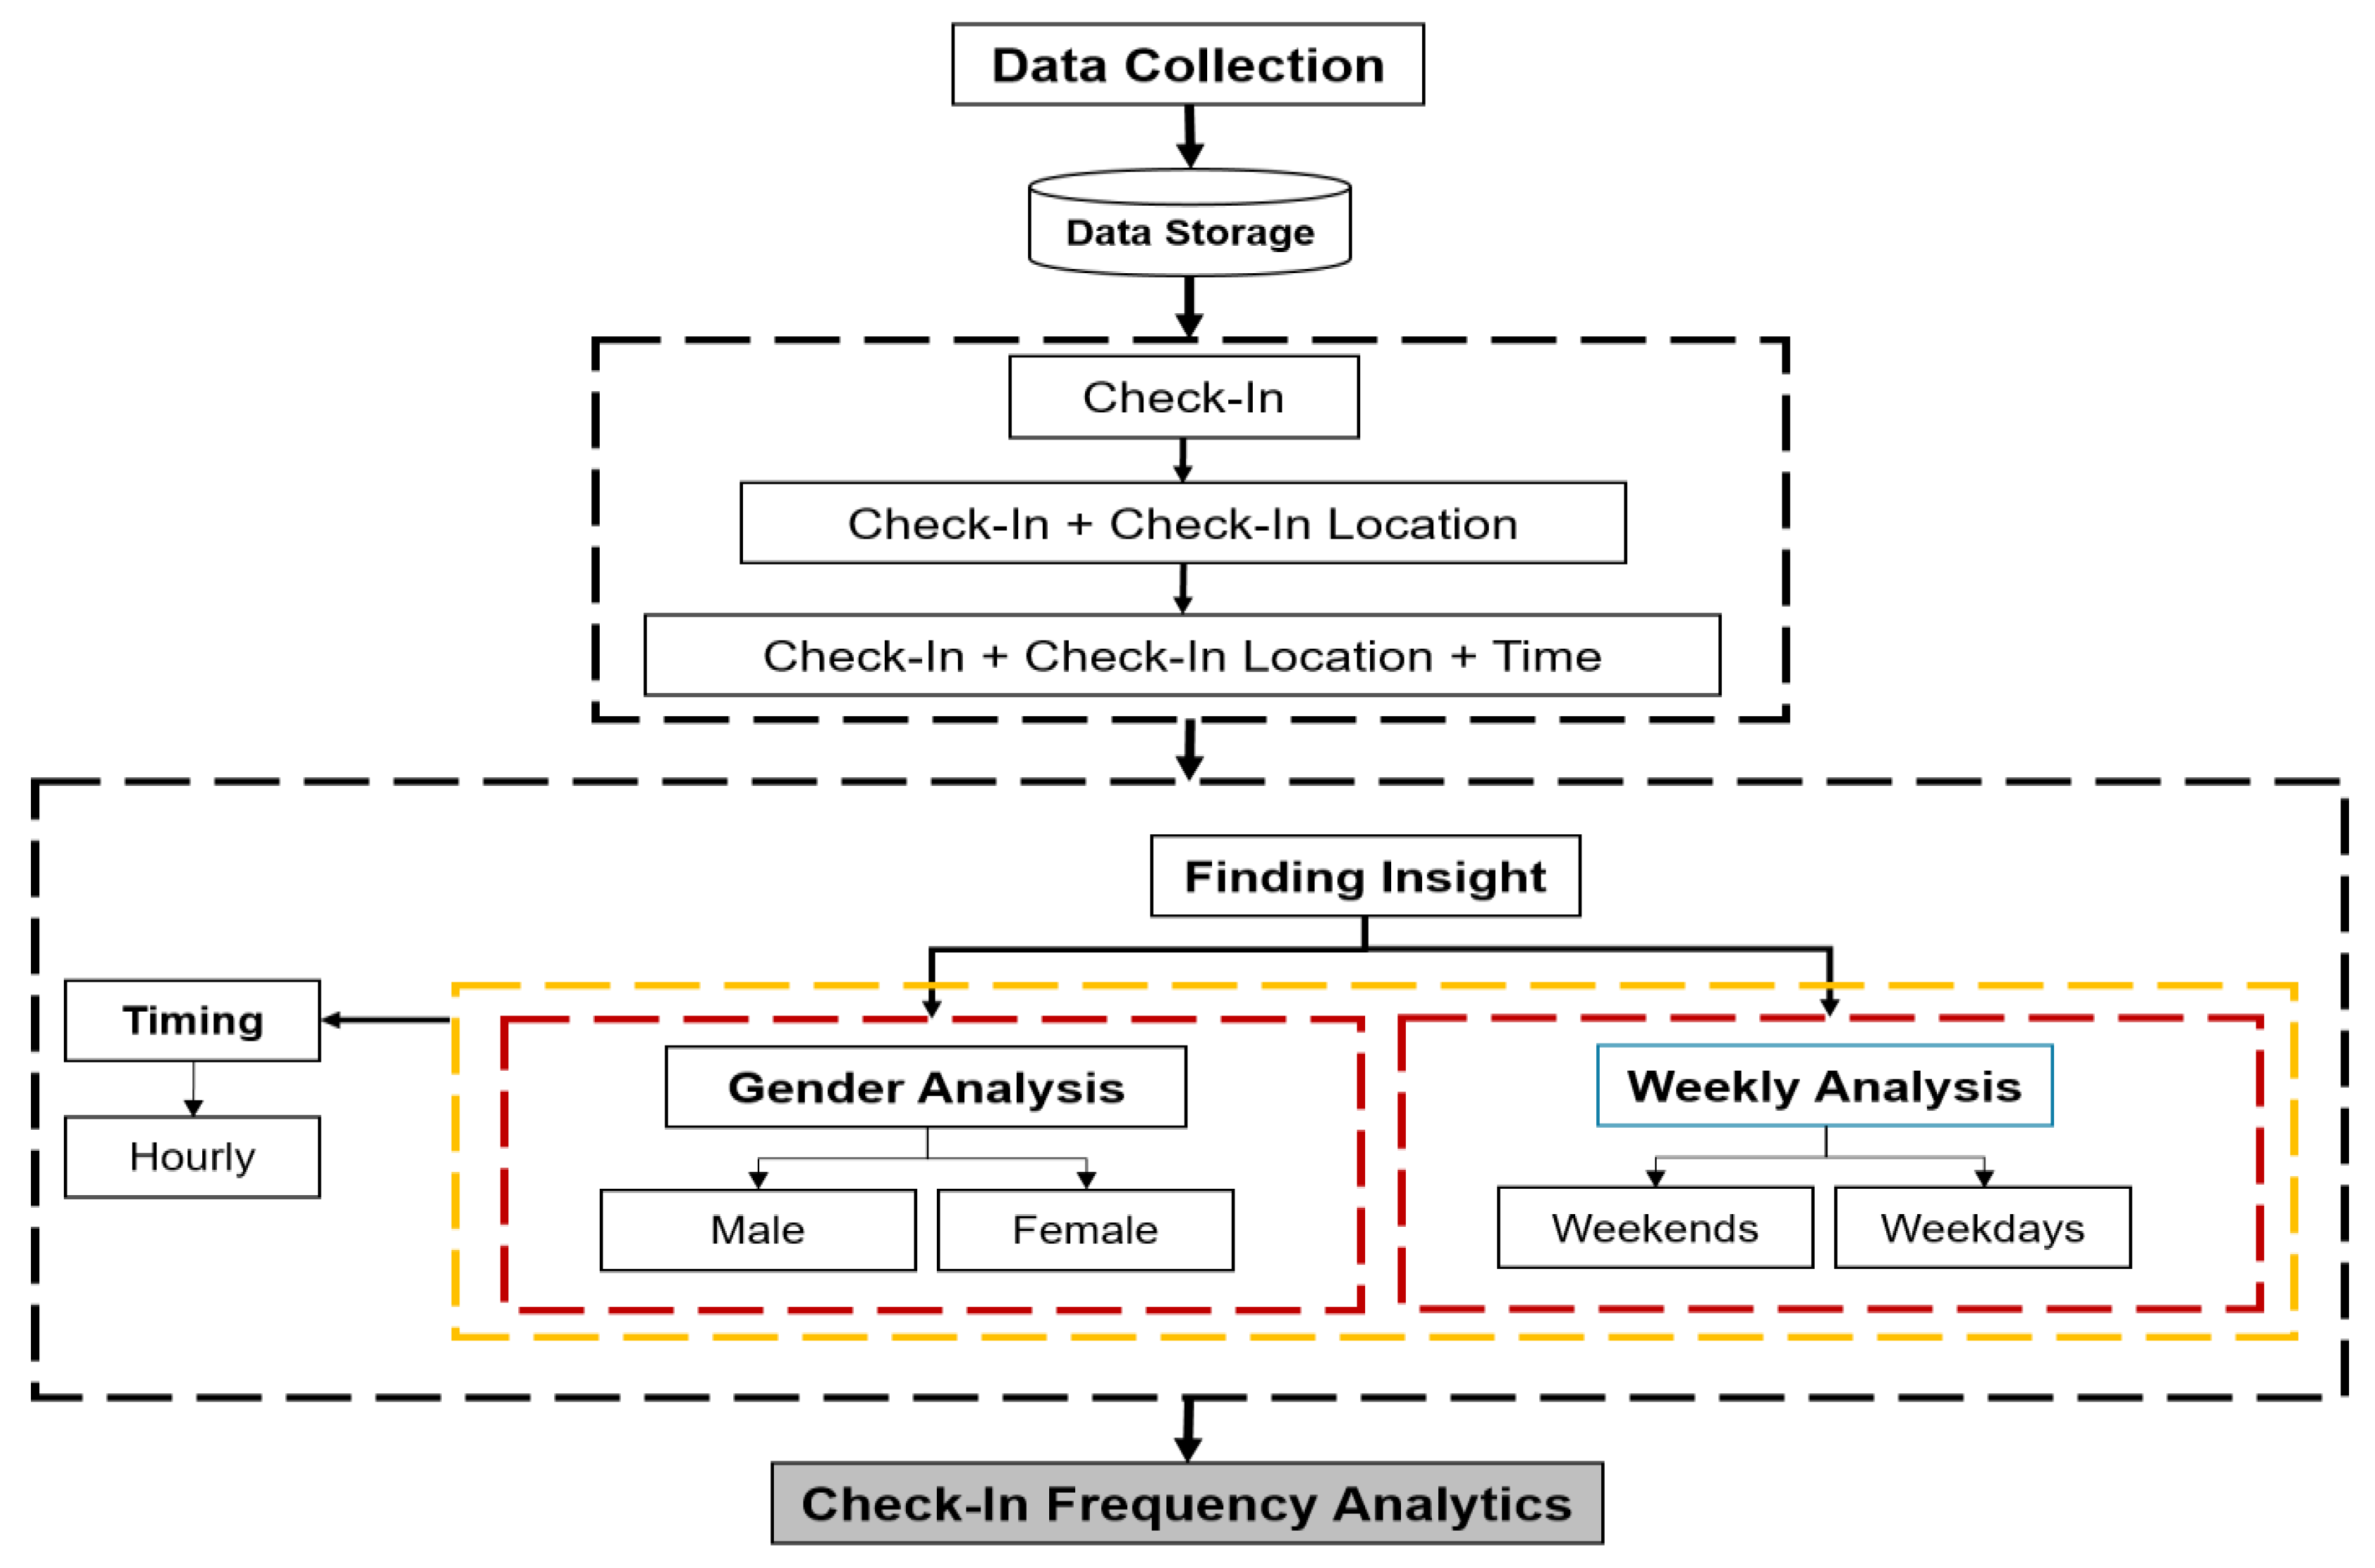
4. Methodology
- Each check-in must have following information available: user id, date, time, gender, geo-location (longitude and latitude);
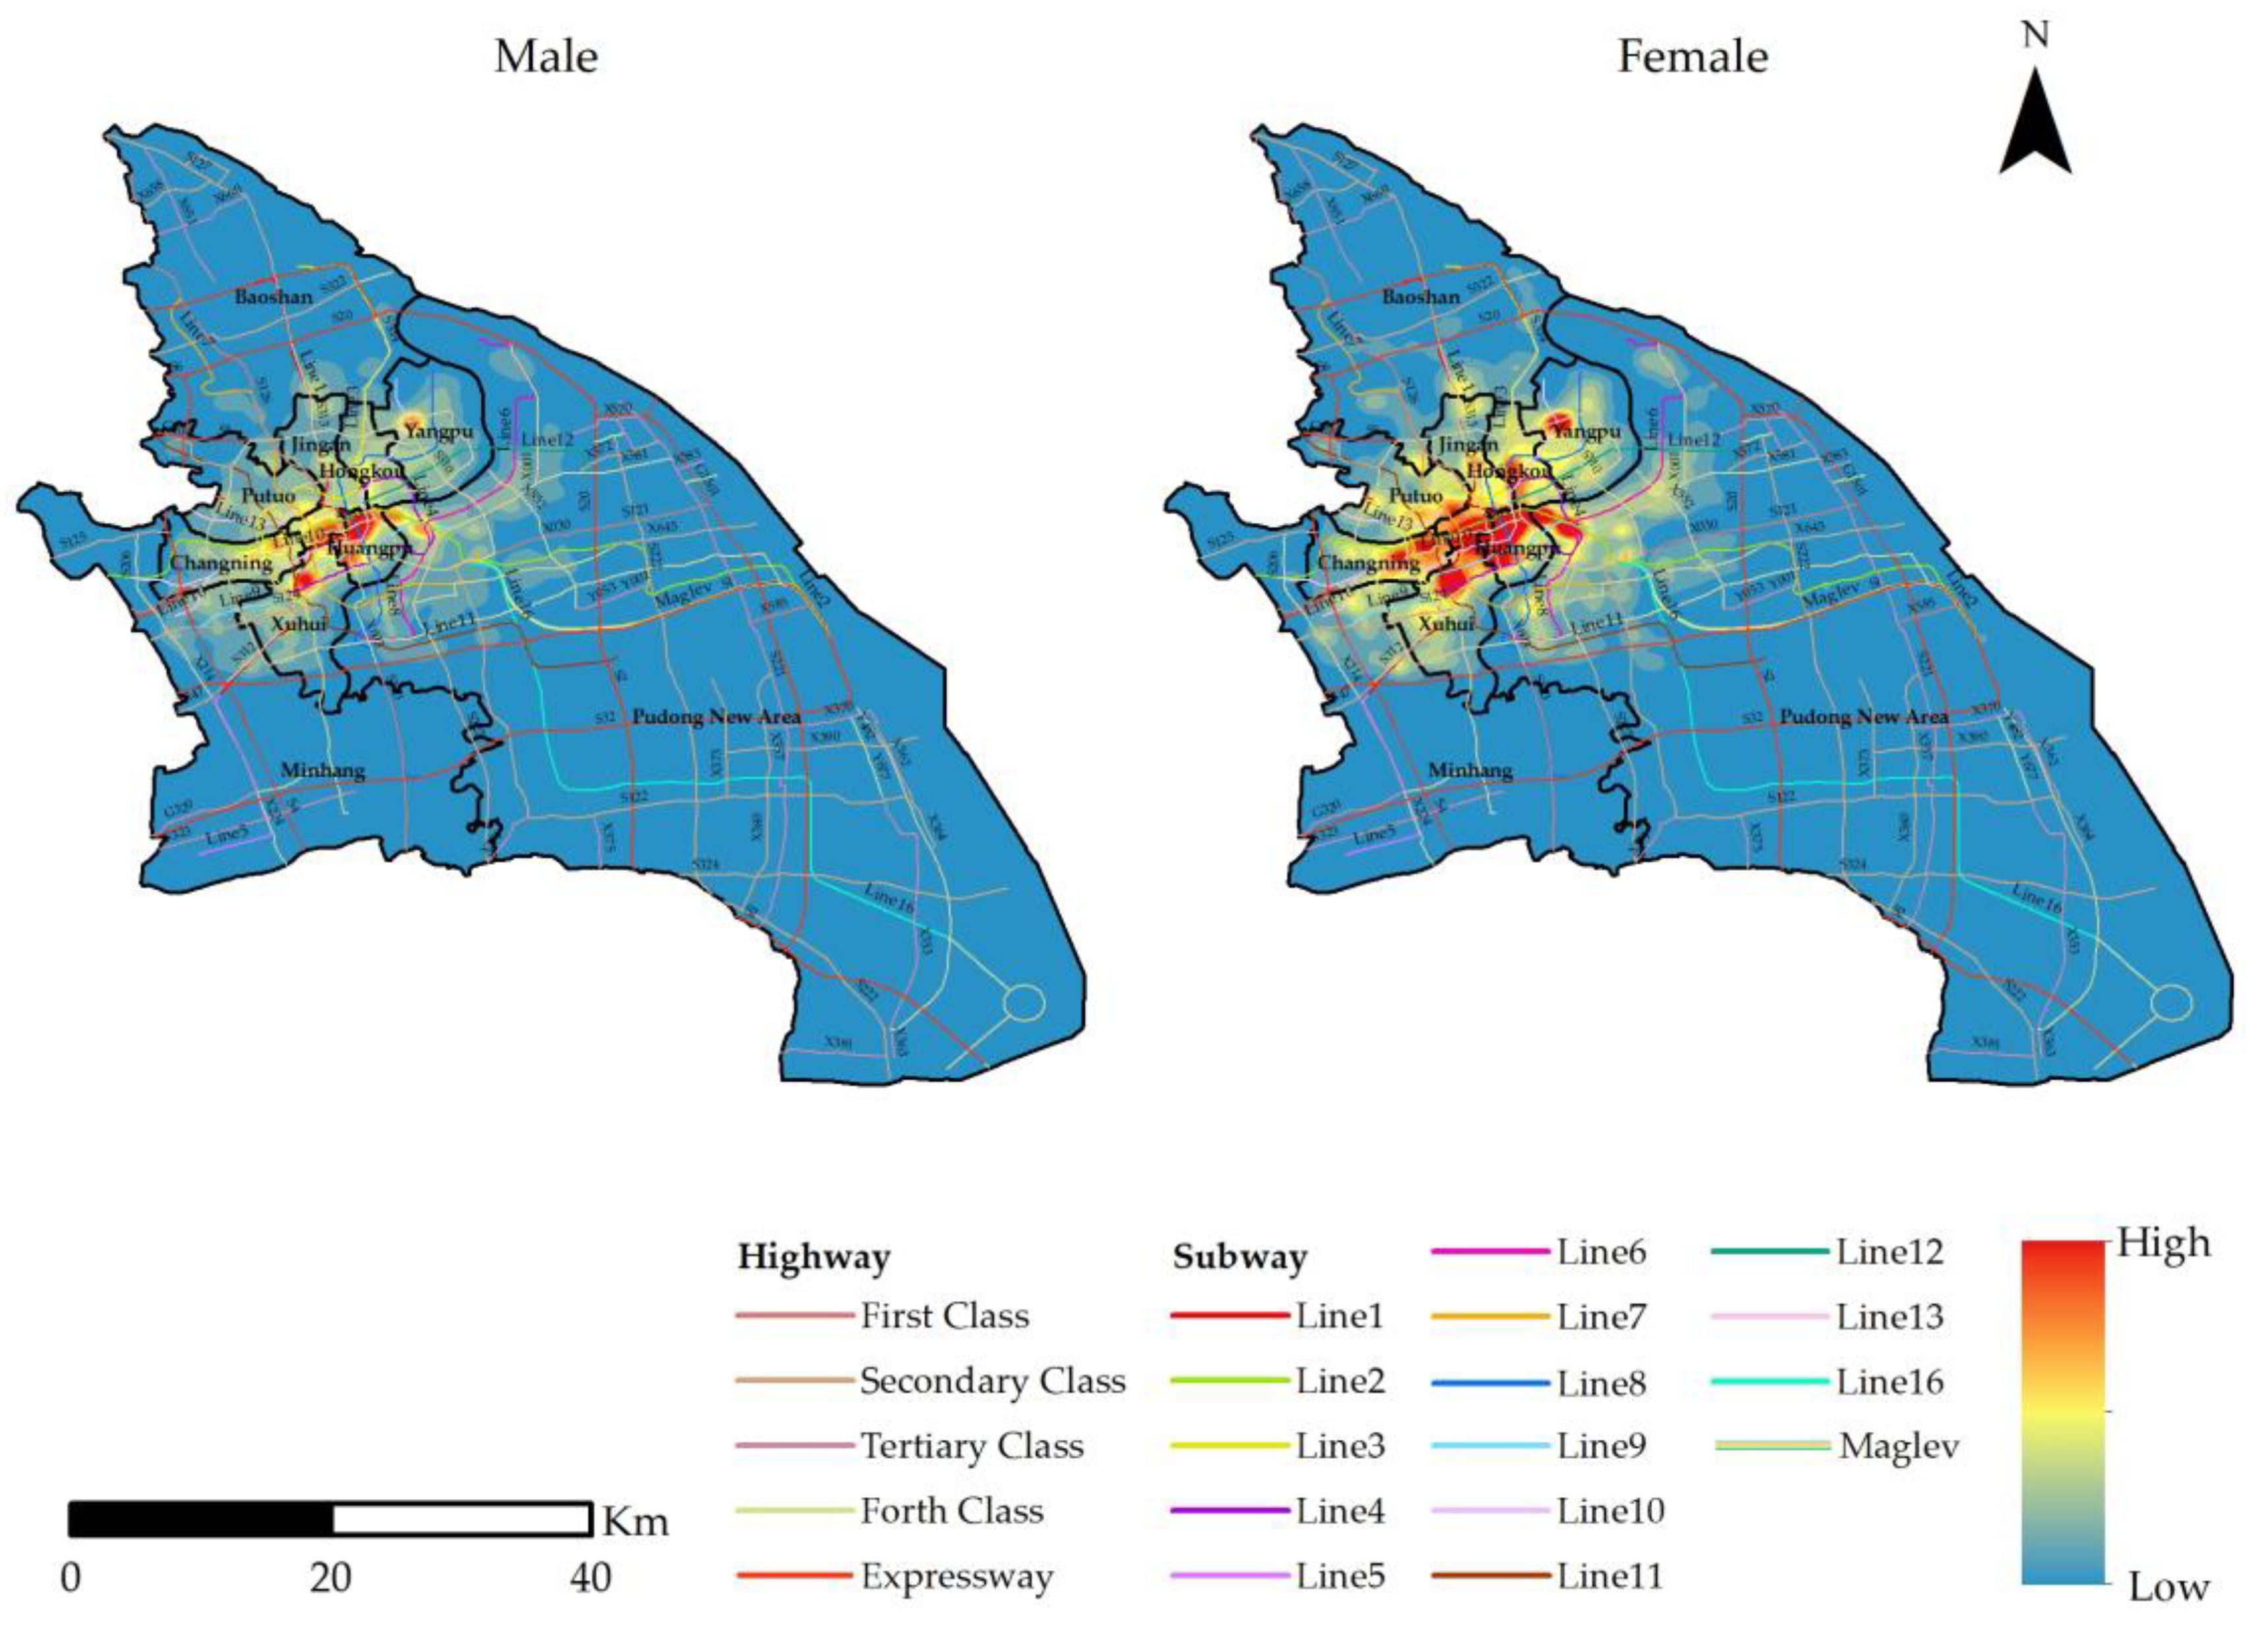
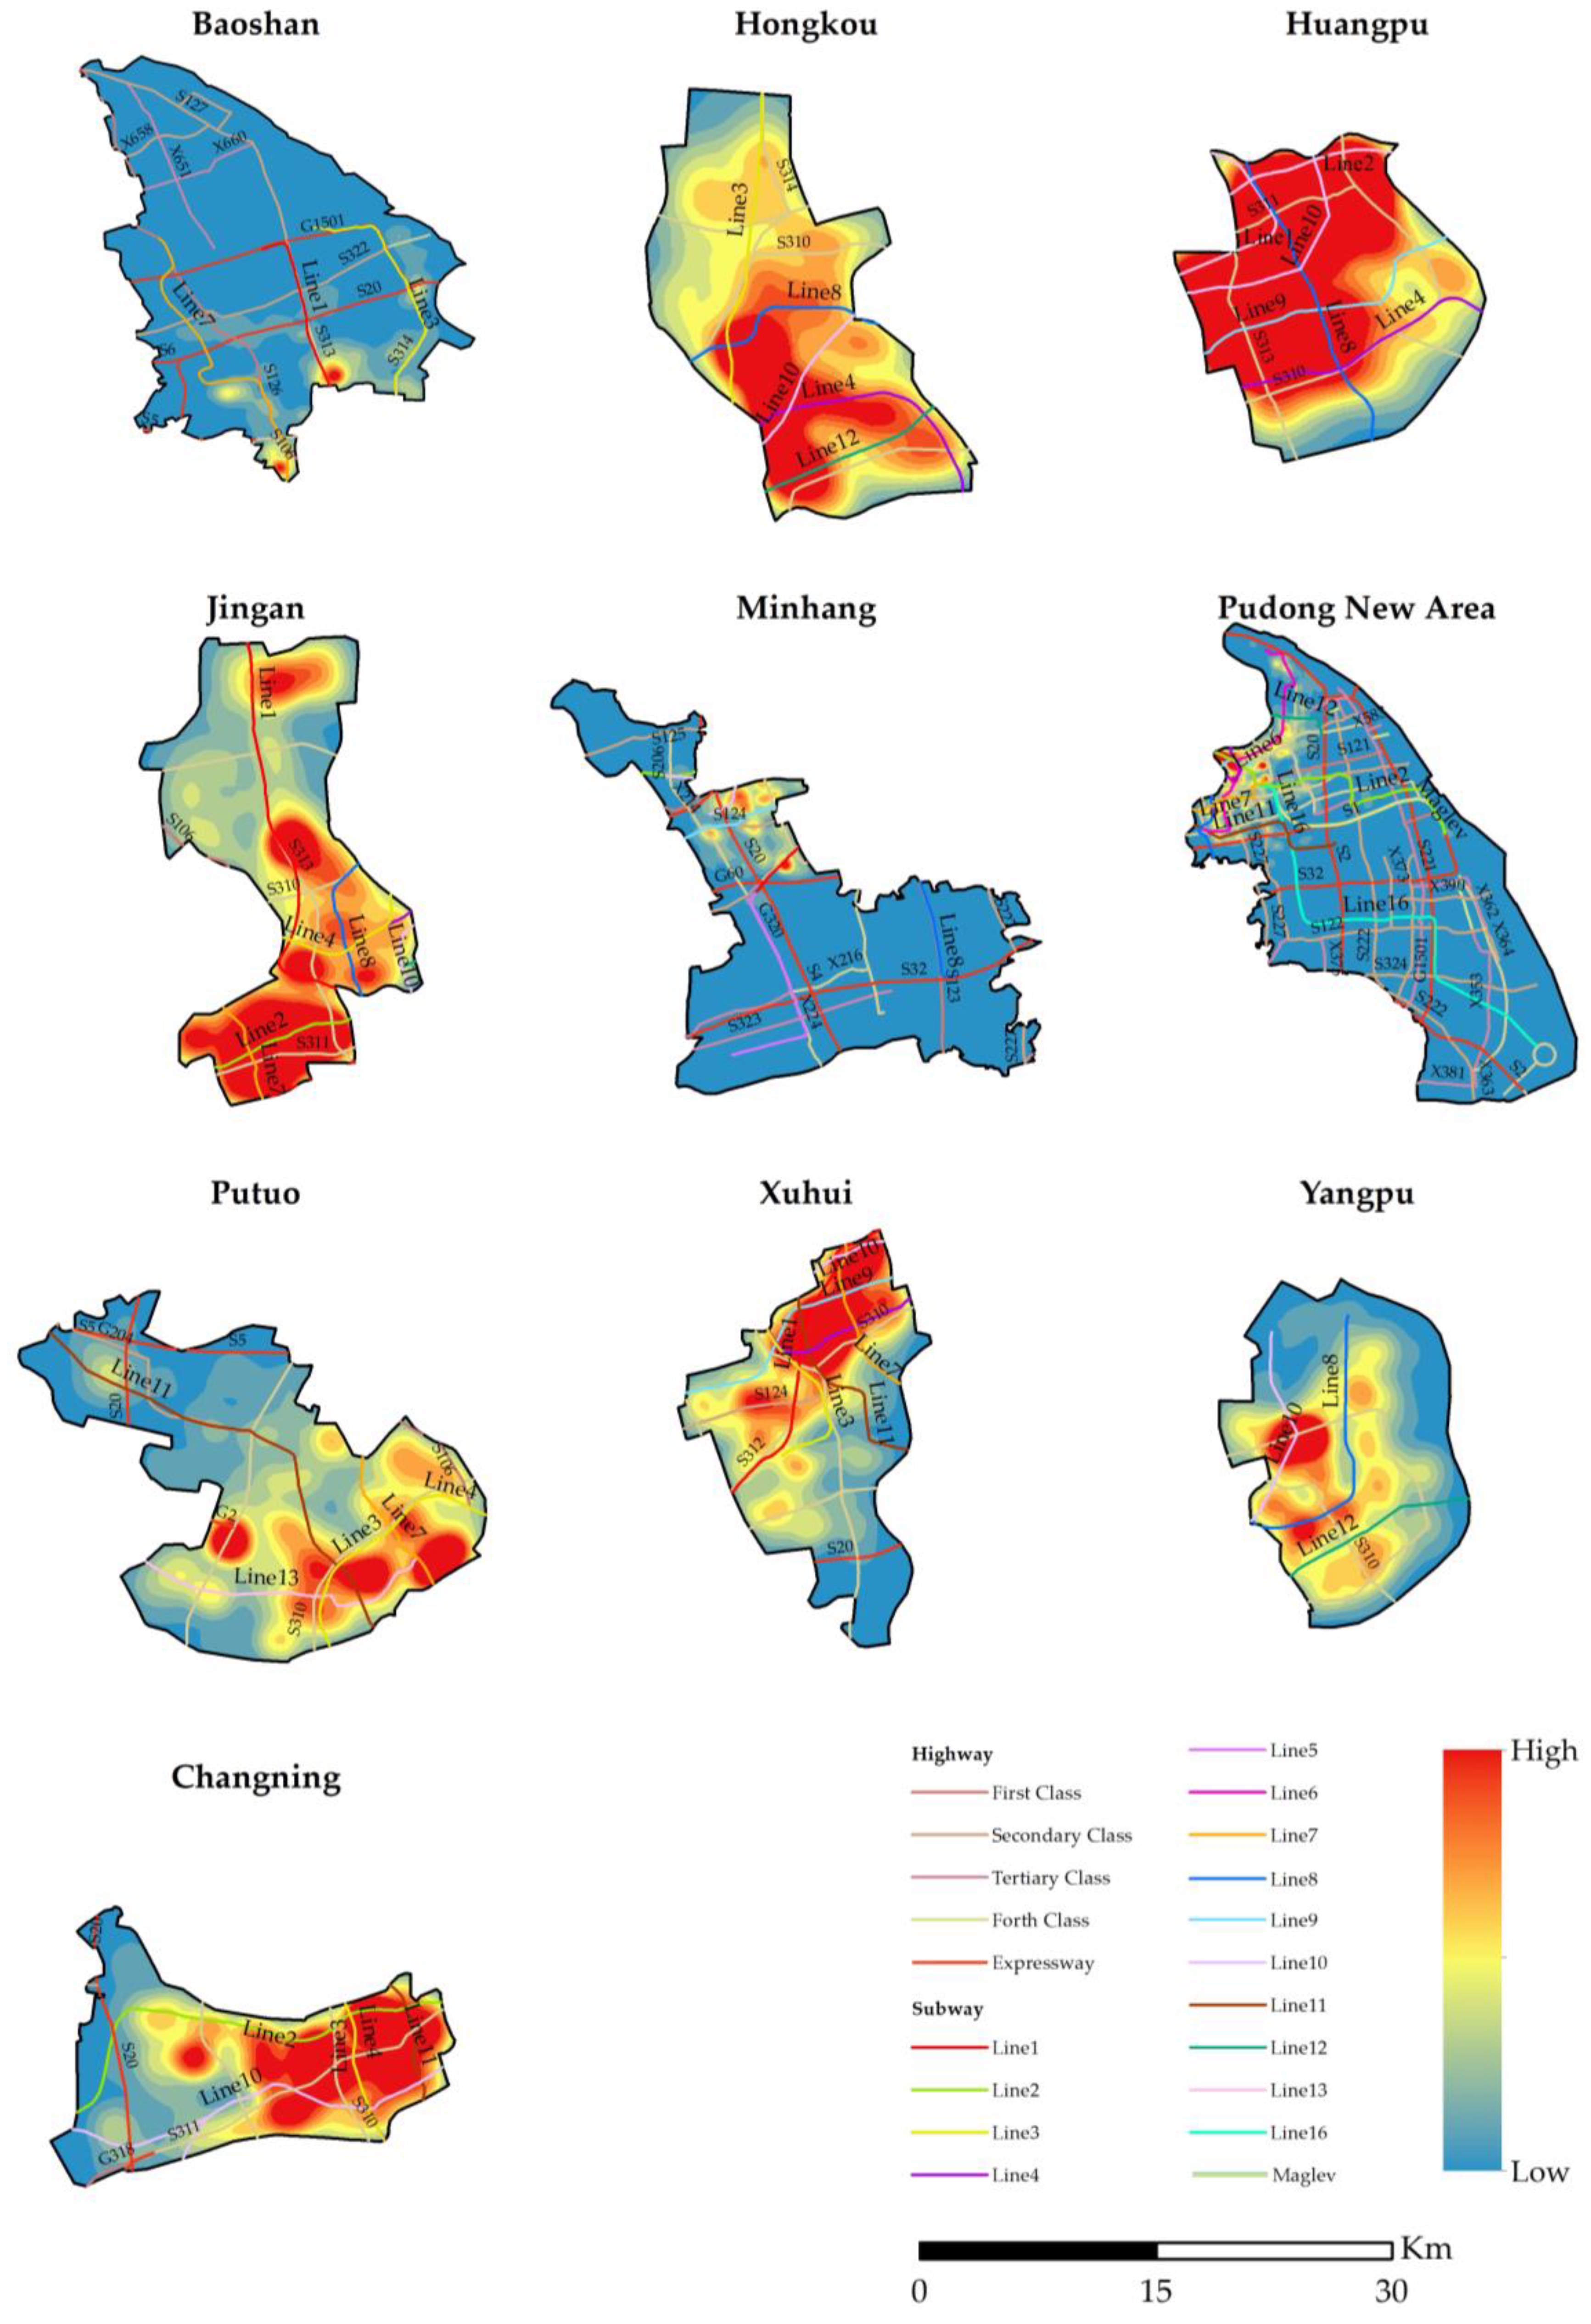
- The location of check-in is in Shanghai based on geo-coordinates as shown in Figure 1;
- The check-in lies within the date and time for the sampled data set;
- User(s) must have checked-in at least twice in a month, and the users with only one check-in record are considered invalid.
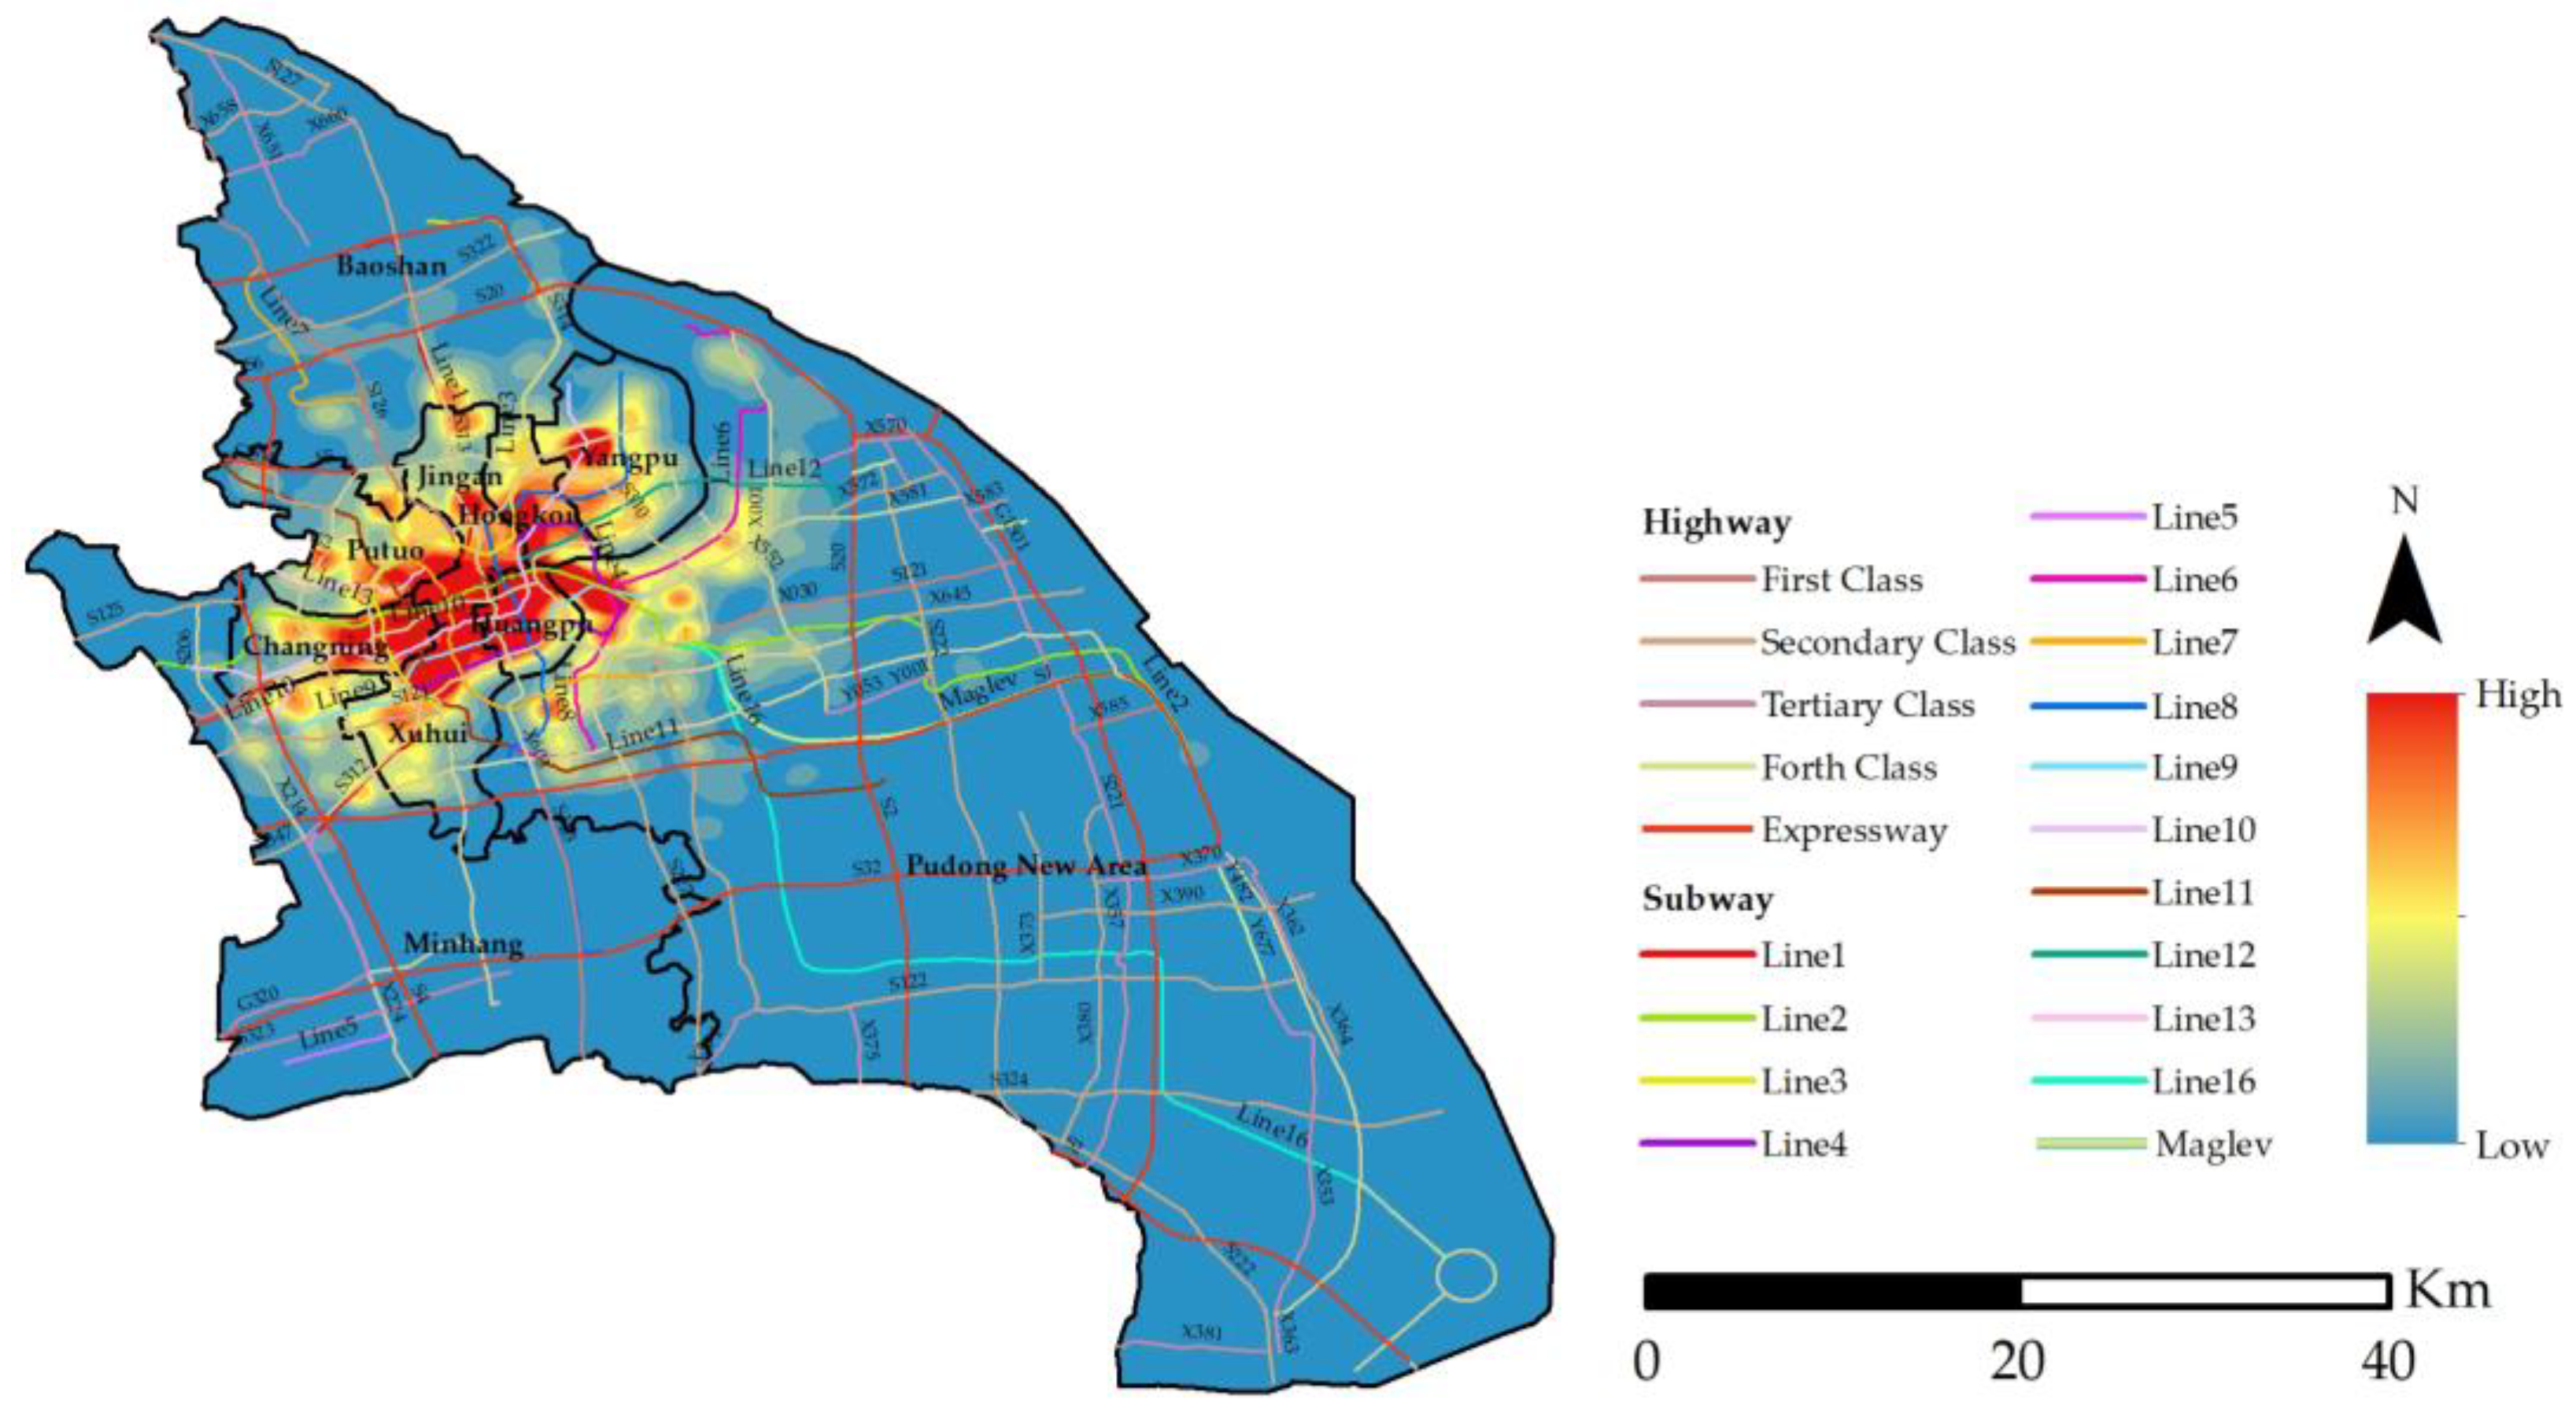
5. Results and Discussion
6. Conclusions
Author Contributions
Acknowledgments
Conflicts of Interest
References
- Kheiri, A.; Karimipour, F.; Forghani, M. Intra-urban movement flow estimation using location based social networking data. Int. Arch. Photogramm. Remote Sens. Spat. Inf. Sci. 2015, 40, 781. [Google Scholar] [CrossRef]
- Weibo. Available online: http://www.weibo.com (accessed on 21 March 2018).
- Facebook. Available online: https://www.facebook.com/ (accessed on 21 March 2018).
- Twitter. Available online: https://twitter.com/ (accessed on 21 March 2018).
- Lu, E.H.-C.; Chen, C.-Y.; Tseng, V.S. Personalized trip recommendation with multiple constraints by mining user check-in behaviors. In Proceedings of the 20th International Conference on Advances in Geographic Information Systems, Redondo Beach, CA, USA, 6–9 November 2012; pp. 209–218. [Google Scholar]
- Lin, X.; Lachlan, K.A.; Spence, P.R. Exploring extreme events on social media: A comparison of user reposting/retweeting behaviors on twitter and weibo. Comput. Hum. Behav. 2016, 65, 576–581. [Google Scholar] [CrossRef]
- De Mauro, A.; Greco, M.; Grimaldi, M. A formal definition of big data based on its essential features. Lib. Rev. 2016, 65, 122–135. [Google Scholar] [CrossRef]
- Miller, H.J.; Goodchild, M.F. Data-driven geography. GeoJournal 2015, 80, 449–461. [Google Scholar] [CrossRef]
- Charalabidis, Y.; Loukis, E. Participative public policy making through multiple social media platforms utilization. Int. J. Electron. Gov. Res. 2012, 8, 78–97. [Google Scholar] [CrossRef]
- López-Ornelas, E.; Abascal-Mena, R.; Zepeda-Hernández, S. Social media participation in urban planning: A new way to interact and take decisions. Int. Arch. Photogramm. Remote Sens. Spat. Inf. Sci. 2017, 42, 59. [Google Scholar] [CrossRef]
- Criado, J.I.; Sandoval-Almazan, R.; Gil-Garcia, J.R. Government Innovation through Social Media; Elsevier: Amsterdam, The Netherlands, 2013. [Google Scholar]
- Zheng, L.; Zheng, T. Innovation through social media in the public sector: Information and interactions. Gov. Inf. Q. 2014, 31, S106–S117. [Google Scholar] [CrossRef]
- Sobaci, M.Z.; Karkin, N. The use of twitter by mayors in turkey: Tweets for better public services? Gov. Inf. Q. 2013, 30, 417–425. [Google Scholar] [CrossRef]
- Agostino, D. Using social media to engage citizens: A study of Italian municipalities. Public Relat. Rev. 2013, 39, 232–234. [Google Scholar] [CrossRef]
- Graham, M.W.; Avery, E.J.; Park, S. The role of social media in local government crisis communications. Public Relat. Rev. 2015, 41, 386–394. [Google Scholar] [CrossRef]
- Tursunbayeva, A.; Franco, M.; Pagliari, C. Use of social media for e-government in the public health sector: A systematic review of published studies. Gov. Inf. Q. 2017, 34, 270–282. [Google Scholar] [CrossRef]
- Reed, P.J.; Khan, M.R.; Blumenstock, J. Observing gender dynamics and disparities with mobile phone metadata. In Proceedings of the Eighth International Conference on Information and Communication Technologies and Development, Ann Arbor, MI, USA, 3–6 June 2016; p. 48. [Google Scholar]
- Ellison, N.B.; Steinfield, C.; Lampe, C. The benefits of facebook “friends:” social capital and college students’ use of online social network sites. J. Comput. Med. Commun. 2007, 12, 1143–1168. [Google Scholar] [CrossRef]
- Erl, T.; Khattak, W.; Buhler, P. Big Data Fundamentals; Prentice Hall: Upper Saddle River, NJ, USA, 2016. [Google Scholar]
- Vastardis, N.; Yang, K. Mobile social networks: Architectures, social properties, and key research challenges. IEEE Commun. Surv. Tutor. 2013, 15, 1355–1371. [Google Scholar] [CrossRef]
- Ahmed, A.M.; Qiu, T.; Xia, F.; Jedari, B.; Abolfazli, S. Event-based mobile social networks: Services, technologies, and applications. IEEE Access 2014, 2, 500–513. [Google Scholar] [CrossRef]
- Andreassen, C.S. Online social network site addiction: A comprehensive review. Curr. Addict. Rep. 2015, 2, 175–184. [Google Scholar] [CrossRef]
- Bao, J.; Zheng, Y.; Wilkie, D.; Mokbel, M. Recommendations in location-based social networks: A survey. GeoInformatica 2015, 19, 525–565. [Google Scholar] [CrossRef]
- Symeonidis, P.; Ntempos, D.; Manolopoulos, Y. Location-based social networks. In Recommender Systems for Location-Based Social Networks; Springer: New York, NY, USA, 2014; pp. 35–48. [Google Scholar]
- Kumar, S.; Saravanakumar, K.; Deepa, K. On privacy and security in social media—A comprehensive study. Procedia Comput. Sci. 2016, 78, 114–119. [Google Scholar]
- Lowry, P.B.; Cao, J.; Everard, A. Privacy concerns versus desire for interpersonal awareness in driving the use of self-disclosure technologies: The case of instant messaging in two cultures. J. Manag. Inf. Syst. 2011, 27, 163–200. [Google Scholar] [CrossRef]
- Benson, V.; Saridakis, G.; Tennakoon, H. Information disclosure of social media users: Does control over personal information, user awareness and security notices matter? Inf. Technol. People 2015, 28, 426–441. [Google Scholar] [CrossRef]
- Strater, K.; Richter, H. Examining privacy and disclosure in a social networking community. In Proceedings of the 3rd Symposium on Usable Privacy and Security, Pittsburgh, PA, USA, 18–20 July 2007; pp. 157–158. [Google Scholar]
- Stefanone, M.A.; Huang, Y.C.; Lackaff, D. Negotiating Social Belonging: Online, Offline, and in-between. In Proceedings of the 2011 44th Hawaii International Conference on System Sciences (HICSS), Kauai, HI, USA, 4–7 January 2011; pp. 1–10. [Google Scholar]
- Boyd, D.M.; Ellison, N.B. Social network sites: Definition, history, and scholarship. J. Comput. Med. Commun. 2007, 13, 210–230. [Google Scholar] [CrossRef]
- Huang, H.-Y. Examining the beneficial effects of individual’s self-disclosure on the social network site. Comput. Hum. Behav. 2016, 57, 122–132. [Google Scholar] [CrossRef]
- Wong, C. Smartphone Location-Based Services in the Social, Mobile, and Surveillance Practices of Everyday Life. Master’s Thesis, University of London, London, UK, 2014. [Google Scholar]
- Zheng, Y.; Zhang, L.; Xie, X.; Ma, W.-Y. Mining correlation between locations using human location history. In Proceedings of the 17th ACM SIGSPATIAL International Conference on Advances in Geographic Information Systems, Seattle, WA, USA, 4–6 November 2009; pp. 472–475. [Google Scholar]
- Comito, C.; Falcone, D.; Talia, D. Mining human mobility patterns from social geo-tagged data. Pervasive Mob. Comput. 2016, 33, 91–107. [Google Scholar] [CrossRef]
- Altomare, A.; Cesario, E.; Comito, C.; Marozzo, F.; Talia, D. Trajectory pattern mining for urban computing in the cloud. IEEE Trans. Parallel Distrib. Syst. 2017, 28, 586–599. [Google Scholar] [CrossRef]
- Brimicombe, A.; Li, C. Location-Based Services and Geo-Information Engineering; John Wiley & Sons: Hoboken, NJ, USA, 2009; Volume 21. [Google Scholar]
- Cheng, Z.; Caverlee, J.; Lee, K.; Sui, D.Z. Exploring millions of footprints in location sharing services. ICWSM 2011, 2011, 81–88. [Google Scholar]
- Humphreys, L. Mobile social networks and urban public space. New Media Soc. 2010, 12, 763–778. [Google Scholar] [CrossRef]
- Roche, S. Geographic information science i: Why does a smart city need to be spatially enabled? Prog. Hum. Geogr. 2014, 38, 703–711. [Google Scholar] [CrossRef]
- Anthopoulos, L.G.; Vakali, A. Urban planning and smart cities: Interrelations and reciprocities. In The Future Internet Assembly; Springer: Berlin/Heidelberg, Germany, 2012; pp. 178–189. [Google Scholar]
- Scellato, S.; Noulas, A.; Lambiotte, R.; Mascolo, C. Socio-spatial properties of online location-based social networks. ICWSM 2011, 11, 329–336. [Google Scholar]
- Li, N.; Chen, G. Sharing location in online social networks. IEEE Netw. 2010, 24, 20–25. [Google Scholar] [CrossRef]
- Luo, F.; Cao, G.; Mulligan, K.; Li, X. Explore spatiotemporal and demographic characteristics of human mobility via twitter: A case study of Chicago. Appl. Geogr. 2016, 70, 11–25. [Google Scholar] [CrossRef]
- Rizwan, M.; Mahmood, S.; Wanggen, W.; Ali, S. Location based social media data analysis for observing check-in behavior and city rhythm in shanghai. In Proceedings of the 4th International Conference on Smart and Sustainable City (ICSSC 2017), Shanghai, China, 5–6 June 2017; pp. 1–8. [Google Scholar]
- Alharbi, B.; Qahtan, A.A.; Zhang, X. Minimizing user involvement for learning human mobility patterns from location traces. In Proceedings of the AAAI Conference on Artificial Intelligence, Phoenix, AZ, USA, 12–17 February 2016; pp. 865–871. [Google Scholar]
- Jin, L.; Long, X.; Zhang, K.; Lin, Y.-R.; Joshi, J. Characterizing users’ check-in activities using their scores in a location-based social network. Multimedia Syst. 2016, 22, 87–98. [Google Scholar] [CrossRef]
- Bao, J.; Lian, D.; Zhang, F.; Yuan, N.J. Geo-social media data analytic for user modeling and location-based services. SIGSPATIAL Spec. 2016, 7, 11–18. [Google Scholar] [CrossRef]
- Kung, K.S.; Greco, K.; Sobolevsky, S.; Ratti, C. Exploring universal patterns in human home-work commuting from mobile phone data. PLoS ONE 2014, 9, e96180. [Google Scholar] [CrossRef] [PubMed]
- Hoteit, S.; Secci, S.; Sobolevsky, S.; Ratti, C.; Pujolle, G. Estimating human trajectories and hotspots through mobile phone data. Comput. Netw. 2014, 64, 296–307. [Google Scholar] [CrossRef]
- Ye, Y.; Zheng, Y.; Chen, Y.; Feng, J.; Xie, X. Mining individual life pattern based on location history. In Proceedings of the 2009 Tenth International Conference on Mobile Data Management: Systems, Services and Middleware, Taipei, Taiwan, 18–20 May 2009; pp. 1–10. [Google Scholar]
- CHEN, B.-Y.; Kun, Y.; WANG, J.-S.; SUN, M.-Z. Research on evaluation of popularity of lijiang scenic area based on microblog data. DEStech Trans. Comput. Sci. Eng. 2017. [Google Scholar] [CrossRef]
- Zhen, F.; Cao, Y.; Qin, X.; Wang, B. Delineation of an urban agglomeration boundary based on sina weibo microblog ‘check-in’data: A case study of the Yangtze River delta. Cities 2017, 60, 180–191. [Google Scholar] [CrossRef]
- Shen, Y.; Karimi, K.; Law, S. Encounter and its configurational logic: Understanding spatiotemporal co-presence with road network and social media check-in data. In Proceedings of the 11th International Space Syntax Symposium, Instituto Superior Técnico, Portugal, 3–7 July 2017; Volume 11, pp. 111.111–111.122. [Google Scholar]
- Wu, C.; Ye, X.; Ren, F.; Du, Q. Check-in behaviour and spatio-temporal vibrancy: An exploratory analysis in shenzhen, china. Cities 2018, 77, 104–116. [Google Scholar] [CrossRef]
- Soliman, A.; Soltani, K.; Yin, J.; Padmanabhan, A.; Wang, S. Social sensing of urban land use based on analysis of twitter users’ mobility patterns. PLoS ONE 2017, 12, e0181657. [Google Scholar] [CrossRef] [PubMed]
- Chen, C.; Ma, J.; Susilo, Y.; Liu, Y.; Wang, M. The promises of big data and small data for travel behavior (aka human mobility) analysis. Transp. Res. Part C Emerg. Technol. 2016, 68, 285–299. [Google Scholar] [CrossRef] [PubMed]
- Hesse, B.W.; Moser, R.P.; Riley, W.T. From big data to knowledge in the social sciences. Ann. Am. Acad. Polit. Soc. Sci. 2015, 659, 16–32. [Google Scholar] [CrossRef] [PubMed]
- Gao, H.; Liu, H. Mining human mobility in location-based social networks. Synth. Lect. Data Min. Knowl. Discov. 2015, 7, 1–115. [Google Scholar] [CrossRef]
- Ye, M.; Janowicz, K.; Mülligann, C.; Lee, W.-C. What you are is when you are: The temporal dimension of feature types in location-based social networks. In Proceedings of the 19th ACM SIGSPATIAL International Conference on Advances in Geographic Information Systems, Chicago, IL, USA, 1–4 November 2011; pp. 102–111. [Google Scholar]
- Ye, M.; Shou, D.; Lee, W.-C.; Yin, P.; Janowicz, K. On the semantic annotation of places in location-based social networks. In Proceedings of the 17th ACM SIGKDD International Conference on Knowledge Discovery and Data Mining, San Diego, CA, USA, 21–24 August 2011; pp. 520–528. [Google Scholar]
- Lian, D.; Xie, X. Learning location naming from user check-in histories. In Proceedings of the 19th ACM SIGSPATIAL International Conference on Advances in Geographic Information Systems, Chicago, IL, USA, 1–4 November 2011; pp. 112–121. [Google Scholar]
- Noulas, A.; Scellato, S.; Mascolo, C.; Pontil, M. An empirical study of geographic user activity patterns in foursquare. ICwSM 2011, 11, 2. [Google Scholar]
- Yu, X.; Ding, Y.; Wan, W.; Thuillier, E. Explore hot spots of city based on dbscan algorithm. In Proceedings of the 2014 International Conference on Audio, Language and Image Processing (ICALIP), Shanghai, China, 7–9 July 2014; pp. 588–591. [Google Scholar]
- Cui, L.; Shi, J. Urbanization and its environmental effects in shanghai, china. Urban Clim. 2012, 2, 1–15. [Google Scholar] [CrossRef]
- Han, B.; Cook, P.; Baldwin, T. Geolocation prediction in social media data by finding location indicative words. Proc. COLING 2012, 1045–1062. [Google Scholar]
- Schoen, H.; Gayo-Avello, D.; Takis Metaxas, P.; Mustafaraj, E.; Strohmaier, M.; Gloor, P. The power of prediction with social media. Internet Res. 2013, 23, 528–543. [Google Scholar] [CrossRef]
- Backstrom, L.; Sun, E.; Marlow, C. Find me if you can: Improving geographical prediction with social and spatial proximity. In Proceedings of the 19th International Conference on World wide web, Raleigh, NC, USA, 26–30 April 2010; pp. 61–70. [Google Scholar]
- Sun, Y.; Li, M. Investigation of travel and activity patterns using location-based social network data: A case study of active mobile social media users. ISPRS Int. J. Geo-Inf. 2015, 4, 1512–1529. [Google Scholar] [CrossRef]
- Gu, Z.; Zhang, Y.; Chen, Y.; Chang, X. Analysis of attraction features of tourism destinations in a mega-city based on check-in data mining—A case study of shenzhen, china. ISPRS Int. J. Geo-Inf. 2016, 5, 210. [Google Scholar] [CrossRef]
- Yin, J.; Lampert, A.; Cameron, M.; Robinson, B.; Power, R. Using social media to enhance emergency situation awareness. IEEE Intell. Syst. 2012, 27, 52–59. [Google Scholar] [CrossRef]
- Yates, D.; Paquette, S. Emergency knowledge management and social media technologies: A case study of the 2010 Haitian earthquake. Int. J. Inf. Manag. 2011, 31, 6–13. [Google Scholar] [CrossRef]
- Cervone, G.; Schnebele, E.; Waters, N.; Moccaldi, M.; Sicignano, R. Using social media and satellite data for damage assessment in urban areas during emergencies. In Seeing Cities through Big Data; Springer: Cham, Switzerland, 2017; pp. 443–457. [Google Scholar]
- Wang, Y.; Wang, T.; Ye, X.; Zhu, J.; Lee, J. Using social media for emergency response and urban sustainability: A case study of the 2012 Beijing rainstorm. Sustainability 2015, 8, 25. [Google Scholar] [CrossRef]
- Hong, I. Spatial analysis of location-based social networks in Seoul, Korea. J. Geogr. Inf. Syst. 2015, 7, 259. [Google Scholar] [CrossRef]
- Liu, K.; Li, L.; Jiang, T.; Chen, B.; Jiang, Z.; Wang, Z.; Chen, Y.; Jiang, J.; Gu, H. Chinese public attention to the outbreak of ebola in west africa: Evidence from the online big data platform. Int. J. Environ. Res. Public Health 2016, 13, 780. [Google Scholar] [CrossRef] [PubMed]
- Blumenstock, J.E.; Gillick, D.; Eagle, N. Who’s calling? Demographics of mobile phone use in Rwanda. Transportation 2010, 32, 2–5. [Google Scholar]
- Wu, C.; Ye, X.; Ren, F.; Wan, Y.; Ning, P.; Du, Q. Spatial and social media data analytics of housing prices in shenzhen, china. PLoS ONE 2016, 11, e0164553. [Google Scholar] [CrossRef] [PubMed]
- Preoţiuc-Pietro, D.; Cohn, T. Mining user behaviours: A study of check-in patterns in location based social networks. In Proceedings of the 5th Annual ACM Web Science Conference, Paris, France, 2–4 May 2013; pp. 306–315. [Google Scholar]
- Kylasa, S.B.; Kollias, G.; Grama, A. Social ties and checkin sites: Connections and latent structures in location-based social networks. Soc. Netw. Anal. Min. 2016, 6, 95. [Google Scholar] [CrossRef]
- Li, J.; Fang, W.; Wang, T.; Qureshi, S.; Alatalo, J.M.; Bai, Y. Correlations between socioeconomic drivers and indicators of urban expansion: Evidence from the heavily urbanised shanghai metropolitan area, China. Sustainability 2017, 9, 1199. [Google Scholar] [CrossRef]
- Ross, C. Regional China: A Business and Economic Handbook by Rongxing Guo; Palgrave Macmillan: New York, NY, USA, 2013; p. 386. [Google Scholar]
- Gu, X.; Tao, S.; Dai, B. Spatial accessibility of country parks in shanghai, china. Urban For. Urban Green. 2017, 27, 373–382. [Google Scholar] [CrossRef]
- Jiang, Y.; Shi, X.; Zhang, S.; Ji, J. The threshold effect of high-level human capital investment on china’s urban-rural income gap. China Agric. Econom. Rev. 2011, 3, 297–320. [Google Scholar] [CrossRef]
- Xiong, X.; Jin, C.; Chen, H.; Luo, L. Using the fusion proximal area method and gravity method to identify areas with physician shortages. PLoS ONE 2016, 11, e0163504. [Google Scholar] [CrossRef] [PubMed]
- Shen, J.; Kee, G. Shanghai: Urban development and regional integration through mega projects. In Development and Planning in Seven Major Coastal Cities in Southern and Eastern China; Springer: Cham, Switzerland, 2017; pp. 119–151. [Google Scholar]
- Shen, J.; Kee, G. Development and Planning in Seven Major Coastal Cities in Southern and Eastern China; Springer: Cham, Switzerland, 2016; Volume 120. [Google Scholar]
- Zhang, X.; Butts, C.T. Activity correlation spectroscopy: A novel method for inferring social relationships from activity data. Soc. Netw. Anal. Min. 2017, 7, 1. [Google Scholar] [CrossRef]
- Lichman, M.; Smyth, P. Modeling human location data with mixtures of kernel densities. In Proceedings of the 20th ACM SIGKDD International Conference on Knowledge Discovery and Data Mining, New York, NY, USA, 24–27 August 2014; pp. 35–44. [Google Scholar]
- Xie, Z.; Yan, J. Kernel density estimation of traffic accidents in a network space. Comput. Environ. Urban Syst. 2008, 32, 396–406. [Google Scholar] [CrossRef]
- Silverman, B.W. Density Estimation for Statistics and Data Analysis; CRC Press: Boca Raton, FL, USA, 1986; Volume 26. [Google Scholar]
- Van Iddekinge, C.H.; Lanivich, S.E.; Roth, P.L.; Junco, E. Social media for selection? Validity and adverse impact potential of a facebook-based assessment. J. Manag. 2016, 42, 1811–1835. [Google Scholar] [CrossRef]


| Study Sample | |
|---|---|
| Total check-ins | 852,560 |
| Total users | 20,634 |
| Date range | January–March 2016 |
| City of study | Shanghai, China |
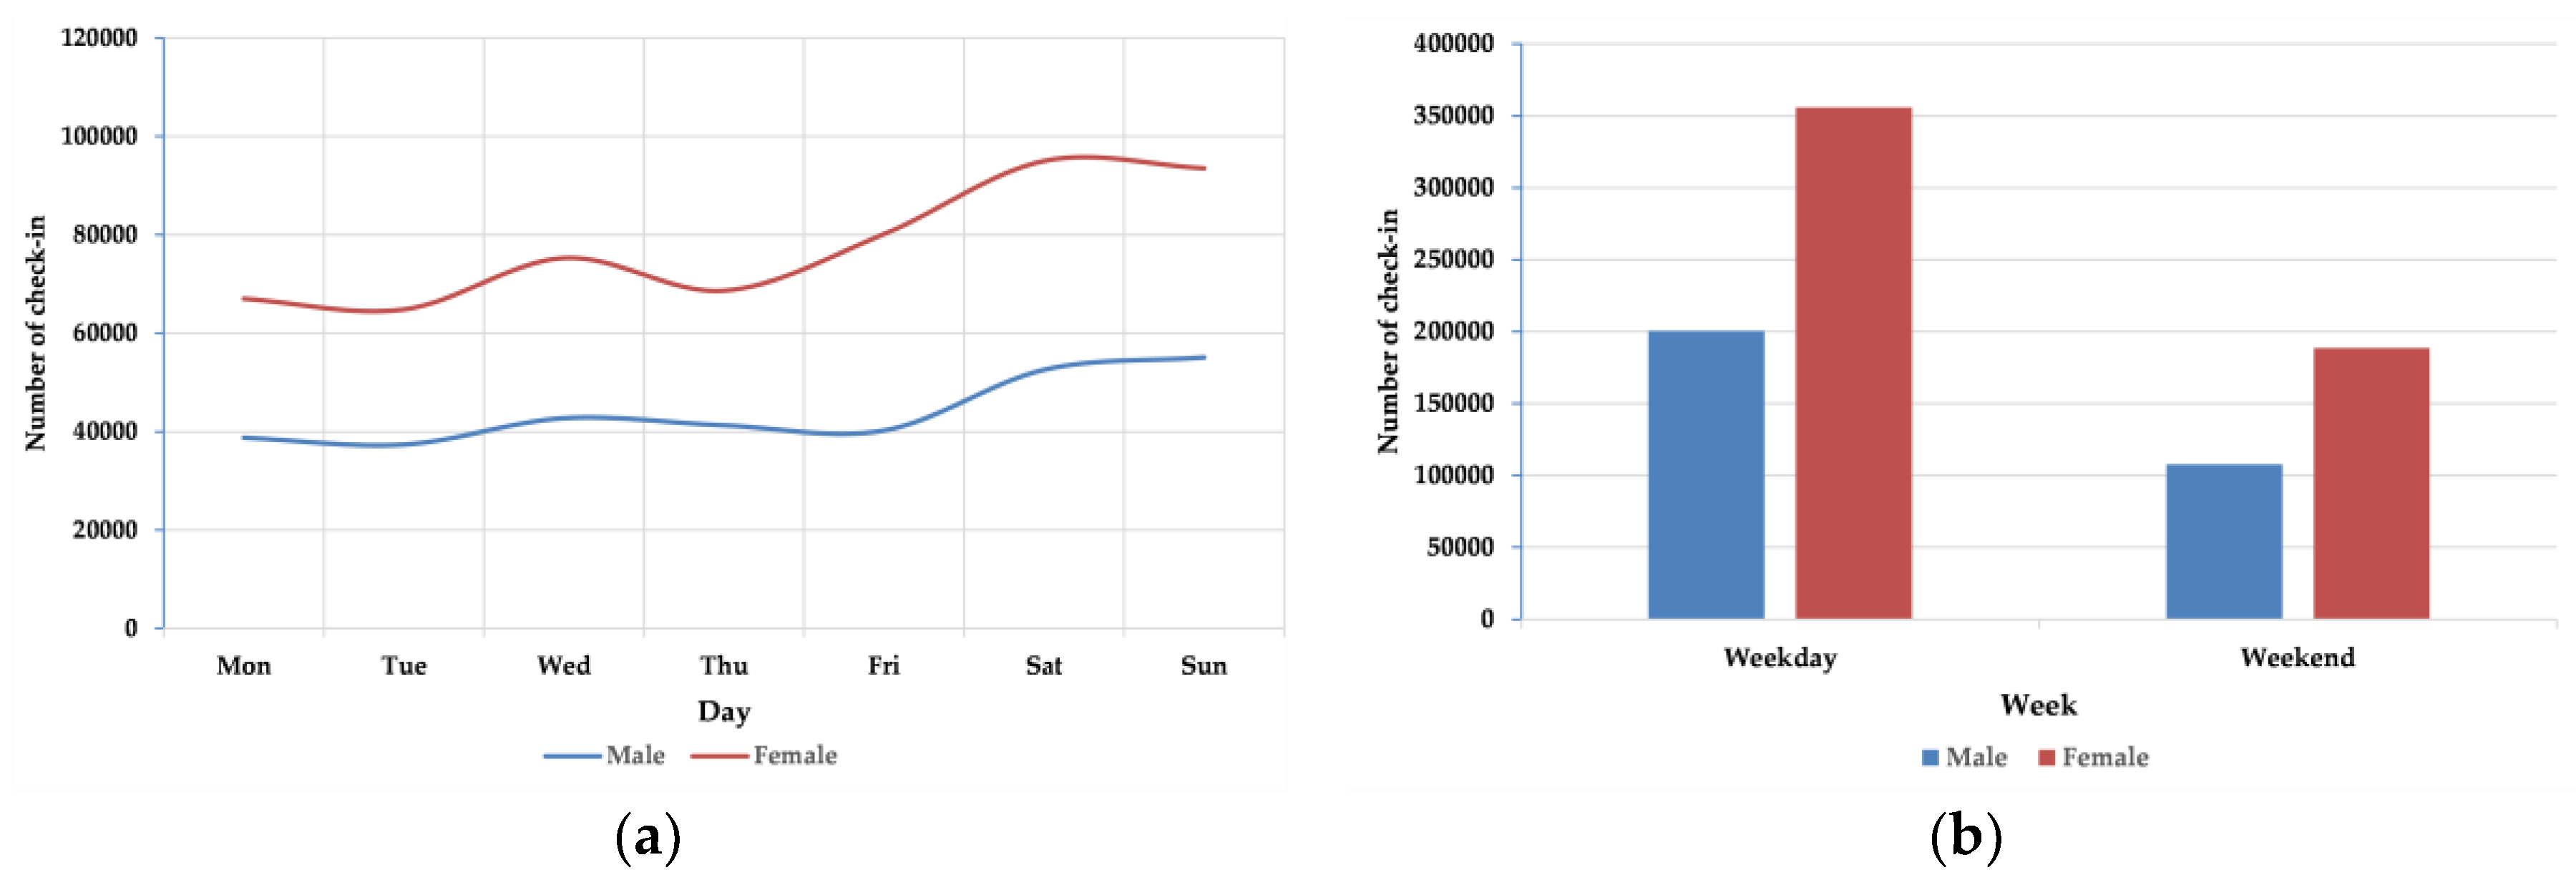
| Week | Male | Female | dr |
|---|---|---|---|
| Weekday | 23.50% | 41.75% | 0.559 |
| Weekend | 12.63% | 22.12% | 0.546 |
| Day | Male | Female | dr |
|---|---|---|---|
| Mon | 4.55% | 7.86% | 0.534 |
| Tue | 4.38% | 7.60% | 0.538 |
| Wed | 5.01% | 8.83% | 0.551 |
| Thu | 4.84% | 8.05% | 0.498 |
| Fri | 4.72% | 9.40% | 0.663 |
| Sat | 6.17% | 11.15% | 0.575 |
| Sun | 6.46% | 10.97% | 0.517 |
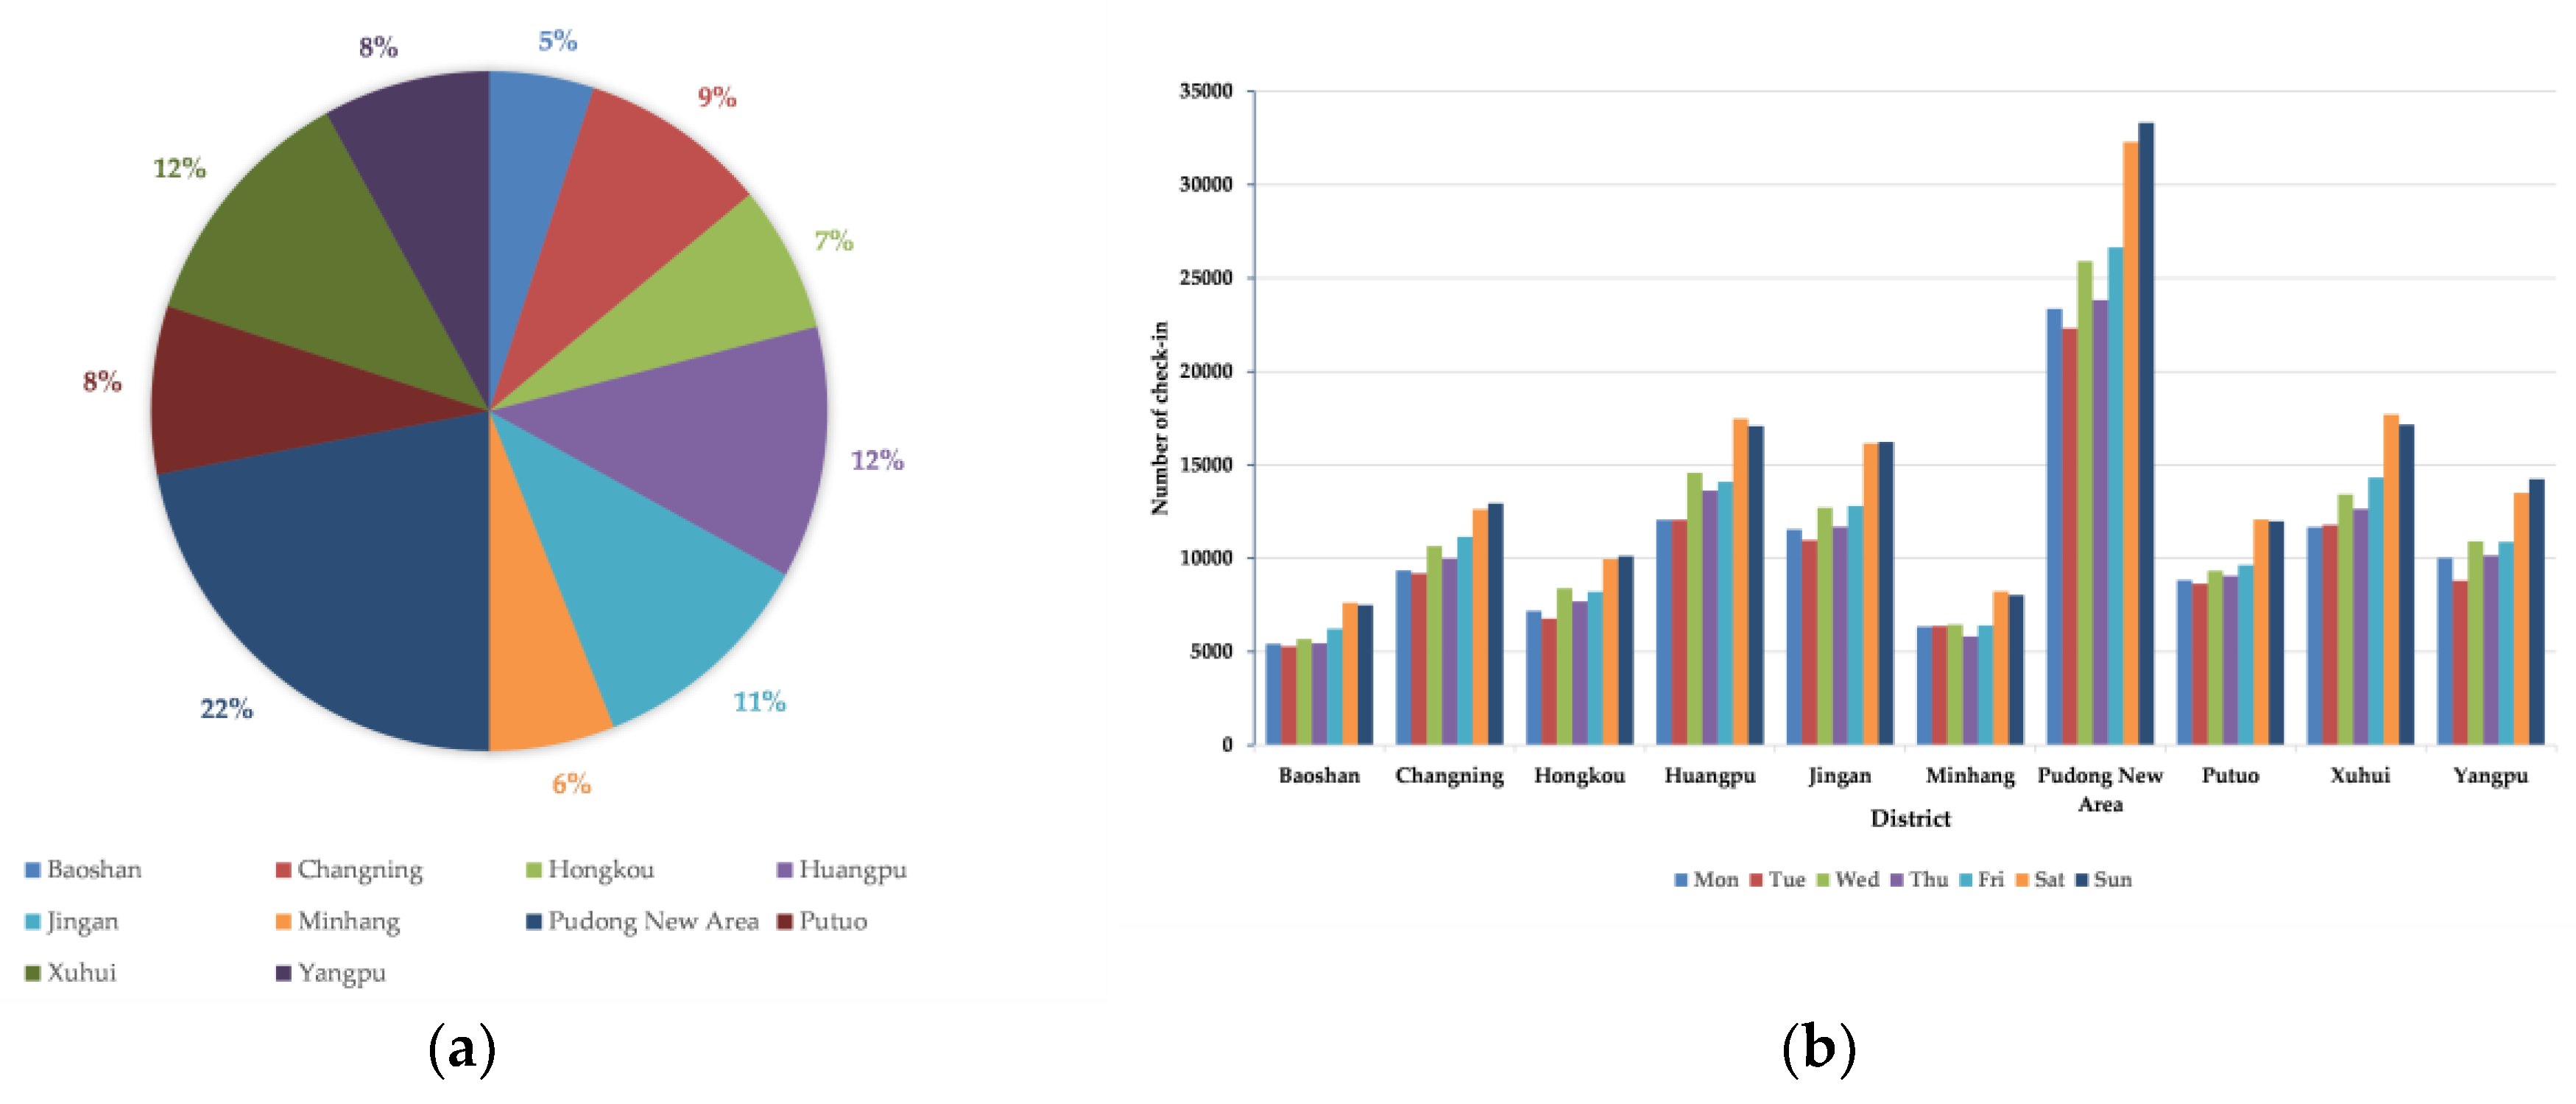
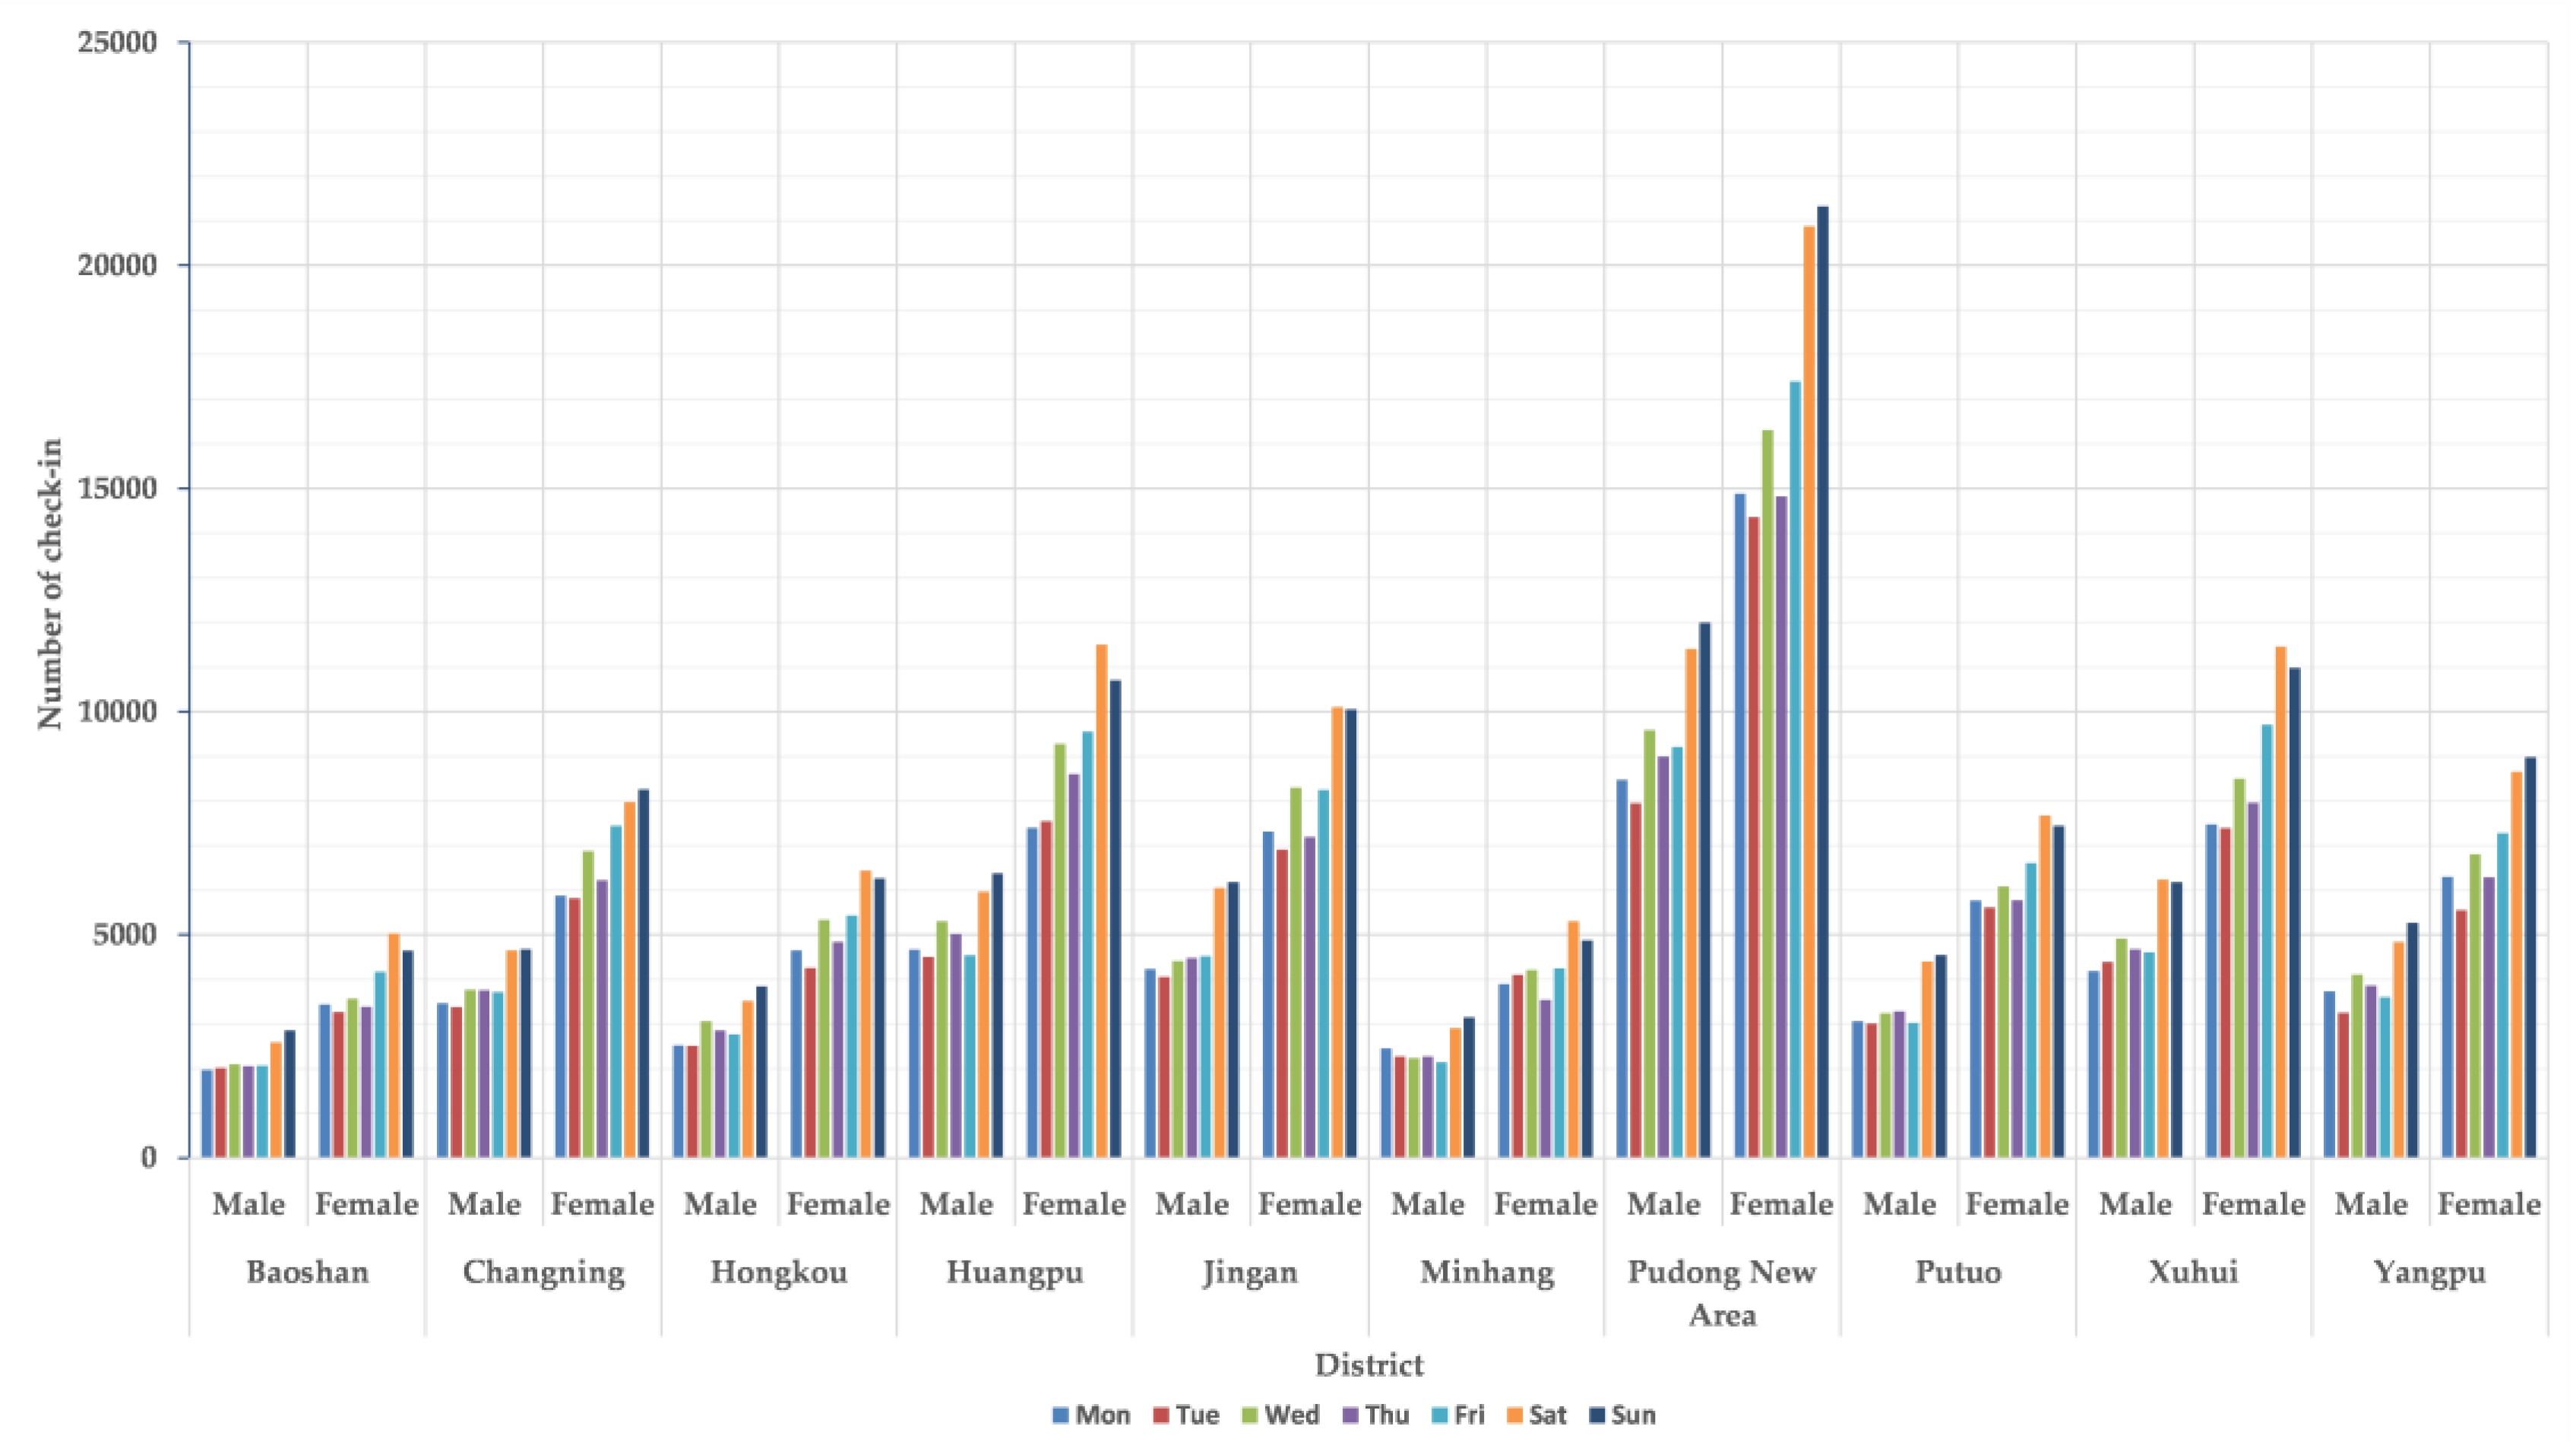
| District | (Check-In) Percentage | dr | |
|---|---|---|---|
| Male | Female | ||
| Baoshan | 1.837% | 3.23% | 0.549 |
| Changning | 3.216% | 5.69% | 0.555 |
| Hongkou | 2.474% | 4.37% | 0.553 |
| Huangpu | 4.268% | 7.58% | 0.559 |
| Jingan | 3.982% | 6.82% | 0.526 |
| Minhang | 2.047% | 3.54% | 0.535 |
| Pudong New Area | 7.933% | 14.08% | 0.558 |
| Putuo | 2.884% | 5.27% | 0.586 |
| Xuhui | 4.129% | 7.45% | 0.573 |
| Yangpu | 3.363% | 5.85% | 0.540 |
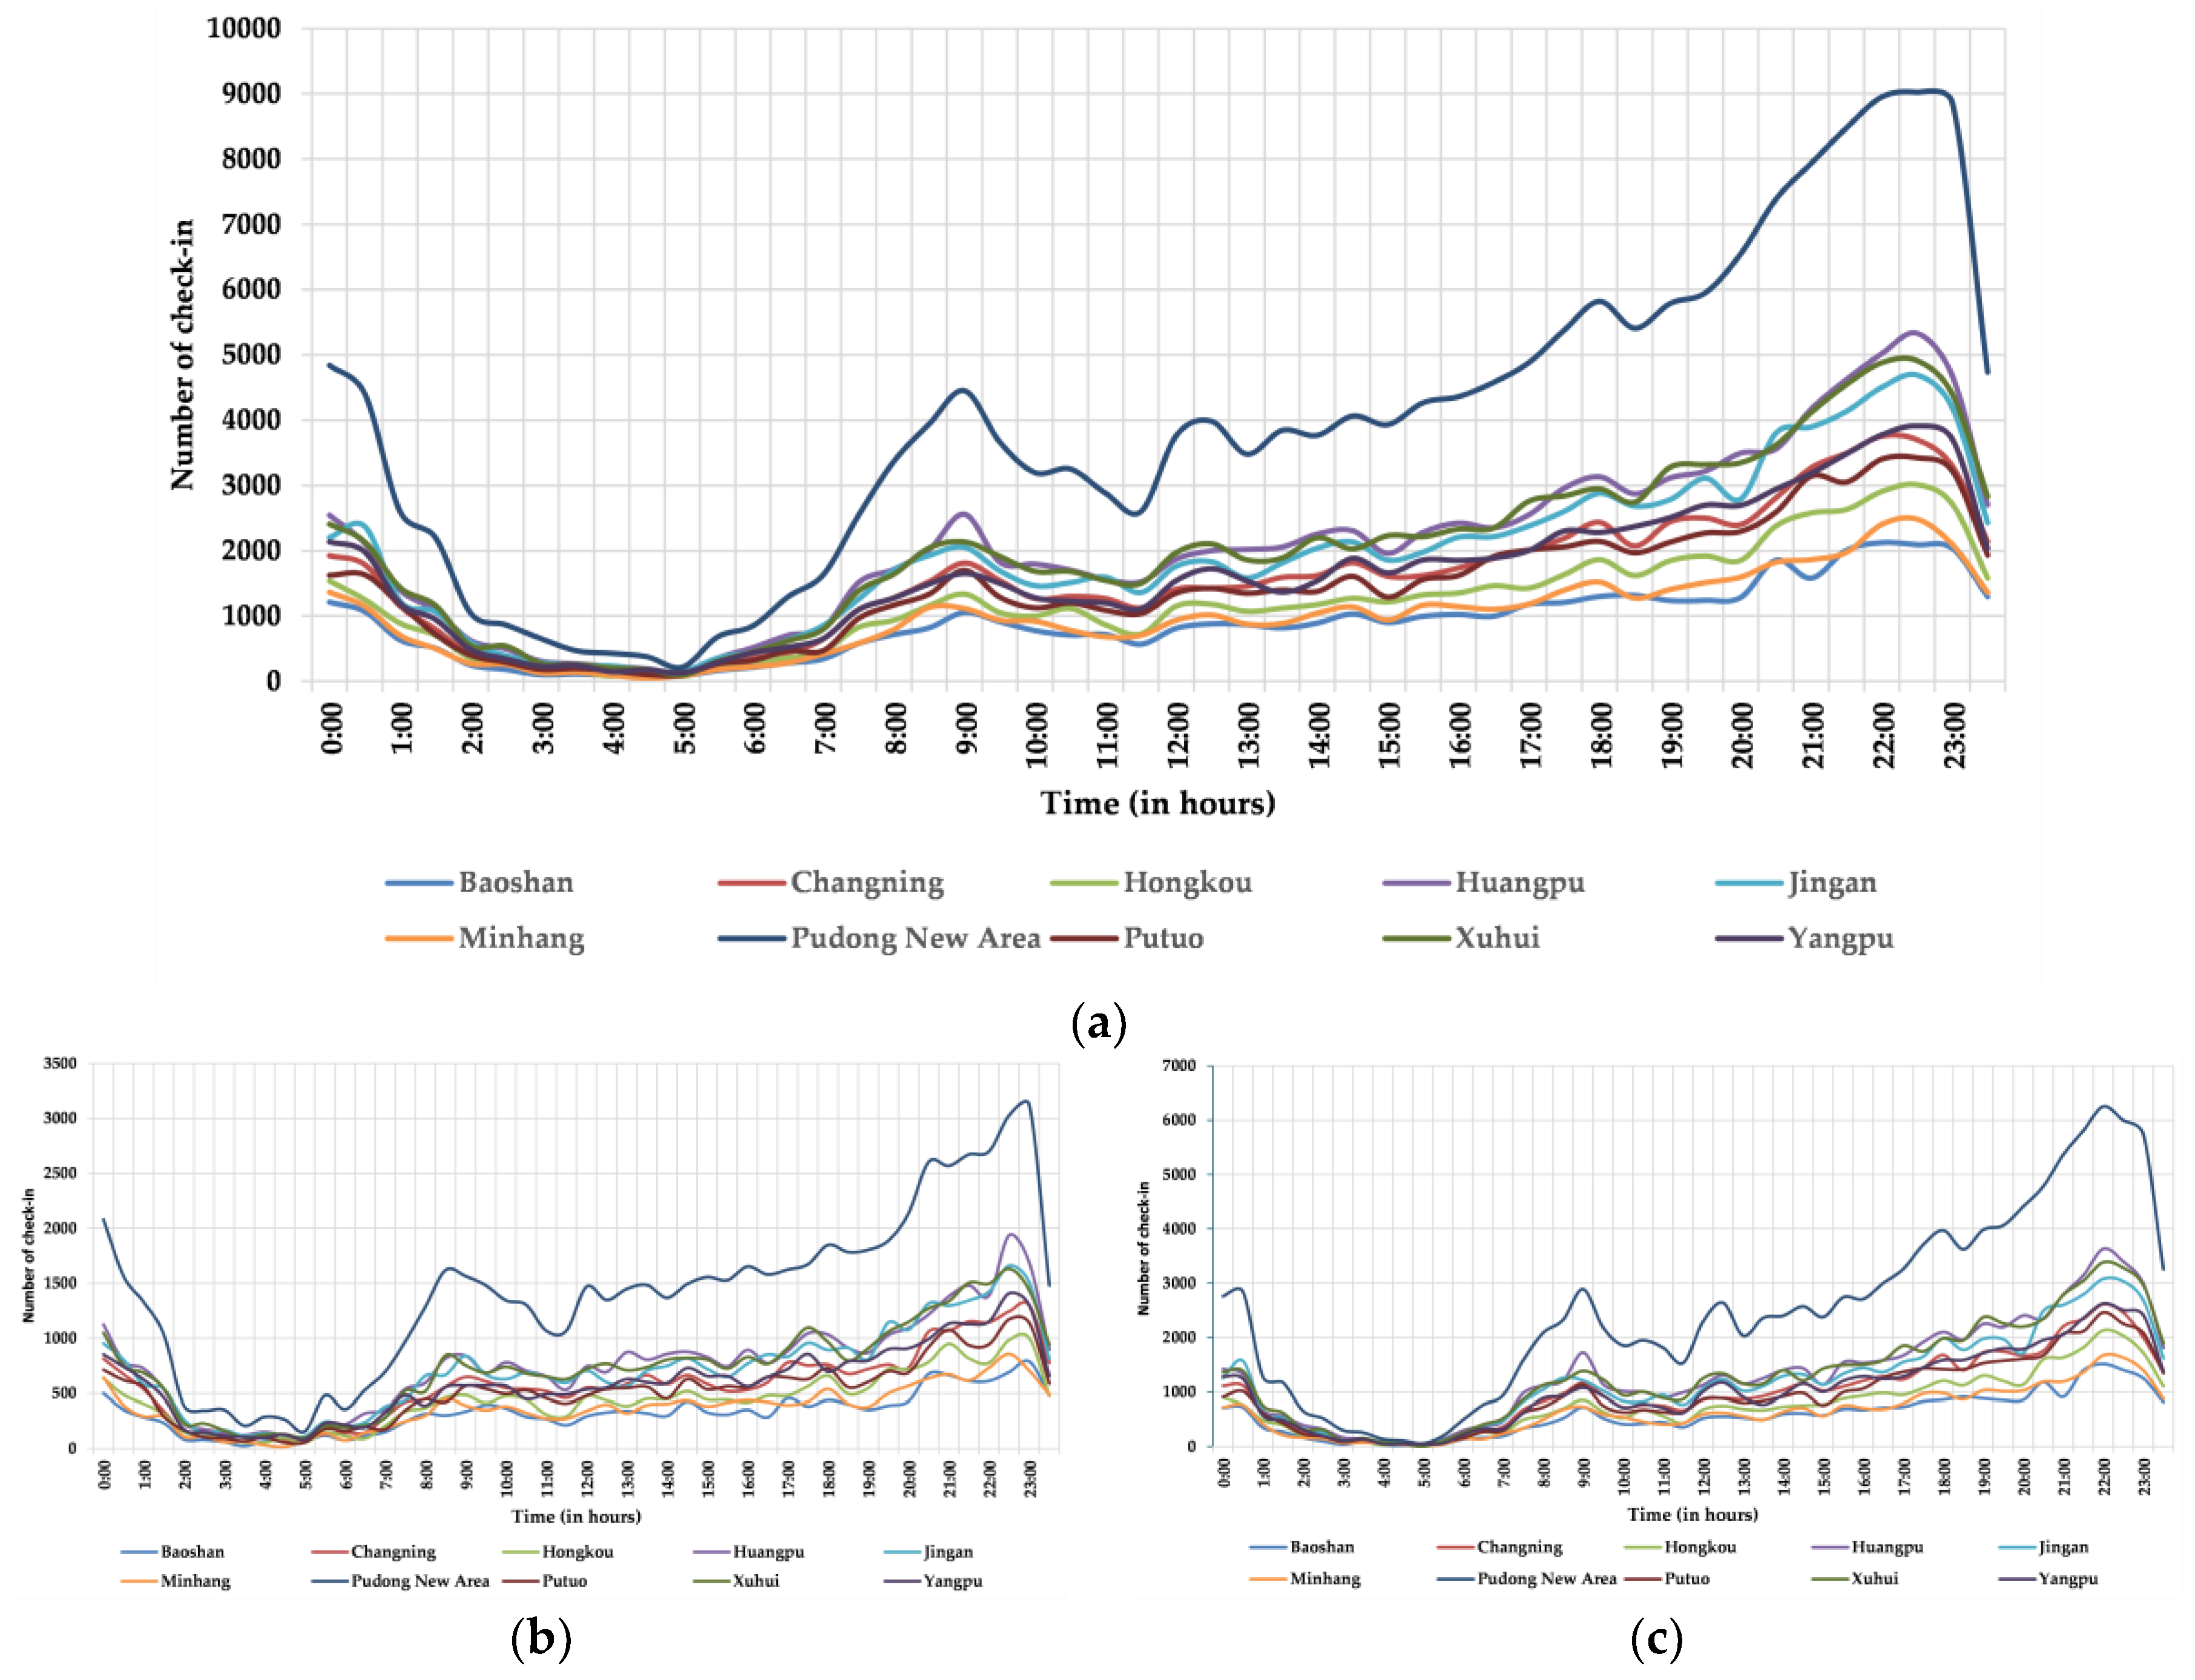
| District | Weekday (Check-in) Percentage | Weekend (Check-In) Percentage | ||||
|---|---|---|---|---|---|---|
| Male | Female | dr | Male | Female | dr | |
| Baoshan | 1.198% | 2.092% | 0.544 | 0.639% | 1.13% | 0.558 |
| Changning | 2.122% | 3.782% | 0.562 | 1.094% | 1.90% | 0.540 |
| Hongkou | 1.610% | 2.877% | 0.564 | 0.864% | 1.49% | 0.532 |
| Huangpu | 2.820% | 4.970% | 0.552 | 1.448% | 2.61% | 0.571 |
| Jingan | 2.547% | 4.458% | 0.546 | 1.435% | 2.36% | 0.489 |
| Minhang | 1.336% | 2.347% | 0.549 | 0.711% | 1.19% | 0.507 |
| Pudong New Area | 5.188% | 9.129% | 0.551 | 2.745% | 4.95% | 0.573 |
| Putuo | 1.834% | 3.501% | 0.625 | 1.050% | 1.77% | 0.513 |
| Xuhui | 2.672% | 4.814% | 0.572 | 1.456% | 2.63% | 0.575 |
| Yangpu | 2.177% | 3.780% | 0.538 | 1.186% | 2.07% | 0.543 |
© 2018 by the authors. Licensee MDPI, Basel, Switzerland. This article is an open access article distributed under the terms and conditions of the Creative Commons Attribution (CC BY) license (http://creativecommons.org/licenses/by/4.0/).
Share and Cite
Rizwan, M.; Wan, W.; Cervantes, O.; Gwiazdzinski, L. Using Location-Based Social Media Data to Observe Check-In Behavior and Gender Difference: Bringing Weibo Data into Play. ISPRS Int. J. Geo-Inf. 2018, 7, 196. https://doi.org/10.3390/ijgi7050196
Rizwan M, Wan W, Cervantes O, Gwiazdzinski L. Using Location-Based Social Media Data to Observe Check-In Behavior and Gender Difference: Bringing Weibo Data into Play. ISPRS International Journal of Geo-Information. 2018; 7(5):196. https://doi.org/10.3390/ijgi7050196
Chicago/Turabian StyleRizwan, Muhammad, Wanggen Wan, Ofelia Cervantes, and Luc Gwiazdzinski. 2018. "Using Location-Based Social Media Data to Observe Check-In Behavior and Gender Difference: Bringing Weibo Data into Play" ISPRS International Journal of Geo-Information 7, no. 5: 196. https://doi.org/10.3390/ijgi7050196
APA StyleRizwan, M., Wan, W., Cervantes, O., & Gwiazdzinski, L. (2018). Using Location-Based Social Media Data to Observe Check-In Behavior and Gender Difference: Bringing Weibo Data into Play. ISPRS International Journal of Geo-Information, 7(5), 196. https://doi.org/10.3390/ijgi7050196