Next Issue
Volume 8, March
Previous Issue
Volume 8, January


ISPRS Int. J. Geo-Inf., Volume 8, Issue 2 (February 2019) – 49 articles

Cover Story (view full-size image): 
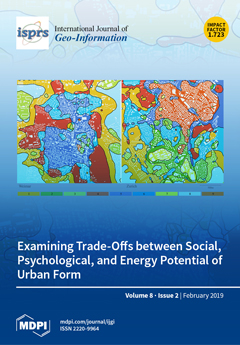
In this paper, we investigated the trade-offs between social, psychological, and energy potential of the fundamental elements of urban form: the street network and the building volumes. First, we present a methodological and technical framework for evaluating social, psychological, and energy potentials of urban form. Second, we present a method to identify distinct clusters of urban form and, for each, explore the trade-offs between the three potentials. We applied this method to two case studies (Weimar and Zurich), identifying nine types of urban form and their respective potential trade-offs, which are directly applicable for the assessment of strategic decisions regarding urban form during the early planning stages. View this paper.
  • Issues are regarded as officially published after their release is announced to the table of contents alert mailing list.
  • You may sign up for e-mail alerts to receive table of contents of newly released issues.
  • PDF is the official format for papers published in both, html and pdf forms. To view the papers in pdf format, click on the "PDF Full-text" link, and use the free Adobe Reader to open them.
Order results
Result details
Select all
Export citation of selected articles as:
16 pages, 9117 KiB  
Article
A Novel Process-Oriented Graph Storage for Dynamic Geographic Phenomena
by Cunjin Xue, Chengbin Wu, Jingyi Liu and Fenzhen Su
ISPRS Int. J. Geo-Inf. 2019, 8(2), 100; https://doi.org/10.3390/ijgi8020100 - 25 Feb 2019
Cited by 15 | Viewed by 3504
Abstract
There exists a sort of dynamic geographic phenomenon in the real world that has a property which is maintained from production through development to death. Using traditional storage units, e.g., point, line, and polygon, researchers face great challenges in exploring the spatial evolution [...] Read more.
There exists a sort of dynamic geographic phenomenon in the real world that has a property which is maintained from production through development to death. Using traditional storage units, e.g., point, line, and polygon, researchers face great challenges in exploring the spatial evolution of dynamic phenomena during their lifespan. Thus, this paper proposes a process-oriented two-tier graph model named PoTGM to store the dynamic geographic phenomena. The core ideas of PoTGM are as follows. 1) A dynamic geographic phenomenon is abstracted into a process with a property that is maintained from production through development to death. A process consists of evolution sequences which include instantaneous states. 2) PoTGM integrates a process graph and a sequence graph using a node–edge structure, in which there are four types of nodes, i.e., a process node, a sequence node, a state node, and a linked node, as well as two types of edges, i.e., an including edge and an evolution edge. 3) A node stores an object, i.e., a process object, a sequence object, or a state object, and an edge stores a relationship, i.e., an including or evolution relationship between two objects. Experiments on simulated datasets are used to demonstrate an at least one order of magnitude advantage of PoTGM in relation to relationship querying and to compare it with the Oracle spatial database. The applications on the sea surface temperature remote sensing products in the Pacific Ocean show that PoTGM can effectively explore marine objects as well as spatial evolution, and these behaviors may provide new references for global change research. Full article
(This article belongs to the Special Issue Spatial Databases: Design, Management, and Knowledge Discovery)
Show Figures

Figure 1

20 pages, 11243 KiB  
Article
A Novel Method for Improving Air Pollution Prediction Based on Machine Learning Approaches: A Case Study Applied to the Capital City of Tehran
by Mahmoud Reza Delavar, Amin Gholami, Gholam Reza Shiran, Yousef Rashidi, Gholam Reza Nakhaeizadeh, Kurt Fedra and Smaeil Hatefi Afshar
ISPRS Int. J. Geo-Inf. 2019, 8(2), 99; https://doi.org/10.3390/ijgi8020099 - 23 Feb 2019
Cited by 88 | Viewed by 10015
Abstract
Environmental pollution has mainly been attributed to urbanization and industrial developments across the globe. Air pollution has been marked as one of the major problems of metropolitan areas around the world, especially in Tehran, the capital of Iran, where its administrators and residents [...] Read more.
Environmental pollution has mainly been attributed to urbanization and industrial developments across the globe. Air pollution has been marked as one of the major problems of metropolitan areas around the world, especially in Tehran, the capital of Iran, where its administrators and residents have long been struggling with air pollution damage such as the health issues of its citizens. As far as the study area of this research is concerned, a considerable proportion of Tehran air pollution is attributed to PM10 and PM2.5 pollutants. Therefore, the present study was conducted to determine the prediction models to determine air pollutions based on PM10 and PM2.5 pollution concentrations in Tehran. To predict the air-pollution, the data related to day of week, month of year, topography, meteorology, and pollutant rate of two nearest neighbors as the input parameters and machine learning methods were used. These methods include a regression support vector machine, geographically weighted regression, artificial neural network and auto-regressive nonlinear neural network with an external input as the machine learning method for the air pollution prediction. A prediction model was then proposed to improve the afore-mentioned methods, by which the error percentage has been reduced and improved by 57%, 47%, 47% and 94%, respectively. The most reliable algorithm for the prediction of air pollution was autoregressive nonlinear neural network with external input using the proposed prediction model, where its one-day prediction error reached 1.79 µg/m3. Finally, using genetic algorithm, data for day of week, month of year, topography, wind direction, maximum temperature and pollutant rate of the two nearest neighbors were identified as the most effective parameters in the prediction of air pollution. Full article
(This article belongs to the Special Issue Spatial Analysis of Pollution and Risk in a Changing Climate)
Show Figures

Figure 1

18 pages, 5073 KiB  
Article
An Intuitionistic Fuzzy Similarity Approach for Clustering Analysis of Polygons
by Zhanlong Chen, Xiaochuan Ma, Liang Wu and Zhong Xie
ISPRS Int. J. Geo-Inf. 2019, 8(2), 98; https://doi.org/10.3390/ijgi8020098 - 23 Feb 2019
Cited by 8 | Viewed by 3115
Abstract
Accurate and reasonable clustering of spatial data results facilitates the exploration of patterns and spatial association rules. Although a broad range of research has focused on the clustering of spatial data, only a few studies have conducted a deeper exploration into the similarity [...] Read more.
Accurate and reasonable clustering of spatial data results facilitates the exploration of patterns and spatial association rules. Although a broad range of research has focused on the clustering of spatial data, only a few studies have conducted a deeper exploration into the similarity approach mechanism for clustering polygons, thereby limiting the development of spatial clustering. In this study, we propose a novel fuzzy similarity approach for spatial clustering, called Extend Intuitionistic Fuzzy Set-Interpolation Boolean Algebra (EIFS-IBA). When discovering polygon clustering patterns by spatial clustering, this method expresses the similarities between polygons and adjacent graph models. Shape-, orientation-, and size-related properties of a single polygon are first extracted, and are used as indices for measuring similarities between polygons. We then transform the extracted properties into a fuzzy format through normalization and fuzzification. Finally, the similarity graph containing the neighborhood relationship between polygons is acquired, allowing for clustering using the proposed adjacency graph model. In this paper, we clustered polygons in Staten Island, United States. The visual result and two evaluation criteria demonstrated that the EIFS-IBA similarity approach is more expressive compared to the conventional similarity (ConS) approach, generating a clustering result more consistent with human cognition. Full article
Show Figures

Figure 1

15 pages, 3137 KiB  
Article
Polarimetric Target Decompositions and Light Gradient Boosting Machine for Crop Classification: A Comparative Evaluation
by Mustafa Ustuner and Fusun Balik Sanli
ISPRS Int. J. Geo-Inf. 2019, 8(2), 97; https://doi.org/10.3390/ijgi8020097 - 21 Feb 2019
Cited by 50 | Viewed by 8980
Abstract
In terms of providing various scattering mechanisms, polarimetric target decompositions provide certain benefits for the interpretation of PolSAR images. This paper tested the capabilities of different polarimetric target decompositions in crop classification, while using a recently launched ensemble learning algorithm—namely Light Gradient Boosting [...] Read more.
In terms of providing various scattering mechanisms, polarimetric target decompositions provide certain benefits for the interpretation of PolSAR images. This paper tested the capabilities of different polarimetric target decompositions in crop classification, while using a recently launched ensemble learning algorithm—namely Light Gradient Boosting Machine (LightGBM). For the classification of different crops (maize, potato, wheat, sunflower, and alfalfa) in the test site, multi-temporal polarimetric C-band RADARSAT-2 images were acquired over an agricultural area near Konya, Turkey. Four different decomposition models (Cloude–Pottier, Freeman–Durden, Van Zyl, and Yamaguchi) were employed to evaluate polarimetric target decomposition for crop classification. Besides the polarimetric target decomposed parameters, the original polarimetric features (linear backscatter coefficients, coherency, and covariance matrices) were also incorporated for crop classification. The experimental results demonstrated that polarimetric target decompositions, with the exception of Cloude–Pottier, were found to be superior to the original features in terms of overall classification accuracy. The highest classification accuracy (92.07%) was achieved by Yamaguchi, whereas the lowest (75.99%) was achieved by the covariance matrix. Model-based decompositions achieved higher performance with respect to eigenvector-based decompositions in terms of class-based accuracies. Furthermore, the results emphasize the added benefits of model-based decompositions for crop classification using PolSAR data. Full article
Show Figures

Graphical abstract

19 pages, 1889 KiB  
Article
Principles and Applications of the Global Human Settlement Layer as Baseline for the Land Use Efficiency Indicator—SDG 11.3.1
by Michele Melchiorri, Martino Pesaresi, Aneta J. Florczyk, Christina Corbane and Thomas Kemper
ISPRS Int. J. Geo-Inf. 2019, 8(2), 96; https://doi.org/10.3390/ijgi8020096 - 18 Feb 2019
Cited by 99 | Viewed by 12486
Abstract
The Global Human Settlement Layer (GHSL) produces new global spatial information, evidence-based analytics describing the human presence on the planet that is based mainly on two quantitative factors: (i) the spatial distribution (density) of built-up structures and (ii) the spatial distribution (density) of [...] Read more.
The Global Human Settlement Layer (GHSL) produces new global spatial information, evidence-based analytics describing the human presence on the planet that is based mainly on two quantitative factors: (i) the spatial distribution (density) of built-up structures and (ii) the spatial distribution (density) of resident people. Both of the factors are observed in the long-term temporal domain and per unit area, in order to support the analysis of the trends and indicators for monitoring the implementation of the 2030 Development Agenda and the related thematic agreements. The GHSL uses various input data, including global, multi-temporal archives of high-resolution satellite imagery, census data, and volunteered geographic information. In this paper, we present a global estimate for the Land Use Efficiency (LUE) indicator—SDG 11.3.1, for circa 10,000 urban centers, calculating the ratio of land consumption rate to population growth rate between 1990 and 2015. In addition, we analyze the characteristics of the GHSL information to demonstrate how the original frameworks of data (gridded GHSL data) and tools (GHSL tools suite), developed from Earth Observation and integrated with census information, could support Sustainable Development Goals monitoring. In particular, we demonstrate the potential of gridded, open and free, local yet globally consistent, multi-temporal data in filling the data gap for Sustainable Development Goal 11. The results of our research demonstrate that there is potential to raise SDG 11.3.1 from a Tier II classification (manifesting unavailability of data) to a Tier I, as GHSL provides a global baseline for the essential variables called by the SDG 11.3.1 metadata. Full article
(This article belongs to the Special Issue Geo-Information and the Sustainable Development Goals (SDGs))
Show Figures

Graphical abstract

11 pages, 645 KiB  
Article
Investigating Roundabout Properties and Bicycle Accident Occurrence at Swiss Roundabouts: A Logistic Regression Approach
by Daria Hollenstein, Martin Hess, Denis Jordan and Susanne Bleisch
ISPRS Int. J. Geo-Inf. 2019, 8(2), 95; https://doi.org/10.3390/ijgi8020095 - 18 Feb 2019
Cited by 4 | Viewed by 3587
Abstract
The positive effects of active mobility on mental and physical health as well as on air quality are widely acknowledged. Increasing the share of active travel is therefore an aim in many countries. Providing bicycle-safe infrastructure is one way to promote cycling. Roundabouts [...] Read more.
The positive effects of active mobility on mental and physical health as well as on air quality are widely acknowledged. Increasing the share of active travel is therefore an aim in many countries. Providing bicycle-safe infrastructure is one way to promote cycling. Roundabouts are a common traffic infrastructure and are supposed to facilitate safe and smooth traffic flow. However, data on road traffic accidents indicate an over-proportional involvement of cyclists in accidents at roundabouts. In the present study, the influence of roundabout geometry and traffic flow on bicycle accident occurrence was investigated using a logistic regression approach on twelve parameters of N = 294 mostly small- and mini-sized single-lane roundabouts in the Canton of Berne, Switzerland. Average weekday motorized traffic was identified as a major factor in explaining bicycle accident occurrence at roundabouts. Further, the radius of the central island, the location of the roundabout (in town vs. out of town) and the number of legs were significantly related to bicycle accident occurrence. While these results are in general agreement with findings from similar studies, the findings regarding the central island’s radius and the number of legs underpin the need for roundabout type-specific studies: Some parameters may not prove relevant in intermediate- to large-sized roundabouts, but become critical in small or mini roundabouts, which are common in Switzerland and numerous in the present sample. Full article
Show Figures

Figure 1

23 pages, 6581 KiB  
Article
A Comparative Study of Statistics-Based Landslide Susceptibility Models: A Case Study of the Region Affected by the Gorkha Earthquake in Nepal
by Sansar Raj Meena, Omid Ghorbanzadeh and Thomas Blaschke
ISPRS Int. J. Geo-Inf. 2019, 8(2), 94; https://doi.org/10.3390/ijgi8020094 - 18 Feb 2019
Cited by 70 | Viewed by 7470
Abstract
As a result of the Gorkha earthquake in 2015, about 9000 people lost their lives and many more were injured. Most of these losses were caused by earthquake-induced landslides. Sustainable planning and decision-making are required to reduce the losses caused by earthquakes and [...] Read more.
As a result of the Gorkha earthquake in 2015, about 9000 people lost their lives and many more were injured. Most of these losses were caused by earthquake-induced landslides. Sustainable planning and decision-making are required to reduce the losses caused by earthquakes and related hazards. The use of remote sensing and geographic information systems (GIS) for landslide susceptibility mapping can help planning authorities to prepare for and mitigate the consequences of future hazards. In this study, we developed landslide susceptibility maps using GIS-based statistical models at the regional level in central Nepal. Our study area included the districts affected by landslides after the Gorkha earthquake and its aftershocks. We used the 23,439 landslide locations obtained from high-resolution satellite imagery to evaluate the differences in landslide susceptibility using analytical hierarchy process (AHP), frequency ratio (FR) and hybrid spatial multi-criteria evaluation (SMCE) models. The nine landslide conditioning factors of lithology, land cover, precipitation, slope, aspect, elevation, distance to roads, distance to drainage and distance to faults were used as the input data for the applied landslide susceptibility mapping (LSM) models. The spatial correlation of landslides and these factors were identified using GIS-based statistical models. We divided the inventory into data used for training the statistical models (70%) and data used for validation (30%). Receiver operating characteristics (ROC) and the relative landslide density index (R-index) were used to validate the results. The area under the curve (AUC) values obtained from the ROC approach for AHP, FR and hybrid SMCE were 0.902, 0.905 and 0.91, respectively. The index of relative landslide density, R-index, values in sample datasets of AHP, FR and hybrid SMCE maps were 53%, 58% and 59% for the very high hazard classes. The final susceptibility results will be beneficial for regional planning and sustainable hazard mitigation. Full article
(This article belongs to the Special Issue Natural Hazards and Geospatial Information)
Show Figures

Graphical abstract

25 pages, 14999 KiB  
Article
Delimitating Urban Commercial Central Districts by Combining Kernel Density Estimation and Road Intersections: A Case Study in Nanjing City, China
by Jing Yang, Jie Zhu, Yizhong Sun and Jianhua Zhao
ISPRS Int. J. Geo-Inf. 2019, 8(2), 93; https://doi.org/10.3390/ijgi8020093 - 16 Feb 2019
Cited by 30 | Viewed by 6092
Abstract
An urban, commercial central district is often regarded as the heart of a city. Therefore, quantitative research on commercial central districts plays an important role when studying the development and evaluation of urban spatial layouts. However, conventional planar kernel density estimation (KDE) and [...] Read more.
An urban, commercial central district is often regarded as the heart of a city. Therefore, quantitative research on commercial central districts plays an important role when studying the development and evaluation of urban spatial layouts. However, conventional planar kernel density estimation (KDE) and network kernel density estimation (network KDE) do not reflect the fact that the road network density is high in urban, commercial central districts. To solve this problem, this paper proposes a new method (commercial-intersection KDE), which combines road intersections with KDE to identify commercial central districts based on point of interest (POI) data. First, we extracted commercial POIs from Amap (a Chinese commercial, navigation electronic map) based on existing classification standards for urban development land. Second, we calculated the commercial kernel density in the road intersection neighborhoods and used those values as parameters to build a commercial intersection density surface. Finally, we used the three standard deviations method and the commercial center area indicator to differentiate commercial central districts from areas with only commercial intersection density. Testing the method using Nanjing City as a case study, we show that our new method can identify seven municipal, commercial central districts and 26 nonmunicipal, commercial central districts. Furthermore, we compare the results of the traditional planar KDE with those of our commercial-intersection KDE to demonstrate our method’s higher accuracy and practicability for identifying urban commercial central districts and evaluating urban planning. Full article
(This article belongs to the Special Issue Recent Trends in Location Based Services and Science)
Show Figures

Figure 1

22 pages, 14939 KiB  
Article
Function-Based Search of Place Using Theoretical, Empirical and Probabilistic Patterns
by Emmanuel Papadakis, George Baryannis, Andreas Petutschnig and Thomas Blaschke
ISPRS Int. J. Geo-Inf. 2019, 8(2), 92; https://doi.org/10.3390/ijgi8020092 - 16 Feb 2019
Cited by 8 | Viewed by 4048
Abstract
Searching for places rather than traditional keyword-based search represents significant challenges. The most prevalent method of addressing place-related queries is based on place names but has limited potential due to the vagueness of natural language and its tendency to lead to ambiguous interpretations. [...] Read more.
Searching for places rather than traditional keyword-based search represents significant challenges. The most prevalent method of addressing place-related queries is based on place names but has limited potential due to the vagueness of natural language and its tendency to lead to ambiguous interpretations. In previous work we proposed a system-oriented logic-based formalization of place that goes beyond place names by introducing composition patterns of place which enable function-based search of space. In this study, we introduce flexibility into these patterns in terms of what is included when describing the spatial composition of a place using two distinct approaches, based on modal and probabilistic logic. Additionally, we propose a novel automated process of extracting these patterns relying on both theoretical and empirical knowledge, using statistical and spatial analysis and statistical relational learning. The proposed methodology is exemplified through the use case of locating all areas within London that support shopping-related functionality. Results show that the newly introduced patterns can identify more relevant areas, additionally offering a more fine-grained representation of the level of support of the required functionality. Full article
Show Figures

Figure 1

14 pages, 2775 KiB  
Article
A Field Data Acquisition Method and Tools for Hazard Evaluation of Earthquake-Induced Landslides with Open Source Mobile GIS
by Mauro De Donatis, Giulio F. Pappafico and Roberto W. Romeo
ISPRS Int. J. Geo-Inf. 2019, 8(2), 91; https://doi.org/10.3390/ijgi8020091 - 15 Feb 2019
Cited by 4 | Viewed by 3854
Abstract
The PARSIFAL (Probabilistic Approach to pRovide Scenarios of earthquake Induced slope FAiLures) method was applied to the survey of post-earthquake landslides in central Italy for seismic microzonation purposes. In order to optimize time and resources, while also reducing errors, the paper-based method of [...] Read more.
The PARSIFAL (Probabilistic Approach to pRovide Scenarios of earthquake Induced slope FAiLures) method was applied to the survey of post-earthquake landslides in central Italy for seismic microzonation purposes. In order to optimize time and resources, while also reducing errors, the paper-based method of survey data sheets was translated into digital formats using such instruments as Tablet PCs, GPS and open source software (QGIS). To the base mapping consisting of Technical Regional Map (Carta Tecnica Regionale—CTRs) at the scale of 1:10,000, layers were added with such sensitive information as the Inventory of Landslide Phenomena in Italy (Inventario dei Fenomeni Franosi in Italia—IFFI), for example. A database was designed and implemented in the SQLite/SpatiaLite Relational DataBase Management System (RDBMS) to store data related to such elements as landslides, rock masses, discontinuities and covers (as provided by PARSIFAL). To facilitate capture of the datum on the ground, data entry forms were created with Qt Designer. In addition to this, the employment of some QGIS plug-ins, developed for digital surveying and enabling of quick annotations on the map and the import of images from external cameras, was found to be of considerable use. Full article
(This article belongs to the Special Issue Free and Open Source Tools for Geospatial Analysis and Mapping)
Show Figures

Figure 1

16 pages, 5405 KiB  
Article
An Integrated Framework Combining Multiple Human Activity Features for Land Use Classification
by Panpan Ge, Jun He, Shuhua Zhang, Liwei Zhang and Jiangfeng She
ISPRS Int. J. Geo-Inf. 2019, 8(2), 90; https://doi.org/10.3390/ijgi8020090 - 15 Feb 2019
Cited by 20 | Viewed by 3117
Abstract
Urban land use information is critical to urban planning, but the increasing complexity of urban systems makes the accurate classification of land use extremely challenging. Human activity features extracted from big data have been used for land use classification, and fusing different features [...] Read more.
Urban land use information is critical to urban planning, but the increasing complexity of urban systems makes the accurate classification of land use extremely challenging. Human activity features extracted from big data have been used for land use classification, and fusing different features can help improve the classification. In this paper, we propose a framework to integrate multiple human activity features for land use classification. Features were fused by constructing a membership matrix reflecting the fuzzy relationship between features and land use types using the fuzzy c-means (FCM) clustering method. The classification results were obtained by the fuzzy comprehensive evaluation (FCE) method, which regards the membership matrix as the fuzzy evaluation matrix. This framework was applied to a case study using taxi trajectory data from Nanjing, and the outflow, inflow, net flow and net flow ratio features were extracted. A series of experiments demonstrated that the proposed framework can effectively fuse different features and increase the accuracy of land use classification. The classification accuracy achieved 0.858 (Kappa = 0.810) when the four features were fused for land use classification. Full article
Show Figures

Figure 1

18 pages, 5070 KiB  
Article
A Quaternion-Based Piecewise 3D Modeling Method for Indoor Path Networks
by Hongdeng Jian, Xiangtao Fan, Jian Liu, Qingwen Jin and Xujie Kang
ISPRS Int. J. Geo-Inf. 2019, 8(2), 89; https://doi.org/10.3390/ijgi8020089 - 15 Feb 2019
Cited by 5 | Viewed by 2944
Abstract
Generating 3D path models (with textures) from indoor paths is a good way to improve the visualization performance of 3D indoor path analysis. In this paper, a quaternion-based piecewise 3D modeling method is proposed to automatically generate highly recognizable 3D models for indoor [...] Read more.
Generating 3D path models (with textures) from indoor paths is a good way to improve the visualization performance of 3D indoor path analysis. In this paper, a quaternion-based piecewise 3D modeling method is proposed to automatically generate highly recognizable 3D models for indoor path networks. To create such models, indoor paths are classified into four types of basic elements: corridor, stairs, elevator and node, which contain six kinds of edges and seven kinds of nodes. A quaternion-based method is devised to calculate the coordinates of the designed elements, and a piecewise 3D modeling method is implemented to create the entire 3D indoor path models in a 3D GIS scene. The numerical comparison of 3D scene primitives in different visualization modes indicates that the proposed method can generate detailed and irredundant models for indoor path networks. The result of 3D path analysis shows that indoor path models can improve the visualization performance of a 3D indoor path network by displaying paths with different shapes, textures and colors and that the models can maintain a high rendering efficiency (above 50 frames per second) in a 3D GIS scene containing more than 50,000 polygons and triangles. Full article
Show Figures

Figure 1

17 pages, 5273 KiB  
Article
Integrating Island Spatial Information and Integer Optimization for Locating Maritime Search and Rescue Bases: A Case Study in the South China Sea
by Xiao Zhou, Liang Cheng, Fangli Zhang, Zhaojin Yan, Xiaoguang Ruan, Kaifu Min and Manchun Li
ISPRS Int. J. Geo-Inf. 2019, 8(2), 88; https://doi.org/10.3390/ijgi8020088 - 15 Feb 2019
Cited by 23 | Viewed by 4343
Abstract
Maritime search and rescue (SAR) operations are critical for ensuring safety at sea. Islands have been considered as feasible solutions for the construction of new maritime SAR bases to improve the capacity of SAR operations in remote sea areas. This paper proposes a [...] Read more.
Maritime search and rescue (SAR) operations are critical for ensuring safety at sea. Islands have been considered as feasible solutions for the construction of new maritime SAR bases to improve the capacity of SAR operations in remote sea areas. This paper proposes a new framework, based on island spatial information, for determining the optimal locations for maritime SAR bases. The framework comprises four steps. First, candidate islands for the construction of maritime SAR bases are selected. Second, the potential rescue demand is estimated by employing ship location data and marine incident data. In the third step, the response time from candidate islands to any site at sea is calculated, with explicit consideration of the impact of sea conditions on the ship’s speed. Fourth, the final island locations are proposed by solving the maximal covering location problem (MCLP). The proposed framework was applied to the South China Sea. The results showed that there would be a decrease of 1.09 h in terms of the mean access time for the South China Sea if the six selected island bases were constructed, whilst the primary coverage increased from 62.63% to 80.02% when using a 6-hour threshold. This new framework is expected to contribute to improvements in safety at sea and should be applicable to any sea area where the construction of island rescue bases is being considered. Full article
Show Figures

Figure 1

21 pages, 8144 KiB  
Article
Multi-Sensor UAV Application for Thermal Analysis on a Dry-Stone Terraced Vineyard in Rural Tuscany Landscape
by Grazia Tucci, Erica Isabella Parisi, Giulio Castelli, Alessandro Errico, Manuela Corongiu, Giovanna Sona, Enea Viviani, Elena Bresci and Federico Preti
ISPRS Int. J. Geo-Inf. 2019, 8(2), 87; https://doi.org/10.3390/ijgi8020087 - 15 Feb 2019
Cited by 50 | Viewed by 5464
Abstract
Italian dry-stone wall terracing represents one of the most iconic features of agricultural landscapes across Europe, with sites listed among UNESCO World Heritage Sites and FAO Globally Important Agricultural Heritage Systems (GIAHS). The analysis of microclimate modifications induced by alterations of hillslope and [...] Read more.
Italian dry-stone wall terracing represents one of the most iconic features of agricultural landscapes across Europe, with sites listed among UNESCO World Heritage Sites and FAO Globally Important Agricultural Heritage Systems (GIAHS). The analysis of microclimate modifications induced by alterations of hillslope and by dry-stone walls is of particular interest for the valuation of benefits and drawbacks of terraces cultivation, a global land management technique. The aim of this paper is to perform a thermal characterization of a dry-stone wall terraced vineyard in the Chianti area (Tuscany, Italy), to detect possible microclimate dynamics induced by dry-stone terracing. The aerial surveys were carried out by using two sensors, in the Visible (VIS) and Thermal InfraRed (TIR) spectral range, mounted on Unmanned Aerial Vehicles (UAVs), with two different flights. Our results reveal that, in the morning, vineyard rows close to dry-stone walls have statistically lower temperatures with respect to the external ones. In the afternoon, due to solar insulation, temperatures raised to the same value for each row. The results of this early study, jointly with the latest developments in UAV and sensor technologies, justify and encourage further analyses on local climatic modifications in terraced landscapes. Full article
(This article belongs to the Special Issue Data Acquisition and Processing in Cultural Heritage)
Show Figures

Figure 1

19 pages, 112922 KiB  
Article
Intercropping Classification From GF-1 and GF-2 Satellite Imagery Using a Rotation Forest Based on an SVM
by Ping Liu and Xi Chen
ISPRS Int. J. Geo-Inf. 2019, 8(2), 86; https://doi.org/10.3390/ijgi8020086 - 14 Feb 2019
Cited by 12 | Viewed by 3832
Abstract
Remote sensing has been widely used in vegetation cover research but is rarely used for intercropping area monitoring. To investigate the efficiency of Chinese Gaofen satellite imagery, in this study the GF-1 and GF-2 of Moyu County south of the Tarim Basin were [...] Read more.
Remote sensing has been widely used in vegetation cover research but is rarely used for intercropping area monitoring. To investigate the efficiency of Chinese Gaofen satellite imagery, in this study the GF-1 and GF-2 of Moyu County south of the Tarim Basin were studied. Based on Chinese GF-1 and GF-2 satellite imagery features, this study has developed a comprehensive feature extraction and intercropping classification scheme. Textural features derived from a Gray level co-occurrence matrix (GLCM) and vegetation features derived from multi-temporal GF-1 and GF-2 satellites were introduced and combined into three different groups. The rotation forest method was then adopted based on a Support Vector Machine (RoF-SVM), which offers the advantage of using an SVM algorithm and that boosts the diversity of individual base classifiers by a rotation forest. The combined spectral-textural-multitemporal features achieved the best classification result. The results were compared with those of the maximum likelihood classifier, support vector machine and random forest method. It is shown that the RoF-SVM algorithm for the combined spectral-textural-multitemporal features can effectively classify an intercropping area (overall accuracy of 86.87% and kappa coefficient of 0.78), and the classification result effectively eliminated salt and pepper noise. Furthermore, the GF-1 and GF-2 satellite images combined with spectral, textural, and multi-temporal features can provide sufficient information on vegetation cover located in an extremely complex and diverse intercropping area. Full article
(This article belongs to the Special Issue Geographic Information Science in Forestry)
Show Figures

Graphical abstract

16 pages, 6819 KiB  
Article
Scenario-Based Risk Assessment of Earthquake Disaster Using Slope Displacement, PGA, and Population Density in the Guyuan Region, China
by Jianqi Zhuang, Jianbing Peng, Xinghua Zhu and Weiliang Huang
ISPRS Int. J. Geo-Inf. 2019, 8(2), 85; https://doi.org/10.3390/ijgi8020085 - 14 Feb 2019
Cited by 14 | Viewed by 4423
Abstract
Mega-earthquakes that occur in mountainous areas of densely populated cities are particularly catastrophic, triggering large landslides, destroying more buildings, and usually resulting in significant death tolls. In this paper, earthquake scenarios in the Guyuan Region of China are used as an example to [...] Read more.
Mega-earthquakes that occur in mountainous areas of densely populated cities are particularly catastrophic, triggering large landslides, destroying more buildings, and usually resulting in significant death tolls. In this paper, earthquake scenarios in the Guyuan Region of China are used as an example to study earthquake disaster risk assessment and a method of assessment is proposed that uses the peak ground acceleration (PGA), landslides triggered by the earthquake, and the effects on the population. The method is used to develop scenarios for earthquake disaster risk assessment along the Haiyuan and Liupanshan Faults for earthquake magnitudes of Ms 7.0, 7.5, 8.0, and 8.5 triggered by one of the two faults. The quantitative earthquake disaster risk maps in the study area were developed by integrating the values of the at-risk elements for the earthquake factor, population, and landslide hazard. According to the model results, the high-hazard zone was mainly located in the severely affected areas along the faults and on the western side of the faults. These results can be useful for emergency preparation planning, response plans, and resource assessment. Full article
(This article belongs to the Special Issue Natural Hazards and Geospatial Information)
Show Figures

Figure 1

23 pages, 3050 KiB  
Article
Studying Social Uses of 3D Geovisualizations: Lessons Learned from Action-Research Projects in the Field of Flood Mitigation Planning
by Florence Jacquinod and Julia Bonaccorsi
ISPRS Int. J. Geo-Inf. 2019, 8(2), 84; https://doi.org/10.3390/ijgi8020084 - 14 Feb 2019
Cited by 17 | Viewed by 3594
Abstract
Risk management seeks more and more the mobilization of all citizens, including elected representatives and inhabitants. Three-dimensional (3D) geovisualizations have been used between 2009 and 2017 in order to associate citizens to flood mitigation policies along the river Rhône. We focused our studies [...] Read more.
Risk management seeks more and more the mobilization of all citizens, including elected representatives and inhabitants. Three-dimensional (3D) geovisualizations have been used between 2009 and 2017 in order to associate citizens to flood mitigation policies along the river Rhône. We focused our studies on the effects 3D geovisualizations can have on the communication and understanding of information and their ability to foster exchanges between heterogeneous actors as well as participation of the grand public to planning processes. Facing both discrepancies in scientific studies of the uses of 3D geovisualizations and a lack of validated theoretical elements, we resorted to an exploratory method based on grounded theory and ethnographic observation in order to produce empirical knowledge on the uses of 3D geovisualizations in collective settings, including heterogeneous actors (risk managers, elected representatives, citizens). Observation showed that 3D geovisualizations can be useful for the dissemination of information about flood risk. Many observed effects were not anticipated during the production of 3D geovisualizations. Qualitative analysis of empirical data through actor–network theory and from a communication studies perspective shed light on some factors influencing the roles of 3D geovisualizations and help put into perspective existing and sometimes contradictory scientific works on 3D geovisualizations’ uses. Full article
(This article belongs to the Special Issue Human-Centered Geovisual Analytics and Visuospatial Display Design)
Show Figures

Figure 1

26 pages, 8805 KiB  
Article
Accuracy Analysis of a 3D Model of Excavation, Created from Images Acquired with an Action Camera from Low Altitudes
by Damian Wierzbicki and Marcin Nienaltowski
ISPRS Int. J. Geo-Inf. 2019, 8(2), 83; https://doi.org/10.3390/ijgi8020083 - 13 Feb 2019
Cited by 12 | Viewed by 4309
Abstract
In the last few years, Unmanned Aerial Vehicles (UAVs) equipped with compact digital cameras, have become a cheap and efficient alternative to classic aerial photogrammetry and close-range photogrammetry. Low-altitude photogrammetry has great potential not only in the development of orthophoto maps but is [...] Read more.
In the last few years, Unmanned Aerial Vehicles (UAVs) equipped with compact digital cameras, have become a cheap and efficient alternative to classic aerial photogrammetry and close-range photogrammetry. Low-altitude photogrammetry has great potential not only in the development of orthophoto maps but is also increasingly used in surveying and rapid mapping. This paper presents a practical aspect of the application of the custom homemade low-cost UAV, equipped with an action camera, to obtain images from low altitudes and develop a digital elevation model of the excavation. The conducted analyses examine the possibilities of using low-cost UAVs to deliver useful photogrammetric products. The experiments were carried out on a closed excavation in the town of Mince (north-eastern Poland). The flight over the examined area was carried out autonomously. A photogrammetric network was designed, and the reference areas in the mine were measured using the Global Navigation Satellite System-Real Time Kinematic (GNSS-RTK) method to perform accuracy analyses of the excavation 3D model. Representation of the created numerical terrain model was a dense point cloud. The average height difference between the generated dense point cloud and the reference model was within the range of 0.01–0.13 m. The difference between the volume of the excavation measured by the GNSS kinematic method and the volume measured on the basis of a dense point cloud was less than 1%. The obtained results show that the application of the low-cost UAV equipped with an action camera with a wide-angle lens, allows for obtaining high-accuracy images comparable to classic, compact digital cameras. Full article
(This article belongs to the Special Issue Applications and Potential of UAV Photogrammetric Survey)
Show Figures

Figure 1

18 pages, 10135 KiB  
Article
A Varied Density-based Clustering Approach for Event Detection from Heterogeneous Twitter Data
by Zeinab Ghaemi and Mahdi Farnaghi
ISPRS Int. J. Geo-Inf. 2019, 8(2), 82; https://doi.org/10.3390/ijgi8020082 - 13 Feb 2019
Cited by 26 | Viewed by 4899
Abstract
Extracting the latent knowledge from Twitter by applying spatial clustering on geotagged tweets provides the ability to discover events and their locations. DBSCAN (density-based spatial clustering of applications with noise), which has been widely used to retrieve events from geotagged tweets, cannot efficiently [...] Read more.
Extracting the latent knowledge from Twitter by applying spatial clustering on geotagged tweets provides the ability to discover events and their locations. DBSCAN (density-based spatial clustering of applications with noise), which has been widely used to retrieve events from geotagged tweets, cannot efficiently detect clusters when there is significant spatial heterogeneity in the dataset, as it is the case for Twitter data where the distribution of users, as well as the intensity of publishing tweets, varies over the study areas. This study proposes VDCT (Varied Density-based spatial Clustering for Twitter data) algorithm that extracts clusters from geotagged tweets by considering spatial heterogeneity. The algorithm employs exponential spline interpolation to determine different search radiuses for cluster detection. Moreover, in addition to spatial proximity, textual similarities among tweets are also taken into account by the algorithm. In order to examine the efficiency of the algorithm, geotagged tweets collected during a hurricane in the United States were used for event detection. The output clusters of VDCT have been compared to those of DBSCAN. Visual and quantitative comparison of the results proved the feasibility of the proposed method. Full article
Show Figures

Figure 1

19 pages, 33327 KiB  
Article
A New, Score-Based Multi-Stage Matching Approach for Road Network Conflation in Different Road Patterns
by Müslüm Hacar and Türkay Gökgöz
ISPRS Int. J. Geo-Inf. 2019, 8(2), 81; https://doi.org/10.3390/ijgi8020081 - 13 Feb 2019
Cited by 8 | Viewed by 3526
Abstract
Road-matching processes establish links between multi-sourced road lines representing the same entities in the real world. Several road-matching methods have been developed in the last three decades. The main issue related to this process is selecting the most appropriate method. This selection depends [...] Read more.
Road-matching processes establish links between multi-sourced road lines representing the same entities in the real world. Several road-matching methods have been developed in the last three decades. The main issue related to this process is selecting the most appropriate method. This selection depends on the data and requires a pre-process (i.e., accuracy assessment). This paper presents a new matching method for roads composed of different patterns. The proposed method matches road lines incrementally (i.e., from the most similar matching to the least similar). In the experimental testing, three road networks in Istanbul, Turkey, which are composed of tree, cellular, and hybrid patterns, provided by the municipality (authority), OpenStreetMap (volunteered), TomTom (private), and Basarsoft (private) were used. The similarity scores were determined using Hausdorff distance, orientation, sinuosity, mean perpendicular distance, mean length of triangle edges, and modified degree of connectivity. While the first four stages determined certain matches with regards to the scores, the last stage determined them with a criterion for overlapping areas among the buffers of the candidates. The results were evaluated with manual matching. According to the precision, recall, and F-value, the proposed method gives satisfactory results on different types of road patterns. Full article
(This article belongs to the Special Issue Multi-Source Geoinformation Fusion)
Show Figures

Figure 1

19 pages, 28543 KiB  
Article
Shore Construction Detection by Automotive Radar for the Needs of Autonomous Surface Vehicle Navigation
by Andrzej Stateczny, Witold Kazimierski, Paweł Burdziakowski, Weronika Motyl and Marta Wisniewska
ISPRS Int. J. Geo-Inf. 2019, 8(2), 80; https://doi.org/10.3390/ijgi8020080 - 13 Feb 2019
Cited by 40 | Viewed by 4547
Abstract
Autonomous surface vehicles (ASVs) are becoming more and more popular for performing hydrographic and navigational tasks. One of the key aspects of autonomous navigation is the need to avoid collisions with other objects, including shore structures. During a mission, an ASV should be [...] Read more.
Autonomous surface vehicles (ASVs) are becoming more and more popular for performing hydrographic and navigational tasks. One of the key aspects of autonomous navigation is the need to avoid collisions with other objects, including shore structures. During a mission, an ASV should be able to automatically detect obstacles and perform suitable maneuvers. This situation also arises in near-coastal areas, where shore structures like berths or moored vessels can be encountered. On the other hand, detection of coastal structures may also be helpful for berthing operations. An ASV can be launched and moored automatically only if it can detect obstacles in its vicinity. One commonly used method for target detection by ASVs involves the use of laser rangefinders. The main disadvantage of this approach is that such systems perform poorly in conditions with bad visibility, such as in fog or heavy rain. Therefore, alternative methods need to be sought. An innovative approach to this task is presented in this paper, which describes the use of automotive three-dimensional radar on a floating platform. The goal of the study was to assess target detection possibilities based on a comparison with photogrammetric images obtained by an unmanned aerial vehicle (UAV). The scenarios considered focused on analyzing the possibility of detecting shore structures like berths, wooden jetties, and small houses, as well as natural objects like trees or other kinds of vegetation. The recording from the radar was integrated into a single complex radar image of shore targets. It was then compared with an orthophotomap prepared from AUV camera pictures, as well as with a map based on traditional land surveys. The possibility and accuracy of detection for various types of shore structure were statistically assessed. The results show good potential for the proposed approach—in general, objects can be detected using the radar—although there is a need for development of further signal processing algorithms. Full article
Show Figures

Figure 1

29 pages, 7908 KiB  
Article
The Application of the Hybrid GIS Spatial Multi-Criteria Decision Analysis Best–Worst Methodology for Landslide Susceptibility Mapping
by Ljubomir Gigović, Siniša Drobnjak and Dragan Pamučar
ISPRS Int. J. Geo-Inf. 2019, 8(2), 79; https://doi.org/10.3390/ijgi8020079 - 12 Feb 2019
Cited by 38 | Viewed by 4597
Abstract
The main goal of this article is to produce a landslide susceptibility map by using the hybrid Geographical Information System (GIS) spatial multi-criteria decision analysis best–worst methodology (MCDA-BWM) in the western part of the Republic of Serbia. Initially, a landslide inventory map was [...] Read more.
The main goal of this article is to produce a landslide susceptibility map by using the hybrid Geographical Information System (GIS) spatial multi-criteria decision analysis best–worst methodology (MCDA-BWM) in the western part of the Republic of Serbia. Initially, a landslide inventory map was prepared using the National Landslide Database, aerial photographs, and also by carrying out field surveys. A total of 1082 landslide locations were detected. This methodology considers the fifteen conditioning factors that are relevant to landslide susceptibility mapping: the elevation, slope, aspect, distance to the road network, distance to the river, distance to faults, lithology, the Normalized Difference Vegetation Index (NDVI), the Topographic Wetness Index (TWI), the Stream Power Index (SPI), the Sediment Transport Index (STI), annual rainfall, the distance to urban areas, and the land use/cover. The expert evaluation takes into account the nature and severity of the observed criteria, and it was tested by using two scenarios: the different aggregation methods of the BWM. The prediction performances of the generated maps were checked by the receiver operating characteristics (ROCs). The validation results confirmed that the areas under the ROC curve for the weighted linear combination (WLC) and the ordered weighted averaging (OWA) aggregation methods of the MCDA-BWM have a very high accuracy. The results of the landslide susceptibility assessment obtained by applying the proposed best–worst method were the first step in the development of landslide risk management and they are expected to be used by local governments for effective management planning purposes. Full article
Show Figures

Figure 1

13 pages, 4747 KiB  
Article
V-Factor Indicator in the Assessment of the Change in the Attractiveness of View as a Result of the Implementation of a Specific Planning Scenario
by Magda Pluta and Bartosz Mitka
ISPRS Int. J. Geo-Inf. 2019, 8(2), 78; https://doi.org/10.3390/ijgi8020078 - 11 Feb 2019
Cited by 2 | Viewed by 2395
Abstract
This paper describes the algorithm of the view factor (V-factor). It is based on an analysis of visibility, taking into account the attractiveness of the observed elements in a three-dimensional space. The results of the V-factor analysis provide input for the decision-making process [...] Read more.
This paper describes the algorithm of the view factor (V-factor). It is based on an analysis of visibility, taking into account the attractiveness of the observed elements in a three-dimensional space. The results of the V-factor analysis provide input for the decision-making process when selecting the most advantageous planning scenario so that the harmony of landscape and ecological balance can be maintained. The V-factor indicator can be successfully used in the process of spatial planning, in particular, at the stage of determining the parameters of new buildings and lines of sight between planned buildings. The purpose of the indicator is to determine the numerical values for observation points, thus facilitating a comparative assessment of the attractiveness of view available from the special points in space. The analysis uses a 3D space model that includes an integrated existing and planning state designed on the basis of planning scenarios. The V-factor analysis takes into account the distance of the observation point from the observed object, vertical and horizontal angles of observation, and the aesthetic value of the observed object. As a result, an average value of the V-factor indicator was obtained for each planning scenario, which facilitated the determination of the more beneficial one in terms of the attractiveness of view. Full article
Show Figures

Figure 1

25 pages, 727 KiB  
Review
Progress and Challenges on Entity Alignment of Geographic Knowledge Bases
by Kai Sun, Yunqiang Zhu and Jia Song
ISPRS Int. J. Geo-Inf. 2019, 8(2), 77; https://doi.org/10.3390/ijgi8020077 - 06 Feb 2019
Cited by 25 | Viewed by 4610
Abstract
Geographic knowledge bases (GKBs) with multiple sources and forms are of obvious heterogeneity, which hinders the integration of geographic knowledge. Entity alignment provides an effective way to find correspondences of entities by measuring the multidimensional similarity between entities from different GKBs, thereby overcoming [...] Read more.
Geographic knowledge bases (GKBs) with multiple sources and forms are of obvious heterogeneity, which hinders the integration of geographic knowledge. Entity alignment provides an effective way to find correspondences of entities by measuring the multidimensional similarity between entities from different GKBs, thereby overcoming the semantic gap. Thus, many efforts have been made in this field. This paper initially proposes basic definitions and a general framework for the entity alignment of GKBs. Specifically, the state-of-the-art of algorithms of entity alignment of GKBs is reviewed from the three aspects of similarity metrics, similarity combination, and alignment judgement; the evaluation procedure of alignment results is also summarized. On this basis, eight challenges for future studies are identified. There is a lack of methods to assess the qualities of GKBs. The alignment process should be improved by determining the best composition of heterogeneous features, optimizing alignment algorithms, and incorporating background knowledge. Furthermore, a unified infrastructure, techniques for aligning large-scale GKBs, and deep learning-based alignment techniques should be developed. Meanwhile, the generation of benchmark datasets for the entity alignment of GKBs and the applications of this field need to be investigated. The progress of this field will be accelerated by addressing these challenges. Full article
(This article belongs to the Special Issue Cognitive Aspects of Human-Computer Interaction for GIS)
Show Figures

Figure 1

23 pages, 23595 KiB  
Article
Prototyping of Environmental Kit for Georeferenced Transient Outdoor Comfort Assessment
by Ahmad Saleem Nouman, Ata Chokhachian, Daniele Santucci and Thomas Auer
ISPRS Int. J. Geo-Inf. 2019, 8(2), 76; https://doi.org/10.3390/ijgi8020076 - 05 Feb 2019
Cited by 22 | Viewed by 5232
Abstract
Environmental data acquisition tools are broadly used for climate monitoring and urban comfort assessment followed by data mining and sensing techniques for putting into evidence the relationship between environmental qualities of urban spaces and human well-being. Within this context, an environmental toolkit is [...] Read more.
Environmental data acquisition tools are broadly used for climate monitoring and urban comfort assessment followed by data mining and sensing techniques for putting into evidence the relationship between environmental qualities of urban spaces and human well-being. Within this context, an environmental toolkit is a fundamental tool to evaluate transient outdoor comfort. This study explains the prototyping and validation of a mobile environmental sensor kit. The results show the prototype has reasonable accuracy despite its affordability with respect to industrial sensors. Full article
(This article belongs to the Special Issue Human-Centric Data Science for Urban Studies)
Show Figures

Graphical abstract

21 pages, 950 KiB  
Review
Shoreline Detection using Optical Remote Sensing: A Review
by Seynabou Toure, Oumar Diop, Kidiyo Kpalma and Amadou Seidou Maiga
ISPRS Int. J. Geo-Inf. 2019, 8(2), 75; https://doi.org/10.3390/ijgi8020075 - 05 Feb 2019
Cited by 133 | Viewed by 11993
Abstract
With coastal erosion and the increased interest in beach monitoring, there is a greater need for evaluation of the shoreline detection methods. Some studies have been conducted to produce state of the art reviews on shoreline definition and detection. It should be noted [...] Read more.
With coastal erosion and the increased interest in beach monitoring, there is a greater need for evaluation of the shoreline detection methods. Some studies have been conducted to produce state of the art reviews on shoreline definition and detection. It should be noted that with the development of remote sensing, shoreline detection is mainly achieved by image processing. Thus, it is important to evaluate the different image processing approaches used for shoreline detection. This paper presents a state of the art review on image processing methods used for shoreline detection in remote sensing. It starts with a review of different key concepts that can be used for shoreline detection. Then, the applied fundamental image processing methods are shown before a comparative analysis of these methods. A significant outcome of this study will provide practical insights into shoreline detection. Full article
(This article belongs to the Special Issue Natural Hazards and Geospatial Information)
Show Figures

Figure 1

23 pages, 2957 KiB  
Article
Exploring Group Movement Pattern through Cellular Data: A Case Study of Tourists in Hainan
by Xinning Zhu, Tianyue Sun, Hao Yuan, Zheng Hu and Jiansong Miao
ISPRS Int. J. Geo-Inf. 2019, 8(2), 74; https://doi.org/10.3390/ijgi8020074 - 04 Feb 2019
Cited by 18 | Viewed by 4328
Abstract
Identifying group movement patterns of crowds and understanding group behaviors are valuable for urban planners, especially when the groups are special such as tourist groups. In this paper, we present a framework to discover tourist groups and investigate the tourist behaviors using mobile [...] Read more.
Identifying group movement patterns of crowds and understanding group behaviors are valuable for urban planners, especially when the groups are special such as tourist groups. In this paper, we present a framework to discover tourist groups and investigate the tourist behaviors using mobile phone call detail records (CDRs). Unlike GPS data, CDRs are relatively poor in spatial resolution with low sampling rates, which makes it a big challenge to identify group members from thousands of tourists. Moreover, since touristic trips are not on a regular basis, no historical data of the specific group can be used to reduce the uncertainty of trajectories. To address such challenges, we propose a method called group movement pattern mining based on similarity (GMPMS) to discover tourist groups. To avoid large amounts of trajectory similarity measurements, snapshots of the trajectories are firstly generated to extract candidate groups containing co-occurring tourists. Then, considering that different groups may follow the same itineraries, additional traveling behavioral features are defined to identify the group members. Finally, with Hainan province as an example, we provide a number of interesting insights of travel behaviors of group tours as well as individual tours, which will be helpful for tourism planning and management. Full article
Show Figures

Figure 1

13 pages, 13808 KiB  
Article
Grassland Dynamics and the Driving Factors Based on Net Primary Productivity in Qinghai Province, China
by Xiaoxu Wei, Changzhen Yan and Wei Wei
ISPRS Int. J. Geo-Inf. 2019, 8(2), 73; https://doi.org/10.3390/ijgi8020073 - 02 Feb 2019
Cited by 15 | Viewed by 3066
Abstract
Qinghai province is an important part of the Tibetan Plateau, and is characterized by extremely fragile ecosystems. In the last few decades, grasslands in this province have been influenced profoundly by climate change, as well as human activities. Here, we use the Carnegie-Ames-Stanford [...] Read more.
Qinghai province is an important part of the Tibetan Plateau, and is characterized by extremely fragile ecosystems. In the last few decades, grasslands in this province have been influenced profoundly by climate change, as well as human activities. Here, we use the Carnegie-Ames-Stanford Approach (CASA) model to assess the dynamics of temperate steppe, alpine steppe, temperate meadow, alpine meadow, sparse grassland and herbaceous wetland via actual net primary productivity (NPPa). Our findings showed that: (1) From 2001 to 2016, the average NPPa in Qinghai province showed a fluctuation presented a generally increasing trend. The mean value of NPPa was 114.27 g C m−2 year−1, and the increase rate was 0.47 g C cm−2 year−1. (2) There were NPPa increase rate discrepancies among the six typical grassland biomes. Herbaceous wetland had the highest change rate, closely followed by alpine steppe, temperate steppe, alpine meadow, temperate meadow and sparse grassland. (3) The largest area of restoration mainly impacted by climate change reached 47.08% of the total grassland area, with human activities accounting for 21.74%. By contrast, the deteriorated area induced by human activities accounted for 9.78% of the total grassland. (4) Temperature may have been a greater factor than precipitation in driving grassland change during the study period. Decreasing grazing intensity and implementing effective protection measures were favorable to grassland restoration. Full article
Show Figures

Figure 1

16 pages, 9907 KiB  
Article
Re-Arranging Space, Time and Scales in GIS: Alternative Models for Multi-Scale Spatio-Temporal Modeling and Analyses
by Yi Qiang and Nico Van de Weghe
ISPRS Int. J. Geo-Inf. 2019, 8(2), 72; https://doi.org/10.3390/ijgi8020072 - 01 Feb 2019
Cited by 11 | Viewed by 4453
Abstract
The representations of space and time are fundamental issues in GIScience. In prevalent GIS and analytical systems, time is modeled as a linear stream of real numbers and space is represented as flat layers with timestamps. Despite their dominance in GIS and information [...] Read more.
The representations of space and time are fundamental issues in GIScience. In prevalent GIS and analytical systems, time is modeled as a linear stream of real numbers and space is represented as flat layers with timestamps. Despite their dominance in GIS and information visualization, these representations are inefficient for visualizing data with complex temporal and spatial extents and the variation of data at multiple temporal and spatial scales. This article presents alternative representations that incorporate the scale dimension into time and space. The article first reviews a series of work about the triangular model (TM), which is a multi-scale temporal model. Then, it introduces the pyramid model (PM), which is the extension of the TM for spatial data, and demonstrates the utility of the PM in visualizing multi-scale spatial patterns of land cover data. Finally, it discusses the potential of integrating the TM and the PM into a unified framework for multi-scale spatio-temporal modeling. This article systematically documents the models with alternative arrangements of space and time and their applications in analyzing different types of data. Additionally, this article aims to inspire the re-thinking of organizations of space, time, and scales in the future development of GIS and analytical tools to handle the increasing quantity and complexity of spatio-temporal data. Full article
Show Figures

Figure 1

28 pages, 13942 KiB  
Review
Evaluation of the Influence of Disturbances on Forest Vegetation Using the Time Series of Landsat Data: A Comparison Study of the Low Tatras and Sumava National Parks
by Premysl Stych, Josef Lastovicka, Radovan Hladky and Daniel Paluba
ISPRS Int. J. Geo-Inf. 2019, 8(2), 71; https://doi.org/10.3390/ijgi8020071 - 31 Jan 2019
Cited by 10 | Viewed by 3891
Abstract
This study focused on the evaluation of forest vegetation changes from 1992 to 2015 in the Low Tatras National Park (NAPANT) in Slovakia and the Sumava National Park in Czechia using a time series (TS) of Landsat images. The study area was damaged [...] Read more.
This study focused on the evaluation of forest vegetation changes from 1992 to 2015 in the Low Tatras National Park (NAPANT) in Slovakia and the Sumava National Park in Czechia using a time series (TS) of Landsat images. The study area was damaged by wind and bark beetle calamities, which strongly influenced the health state of the forest vegetation at the end of the 20th and beginning of the 21st century. The analysis of the time series was based on the ten selected vegetation indices in different types of localities selected according to the type of forest disturbances. The Landsat data CDR (Climate Data Record/Level 2) was normalized using the PIF (Pseudo-Invariant Features) method and the results of the Time Series were validated by in-situ data. The results confirmed the high relevance of the vegetation indices based on the SWIR bands (e.g., NDMI) for the purpose of evaluating the individual stages of the disturbance (especially the bark beetle calamity). Usage of the normalized Landsat data Climate Data Record (CDR/Level 2) in the research of long-term forest vegetation changes has a high relevance and perspective due to the free availability of the corrected data. Full article
(This article belongs to the Special Issue GIS for Safety & Security Management)
Show Figures

Graphical abstract

Previous Issue
Next Issue
Back to TopTop