A First Regional-Scale Estimate of Climate-Driven Terrestrial Carbon Export in Boreal Catchments


1
Met European Research Observatory, 82100 Benevento, Italy
2
Department of Science and Technology, University of Sannio, 82100 Benevento, Italy
3
UCA, INRA, VetAgro Sup, Unité Mixte de Recherche sur Écosystème Prairial (UREP), 63000 Clermont-Ferrand, France
*
Author to whom correspondence should be addressed.
Climate 2018, 6(2), 22; https://doi.org/10.3390/cli6020022
Submission received: 19 February 2018
/
Revised: 26 March 2018
/
Accepted: 27 March 2018
/
Published: 29 March 2018
(This article belongs to the Special Issue Decadal Variability and Predictability of Climate)
Abstract
:Highly dynamic hydro-geomorphic processes are known to drive exports of carbon (C) from river basins, but are not yet fully understood. Within this study, we simulated total organic carbon (TOC) exports at the outlet of Lake Simojärvi in the Gulf of Bothnia (Finland) with a parsimonious hydrological model. With thorough consideration of the dependence of erosion and sediment transport processes on seasonal precipitation rates, a satisfactory agreement was obtained between modelling and experimental observations (1962–2005). This provided confidence in the capability of the parsimonious model to represent temporal and spatial export dynamics. In the period 1860–2014, TOC export at the outlet of Lake Simojärvi was estimated to be highest on average (~5.5 Mg km−2·year−1) over 1974–2014 while the lowest TOC export (~2.5 Mg km−2·year−1) was estimated in 1860–1918 (with high levels of interannual-to-multidecadal variation). Regional simulations indicate that TOC increased in recent decades (on average, 4–5 Mg km−2·year−1 in 1974–2014 against ~3 Mg km−2·year−1 in 1940–1973) in northern Scandinavia and Finland. Warming-induced variability of TOC (which depends on precipitation patterns) may have altered the rates of C exchanges in aquatic ecosystems over recent years. TOC exports may continue to increase in boreal catchments with increasing temperatures as represented by future projections.
1. Introduction
Northern soils are known to store large quantities of carbon (C), though the susceptibility of C to be released as a consequence of environmental changes is uncertain. Specifically climate and land-use changes pose a potential threat to further losses of C [1].
The importance of small streams in C cycling is highlighted in Huotari et al. [1] and other studies (e.g., [2,3]). In northern areas, C-budget studies have incorporated surface waters in watersheds covering large areas, mostly in remote regions having limited human disturbance (e.g., [4,5]). Human induced perturbations within catchments affect C export into aquatic systems and may also have large implications in regional C cycling. Farming practices may enhance the C export (e.g., [6]). Peatland drainages also trigger successions in C cycling and export to aquatic systems [7]. For instance, [8] observed, for Finland, that the highest C concentrations in lakes tend to be associated with the highest proportion of peatlands in catchments. This indicates the importance of considering land-use patterns when determining budgets of different C species in complex areas with both streams/ditches and lake surfaces [1].
However, fluvial responses may be dominated by the climatic shift in such circumstances, and climate change may also induce land-use changes, by making for instance agriculture either possible or impossible [9]. Evidence suggests that the interactions of land-use and climatic changes may involve considerable complexity in terms of their combined impacts on the response of fluvial systems (e.g., [10]). If people change land uses approximately in phase with climatic changes, then the fluvial response will be a result of both. In some cases, the two appear to operate essentially and independently, whereas in others they are closely linked and the impact of land-use change may only be fully apparent when coupled with climate [11].
The history of land utilization in Finland and Scandinavia is characterized by open landscapes with animal husbandry and intensive grazing as well as cultivation until 1900, while starting with the 20th century a period of reforestation is noticeable (e.g., [12]). Grazing in forests, slash-and-burn-cultivation and hay production on mires and meadows prevailing during the medieval crisis significantly altered the concentration of transported OC from the terrestrial ecosystem to inland waters, resulting in a decreasing OC concentration in surface water in boreal lakes. Vegetation changes from an open towards a forested landscape are currently prevailing and the total OC (TOC) concentration in surface water in boreal lakes rapidly increases, also depending on decreasing sulfur depositions [13]. An explicit separation of the effects of climate and land-use changes on lake-water TOC is however complicated because of their temporal overlap. For instance, Matskovsky and Helama [14] documented the expansion of summer farms during the Little Ice Age (LIA) and the concomitant climate cooling, with temperatures ∼1 °C cooler than at present. The climate deterioration during the LIA may have contributed to the TOC decline during the period 1450–1950 but Meyer-Jacob et al. [15] concluded that climate was not the main driver, emphasizing the important role of past and contemporary changes in land use in ongoing OC trends in forested upland and mountainous areas in Northern Europe. However, according to [16] and other authors ([17,18,19]), climate change (i.e., recent increases in precipitation and temperature) may have contributed to the observed and reconstructed increases in lake-water TOC concentration over recent decades, while changes in land use and sulphur deposition (sulphur emissions had an increase in the early 1900s to a peak around 1980 and a subsequent decrease) have probably played more important roles at the centennial time-scale. Climate influences include temperature-driven soil organic productivity and decomposition as well as precipitation-driven water table fluctuations and transport of OC from terrestrial soils (e.g., [20]).
The response of the terrestrial C cycle to climate change is a key uncertainty affecting future climate change projections [21]. Much of this uncertainty comes from the terrestrial biosphere and in particular the storage of C in soil organic material. Globally, soil organic matter contains more than three times as much C as either the atmosphere or terrestrial vegetation [22]. However, as the climate continues to diverge from conditions experienced since the last ice-age (~13,000 years BP), the accumulation and storage of C in terrestrial soils become increasingly uncertain. In part, this situation reflects the challenge of isolating climate change effects from natural variability and land-use change [23]. Thus, before making any prediction on the future evolution of C cycling, there is a pressing need to better understand the variation in contemporary and historical C storage in terrestrial soils.
Strong connectivity between terrestrial and aquatic components of watersheds has led to the conceptual view of lakes and rivers as sentinels of climate change [24,25]. While lakes and wetlands represent a C sink over long timescales (decades to millennia), the majority of organic carbon (OC) from terrestrial sources is metabolized and respired, and ultimately exported to the atmosphere as CO2. The export of OC from terrestrial soils to streams is largely driven by precipitation, mediated by a variety of factors (such as temperature, vegetation cover and ecosystem C turnover) that influence C mobilization. For instance, regional warming may change the balance between mineralization and sequestration by lakes, altering catchment hydrology and the lateral transfer of C and nutrients [26], which is common in low-relief rivers.
At the basin scale, meso-scale precipitation plays an important role in erosion and sediment transport, because the distribution of local rainstorms determines the sediment yielded in the individual catchments forming the basin. In this way, fluvially transported organic matter can be explained by soil erosion and sedimentary deposits [27], considering that organic material is mainly discharged from flat watersheds due to their past rainfall changes. Relatively complex, physically-based models have been developed to represent OC mobilization and export from terrestrial sources (e.g., [28,29]). While they provide promising results, the requirement for intensive computation and sophisticated modelling may hinder further applications at large spatial (e.g., regions) or temporal (e.g., future climate scenarios) scales.
In this study, we developed a parsimonious (regression) model of TOC export from a boreal catchment (Simojoki basin, Finland) based on readily accessible inputs (monthly precipitation), which helps overcome the barrier (essentially key input data requirements) imposed by sophisticated, physically-based models. Information captured in minimalist descriptors (after [30]) may be relatively simple but it allows for historical reconstructions as well as future projections or regional simulations of TOC dynamics. To meet these objectives, the model was first built and evaluated using contemporary TOC and precipitation data (1962–2005) from the Simojoki basin (Finland). Then, by using it, we reconstructed long-time changes (1860–2014) in the sediment regime of the basin and examined spatial variability of C export across Finland and northern Scandinavia.
2. Materials and Methods
2.1. Study Area and Data Sources
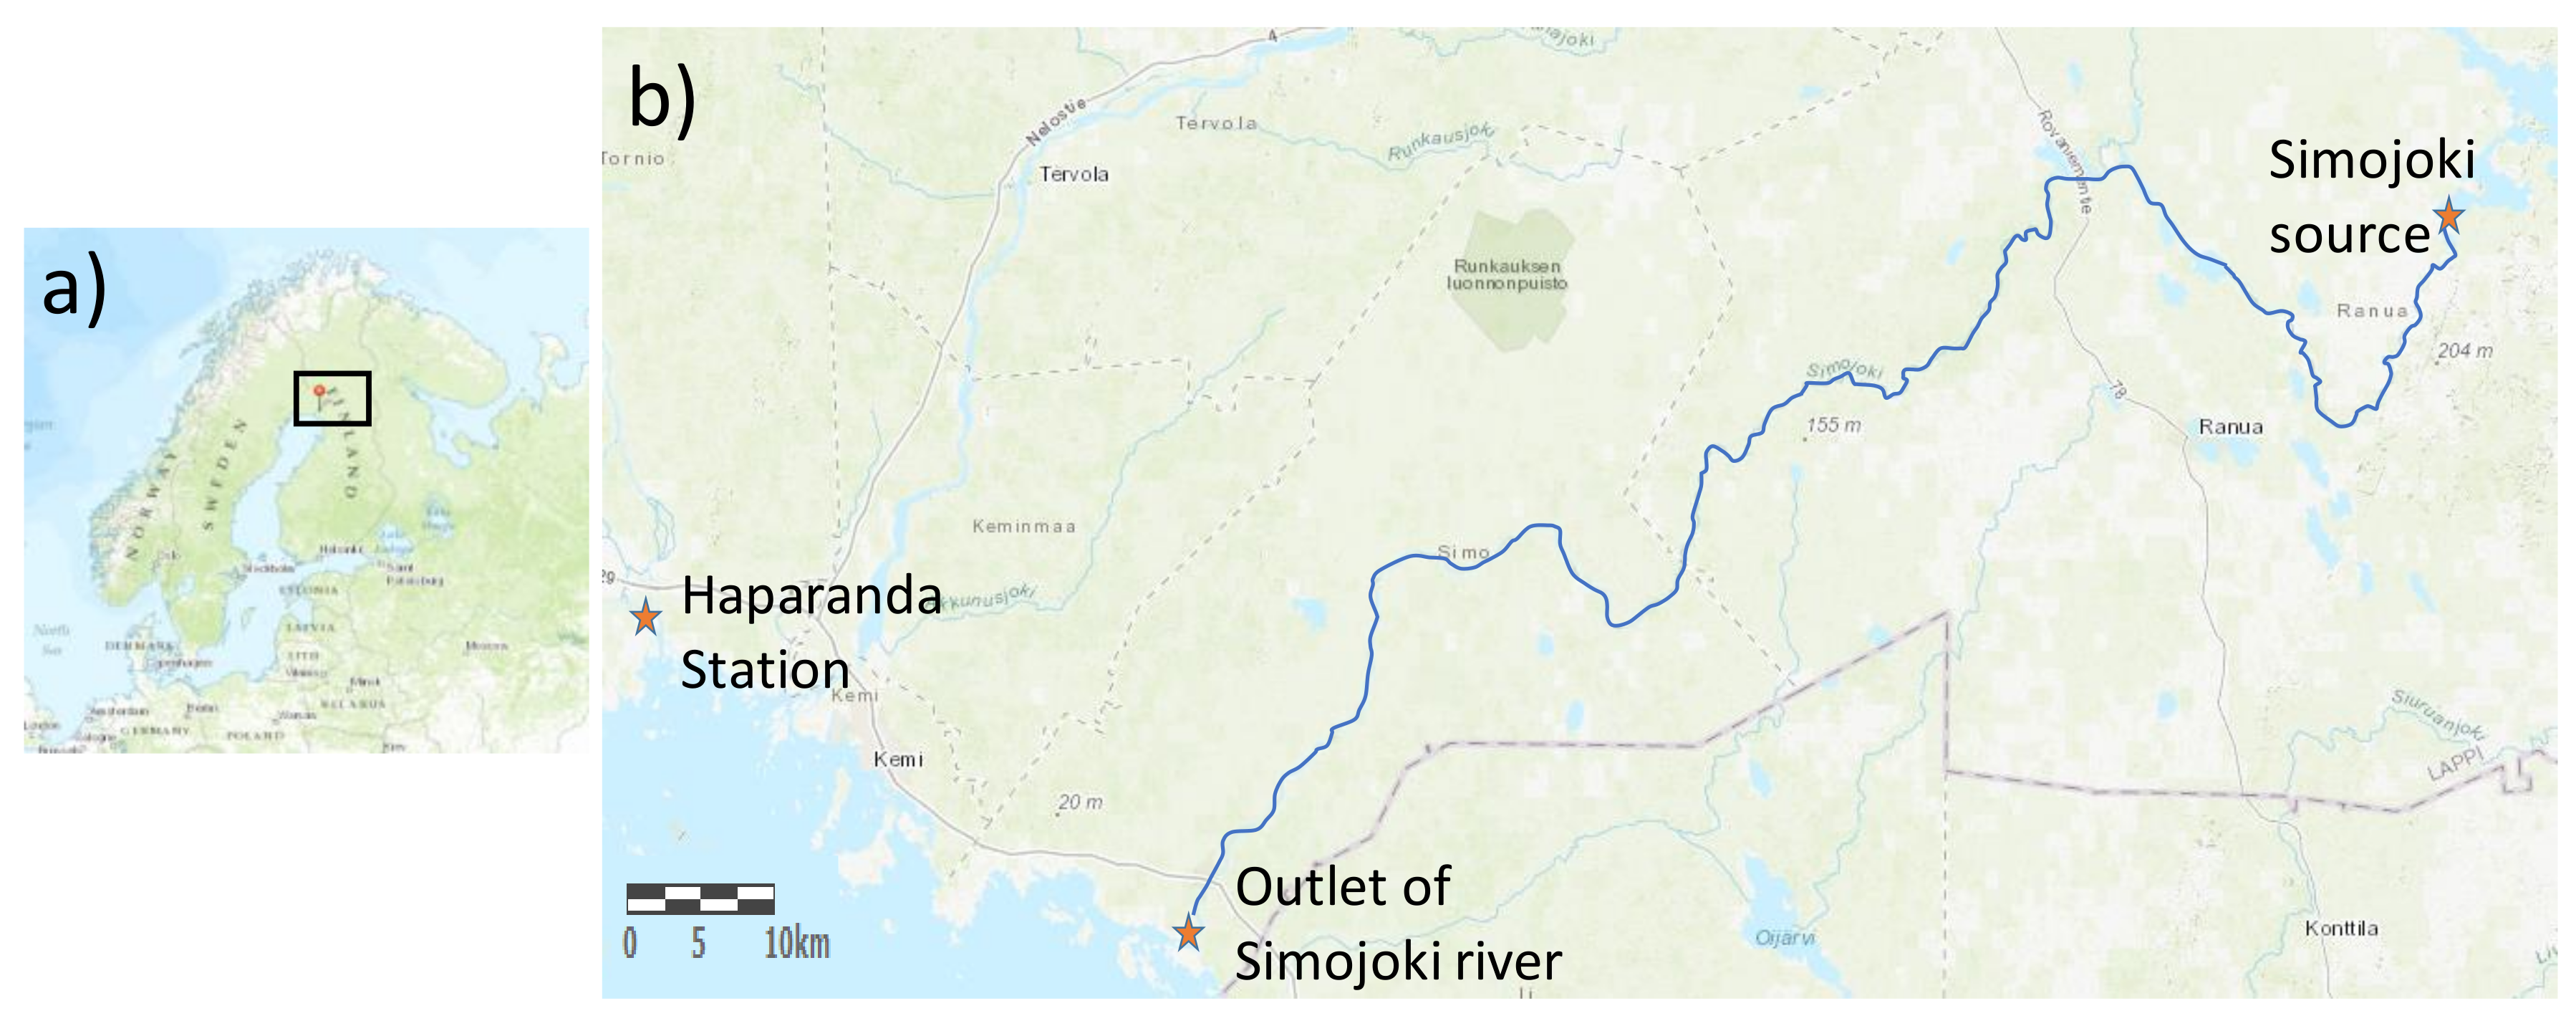
The Simojoki (catchment area 3160 km2) is a salmon river in near-natural state, discharging to the Gulf of Bothnia of the Baltic Sea. It runs from the outlet of Lake Simojärvi westward for 193 km before emptying into the Gulf of Bothnia (Figure 1). Forestry is the dominant human impact, mostly characterized by forest drainage and cutting [31]. A large part of the region includes peatlands and peatland forests. On average, 0.5% of the total forest area of the catchment is cut annually. Agricultural fields cover only 2.7% of the catchment area [32]. Annual TOC data (1962–2005) were provided by Lepistö et al. [31].
The Simojoki has two discharge gauging stations: one is located at the river outlet (used here), the other upstream, at the Hosionkoski rapids (65°55′ N, 25°50′ E). The annual average discharge for 1971–2000 was 40.4 m3 s−1, i.e., the annual average runoff was 403 mm. The Finnish Environment Institute and regional environmental centres collected water samples at the outlet of the Simojoki (Figure 1) during the study period 1962–2005—usually four samples per year over the period 1962–1981, and 10–18 samples per year during the period 1982–2005.
For the entire observation period 1962–2005, TOC values (hereafter assumed as ‘observed’ values) were determined from chemical oxygen demand (COD) value using the following equation [33]:
TOC = 0.675 · COD + 1.94, R2 = 0.92, n = 975
The COD was determined by using ammonium oxalate as a standard for permanganate titration, with standard potassium permanganate as the oxidizing agent.
Rainfall data provided by Global Historical Climatology Network (GHCN-Monthly) via KNMI-Climate Explorer (http://climexp.knmi.nl) were used for the reconstruction of TOC export over the period 1860–2014. In particular, rainfall data from Haparanda (65°50′ N, 24°08′ E) were extracted as this is the nearest weather station to the river outlet (65°42′ N, 25°11′ E). Other stations in the area are more distant geographically (Rovaniemi, 66°36′ N, 25°48′ E; Gällivare, 67°06′ N, 20°07′ E; Luleå, 65°36′ N, 22°06′ E) and cover shorter periods of time (1961–1990, 1897–1910, 1951–2001), not extending until recent times. Rainfall data for the spatial reconstruction of TOC export across Finland and Northern Scandinavia were provided by Climate Research Unit (CRU-dataset, http://www.cru.uea.ac.uk/data), into grids of 0.5° × 0.5°resolution.
2.2. Modelling Approach
The climate-driven estimate of TOC export from the basin is produced in the basin (source) and transferred to the aquatic system (sink). This is a function of major hydro-geomorphic processes contributing to the sediment yield. The effects of meso-scale precipitation on soil erosion and sediment transport was considered at the basin scale, conceptually separated from the distribution of local rainstorms playing an important role for sediment yield in individual catchments that make up the basin.
In a pursuit of a simple criterion, following Diodato and Bellocchi [10], the annual TOC export is estimated using a solution in which seasonal precipitation (rainfall and snowfall) quantiles, erosivity and overland flows are modelled together. In this way, the temporal dependence of erosion and sediment transport processes is accounted for to estimate the TOC exports at the outlet of the basin as follows:
where TOCM is the estimated TOC export in Mg km−2 year−1; p12(t−1) accounts for precipitation (mm) in December of the precedent year; and the summation term is the precipitation (mm) from January to November of the current year t. These two terms are the result of the major hydro-geomorphic processes that contribute to the net OC yield at different scales. The constant term B (Mg km−2 year−1) is part of OC remaining trapped in the basin during sediment transport to water bodies, and A is the scale parameter to convert the terms between brackets in Mg km−2 year−1.
With the minimalist regression model developed in this study, we address for the effect of multiple sediment sources, while considering the system complexity and process interactions for TOC export. Equation (2) is a simplification of a basin-scale, catchment-based conceptual hydrological model. Path delay times are employed to streamline complex interactions between local- and meso-scale storms as intrinsic part of distinct temporal segments. Based on their scale, storm events are first grouped and then hierarchized according to communication delays among components of the spatio-temporal process. Based on this concept (after [34]), the precipitation term antecedent to the current year reflects the larger delay between the initiation of the process (soil erosion) and increase of sediment yield at the outlet, as occurring at the catchment (t = −1) than at the basin scale (t = 0). A linear regression was performed to obtain the best fit of the actual versus modelled TOC export.
3. Results and Discussion
3.1. Parameterization and Evaluation
The values of the parameters obtained from the full set of TOC observations available (1962–2005) are: A = 0.0163, B = −4.458 (Equation (2)). The regression line between the two series is similar to the 1:1 line (Figure 2a), with only one outlier (orange dot) in the upper left corner.
The R2 indicates that the model explains 80% of the variability in the data. It corresponds to a correlation coefficient of about 0.90, which indicates that there is a moderately strong relationship between modelled and measured TOC. The mean absolute value of the residuals (optimum, 0 ≤ MAE < +∞) was 0.656. The Durbin-Watson (DW) test was also performed to evaluate the autocorrelated residuals because strong temporal dependence may induce spurious correlations. Since the p-value is less than 0.05 (0.0133), there is an indication of possible serial correlation at the 95% confidence level.
Figure 2b displays the Studentized residuals, obtained by dividing the residuals (modelled minus actual data) by their standard deviation (equal to 0.833 Mg km−2 year−1), versus the predicted values of TOC, which indicates a substantial non-random pattern in the distribution of residuals across the range of modelled data. With the terms of Equation (2), the estimation of TOC takes into consideration erosion and transport processes generally occurring on slopelands across a spatial extent characterized by the distributions of both light and intense precipitation. The model was developed and parameterized using precipitation and TOC export data collected during a period (1962–2005) of changing climate patterns (1940s–1970s cooling, end-of-20th century warming and early 21th century warming slowdown). We thus hereby assume that the relationship between TOC export and precipitation of Equation (2) is sufficiently robust to changing climate conditions.
3.2. Reconstruction and Analysis of Historical Changes in Carbon Export
The reconstructed dataset of TOC exports (from 1860 to 2014) shows an overall increasing trend though featured by an interannual-to-multidecadal pattern of variability (Figure 3). Abrupt change-points in the TOC time-series were detected using the Buishand range test [35] in order to locate the years where a stepwise shift is likely. The pattern observed suggests that the trend had a prominent change-point in 1920 (significant test of Buishand, p < 0.05), followed by other break points in 1938 and 1974. Four periods were thus identified by discontinuities as part of the variability in results, from cool conditions (before 1920) to the most recent warming period extending over the 20th century and the early 21st, with two transition phases between the two main phases. The reconstructed scenario suggests that export rates experienced the greatest oscillations during the years 1920–1938 and from 1974 to 2014, while limited fluctuations were detected in the first period (1860–1918) and in the interval 1938–1974. On average, the last period differs from the previous (p = 0.005) of about 1 Mg km−2 year−1, and of about 2 Mg km−2 year−1 from the initial phase 1860–1920 (p~0.000).
The general increase of exports may indicate an increase of effective precipitation in the study area in recent times, with runoff playing an important role in the mechanism of TOC transport. The evidence that high TOC exports take place particularly in autumn indicates that the process of TOC export is most sensitive to changes in autumn precipitation [31]. In sub-Artic Sweden, Kokfelt et al. [36] showed that major shifts towards increased TOC concentration in lake water occurred around 1980, which reflects an increase in annual total precipitation. The mean annual TOC concentration also increased significantly in seven of the eight catchments analyzed by Sarkkola et al. [19] in Finland. In another Swedish catchment, Köhler et al. [37] found that increases in TOC export were linearly correlated to the relative distribution of snow or rainfall. These studies are in concur with our findings, that is, TOC exports change considerably in Scandinavian and Finnish lakes in response to hydro-climatic changes. We have thus used our model to explore the spatial pattern of TOC exports in Finland and northern Scandinavia.
3.3. Spatial Pattern of TOC
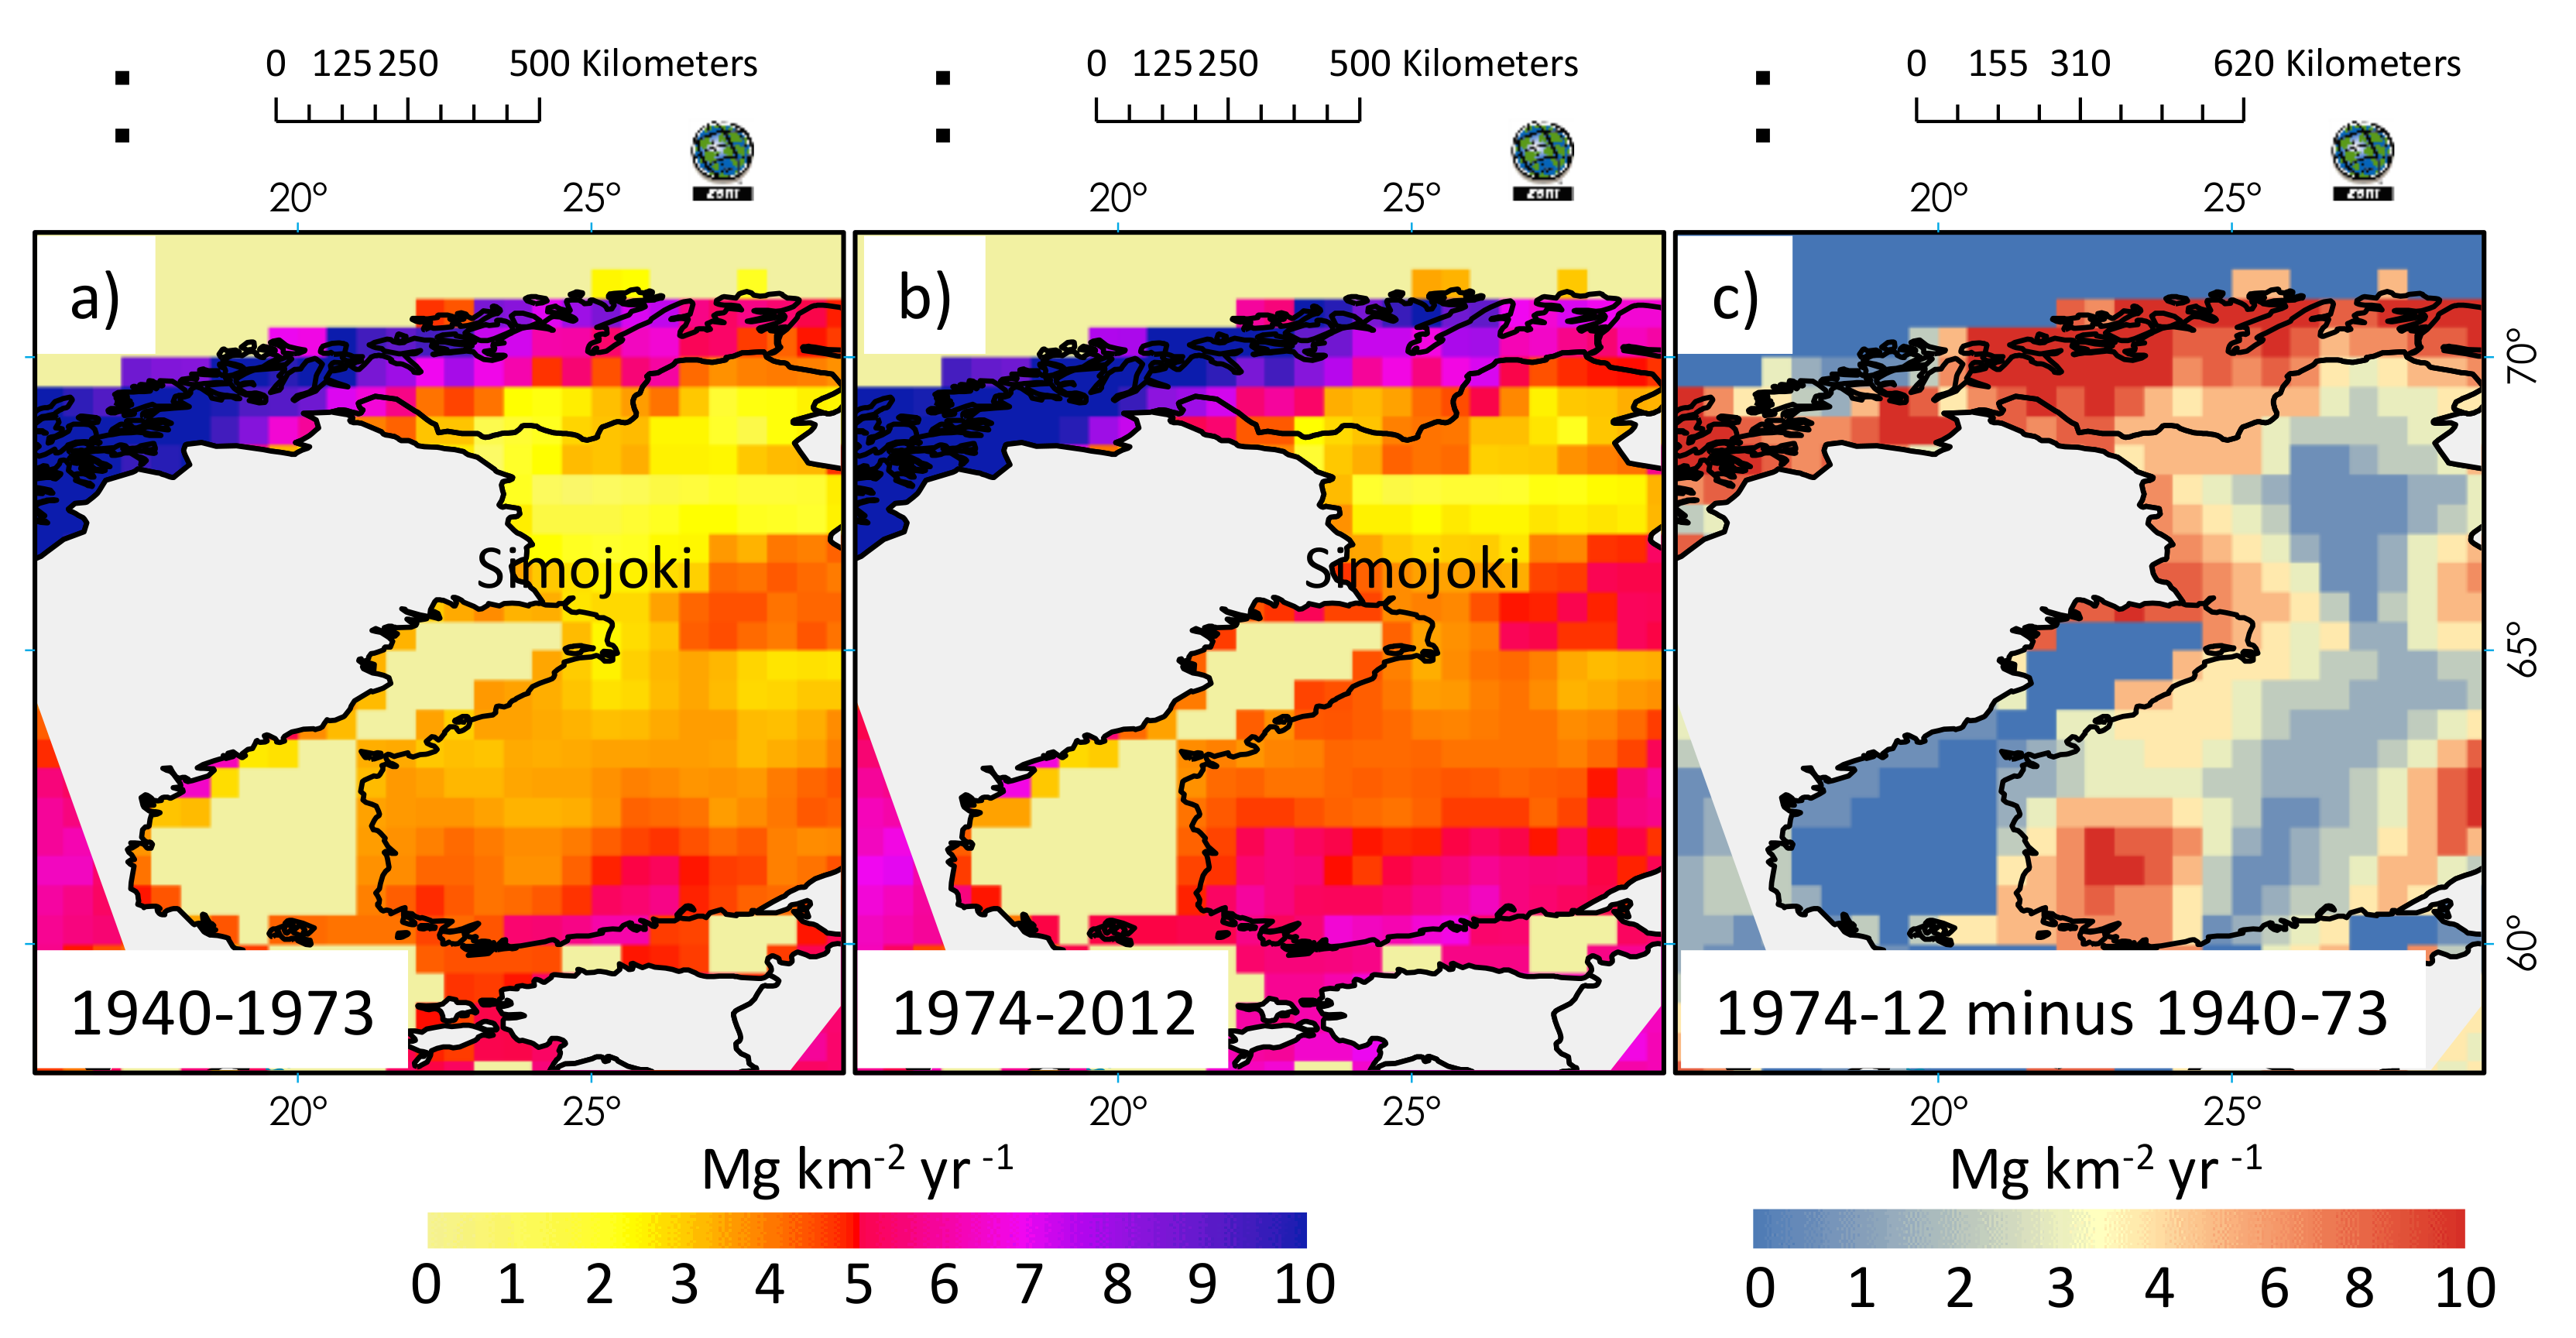
According to the change-points found in the previous time-series analysis, the spatial comparison of TOC exports was performed between the most recent decades (1974–2014) and the preceding period 1940–1973, considering a grid size roughly corresponding to the size of Simojoki basin. The modelled values (Figure 4a,b) are in the range of <2 to >50 g m−2 year−1 (=Mg km−2 year−1) reported by de Wit et al. [38] for boreal landscapes, and reflect the highest area specific TOC export of 8 g m−2 year−1 measured by Räike et al. [39] from Finnish rivers. The phase 1940–1973 (Figure 4a) sees a distribution of TOC values around 3 Mg km−2 year−1 in Finland (especially in the western side of the country, similar to northern Sweden), while in recent decades (1974–2014) the TOC export has increased to 4 Mg km−2 year−1 around Simojoki basin and almost everywhere in Finland, until a rate of ≥ 5 Mg km−2 year−1 in Southern Finland and part of Sweden (Figure 4b).
Figure 4c, which shows the difference between the two periods, indicates that changes in TOC export are not spatially homogeneous across the area investigated. Larsen et al. [40] estimated, under climate change forcing, an increase by 65% from the current median concentrations of OC in lakes in ~1000 Norwegian pristine lakes covering a wide range of climatic conditions.
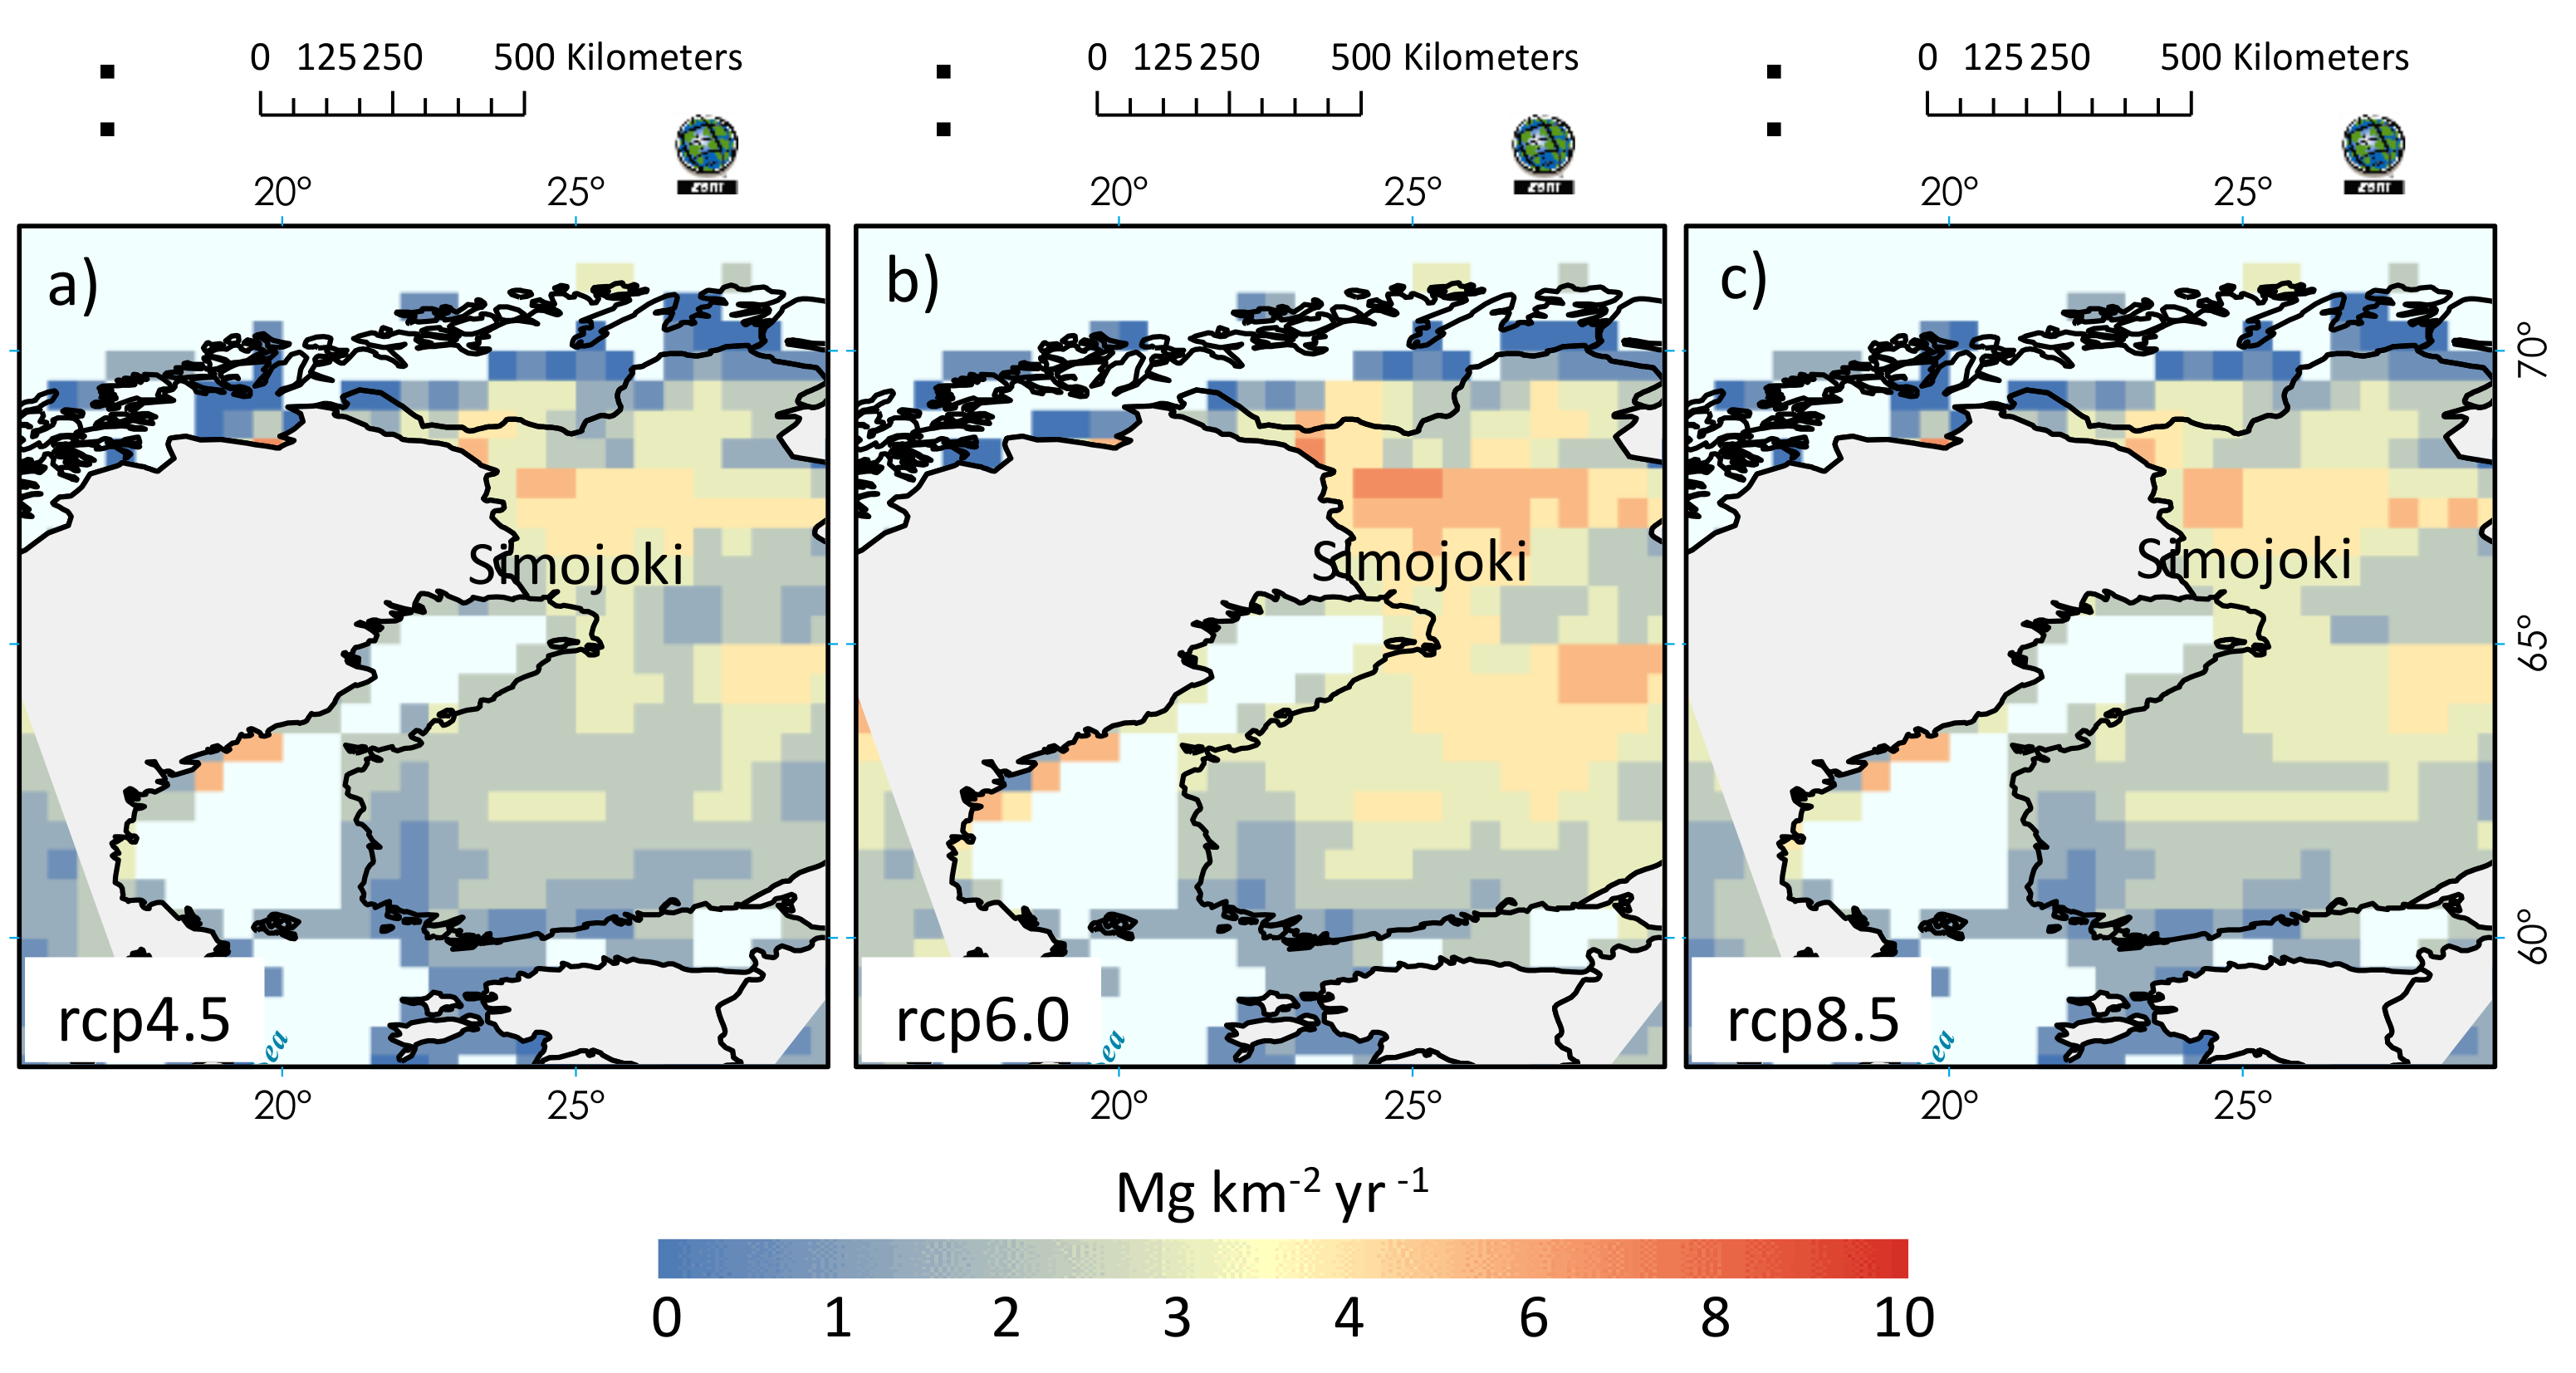
To get an insight into future scenarios of TOC exports in Finland and northern Scandinavia (Figure 5a–c), we used projected precipitation (as reproduced by the CMIP5 model mean and provided by KNMI Climate Explorer) to estimate TOC exports for 2021–2050 under three storylines representing medium (RCP4.5), middle-of-the-road (RCP6) and high (RCP8.5) emission storylines. The results indicate an increase in the TOC export for the three scenarios as compared to the reference period 1974–2012. The scenario RCP6 predicts the highest increment in TOC export (on average, 5 Mg km−2 year−1 higher than 1974–2012). However, across the Simojoki basin, minimal differences were detected in projected TOC exports with different scenarios of climate change. This indicates that in this relatively undisturbed land-use system projections of future TOC exports are relatively insensitive to alternative climate forcing data.
4. Conclusions
With focus on Finland and Scandinavia, the modelling approach used in this study suggests that: (1) changes in rainfall patterns represent a strong driver of TOC export; and (2) rainfall changes occurred in recent decades resulted in increasing exports of fluvial TOC export in aquatic systems. The relationship between TOC exports and rainfall patterns identified in this study (and suggested by other studies) warrants continue further monitoring to substantiate the role of precipitation changes on C dynamics in fluvial basins beyond land-use changes. Further evidence substantiating this relationship would permit to make reasonable inferences about trends of TOC exports in the medium term (in the form of predictions based on rainfall forecasts). For long-term projections, it would rather be desirable to explore the opportunities offered by hydrologic models considering land use and land cover variables (e.g., [41]) in addition to climatic inputs. This paper may nonetheless help in stimulating the debate about understanding the climate mechanisms at play in boreal catchments and provide a useful springboard for further research.
Acknowledgments
The authors acknowledge that the above study is an investigators-driven research run without grant support.
Author Contributions
N.D. designed and ran the study, and wrote the first draft of the manuscript. L.E. contributed to data analysis. G.B. participated in data analysis and finalized the writing of the manuscript.
Conflicts of Interest
The authors declare that there is no conflict of interest regarding the publication of this paper.
References
- Huotari, J.; Nykänen, H.; Forsius, M.; Arvola, L. Effect of catchment characteristics on aquatic carbon export from a boreal catchment and its importance in regional carbon cycling. Glob. Chang. Biol. 2013, 19, 3607–3620. [Google Scholar] [CrossRef] [PubMed]
- Forster, P.; Ramaswamy, V.; Artaxo, P.; Berntsen, T.; Betts, R.; Fahey, D.W.; Haywood, J.; Lean, J.; Lowe, D.C.; Myhre, G.; et al. Changes in atmospheric constituents and in radiative forcing. In Climate Change 2007 Physical Science Basis. Contribution of the Work Group I to the Fourth Assessment Report of the Intergovernmental Panel on Climate Change; Solomon, S., Qin, D., Manning, M., Chen, Z., Marquis, M., Averyt, K.B., Tignor, M., Miller, H.L., Eds.; Cambridge University Press: Cambridge, UK, 2007. [Google Scholar]
- Bastviken, D.; Tranvik, L.J.; Downing, J.A.; Crill, P.M.; Enrich-Prast, A. Freshwater methane emissions offset the continental carbon sink. Science 2011, 331, 50. [Google Scholar] [CrossRef] [PubMed]
- Buffam, I.; Turner, M.G.; Desai, A.R.; Hanson, P.C.; Rusak, J.A.; Lottig, N.R.; Stanley, E.H.; Carpenter, S.R. Integrating aquatic and terrestrial components to construct a complete carbon budget for a north temperate lake district. Glob. Chang. Biol. 2011, 17, 1193–1211. [Google Scholar] [CrossRef]
- Striegl, R.G.; Dornblaser, M.M.; McDonald, C.P.; Rover, J.R.; Stets, E.G. Carbon dioxide and methane emissions from the Yukon River system. Glob. Biogeochem. Cycles 2012, 26, GB0E05. [Google Scholar] [CrossRef]
- Schelker, J.; Eklöf, K.; Bishop, K.; Laudon, H. Effects of forestry operations on dissolved organic carbon concentrations and export in boreal first-order streams. J. Geophys. Res. 2012, 117, G01011. [Google Scholar] [CrossRef]
- Minkkinen, K.; Korhonen, R.; Savolainen, I.; Laine, J. Carbon balance and radiative forcing of Finnish peatlands 1900–2100—The impact of forestry drainage. Glob. Chang. Biol. 2002, 8, 785–799. [Google Scholar] [CrossRef]
- Vuorenmaa, J.; Forsius, M. Recovery of acidified Finnish lakes: Trends, patterns and dependence of catchment characteristics. Hydrol. Earth Syst. Sci. Discuss. 2007, 4, 3249–3283. [Google Scholar] [CrossRef]
- Dikau, R.; Herget, J.; Hennrich, K. Land use and climate impacts on fluvial systems during the period of agriculture in the River Rhine catchment (RhineLUCIFS)—An introduction. Erdkunde 2005, 59, 177–183. [Google Scholar] [CrossRef]
- Diodato, N.; Bellocchi, G. Climate-scale modelling of rainstorm-induced organic carbon losses in land-soil of Thune Alpine areas, Switzerland. In Storminess and Environmental Change; Diodato, N., Bellocchi, G., Eds.; Springer: Dordrecht, The Netherlands, 2014; pp. 205–214. [Google Scholar]
- Wasson, R.J. Land Use and Climate Impact on Fluvial Systems during the Period of Agriculture; PAGES Workshop Report Series 96-2; World Data Center-A for Paleoclimatology: Boulder, CO, USA, 1996; pp. 1–51. [Google Scholar]
- Hahnwald, S. Historical Land Use in Scandinavia and Its Influence on Carbon Storage in Soil and Peat in the Boreal Landscape. Ph.D. Thesis, Umeå University, Umeå, Sweden, 2016. [Google Scholar]
- Meyer-Jacob, C.; Tolu, J.; Bigler, C.; Yang, H.; Bindler, R. Early land use and centennial scale changes in lake-water organic carbon prior to contemporary monitoring. Proc. Natl. Acad. Sci. USA 2015, 112, 6579–6584. [Google Scholar] [CrossRef] [PubMed]
- Matskovsky, V.V.; Helama, S. Testing long-term summer temperature reconstruction based on maximum density chronologies obtained by reanalysis of tree-ring data sets from northernmost Sweden and Finland. Clim. Past 2014, 10, 1473–1487. [Google Scholar] [CrossRef] [Green Version]
- Meyer-Jacob, C.; Vogel, H.; Boxberg, F.; Rosén, P.; Weber, M.E.; Bindler, R. Independent measurement of biogenic silica in sediments by FTIR spectroscopy and PLS regression. J. Paleolimnol. 2014, 52, 245–255. [Google Scholar] [CrossRef]
- Bragée, P.; Mazier, F.; Rosén, P.; Fredh, D.; Broström, A.; Granéli, W.; Hammarlund, D. Forcing mechanisms behind variations in total organic carbon (TOC) concentration of lake waters during the past eight centuries—Palaeolimnological evidence from southern Sweden. Biogeosci. Discuss. 2013, 10, 19969–20003. [Google Scholar] [CrossRef] [Green Version]
- Freeman, C.; Evans, C.D.; Monteith, D.T.; Reynolds, B.; Fenner, N. Export of organic carbon from peat soils. Nature 2001, 412, 785. [Google Scholar] [CrossRef] [PubMed]
- Hongve, D.; Riise, G.; Kristiansen, J. Increased colour and organic acid concentrations in Norwegian forest lakes and drinking water—A result of increased precipitation? Aquat. Sci. 2004, 66, 231–238. [Google Scholar] [CrossRef]
- Sarkkola, S.; Koivusalo, H.; Laurén, A.; Kortelainen, P.; Mattsson, T.; Palviainen, M.; Piirainen, S.; Starr, M.; Finér, L. Trends in hydrometeorological conditions and stream water organic carbon in boreal forested catchments. Sci. Total Environ. 2009, 408, 92–101. [Google Scholar] [CrossRef] [PubMed]
- Sobek, S.; Tranvik, L.J.; Prairie, Y.T.; Kortelainen, P.; Cole, J.J. Patterns and regulation of dissolved organic carbon: An analysis of widely distributed lakes. Limnol. Oceanogr. 2007, 52, 1208–1219. [Google Scholar] [CrossRef]
- Carvalhais, N.; Forkel, M.; Khomik, M.; Bellarby, J.; Jung, M.; Migliavacca, M.; Mu, M.; Saatchi, S.; Santoro, M.; Thurner, M.; et al. Global covariation of carbon turnover times with climate in terrestrial ecosystems. Nature 2014, 514, 213–217. [Google Scholar] [CrossRef] [PubMed]
- Schmidt, M.W.I.; Torn, M.S.; Abiven, S.; Dittmar, T.; Guggenberger, G.; Janssens, I.A.; Kleber, M.; Kögel-Knabner, I.; Lehmann, J.; Manning, D.A.C.; et al. Persistence of soil organic matter as an ecosystem property. Nature 2011, 478, 49–56. [Google Scholar] [CrossRef] [PubMed]
- Walling, D.E.; Fang, D. Recent trends in the suspended sediment loads of the world’s rivers. Glob. Planet. Chang. 2003, 39, 111–126. [Google Scholar] [CrossRef]
- Williamson, C.E.; Dodds, W.; Kratz, T.K.; Palmer, M.A. Lakes and streams as sentinels of environmental change in terrestrial and atmospheric processes. Front. Ecol. Environ. 2008, 6, 247–254. [Google Scholar] [CrossRef]
- Adrian, R.; O’Reilly, C.M.; Zagarese, H.; Baines, S.B.; Hessen, D.; Keller, W.; Livingstone, D.M.; Sommaruga, R.; Straile, D.; Van Donk, E.; et al. Lakes as sentinels of current climate change. Limnol. Oceanogr. 2009, 54, 2283–2297. [Google Scholar] [CrossRef] [PubMed] [Green Version]
- Anderson, N.J.; Bindler, R.; Engstrom, D.R.; Jones, J.; Leavitt, P.R. Organic carbon sequestration by Arctic lakes: Comparing across regions to identify rates and controls. In Proceedings of the THAW 2014—THermokarst Aquatic Ecosystems Workshop, Quebec City, QC, Canada, 12–15 March 2014. [Google Scholar]
- Schefuß, E.; Eglinton, T.I.; Spencer-Jones, C.L.; Rullkötter, J.; De Pol-Holz, R.H.; Talbot, M.; Grootes, P.M.; Schneider, R.R. Hydrologic control of carbon cycling and aged carbon discharge in the Congo River basin. Nat. Geosci. 2016, 9, 687–690. [Google Scholar] [CrossRef]
- Wohl, E.; Dwire, K.; Sutfin, N.; Polvi, L.; Bazan, R. Mechanisms of carbon storage in mountainous headwater rivers. Nat. Commun. 2012, 3, 1263. [Google Scholar] [CrossRef] [PubMed]
- Galy, V.; Peucker-Ehrenbrink, B.; Eglinton, T. Global carbon export from the terrestrial biosphere controlled by erosion. Nature 2015, 521, 204–207. [Google Scholar] [CrossRef] [PubMed]
- Milly, P.C.D. A minimalist probabilistic description of root zone soil water. Water Resour. Res. 2001, 37, 457–463. [Google Scholar] [CrossRef]
- Lepistö, A.; Granlund, K.; Rankinen, K. Integrated nitrogen modeling in a boreal forestry dominated river basin: N fluxes and retention in lakes and peatlands. Water Air Soil Pollut. 2004, 4, 113–123. [Google Scholar] [CrossRef]
- Perkkiö, S.; Huttula, E.; Nenonen, M. Water Protection Plan for the Simojoki River Basin; Publication of the Water and Environment Administration—Series A; Helsinki University Press: Helsinki, Finland, 1995. [Google Scholar]
- Kortelainen, P. Content of total organic carbon in Finnish lakes and its relationship to catchment characteristics. Can. J. Fish. Aquat. Sci. 1993, 50, 1477–1483. [Google Scholar] [CrossRef]
- Diodato, N.; Støren, E.W.N.; Bellocchi, G.; Nesje, A. Modelling sediment load in a glacial meltwater stream in western Norway. J. Hydrol. 2013, 486, 343–350. [Google Scholar] [CrossRef]
- Buishand, T.A. Some methods for testing homogeneity of rainfall records. J. Hydrol. 1982, 58, 11–27. [Google Scholar] [CrossRef]
- Kokfelt, U.; Rosen, P.; Schoning, K.; Christensen, T.R.; Förster, J.; Karlsson, J.; Reuss, N.; Rundgren, M.; Caallaghan, T.V.; Jonasson, C.; et al. Ecosystem responses to increased precipitation and permafrost decay in subarctic Sweden inferred from peat and lake sediments. Glob. Chang. Biol. 2009, 15, 1652–1663. [Google Scholar] [CrossRef]
- Köhler, S.J.; Buffam, I.; Laudon, H.; Bishop, K.H. Climate’s control of intra-annual and interannual variability of total organic carbon concentration and flux in two contrasting boreal landscape. J. Geophys. Res. 2008, 113, G03012. [Google Scholar] [CrossRef]
- De Wit, H.A.; Austnes, K.; Hylen, G.; Dalsgaard, L. A carbon balance of Norway: Terrestrial and aquatic carbon fluxes. Biogeochemistry 2015, 123, 147–173. [Google Scholar] [CrossRef]
- Räike, A.; Mattson, T.; Kortelainen, P.; Thomas, D.N. Long-term trends (1975–2014) in the concentrations and export of carbon from Finnish rivers to the Baltic Sea: Organic and inorganic components compared. Aquat. Sci. 2016, 78, 505–523. [Google Scholar] [CrossRef]
- Larsen, S.; Andersen, T.; Hessen, D.O. Climate change predicted to cause severe increase of organic carbon in lakes. Glob. Chang. Biol. 2011, 17, 1186–1192. [Google Scholar] [CrossRef]
- Dwarakish, G.S.; Ganasri, B.P. Impact of land use change on hydrological systems: A review of current modeling approaches. Cogent Geosci. 2015, 1, 1115691. [Google Scholar] [CrossRef]
Figure 1.
(a) Environmental setting of study area with the Simojoki River (in blue); (b) Haparanda Meteorological station (arranged from ESRI-ArcGIS Explorer Online, http://www.esri.com/software/arcgis/explorer-online).
Figure 1.
(a) Environmental setting of study area with the Simojoki River (in blue); (b) Haparanda Meteorological station (arranged from ESRI-ArcGIS Explorer Online, http://www.esri.com/software/arcgis/explorer-online).

Figure 2.
(a) Scatterplot between modelled and actual TOC export data, with the 95% prediction intervals for new observations given in grey lines around 1:1 line in black color; (b): Studentized residual versus predicted TOC export values.
Figure 2.
(a) Scatterplot between modelled and actual TOC export data, with the 95% prediction intervals for new observations given in grey lines around 1:1 line in black color; (b): Studentized residual versus predicted TOC export values.
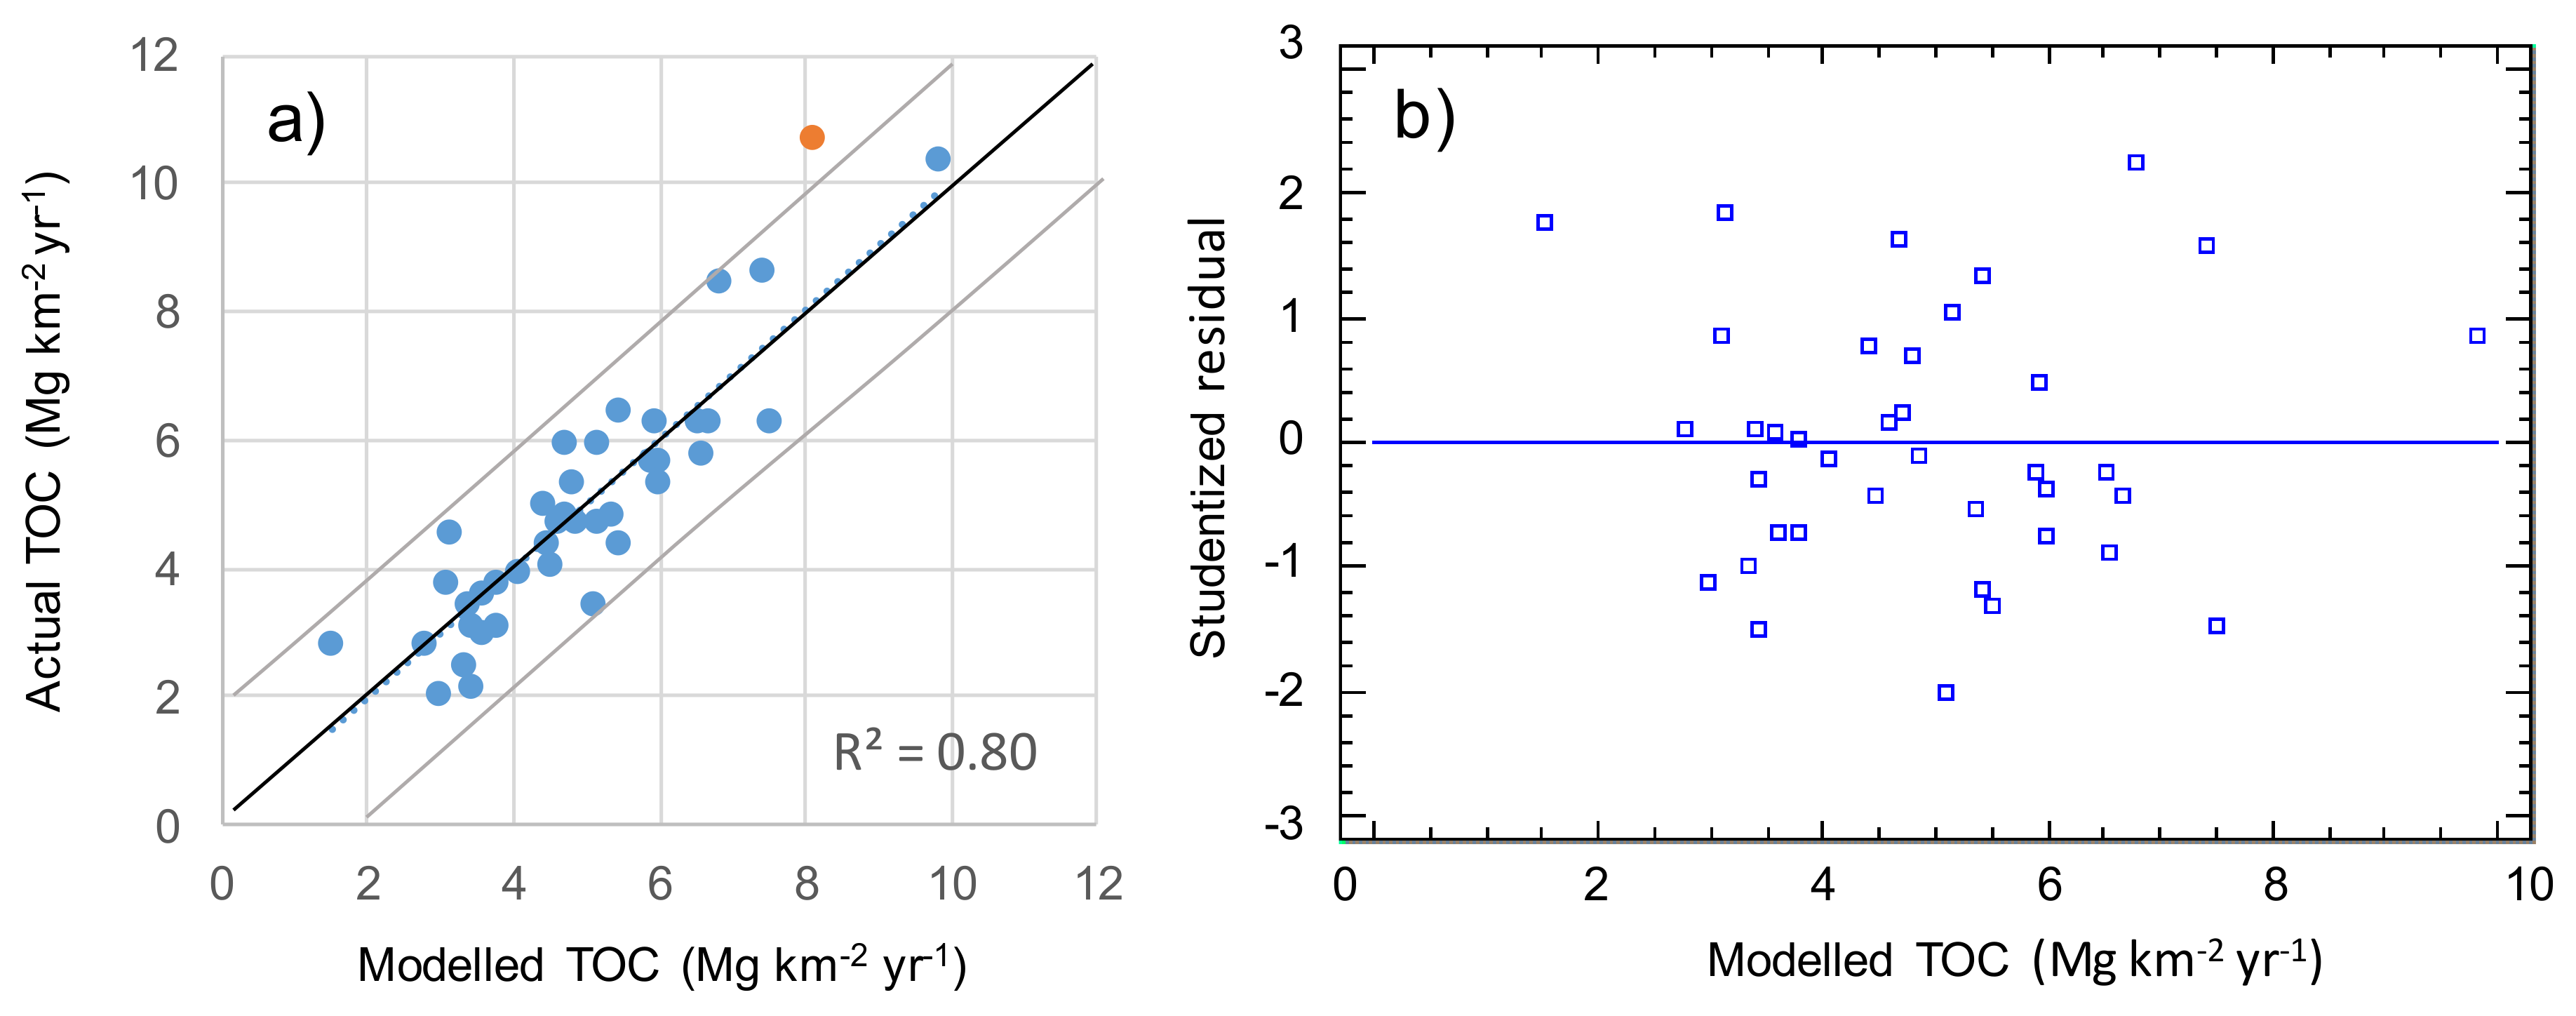
Figure 3.
Simulated TOC export by model (Equation (2)) in Mg km−2 year−1 from Simojoki basin during the period 1860–2014, with change points (arrows). The intermittent intervals with high TOC export (blue lines) and low TOC export (orange linees) were identifed by the Buishand test (blue curve). Two histogram plots are also reported for the recent period. Orange curve represents the actual TOC for the period of available data at end series.
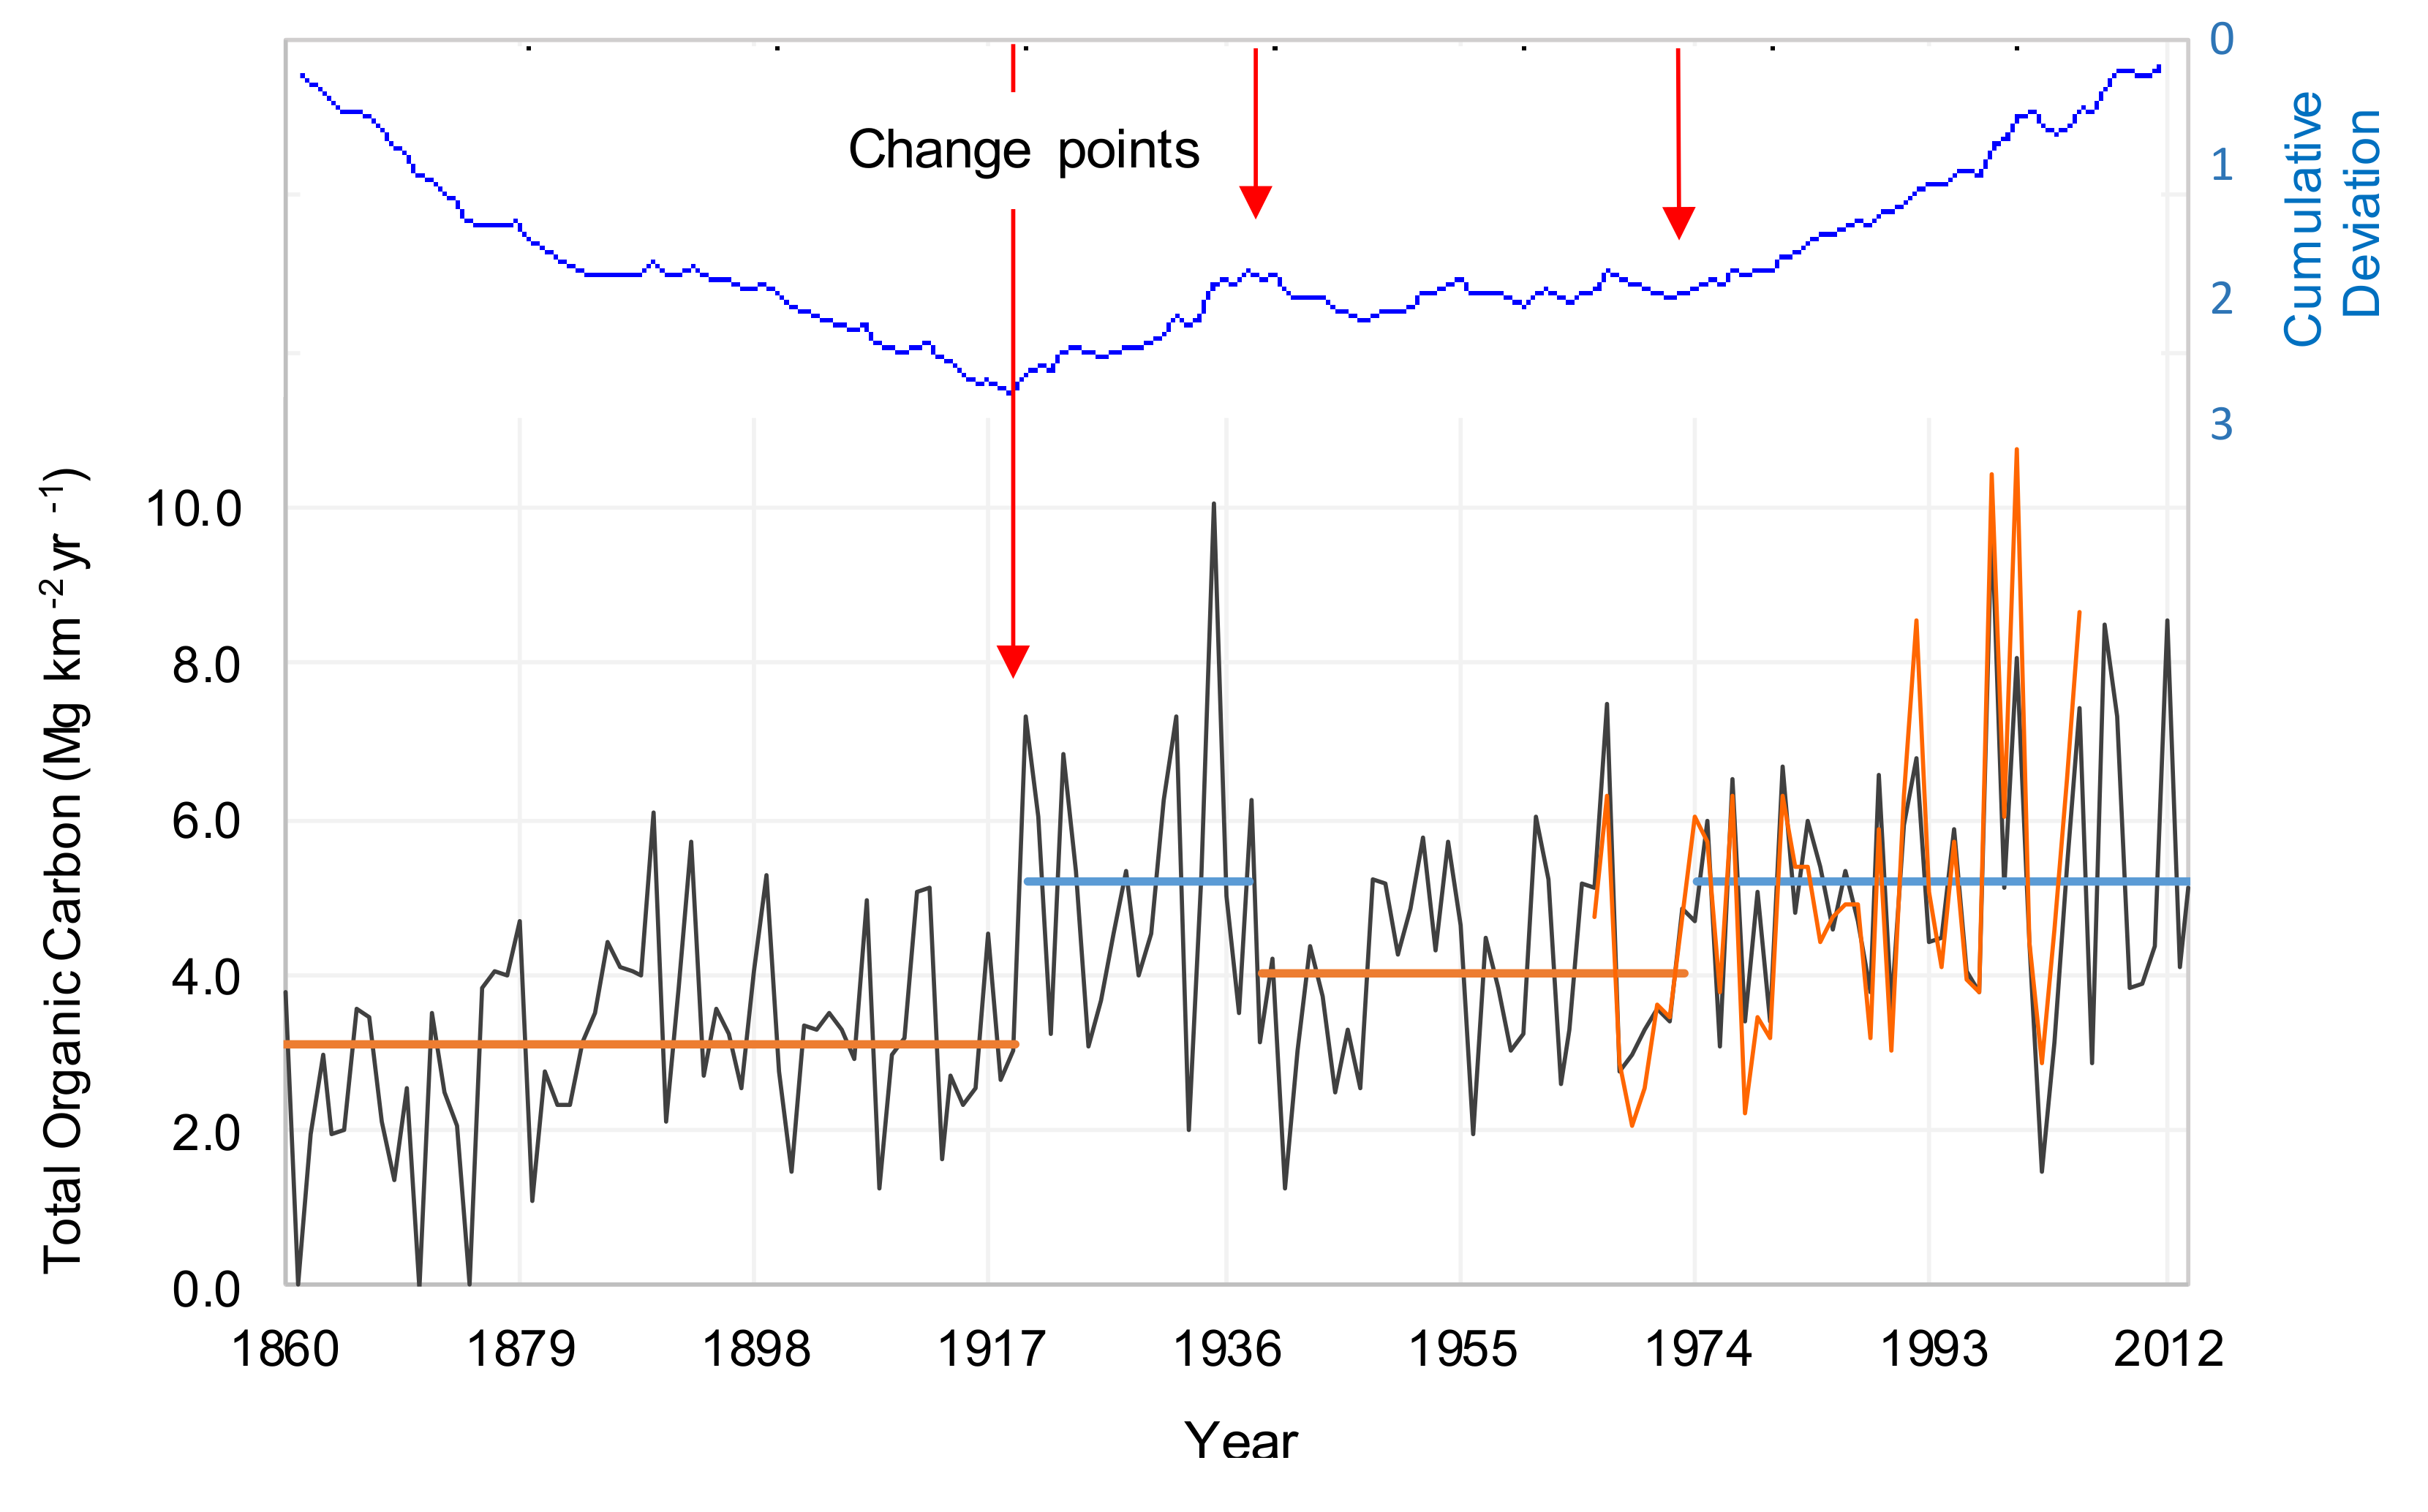
Figure 4.
Total C export for each grid-cell (2500 km2) across Finnish and northern Scandinavian areas. (a) for 1940–1973; (b) for 1974–2012; (c) relative differences 1974–2012 minus 1940–1973 (arranged from CRU-TS3.22 precipitation, via Map Calculator function within ESRI-ArcGIS, http://www.esri.com/software/arcgis).

Figure 5.
TOC export anomalies across Finnish and northern Scandinavian areas deriving from CMIP5 mean scenario runs 2021–2050 minus 1974–2012, for RCPs 4.5, 6.0 and 8.5, respectively.
Figure 5.
TOC export anomalies across Finnish and northern Scandinavian areas deriving from CMIP5 mean scenario runs 2021–2050 minus 1974–2012, for RCPs 4.5, 6.0 and 8.5, respectively.

© 2018 by the authors. Licensee MDPI, Basel, Switzerland. This article is an open access article distributed under the terms and conditions of the Creative Commons Attribution (CC BY) license (http://creativecommons.org/licenses/by/4.0/).
Share and Cite
MDPI and ACS Style
Diodato, N.; Esposito, L.; Bellocchi, G. A First Regional-Scale Estimate of Climate-Driven Terrestrial Carbon Export in Boreal Catchments. Climate 2018, 6, 22. https://doi.org/10.3390/cli6020022
AMA Style
Diodato N, Esposito L, Bellocchi G. A First Regional-Scale Estimate of Climate-Driven Terrestrial Carbon Export in Boreal Catchments. Climate. 2018; 6(2):22. https://doi.org/10.3390/cli6020022
Chicago/Turabian StyleDiodato, Nazzareno, Libera Esposito, and Gianni Bellocchi. 2018. "A First Regional-Scale Estimate of Climate-Driven Terrestrial Carbon Export in Boreal Catchments" Climate 6, no. 2: 22. https://doi.org/10.3390/cli6020022
Note that from the first issue of 2016, this journal uses article numbers instead of page numbers. See further details here.