
Estimating the Cost of Wildlife Strikes in Australian Aviation Using Random Forest Modeling


1
School of Engineering and Technology, Central Queensland University, 13 G-14 University Drive, Bundaberg, QLD 4670, Australia
2
Centre for Data Analytics, Bond University, 14 University Drive, Robina, QLD 4226, Australia
*
Author to whom correspondence should be addressed.
Aerospace 2023, 10(7), 648; https://doi.org/10.3390/aerospace10070648
Submission received: 21 June 2023
/
Revised: 10 July 2023
/
Accepted: 14 July 2023
/
Published: 19 July 2023
(This article belongs to the Collection Air Transportation—Operations and Management)
Abstract
:Wildlife strikes in aviation represent a serious economic concern; however, in some jurisdictions, the costs associated with this phenomenon are not collected or shared. This hampers the industry’s ability to quantify the risk and assess the potential benefit from investment in effective wildlife hazard management activities. This research project has applied machine learning to the problem by training a random forest algorithm on wildlife strike cost data collected in the United States and predicting the costs associated with wildlife strikes in Australia. This method estimated a mean annual figure of AUD 7.9 million in repair costs and AUD 4.8 million in other costs from 2008 to 2017. It also provided year-on-year estimates showing variability through the reporting period that was not correlated with strike report numbers. This research provides a baseline figure for the Australian aviation industry to assess and review current and future wildlife hazard management practices. It also provides a technique for other countries, airlines, or airports to estimate the cost of wildlife strikes within their jurisdictions or operational environments.
1. Introduction
While collisions between aircraft and wildlife, often referred to as wildlife strikes, are recognized as significant economic and safety issues for the aviation industry [1,2], the complex nature of costs associated with the management of wildlife strikes poses inherent challenges. These challenges are exacerbated when missing data hamper cost–benefit analyses that support effective wildlife hazard management practices. Allan [3] notes that wildlife-strike-prevention costs, which the airport operator typically bears, are often expensive; however, they are incurred to save on costs suffered by the aircraft operator, who often considers these data commercially sensitive and manages them with particular sensitivity [3,4]. International guidance material recommends the collection of cost impacts in wildlife strike reporting [5], and some jurisdictions collect these data on a per-strike basis. However, in Australia, where wildlife strike reporting is mandatory [6], these data are not collected, creating a gap in the aviation industry’s ability to quantify the wildlife strike problem and assess the effectiveness of risk management strategies.
In contrast, the United States Federal Aviation Administration (FAA), in collaboration with the United States Department of Agriculture Wildlife Services (USDA/WS), has established a voluntary wildlife strike reporting system called the National Wildlife Strike Database (NWSD) [7]. Reports lodged by aircraft operators may include disclosure of repair and other costs in two fields of the report. Consequential strike costs are often divided into direct costs, such as repair costs and indirect costs, such as flight cancellation, passenger re-booking, and aircraft unavailability [8]. As of May 2022, repair costs were included in approximately 26% (N = 4910) of strike reports indicating aircraft damage. Other costs were reported in approximately 32% (N = 4453) of strike reports with a negative effect on flight recorded [7].
In response to the limited cost data in the NWSD, Altringer et al. [9] showed that machine learning techniques could be employed to impute missing data and provide “a more accurate lower bound estimate” (p. 14) of wildlife strike-related costs. The random forest modeling technique, in particular, was more effective than traditional estimation techniques and better at accommodating rare high-impact events. Such techniques utilize a broad range of explanatory features to calculate costs for reports where this information is missing. The objective of this research project was to apply machine learning algorithms, tuned and trained on NWSD data, to the Australian wildlife strike database to derive annual cost estimates for the years 2008–2017.
Aggregating data across jurisdictions poses specific challenges. As Metz et al. [8] outlined, each state approaches the International Civil Aviation Organization’s [10] expectation of collecting wildlife strike reports differently. Despite being voluntary, the relative size of the United States’ database is considerable and commensurate with its level of aviation activity. At the time of this project, the NWSD contained 262,293 strike reports, with an average annual report total of approximately 15,000 in the five years leading up to and including 2021. The NWSD contained 101 data fields and was continuously updated and made available online. In comparison, the Australian wildlife strike database was shared periodically, typically every two to three years, with the latest version covering 2008 to 2017 [11]. The total number of reports in this database was 17,022, with annual report numbers averaging approximately 1700 from 2013 to 2017. The Australian Transport Safety Bureau’s (ATSB) database contained 38 data fields. These differences required careful planning of the techniques used in this study and consideration of the results.
The following sections outline how we developed and validated a machine learning algorithm using a constrained NWSD feature set before predicting out-of-sample cost estimates using the Australia wildlife strike database. Initially, we validated the performance of the constrained feature set, which was required to address the differences in data fields between the two databases, against the performance of the full feature set established by Altringer et al. [9]. Then, with satisfactory results, we trained the model on the full NWSD data set and derived estimates for the wildlife strikes within the Australian database, covering the period 2008 to 2017. The mean annual costs estimated by the model were AUD 7.9 million in repair costs and AUD 4.8 million in other costs. Our analysis reveals that costs and reporting rates are unrelated, indicating a complex relationship between the constrained feature set and the derived costs. In similar terms to Altringer et al. [9], we discuss the impact of underreporting and costs not included in this assessment and conclude that these results similarly represent the lower bound of wildlife strike costs within Australia. Our aim is that these results will support ongoing efforts to reduce the risk of wildlife strikes by providing a basis for cost–benefit analyses on existing and future wildlife hazard management activities.
Perhaps the most quoted wildlife strike cost estimate is the USD 1.2 billion annual global cost established by Allan [3]. Over 20 years later, this figure, often without inflationary consideration, is quoted in support of a variety of research topics such as operational bird strike prevention [8], risk assessment modeling [12], robotic harassment [13], species-specific hazard analysis [14], and strike risk prediction [15]. Allan’s [3] seminal work was based on the wildlife strike costs, in terms of repair and delay, confidentially recorded by a single airline over a year, averaged over that airline’s annual movements, and applied to worldwide traffic numbers. He acknowledged the conservative nature of this estimate by noting the lack of any significantly damaging strikes in the year in question, the exclusion of further consequential costs such as increased insurance premiums, and the loss of customer goodwill/repeat business. He also outlined the estimate’s sensitivity to variations and settled on the range of USD 1.0 billion to 1.5 billion per year as the best estimate. Allan and Orosz [16] revised this estimate with an additional year’s data from the same airline. Following this re-assessment, they estimated that the annual cost to aviation was slightly higher at USD 1.28 billion but that the range was narrowed to between USD 1.21 billion and 1.36 billion. The same conclusions regarding conservativeness and sensitivity were drawn.
Sodhi’s [17] discussion on bird and aircraft conflicts included details of overall and specific costs associated with wildlife strikes as well as the relationship between these costs and the cost of wildlife hazard management. He reported that the annual repair costs associated with strikes in the United States between 1990 and 1998 were USD 400 million. This figure is likely derived from Cleary et al. [18], whose annual report on wildlife strikes reported to the NWSD included details of the reported costs contained in the database and an estimate of annual losses based on the assumption that the reported costs represented between 20% and 100% of all wildlife strikes. The estimate ranged from USD 77 million to 386 million. A similar approach was taken in the 2006 edition of this report [19], which revised the estimated range to between USD 111 million and 557 million. The maximum was again based on the assumption that reported strikes represent only 20% of all wildlife strikes but with research having been undertaken to support this reporting rate [20,21].
In recent editions of this report (such as [2]), cost estimations have been derived by projecting losses using what Altringer et al. refer to as the “mean cost assignment” [9] (p. 2) approach. This technique applies the reported cost means to the number of strike reports indicating damage, a negative effect on flight, aircraft downtime, repair costs, and other costs. Dolbeer et al. [2] calculated an annual cost within the United States for 2019 of USD 205 million and noted that this amount underestimated the actual total. A 20% reporting rate assumption is no longer the basis for calculation, as research shows an improvement in the reporting ratio of up to 93% for damaging strikes at Part 139 airports between 2009 and 2013 [22]. The resulting assumption is that these figures represent the lower limit of actual costs associated with wildlife strikes.
Altringer et al. [9] critiqued the mean cost assignment methodology, noting two disadvantages. The first was the approach’s inability to incorporate multiple aircraft and strike event features in the calculation. For example, in calculating the mean and assigning costs, the process does not consider features such as aircraft type, size, engine type, aircraft component damage, and bird size. The second disadvantage described was the positive skew in cost data. By way of example, the high-profile wildlife strike involving US Airways Flight 1549 (the “Miracle on the Hudson”) was reported as costing USD 42 million, and whether it was included in the 2009 cost calculation or not impacts the annual results by USD 229 million. This sensitivity to rare high-impact events is similar to the issue raised with the Allan [3] technique.
In response to these concerns, Altringer et al. [9] employed machine learning to derive a lower bound estimate that is more accurate and resilient against extreme outcome events. Using holdout (80/20 train–test split) and cross-validation techniques to tune and test two machine learning approaches, they compared the results of their random forest model and artificial neural network to a linear regression model. Repair cost models were trained on the available repair cost data (n = 4103) and other cost models on similarly available other cost data (n = 4688). These models were then tested on the holdout test set (repair n = 1026, other n = 1172), with the random forest model found to outperform both the linear regression and the artificial neural network. Finally, this model was retrained on the full cost data set to predict the missing costs for all such reports in the NWSD. The resulting estimate was a new annual average for lower bound costs in the United States of USD 54.3 million from 1990 to 2018. The authors note that these results are still subject to underreporting and are an underestimation of further consequential costs, as outlined above, with no account of human morbidity or mortality costs.
Research into the reporting of wildlife strike costs within Australia is minimal. Qantas, in concert with rival airline, Virgin Blue, presented trend data on costs but withheld the actual cost figures [23]. The following year, Taylor [24] presented more details on Qantas’ cost consideration figures, advising that while safety was the airline’s primary concern, the financial impact of wildlife strikes was high and that costs were being made available within the airline. These costs included traditional repair and other costs as well as consequential costs and injuries. He provided an overview of estimated costs for 2005 and 2006 and projected costs for 2007. The conservative estimate for 2006 was AUD 2.36 million, and the projected estimate for 2007 was AUD 2.57 million. He also reported an average cost of approximately AUD 7000 per bird strike. These figures did not include all parts of the Qantas group but were considered consistent with different group segments. As noted above, the Australian wildlife strike database does not include cost data, precluding analysts from applying the mean cost assignment technique of Dolbeer et al. [2]. Moreover, while the method proposed by Allan [3] was suggested as a technique that could be applied within a specific jurisdiction or to individual airlines and airports, this does not appear to have been documented within an Australian context.
However, the motivation to gather, derive, or otherwise calculate wildlife strike costs remains. From Allan’s desire “to gather the data necessary to evaluate the true cost-effectiveness of increasing bird control provisions” [3] (p. 152) through to Altringer et al.’s goal of assisting in “the efficient allocation of wildlife management resources” [9] (p. 16), the need for accurate cost estimates is clear. Furthermore, the methodology outlined by Altringer et al. [9] provides a new avenue for calculating these costs for the Australian industry using its strike data.
2. Materials and Methods
This research set out to estimate the cost of wildlife strikes in Australia by tuning and training a supervised machine-learning algorithm and applying it to new data. This and the following sections provide some background to the random forest modeling technique, model tuning, and refinement, as well as a description of the process used to predict wildlife strike costs using the Australian wildlife strike database. As mentioned above, this project leverages the work of Altringer et al. [9], who identified their random forest models as performing the best. They outlined a model training and testing workflow based on Raschka [25], which was tailored to this project’s objective.
Supervised machine learning involves the development of a function (ƒ) that will produce a desired output (or target, y) from a set of given inputs (or features, x) [26]. In real-world problems, the discovery of the most accurate function is complicated by complex data structures, non-linear relationships, and hidden associations [27], as well as the volume of data and computational resources required to derive and refine such models [26]. Machine learning addresses these challenges by automating computational tasks and feedback loops to derive optimal functions based on minimizing loss (L). Random forest modeling is a technique based on decision trees. Many such trees are developed using randomization, and each tree votes with the most popular outcome becoming the predicted target [28]. A decision tree is a multi-stage or layered approach whereby selected features become nodes on which branches are split on the feature’s values. Subsequent nodes and branches propagate until a terminal node or leaf is reached. The leaf will provide either a classification or mean value for the target variable. The random forest approach aggregates a large number of trees created through randomization with hyperparameters that determine the number of trees, number of features, tree depth, splitting, and termination as defined by the user through experimentation.
2.1. Model Tuning, Training, and Development
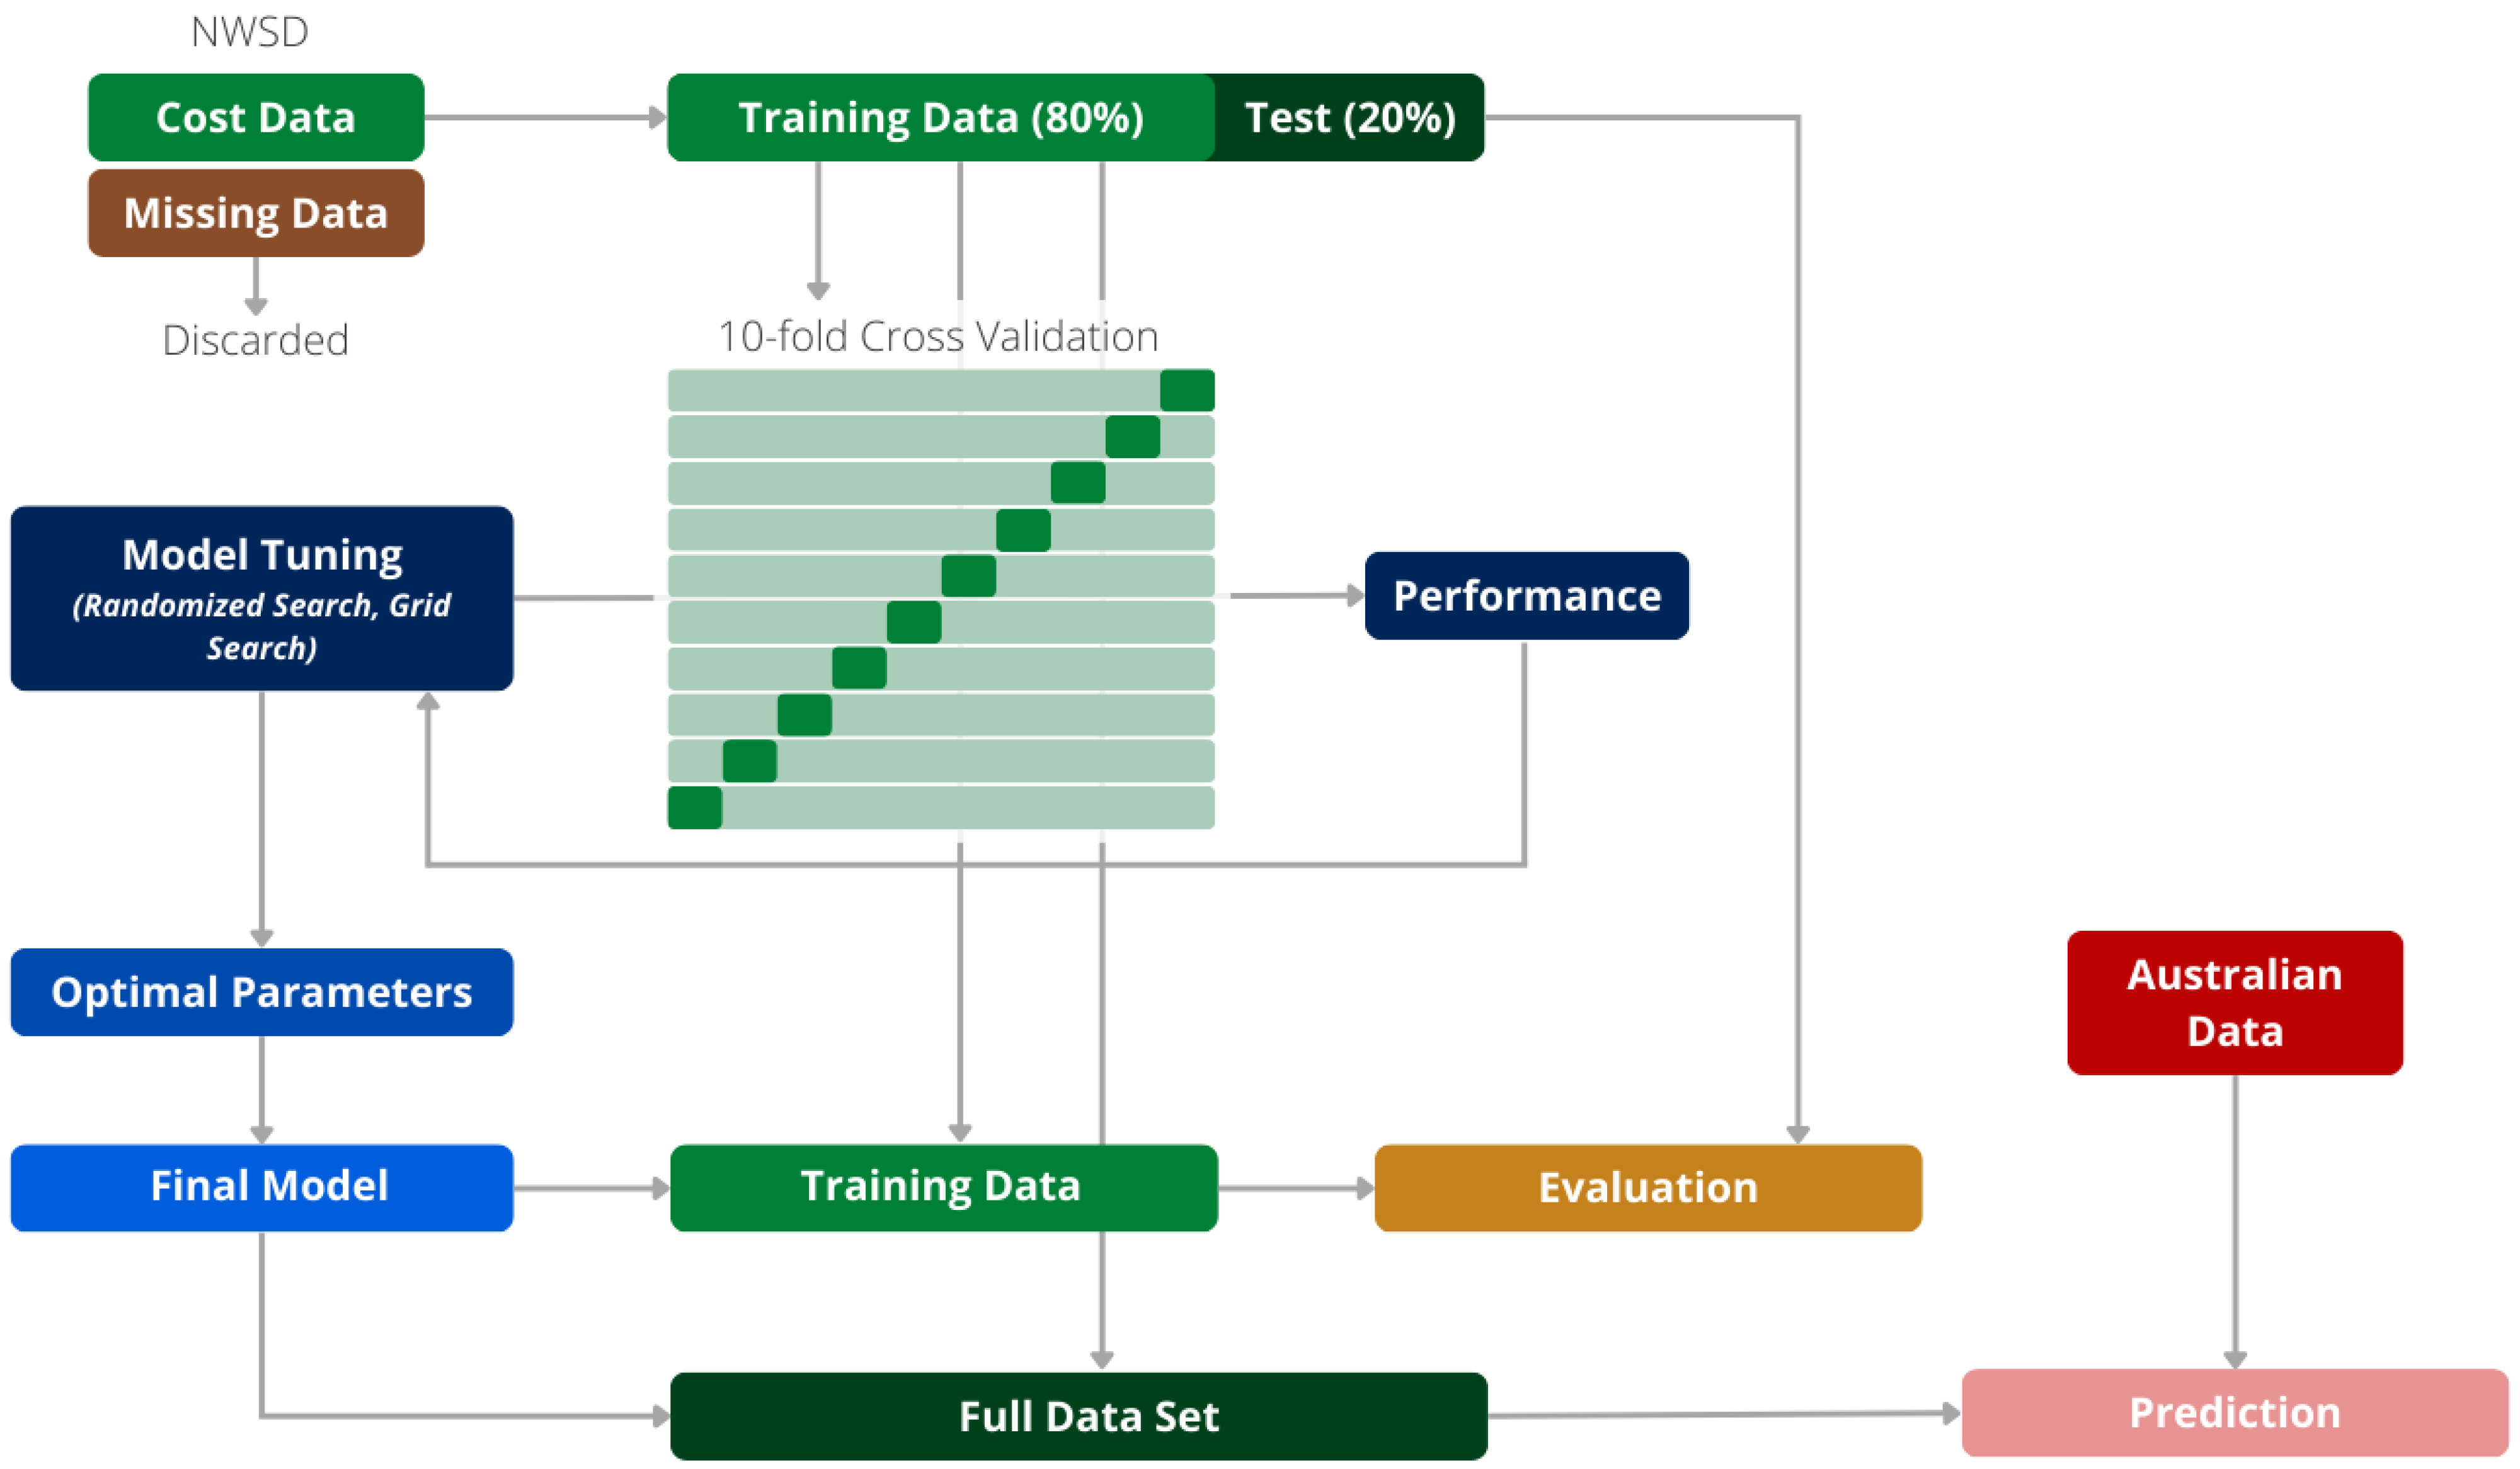
We used Python with the Scikit-learn implementation of random forest through the random forest regressor method [29]. We followed a modified modeling workflow (Figure 1) similar to that established by Altringer et al. [9]. First, records with missing cost data (repair and other costs) were discarded with an evaluation of each model’s performance based on the holdout method [25]. Next, an 80/20 train–test split was carried out on the remaining data before model tuning. We completed initial hyperparameter selection through a randomized grid search across a broad range of parameters, including the number of trees (n_estimators), number of features (max_features), maximum tree depth (max_depth), minimum number of samples required to split a node (min_samples_split), and minimum samples required in a leaf (min_samples_leaf). Based on these results, we conducted a refined grid search to confirm optimal hyperparameters. Both processes employed 10-fold cross-validation to address potential biases in data selection. Finally, we evaluated model performance using the test data set with 100 random samples (65% of the data set without replacement) of the model’s prediction errors used to calculate summary statistics in terms of mean squared error, mean absolute error, and R-squared.
2.2. Model Development, Refinement, and Prediction
As noted above and in more detail below in Section 4, the Australian wildlife strike database contained fewer explanatory features than the NWSD. To ensure that the predictive power of the models based on a constrained feature set was comparable to that achieved by Altringer et al. [9], we tuned, trained, and tested the random forest regressor on a full feature set and a constrained feature set to compare the results. Models based on repair and other costs were developed and refined independently. We assessed the accuracy of these models to evaluate whether they would support predictions of costs based on the Australian data feature set. The final models were retrained on the full cost data sets (repair and other costs with “destroyed” aircraft included) and used to predict the “missing” costs for the Australian wildlife strike data.
2.3. Economic Conversion
The costs predicted by the final models are in 2021 US dollars. We converted these figures to 2021 Australian dollars by applying a “repair cost” conversion factor and the average 2021 foreign exchange rate.
Using a data set of 2017 to 2022 global fleet and maintenance repair and overhaul (MRO) costs [30], we calculated that the mean MRO cost difference in the Asia Pacific region was 30% higher than that of North America. These costs were broken down according to major aircraft components, with conversion factors ranging from 0.88 for component maintenance to 1.52 for engine repair. Given the breakdown of aircraft component damage resulting from wildlife strikes [2], we weighted each conversion ratio according to the proportion of component damage and calculated an overall cost conversion factor of 1.33 for damaging strikes. For “other costs”, we used a one-to-one cost conversion ratio as insufficient data were available on the factors used to calculate these figures and their relative proportions.
We applied a foreign exchange conversion rate of 1.33 using the mean 2021 US dollar to the Australian dollar rate according to the Reserve Bank of Australia (RBA) [31].
2.4. Data
2.4.1. United States Data—Cost Data Summary Statistics and Variations
The NWSD download contained 262,693 wildlife strike reports with 101 data fields and differed from the Altringer et al. [9] data set in the following ways. The most obvious was the additional reports submitted between the Altringer et al. [9] research and this project. Approximately 25,000 additional reports were contained in this NWSD download, but this did not represent the only change in the data. We also considered ongoing and periodic curation of the NWSD when comparing results between different projects. Such curation includes removing duplicates and validating reports, and would impact each database’s summary statistics. Therefore, we reviewed these statistics for cost-related fields and found evidence of significant curation in the reductions of cost report numbers and overall damaging strike reports (Table 1). Altringer et al. [9] reported that 10.5% of strikes were reported as damaging, whereas our data showed 7.2% as damaging.
Regarding costs, the NWSD contained four fields with repair and other costs reported in raw and inflation-adjusted (2021) values. We used inflation-adjusted values and noted the same wide variation and positive skew identified by Altringer et al. [9]. For this reason, we, too, applied a log transformation to these fields for use in model training, testing, and prediction before transforming back to dollar values for the presentation of results. The increase in mean and median figures for repair costs (mean = AUD 171,491, median = AUD 15,304) generally align with inflation [32]. However, the increases in other cost values (mean = AUD 24,839, median = AUD 716) suggested that the variation was impacted by factors other than inflation and could result from a general upward trend in reported other costs or curation.
2.4.2. Australian Data—Full and Constrained Feature Sets
The latest edition of the Australian wildlife strike database was published in two separate data tables, specifically bird strikes and animal strikes [11]. The bird strike data table included flying bird and bat species, while the animal database contained terrestrial animals (e.g., kangaroos, rabbits, and goannas) and flightless birds (i.e., emu). The bird strike data table contained 38 data fields and the animal strike data table contained 34 fields, all similarly labeled or comparable to those in the bird strike data table. The missing fields were engine ingestion, number of birds struck, number of birds seen, and runway number. We concatenated the data tables, inserting null values into the animal strike data table for the missing fields. The total number of strike reports in the combined database was 17,022.
Not all explanatory features used by Altringer et al. [9] were present in the Australian database (Table 2). This difference required evaluating the random forest model on a constrained feature set. Where variables existed in both databases, these features were common to the full and constrained feature sets. For ease in coding and to address minor labeling inconsistencies, data were relabeled in line with the coding contained in the Manual on the ICAO Bird Strike Information System (IBIS) [5]. Australian data categorization differed slightly from the NWSD and IBIS approach for number seen and number struck variables. Numbers seen/struck labeled “>10” were coded to the category labeled “11–100”. Similarly, the Australian data’s animal size label “very large” was coded as “large” to align with the NWSD and IBIS. Both the NWSD and Australian data for engine ingestion were also re-coded. For the NWSD, a change in the data structure implemented in March 2021 was reversed for all subsequent data. For the Australian data, any unique labeling was re-coded to binary as appropriate. Component struck data also required restructuring due to the lack of distinction in the Australian data between nose and radome. As these data were already structured as dummy variables, this restructuring involved the combination of these fields into a new data field. The pilot warned, effect on flight, component damaged, cloud cover, and time of day variables, which were not found in the Australian data, were not included in the constrained feature set.
As the Python implementation of random forest does not fit on categorical variables, these variables must be converted to numerical values. We used one hot encoding to create new fields for each categorical label, with each value assigned a binary value according to this label. For example, data in the animal size variable were labeled either “small”, “medium”, “large”, or “missing”. Encoding these data created four new variables with labels such as “animal size small” and “animal size medium”. A strike report with the animal size labeled “small” would be coded with 1 in the “animal size small” variable and 0 in the others. Following this process, the number of features in the full feature set was 94. In the constrained feature set, it was 55 following the removal of the turbojet engine type and the birds seen/struck greater than 100 features, for which no data existed in the Australian database.
3. Results
3.1. Model Evaluation—Full and Constrained Feature Sets
Following randomized and refined grid searches, we established two sets of optimal random forest hyperparameters for the full feature set. We evaluated these models’ performance against their test data sets using mean squared error (MSE), mean absolute error (MAE), and R-squared. This process was repeated using the constrained feature set with the same metrics calculated. For repair costs, the models trained on both the full and constrained feature sets show slightly better performance compared to the Altringer et al. [9] model in terms of mean square error and comparable performance in mean absolute error but poorer, albeit marginal, performance on R-squared. For other costs, however, our models performed markedly poorer than the equivalent Altringer et al. [9] model but, overall, similar to the repair cost models. The differences between full and constrained feature set model performances were found to be significant, using a t-test, but within 3% (Table 3).
3.2. Australian Wildlife Strike Cost Estimates
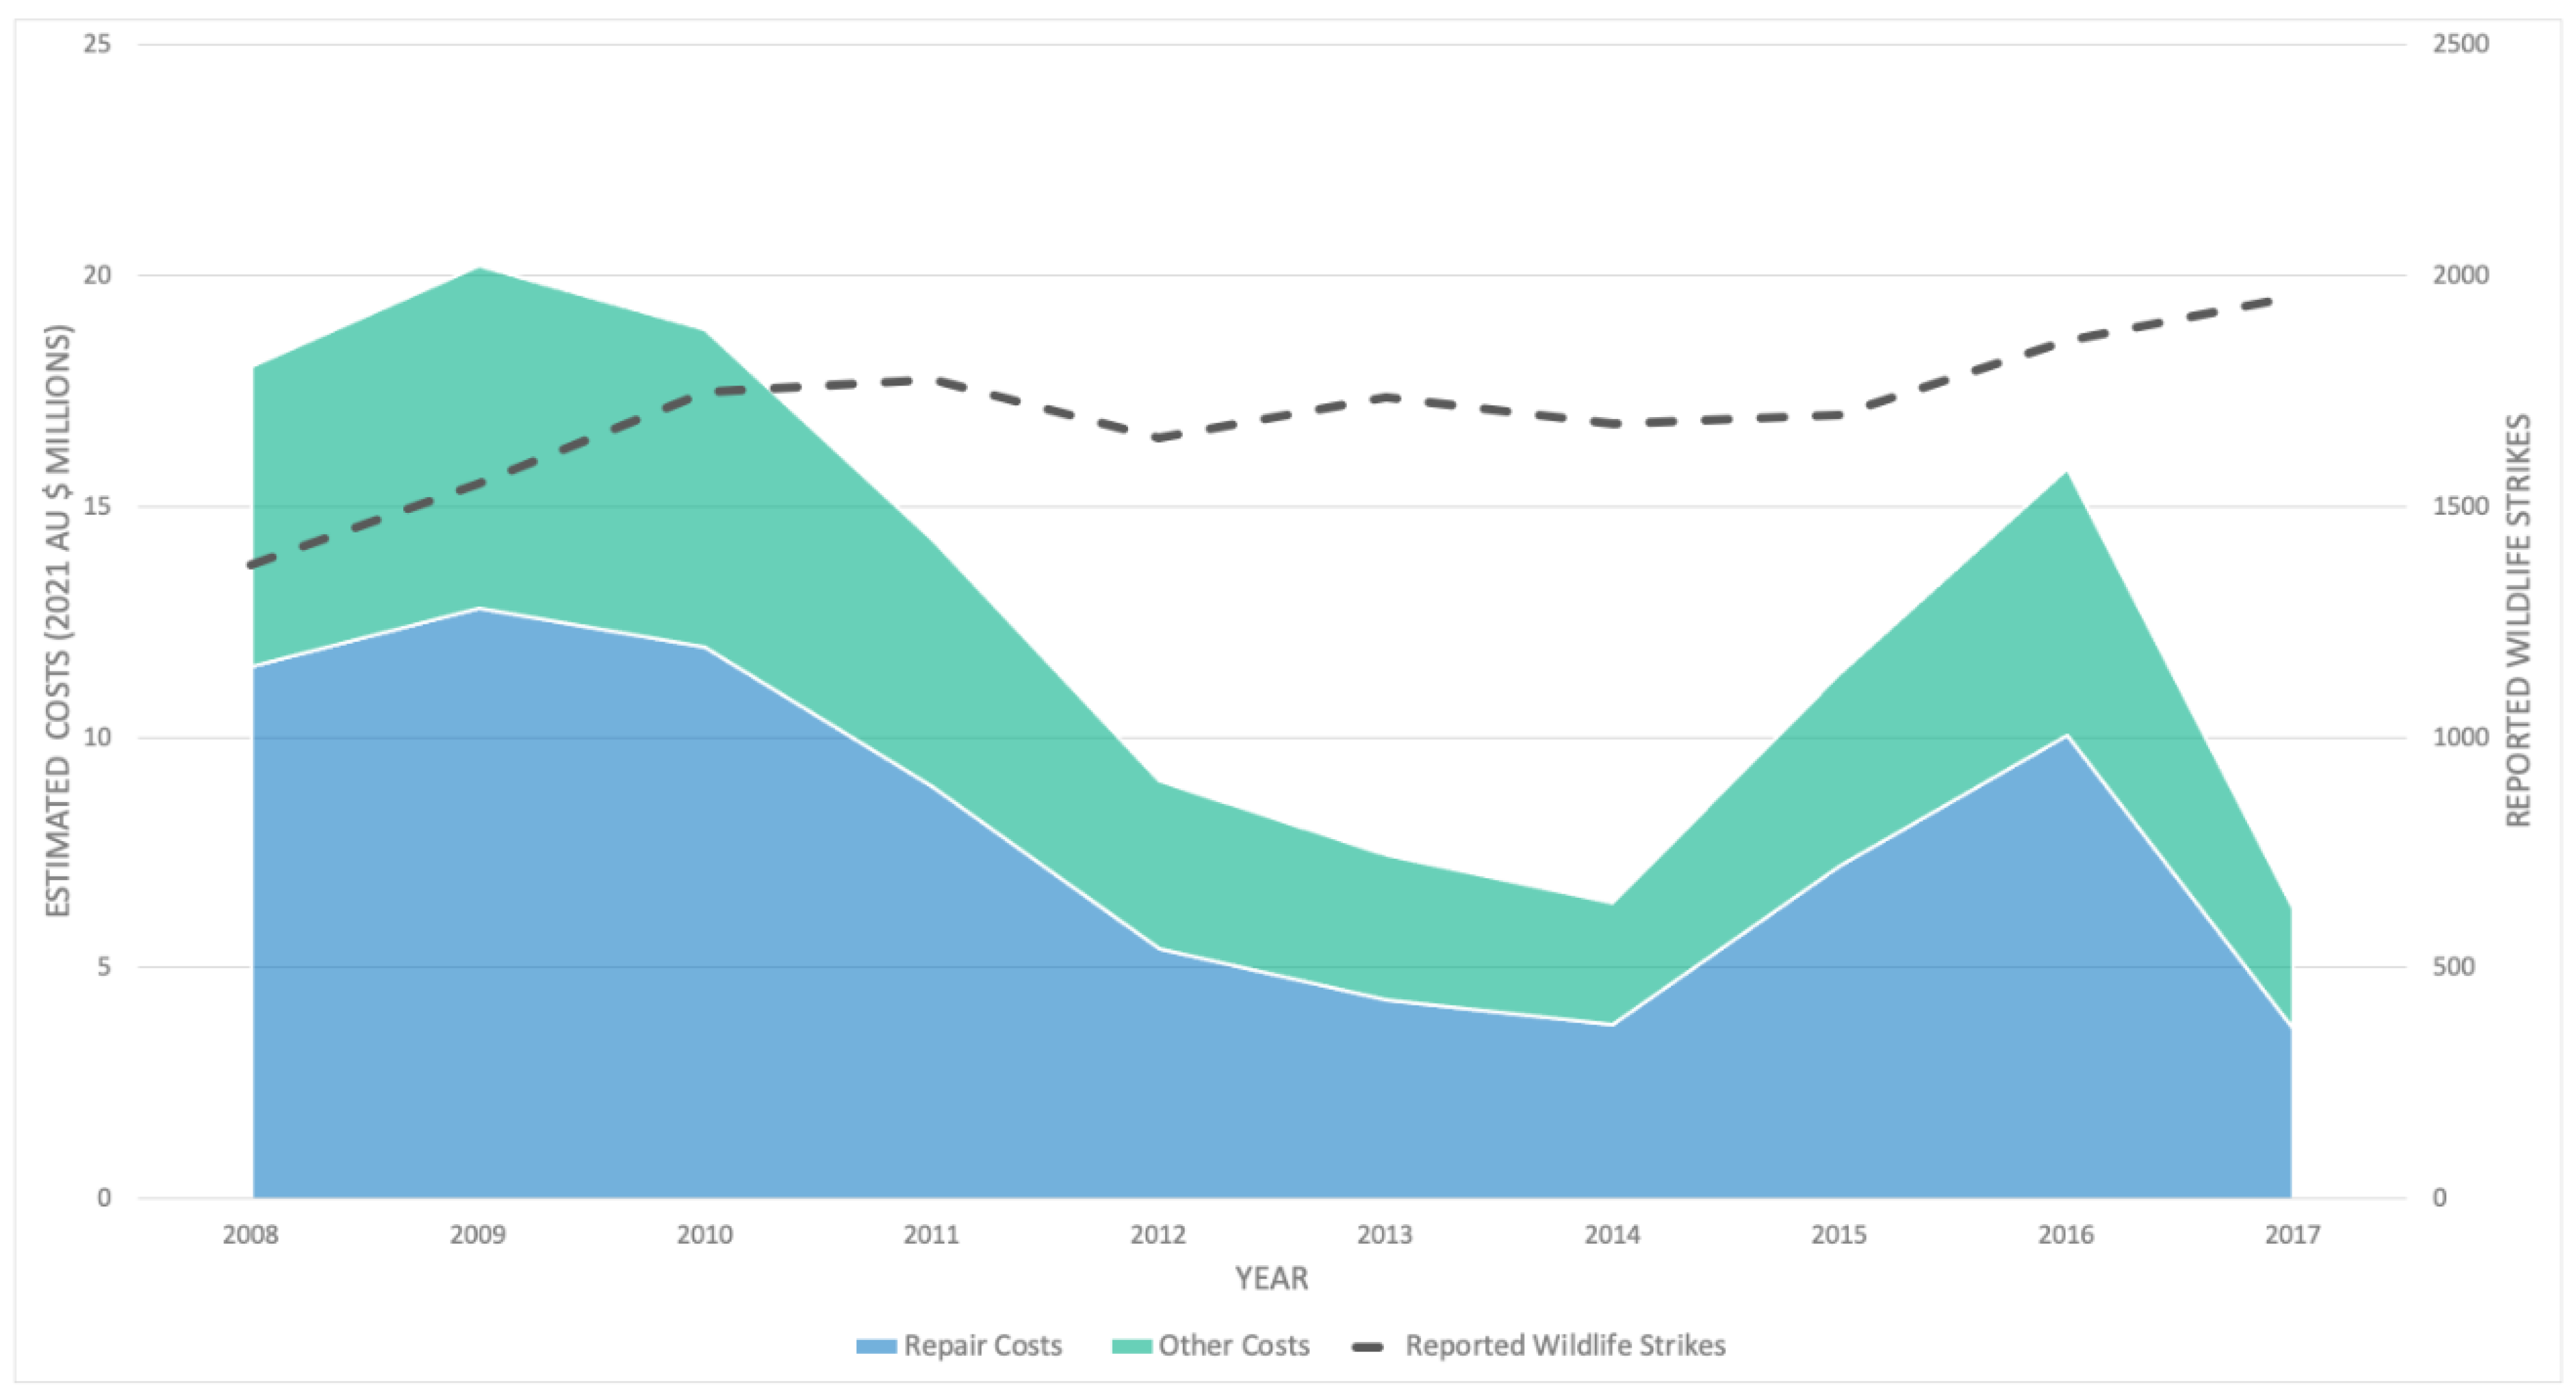
Using the optimal hyperparameters established above, we retrained each random forest model on the full NWSD data set of constrained features and then predicted cost values on the Australian data set. We applied the cost conversion factors to each estimated cost and calculated annual totals (Figure 2). For 2008–2017, the mean repair cost estimate was AUD 7.9 million per year, and the mean other cost estimate was AUD 4.8 million per year. The estimated overall cost for the same period ranged from AUD 6.29 million in 2017 to 20.21 million in 2009. These figures are expressed in 2021 Australian dollars. There appears to be a strong relationship between repair and other costs, with annual averages tracking similar trends. However, we found a weaker relationship between these costs on a report-by-report basis. Neither annual totals show a relationship with the total number of reported wildlife strikes (Figure 2).
4. Discussion
4.1. Model Performance
The first step of the model development, training, and testing process was to confirm that our implementation of the random forest modeling technique at least matched the performance achieved by Altringer et al. [9]. Overall, the repair cost model performance was considered comparable and acceptable. However, our implementation of the other cost model performed noticeably worse, requiring further investigation (Table 3). Therefore, we closely inspected the other cost data set that Altringer et al. [9] used (see [33]). This earlier data had approximately 1400 more records (Table 1). Our closer inspection showed that over 2200 records had been removed from the NWSD since Altringer et al. [9] downloaded their data. Of these records, 1907 (86%) had reported a cost of AUD 0. All AUD 0 reported other cost records were removed from the NWSD, with six new reports added in 2021. We surmise that the random forest model generally performs better when dealing with zero-inflated data. We confirmed this by testing our implementation using the Altringer et al. [9] random forest model and their original data. The results were comparable, indicating that the changes made to the data between this earlier retrieval and our retrieval have adversely impacted the modeling technique’s ability to predict out-of-sample values.
As such, the results for the full feature set for repair and other costs were considered satisfactory for developing random forest models based on the constrained feature set. As expected, there was a reduction in predictive performance when the constrained feature set was used. However, this reduction was minimal, with the lowest impact being mean absolute error for the repair cost model at 0.08% and the maximum being 2.84% for the mean squared error for the other cost model. Overall, the performance of these models using the constrained feature set was considered acceptable, and estimation of wildlife strike costs using the Australian database was undertaken.
4.2. Cost Estimates
Unlike the estimates made by Altringer et al. [9], these results cannot be compared to previous estimations or incomplete data. Instead, they provide a new foundation to build upon and offer some new insights into the impact of wildlife strikes on aviation in Australia. In the first instance, these results support the contention that wildlife strike numbers or rates should not be the focus of wildlife strike mitigation efforts and that a risk-based approach is preferred [34]. The reductions in costs from 2009 to 2014, counter to the generally rising wildlife strike numbers, and the contrasting spike in costs through 2015–2016 should focus effort on those periods to identify what was working versus what changed. The reasons behind these trends are worthy of further exploration with potential causes coming from ecological factors such as increased presence of larger birds, such as predators, or operational factors such as new aircraft types or increased post-strike inspection requirements. Despite these unanswered questions, the estimated cost values achieved the aim of the study by providing a basis for future cost–benefit analyses at a national, airport, or airline level.
As with previous cost estimation studies and as made quite explicit by Altringer et al. [9], these estimates are conservative and may represent the lower bound of actual costs incurred due to wildlife strikes. These figures did not incorporate consequential costs suffered by the airline and its passengers, such as network delays, rebooking, and accommodation costs, nor do they include morbidity and mortality costs. Luckily, the Australian data did not include any fatalities, although 12 wildlife strikes did result in injuries, with one reported as serious. The potential negative impacts of report quality and accuracy on the estimates produced by the model also remain present. Responsible persons, the term established by Australia’s occurrence reporting regulations [6], may submit a wildlife strike report before the extent of the impact is known, or they may not be aware of certain aspects of the strike event. For example, the level of damage categories appeared prominent in the feature importance breakdown, yet this field was reported as “unknown” or left blank in 20% of reports. Similarly, component damaged categories are important features in the predictive model, but the Australian database only allows one component to be reported. The reason behind this is unknown and worthy of review by the responsible authority.
Much like the sensitivity issue around wildlife strike cost data that precipitated this research, the availability of maintenance, repair, and overhaul cost data unavoidably impacts the research results. Extending the application of this methodology beyond the jurisdiction in which the training data are based necessitates economic conversion. Examples of costs that differ between jurisdictions include but are not limited to the fabrication, transport, and storage of aircraft parts and the costs of skilled labor. Without consideration of the economic factors within the target jurisdiction, the predicted costs will not be relevant to its environment. This could result in either an under or overestimation depending on the relative economic factors existent within the target jurisdiction. The method applied in this case represented the best approach available to the authors. Data on other consequential costs are even more challenging to obtain, with definitions of what can be included and what is included in any specific report providing the greatest challenge. In this case, no reasonable economic conversion factor could be applied. In both of these cases, further research would improve the quality of these results, but within the objective of this research, that impact was not expected to be significant.
5. Conclusions
In their conclusion, Altringer et al. [9] noted the superiority of machine-learning techniques to econometric tools when dealing with missing data. This paper extends that conclusion by highlighting that machine learning techniques can also reach into related but distinct data sets. After confirming that a constrained feature set would not significantly weaken the techniques’ accuracy, we used the wildlife strike and cost data contained in the NWSD to train two random forest machine learning algorithms to predict the costs associated with wildlife strikes reported in Australia. These algorithms predicted that wildlife strikes cost the Australian aviation industry approximately AUD 7.9 million in repair costs and approximately AUD 4.8 million in other costs on average each year between 2008 and 2017.
Due to reporting quality and economic conversion limitations, these results suffer from a few limitations. Firstly, while estimations are provided on a per-strike basis, the above modeling technique still relies on some mean cost assignment, albeit across a broad set of features with complex weightings. This can be seen in a cost estimation being made for every wildlife strike report in the other costs category. While one could argue that every strike does incur a cost, even if limited to time taken to inspect the aircraft, it might be more reasonable to assume that this could lead to an overestimate in other costs. However, the likely tendency to underreport these costs in the training data was thought to counteract this issue, if not overcome and lead to a total underestimate of the true cost. Nonetheless, these predicted costs provide a baseline for the industry to use in future wildlife strike mitigation efforts, including research, collaboration, reporting systems, and education.
The complexity of the environment in which wildlife strikes occur in aviation necessitates a data-driven approach. When addressing the risk posed by wildlife to flight safety, aerodrome operators are encouraged to look at historical and other data on a per-species basis [35]. This analysis is thought to provide wildlife hazard managers with the best framework to identify and develop targeted risk mitigation strategies [34]. Until now, aerodrome operators have struggled to obtain data regarding the potential benefit of their risk mitigation efforts, calculated here as a reduction in costs associated with wildlife strikes. This research provides the Australian aviation industry with a broad baseline of wildlife strike costs. The technique establishes a method for estimating the costs and potential benefits at an aerodrome and aircraft operator level. The algorithm’s weighted use of multiple strike features allows predicted costs to be based on the level of detail contained in a single aerodrome’s wildlife strike reports. This enables the aerodrome operator to assess past and future risk mitigation activities against current data held within their system or the national wildlife strike reporting database. Finally, as Altringer et al. [9] concluded, this technique also facilitates the calculation of relative risk between aerodromes, assisting aircraft operators in deciding where to allocate their wildlife hazard management efforts or which of their destination aerodromes may require support.
Author Contributions
Conceptualization, D.P.; methodology, D.P.; software, D.P.; formal analysis, D.P. and J.R.; investigation, D.P. and J.R.; data curation, D.P.; writing—original draft preparation, D.P.; writing—review and editing, J.R., M.M. and W.M.; supervision, M.M. and W.M. All authors have read and agreed to the published version of the manuscript.
Funding
This research received no external funding.
Data Availability Statement
Data and code supporting the above results can be found at https://github.com/DanParsons80/machine_learning_australian_wildlife_strike_cost_estimates.
Conflicts of Interest
The authors declare no conflict of interest.
References
- Marra, P.P.; Dove, C.J.; Dolbeer, R.A.; Dahlan, N.F.; Heacker, M.; Whatton, J.F.; Diggs, N.E.; France, C.; Henkes, G.A. Migratory Canada geese cause crash of US Airways Flight 1549. Front. Ecol. Environ. 2009, 7, 297–301. [Google Scholar] [CrossRef] [Green Version]
- Dolbeer, R.A.; Begier, M.J.; Phyllis, P.R.; Weller, J.R.; Anderson, A.L. Wildlife Strikes to Civil Aircraft in the United States, 1990–2021; Department of Transportation & Federal Aviation Administration: Washington, DC, USA, 2022. Available online: https://www.faa.gov/sites/faa.gov/files/2022-07/Wildlife-Strike-Report-1990-2021.pdf (accessed on 10 October 2022).
- Allan, J.R. The costs of bird strikes and bird strike prevention. Hum. Confl. Wildl. Econ. Consid. 2000, 18, 147–153. [Google Scholar]
- Navin, J.; Weiler, S.; Anderson, A. Wildlife strike cost revelation in the US domestic airline industry. Transp. Res. Part D Transp. Environ. 2020, 78, 102204. [Google Scholar] [CrossRef]
- International Civil Aviation Organisation. Manual on the ICAO Bird Strike Information System (IBIS); International Civil Aviation Organisation: Montreal, QC, Canada, 1989; Available online: https://www.icao.int/sam/documents/2013-birdh-std/9332_3ed_en.pdf (accessed on 23 July 2022).
- Transport Safety Investigation Act 2003 (Cth). 11 April 2003. Available online: https://www.legislation.gov.au/Details/C2016C00617 (accessed on 23 July 2022).
- Federal Aviation Administration. FAA Wildlife Strike Database [Data Set]; Federal Aviation Administration: Washington, DC, USA, 2022. Available online: https://wildlife.faa.gov.au (accessed on 29 May 2022).
- Metz, I.C.; Ellerbroek, J.; Mühlhausen, T.; Kügler, D.; Hoekstra, J.M. The bird strike challenge. Aerospace 2020, 7, 26. [Google Scholar] [CrossRef] [Green Version]
- Altringer, L.; Navin, J.; Begier, M.J.; Shwiff, S.A.; Anderson, A. Estimating wildlife strike costs at US airports: A machine learning approach. Transp. Res. Part D Transp. Environ. 2021, 97, 102907. [Google Scholar] [CrossRef]
- International Civil Aviation Organisation. Annex 14 to the Convention on International Civil Aviation: Aerodromes, 9th ed.; International Civil Aviation Organisation: Montreal, QC, Canada, 2022; Volume I, Available online: https://portal.icao.int/icao-net/Annexes/an14_v1_cons.pdf (accessed on 23 July 2022).
- Australian Transport Safety Bureau. Australian Aviation Wildlife Strike Statistics 2008–2017 [Data Set]; Australian Transport Safety Bureau: Canberra, Australia, 2019. Available online: https://www.atsb.gov.au/publications/2018/ar-2018-035 (accessed on 13 April 2022).
- DeVault, T.L.; Blackwell, B.F.; Seamans, T.W.; Begier, M.J.; Kougher, J.D.; Washburn, J.E.; Miller, P.R.; Dolbeer, R.A. Estimating interspecific economic risk of bird strikes with aircraft. Wildl. Soc. Bull. 2018, 42, 94–101. [Google Scholar] [CrossRef] [Green Version]
- Paranjape, A.A.; Chung, S.J.; Kim, K.; Shim, D.H. Robotic herding of a flock of birds using an unmanned aerial vehicle. IEEE Trans. Robot. 2018, 34, 901–915. [Google Scholar] [CrossRef] [Green Version]
- Ball, S.; Butler, F.; Caravaggi, A.; Coughlan, N.E.; Keogh, G.; O’Callaghan, M.J.; Whelan, R.; Kelly, T.C. Hares in the long grass: Increased aircraft related mortality of the Irish hare (Lepus timidus hibernicus) over a 30-year period at Ireland’s largest civil airport. Eur. J. Wildl. Res. 2021, 67, 80. [Google Scholar] [CrossRef]
- Nilsson, C.; La Sorte, F.A.; Dokter, A.; Horton, K.; Van Doren, B.M.; Kolodzinski, J.J.; Shamoun-Baranes, J.; Farnsworth, A. Bird strikes at commercial airports explained by citizen science and weather radar data. J. Appl. Ecol. 2021, 58, 2029–2039. [Google Scholar] [CrossRef]
- Allan, J.R.; Orosz, A.P. The costs of birdstrikes to commercial aviation. In Proceedings of the 2001 Bird Strike Committee-USA/Canada, Third Joint Annual Meeting, Calgary, AB, Canada, 27–30 August 2001; p. 2. Available online: https://digitalcommons.unl.edu/cgi/viewcontent.cgi?article=1001&context=birdstrike2001 (accessed on 3 August 2022).
- Sodhi, N.S. Competition in the air: Birds versus aircraft. Auk 2002, 119, 587–595. [Google Scholar] [CrossRef]
- Cleary, E.C.; Wright, S.E.; Dolbeer, R.A. Wildlife Strikes to Civil Aircraft in the United States, 1990–1998; Federal Aviation Administration: Washington, DC, USA, 1999; Available online: https://nwrc.contentdm.oclc.org/digital/collection/NWRCPubs1/id/36331/rec/13 (accessed on 3 August 2022).
- Cleary, E.C.; Dolbeer, R.A.; Wright, S.E. Wildlife Strikes to Civil Aircraft in the United States, 1990–2005; Federal Aviation Administration: Washington, DC, USA, 2006; Available online: https://digitalcommons.unl.edu/cgi/viewcontent.cgi?article=1006&context=birdstrikeother (accessed on 3 August 2022).
- Cleary, E.C.; Dolbeer, R.A.; Wright, S.E. Wildlife Strikes to Civil Aircraft in the United States, 1990–2004; Federal Aviation Administration: Washington, DC, USA, 2005; Available online: https://nbaa.org/wp-content/uploads/aircraft-operations/safety/in-flight-safety/wildlife-strike-response/Wildlife-Strikes-to-Civil-Aircraft-1990-2020.pdf (accessed on 3 August 2022).
- Wright, S.E.; Dolbeer, R.A. Percentage of wildlife strikes reported and species identified under a voluntary reporting system. In Proceedings of the 2005 Bird Strike Committee-USA/Canada 7th Annual Meeting, Vancouver, BC, USA, 15–18 August 2005; p. 11. Available online: https://digitalcommons.unl.edu/cgi/viewcontent.cgi?article=1010&context=birdstrike2005 (accessed on 3 August 2022).
- Dolbeer, R.A. Trends in reporting of wildlife strikes with civil aircraft and in identification of species struck under a primarily voluntary reporting system, 1990–2013. Other Publ. Zoonotics Wildl. Dis. 2005, 188, 1–46. [Google Scholar]
- Qantas, & Virgin Blue. Managing Wildlife Strike Risk: An Airline Perspective; Australian Aviation Bird and Animal Hazard Working Group Wildlife Education and Information Sharing Forum: Canberra, Australia, 2006; Available online: https://aawhg.org/wp-content/uploads/2019/07/2006-Forum-qantas.pdf (accessed on 3 August 2022).
- Taylor, L. The Impact of Wildlife Strikes to the Qantas Group of Airlines; Australian Aviation Wildlife Hazard Group Forum: Melbourne, Australia, 2007; Available online: https://aawhg.org/wp-content/uploads/2019/07/2007-Forum-impact_of_wildlife_strikes_qantas_taylor.pdf (accessed on 3 August 2022).
- Raschka, S. Model evaluation, model selection, and algorithm selection in machine learning. arXiv 2018, arXiv:1811.12808. [Google Scholar]
- Nasteski, V. An overview of the supervised machine learning methods. Horizons 2017, 4, 51–62. [Google Scholar] [CrossRef]
- Jiang, T.; Gradus, J.L.; Rosellini, A.J. Supervised machine learning: A brief primer. Behav. Ther. 2020, 51, 675–687. [Google Scholar] [CrossRef] [PubMed]
- Breiman, L. Random forests. Mach. Learn. 2001, 45, 5–32. [Google Scholar] [CrossRef] [Green Version]
- Pedregosa, F.; Varoquaux, G.; Gramfort, A.; Michel, V.; Thirion, B.; Grisel, O.; Blondel, M.; Prettenhofer, P.; Weiss, R.; Dubourg, V.; et al. Scikit-learn: Machine learning in Python. J. Mach. Learn. Res. 2011, 12, 2825–2830. [Google Scholar]
- Prentice, B.; DiNota, A.; Costanza, D.; Reagan, I.; Franzoni, C.; Stelle, M. Global Fleet & MRO Market Forecast Commentary 2022–2032; Oliver Wyman: New York, NY, USA, 2022; Available online: https://www.oliverwyman.com/content/dam/oliver-wyman/v2/publications/2022/feb/MRO-2022-Master-file_v5.pdf (accessed on 21 January 2023).
- Reserve Bank of Australia. Historical Data; Reserve Bank of Australia: Sydney, Australia, 2023. Available online: https://www.rba.gov.au/statistics/historical-data.html#exchange-rates (accessed on 21 January 2023).
- U.S. Bureau of Labor Statistics. CPI Inflation Calculator; U.S. Bureau of Labor Statistics: Washington, DC, USA, 2022. Available online: https://www.bls.gov/data/inflation_calculator.htm (accessed on 21 January 2023).
- Altringer, L. Estimating Wildlife Strike Costs at US Airports: A Machine Learning Approach [Data Set]. 2021. Available online: https://github.com/levialtringer/machine_learning_wildlife_strike_cost_estimates (accessed on 15 July 2022).
- Dolbeer, R.A.; Begier, M.J. Comparison of wildlife strike data among airports to improve aviation safety. In Proceedings of the 30th International Bird Strike Conference, Stavanger, Norway, 26–29 June 2012; Available online: https://www.researchgate.net/publication/287644945_Comparison_of_wildlife_strike_data_among_airports_to_improve_aviation_safety (accessed on 3 August 2022).
- International Civil Aviation Organisation. Airport Services Manual—Part 3—Wildlife Hazard Management, 5th ed.; International Civil Aviation Organisation: Montreal, QC, Canada, 2021; Available online: https://www.bazl.admin.ch/dam/bazl/en/dokumente/Fachleute/Flugplaetze/ICAO/icao_doc_9137_airportsevicesmanual-part3.pdf.download.pdf/icao_doc_9137_airportsevicesmanual-part3.pdf (accessed on 23 July 2022).
Figure 1.
Model development, training, evaluation, and prediction workflow.

Figure 2.
Estimates for repair and other costs for Australian wildlife strikes reported between 2008 and 2017 (2021 AUD).
Figure 2.
Estimates for repair and other costs for Australian wildlife strikes reported between 2008 and 2017 (2021 AUD).


Table 1.
Summary statistics of repair and other cost data.
| Mean | SD | Min | Median | Max | N | Missing Data | |
|---|---|---|---|---|---|---|---|
| Repair Costs | |||||||
| Altringer et al. [9] a | $152,646 | $926,856 | $1.02 | $13,670 | $42,117,878 | 5129 | 19,838 b |
| FAA (2022) c | $171,491 | $1,010,921 | $1.00 | $15,304 | $45,432,000 | 4910 | 13,932 b |
| Other Costs | |||||||
| Altringer et al. [9] a | $16,225 | $149,036 | $0.01 d | $234 | $6,419,450 | 5860 | 231,445 |
| FAA (2022) c | $24,839 | $187,126 | $0.01 d | $716 | $6,925,000 | 4453 | 258,240 |
a All figures reported by Altringer et al. [9] are in 2018 US dollars. b Strike reports that indicate nil damage are assumed to have USD 0 repair cost and were excluded from Altringer et al.’s [9] imputation process. Missing values were not used in this analysis but are included here to highlight the curation of the data that have become available since the earlier research project. c All figures derived from this project’s retrieval of the NWSD are reported in 2021 US dollars. d As per Altringer et al. [9], other cost values of USD 0 were substituted with USD 0.01 to facilitate log transformation.
Table 2.
Variables used in full [9] and constrained feature sets.
Table 2.
Variables used in full [9] and constrained feature sets.
| Variable | Full Feature Set | Constrained Feature Set | Difference |
|---|---|---|---|
| Aircraft Class | ✓ | ✓ | |
| Engine Type | ✓ | ✓ | |
| Aircraft Mass | ✓ | ✓ | |
| Pilot warned | ✓ | ✗ | Not included in Australian data |
| Phase of flight | ✓ | ✓ | |
| Number seen | ✓ | ✓ | Australian data stop at >10 |
| Number struck | ✓ | ✓ | Australian data stop at >10 |
| Animal size | ✓ | ✓ | Australian data included “very large”—recategorized as “large” |
| Component struck | ✓ | ✓ | Australian data did not distinguish radome, constrained NWSD data combined nose and radome |
| Effect on flight | ✓ | ✗ | Not included in Australian data |
| Damage type | ✓ | ✓ | |
| Component damaged | ✓ | ✗ | Not included in Australian data |
| Engine ingestion | ✓ | ✓ | Change in NWSD data from March 2021 reversed. Australian data included extra labels for number of engines, relabeled as binary |
| Cloud cover | ✓ | ✗ | Not included in Australian data |
| Time of day | ✓ | ✗ | Not included in Australian data |
Table 3.
Feature set evaluation.
| Mean Square Error Mean (SD) | Mean Absolute Error Mean (SD) | R-Squared Mean (SD) | |
|---|---|---|---|
| Repair costs | |||
| Altringer et al. [9] | 2.637 (0.088) | 1.244 (0.022) | 0.504 (0.015) |
| Full feature set | 2.434 (0.082) | 1.234 (0.022) | 0.486 (0.013) |
| Constrained feature set | 2.474 (0.084) | 1.240 (0.022) | 0.475 (0.017) |
| Performance difference (constrained vs. full feature set) | −1.65% (p < 0.001) | −0.08% (p = 0.012) | −2.26% (p < 0.001) |
| Other costs | |||
| Altringer et al. [9] | 1.822 (0.109) | 0.838 (0.021) | 0.945 (0.003) |
| Full feature set | 2.567 (0.164) | 1.139 (0.024) | 0.536 (0.020) |
| Constrained feature set | 2.640 (0.198) | 1.164 (0.026) | 0.521 (0.026) |
| Performance difference (constrained vs. full feature set) | −2.84% (p = 0.004) | −2.19% (p < 0.001) | −2.80% (p < 0.001) |
Disclaimer/Publisher’s Note: The statements, opinions and data contained in all publications are solely those of the individual author(s) and contributor(s) and not of MDPI and/or the editor(s). MDPI and/or the editor(s) disclaim responsibility for any injury to people or property resulting from any ideas, methods, instructions or products referred to in the content. |
© 2023 by the authors. Licensee MDPI, Basel, Switzerland. This article is an open access article distributed under the terms and conditions of the Creative Commons Attribution (CC BY) license (https://creativecommons.org/licenses/by/4.0/).
Share and Cite
MDPI and ACS Style
Parsons, D.; Ryan, J.; Malouf, M.; Martin, W. Estimating the Cost of Wildlife Strikes in Australian Aviation Using Random Forest Modeling. Aerospace 2023, 10, 648. https://doi.org/10.3390/aerospace10070648
AMA Style
Parsons D, Ryan J, Malouf M, Martin W. Estimating the Cost of Wildlife Strikes in Australian Aviation Using Random Forest Modeling. Aerospace. 2023; 10(7):648. https://doi.org/10.3390/aerospace10070648
Chicago/Turabian StyleParsons, Dan, Jason Ryan, Michael Malouf, and Wayne Martin. 2023. "Estimating the Cost of Wildlife Strikes in Australian Aviation Using Random Forest Modeling" Aerospace 10, no. 7: 648. https://doi.org/10.3390/aerospace10070648
Note that from the first issue of 2016, this journal uses article numbers instead of page numbers. See further details here.