

Modeling Airport Choice Using a Latent Class Logit Model


1
SUM Lab—Sustainable Mobility and Railway Engineering Research Group, Universidad de Cantabria, 39005 Cantabria, Spain
2
Departamento de Ingenieria Civil, Universidad de Burgos, 09001 Burgos, Spain
*
Author to whom correspondence should be addressed.
Aerospace 2023, 10(8), 703; https://doi.org/10.3390/aerospace10080703
Submission received: 12 July 2023
/
Revised: 6 August 2023
/
Accepted: 8 August 2023
/
Published: 10 August 2023
(This article belongs to the Collection Air Transportation—Operations and Management)
Abstract
:Studying the location of an airport is essential for optimizing its functionality, ensuring safety, and maximizing its economic benefits. There are many airports located within a short distance of each other, and users can often choose to travel between one or the other depending on a number of variables that they value for their final choice. In this paper, we design a stated preference survey and estimate a latent class logit model to study user behavior in the choice of nearby airports. The idea is to study if the choice of airport can indeed depend on the characteristics of the users and the purpose of their trip and if factors such as traveling with family, children, or friends can play a role in determining the preferred airport. It is also investigated whether the presence of low-cost airlines or direct connections to the final destinations of the trip (number of transfers) and other factors influence the choice of airport. It is shown that there are two classes of users who have different travel behavior, and that the perception of certain variables influences the choice of the nearest or furthest airport depending on the type of trip.
1. Introduction
Airport choice is a multidimensional process that encompasses a multitude of variables including geographic location, quality of airport services and facilities, airline network configuration, mode of access and connection to the airport, airfares, availability and frequency of flights, and airport infrastructure, among others. This complex process is of interest to passengers, airlines, cargo operators, and airport planning and management entities alike.
Studying the location of an airport is important for several reasons. Firstly, the location of an airport can have a significant impact on its operational efficiency and capacity. Factors such as proximity to major population centers, transportation infrastructure, and available land can all affect the airport’s ability to handle passenger and cargo traffic effectively. Secondly, studying the location of an airport is crucial for ensuring safety and security. Additionally, the location of an airport can also have economic implications, as it can influence tourism, trade, and regional development. Therefore, studying the location of an airport is essential for optimizing its functionality, ensuring safety, and maximizing its economic benefits.
Travelers are willing to spend several hours to access airports in order to benefit from lower fares and more convenient airport services [1]. Studying nearby airport competition is important for several reasons. Firstly, competition from nearby airports can influence the pricing behavior of airports, imposing discipline on their pricing strategies [2]. This competition can lead to lower prices for passengers and encourage airports to improve their services and efficiency to attract more customers [2]. Secondly, understanding nearby airport competition is crucial for airport development and sustainability. It helps identify factors that contribute to airport competitiveness, such as infrastructure, operations, and location [3]. Additionally, competition between airports in a multi-airport region can have a significant impact on passenger airport choice and connectivity [4]. Furthermore, competition from nearby airports can affect the viability and profitability of smaller airports, especially in terms of infrastructure and scale of operations [5]. Overall, studying nearby airport competition is essential for understanding market dynamics, improving airport performance, and enhancing the overall passenger experience.
This article presents several innovative contributions to the field of airport choice study. It introduces a multidimensional approach that incorporates a range of factors such as geographical location, airport service quality, airline network configuration, and airport infrastructure, among others. It also incorporates respect to other questionnaires the option not to travel. In addition, it employs a latent class logit model, an advanced statistical technique, to model travelers’ choice between several nearby airports. This model allows capturing unobserved heterogeneity in passenger preferences, providing deeper insights into travelers’ choice behavior. Through a stated preference survey, this study collects data directly from passengers, providing valuable information on their preferences and choice behavior. Finally, the analysis of competition between airports and the evaluation of a number of factors that may influence airport choice, such as the presence of low-cost carriers and the consideration of the special characteristics of each journey, contribute to the understanding of airport market dynamics and how to improve the overall passenger experience. For this purpose, a stated preference survey is designed and a latent class logit model is estimated with the aim of studying the choice between different nearby airports, trying also to study whether the choice of airport depends on the characteristics of the users and the purpose of trip (leisure or business) that they are making, including the special characteristics of each trip, such as traveling with family, children or friends. It is also investigated whether the presence of low-cost airlines or direct connections to the final destinations of the trip (number of transfers) and other factors influence the choice of airport. In order to achieve this objective, the paper is structured as follows. After a brief introduction, an extensive review of the state of the art is proposed. Section 3 explains the data collection method and the main results of the user characterization survey and Section 4 explains the modeling methodology based on the latent class logit model. Section 5 presents and discusses the main results of the model, and finally we draw the most important conclusions.
2. Literary Review
Airport choice is a complex process involving a variety of factors. Recent studies have focused on various aspects of airport choice: passenger hub location, airport quality, airline network configuration, mode of access, airfares, flight availability, airport infrastructure, and other factors.
2.1. Airport Choice Factors
Gardiner et al. [6] studied airport choice by cargo operators, while Heyns and Carstens [7] investigated factors influencing passengers’ airport choice decisions at a regional airport in South Africa. Percoco [8] extended the framework to account for selection bias due to airport location choice and spatial spillover effects. Dziedzic and Warnock-Smith [9] described how airport choice factors for low-cost airlines have evolved over the past 10 years.
The location and infrastructure of an airport can have a significant impact on its choice. Trojanek [10] analyzed the impact of aircraft noise on the value of housing near Warsaw Chopin Airport in Poland, highlighting the role of negative externalities of air traffic on the perception and valuation of the airport by the nearby community. Gupta et al. [11] developed a model to understand and forecast the response of air passengers to changes in ground access times and costs, along with changes in airport service, while He and Liu [12] took the research a step further by investigating the coupling effect between airport ground traffic and the extent of passenger radiation, a concept that encompasses the ability of an airport to attract passengers from a given geographic area. Mishra et al. [13] used nearby airports with high-quality long-term observations of hourly precipitation as surrogates for nearby urban areas. Wei et al. [14] studied the dynamic correlation between airport passenger flow, urban development, and nearby airport capacity in Tianjin City, China.
Airport choice is also strongly influenced by competition and accessibility factors. Falcão and Silva [15] analyzed airport competition in Brazil, a country with an extensive airport network. In their study, they examined the implications of changes in aviation policy and the opening of new airports. On the other hand, Bel and Fageda [2] investigated the impact of privatization, regulation, and airport pricing on airport competition. Their findings show that public policy decisions can have a direct impact on airport choice for both airlines and passengers. Regarding accessibility, Górecka [16] highlighted that it is a critical factor that can determine passengers’ airport choice. Pulugurtha [17] investigated how changes in transportation infrastructure have affected the travel time reliability of the surrounding road network in the vicinity of the airport over time and explored selected unconventional intersection designs and proposed new ingress/egress access routes from major roads near the airport. In addition, nearby airports can facilitate the export of goods from nearby industries, businesses, and exporters. On the demand side, local consumers prefer jet aircraft, flights that fit their schedules and offer low airfares, and the availability of nearby airports [18]. In addition, when locating and designing airport expansion, it is essential to optimize flight paths in a way that reduces noise exposure to nearby communities [19].
2.2. Airport Choice Modeling
The evolution of the study of airport choice has seen significant improvements in traditional modeling approaches, originally based on discrete choice models (DCM) [20,21]. During the 1980s, researchers began to explore the field of airport choice. Harvey [20] was one of the pioneers, using a multinomial logit (MNL) model for analysis and finding significant coefficients for flight frequency and access time [20]. In the following decade, Ben-Akiva et al. [22] advanced the field, presenting the integration of choice models and latent variables, which allowed incorporating unobserved heterogeneity in choice behavior. Later, Hess and Polak [21] applied a parameterized consideration set model to analyze airport choice in the San Francisco Bay Area, considering factors such as the number of airports and the order in which they are considered. In another study, the mixed logit model was used to analyze airport choice behavior in regions with multiple airports, identifying the availability of nonstop flights, travel time, and airport access time as key factors [23]. As we progressed into the second decade of the 21st century, researchers like Hao et al. [24] carried out in-depth studies in specific regions, including the metropolitan area of Yunnan in China. These studies underscored the significance of travel time and airport accessibility. They also exposed that the development of airport transport lacked coordination between the airline network and the service coverage of civil airports for tourist destinations. Finally, studies such as Murça and Correia [25] and more recently confirmed by Falcao [15] added airline competition as an additional factor.
As has been shown, a logit-type explanatory model of choice was used as a starting point. These models have been extended to incorporate not only objective attributes of alternatives and socio-economic characteristics of individuals, but also latent variables. Such latent variables more effectively capture the psychological factors that influence customers’ purchasing behavior, facilitating understanding of the relationship between customer desires and product characteristics [26]. Latent variable modeling is a technique used to capture customer perception by analyzing psychometric data obtained through surveys. These psychometric surveys ask consumers to indicate their level of satisfaction or dissatisfaction in relation to aspects related to latent variables [27]. By incorporating psychological factors, a more realistic representation of the choice process is achieved and, as a result, greater explanatory power is also achieved [26]. Hult [27] also points out that latent variable modeling is a technique that allows capturing customer perceptions using psychometric data obtained through surveys. Chen and Li [28] supports the claim that latent variables strengthen the discrete choice model and outperform the traditional approach. The study found that the integrated model with latent variable sets had a higher goodness of fit compared to the traditional logit model, indicating that latent variables have a significant impact on mode choice behavior and enhance the explanatory ability of the model. More recently, the focus shifted towards latent class logit models, used by Wang [29] to analyze airport choice behavior, which helped to characterize unobserved heterogeneity in choice behavior and identify different traveler segments with unique preferences. In parallel to this evolution, studies such as those by Zhang and Xie [30], Wu and Daziano [31], and Wang et al. [29] continued to expand modeling techniques and improve our understanding of passenger behavior. These works contributed to a deeper understanding of airport choice, highlighting the importance of the factors of airfare, airport travel cost, travel time, airport charges, security efficiency, and flight schedule convenience, among others. But it has been observed that all analyses have considered only the characteristics of an airport rather than a set of multi-airport choices in a supra-metropolitan area.
In order to evaluate the variables included on the studies, the evolution of airport choice models over time has followed a trajectory of increasing sophistication and complexity, incorporating increasingly detailed approaches and diverse variables affecting passenger choice [6,7,15,32,33,34,35,36,37]. In particular, it has evolved to incorporate various factors such as facilities or competition from low-cost airlines [6,15]. These factors have evolved over time with the development of technology. Passengers now have more choice than in the past and are willing to pay more for a better experience. In terms of variables considered, they can be summarized as follows by analyzing the main literature on location [6,7,32,34], tariffs [15,38], connections [33,35], facilities [34,38], and competition [15,36]. Moreover, during this evolution, several other factors have been identified as influencing airport choice such as airport travel cost, travel time, airport charges, aircraft arrival efficiency, terminal simplicity, or airport accessibility [11,21,38].
In summary, over the past decades, we have observed a steady evolution in the models used to study airport choice, with the most recent models able to capture and explain unobserved heterogeneity in passenger choice behavior. These findings are of great relevance for policy interventions aimed at influencing airport choice behavior. Despite all these advances in terms of the consideration of variables, location, or quality of facilities, none of the authors studied have conducted a joint study considering two choice options (different nearby airports) instead of only one to choose between two options. Moreover, this approach has not been carried out taking into account the heterogeneity of users that is captured by a latent class model as it will be done in this work.
3. Data Collection
In order to capture the data necessary for the modeling of a latent class model and its subsequent exploitation, a questionnaire of stated preferences has been design. First of all, it is convenient to carry out a characterization of the users in order to know their basic behavioral characteristics regarding the choice of airport as well as other descriptive variables such as sex, age, or income. It is important to note that the questionnaires were conducted without labeling the scenarios in which they were carried out in order to give generality to the results in any set of airports in suprametropolitan areas (London, Milan, New York…) where there are several airports less than 100 km away from each other.
Once the users responded to the survey characterization, they were presented with a stated preference questionnaire that was designed using an efficient design following the methodology proposed by Rose and Bliemer [39]. As far as survey design is concerned, the use of an efficient design of stated preference surveys significantly reduces the sample size required in this type of study and allows for a more robust estimation of the parameters, since the survey design is more directly related to the model to be estimated.
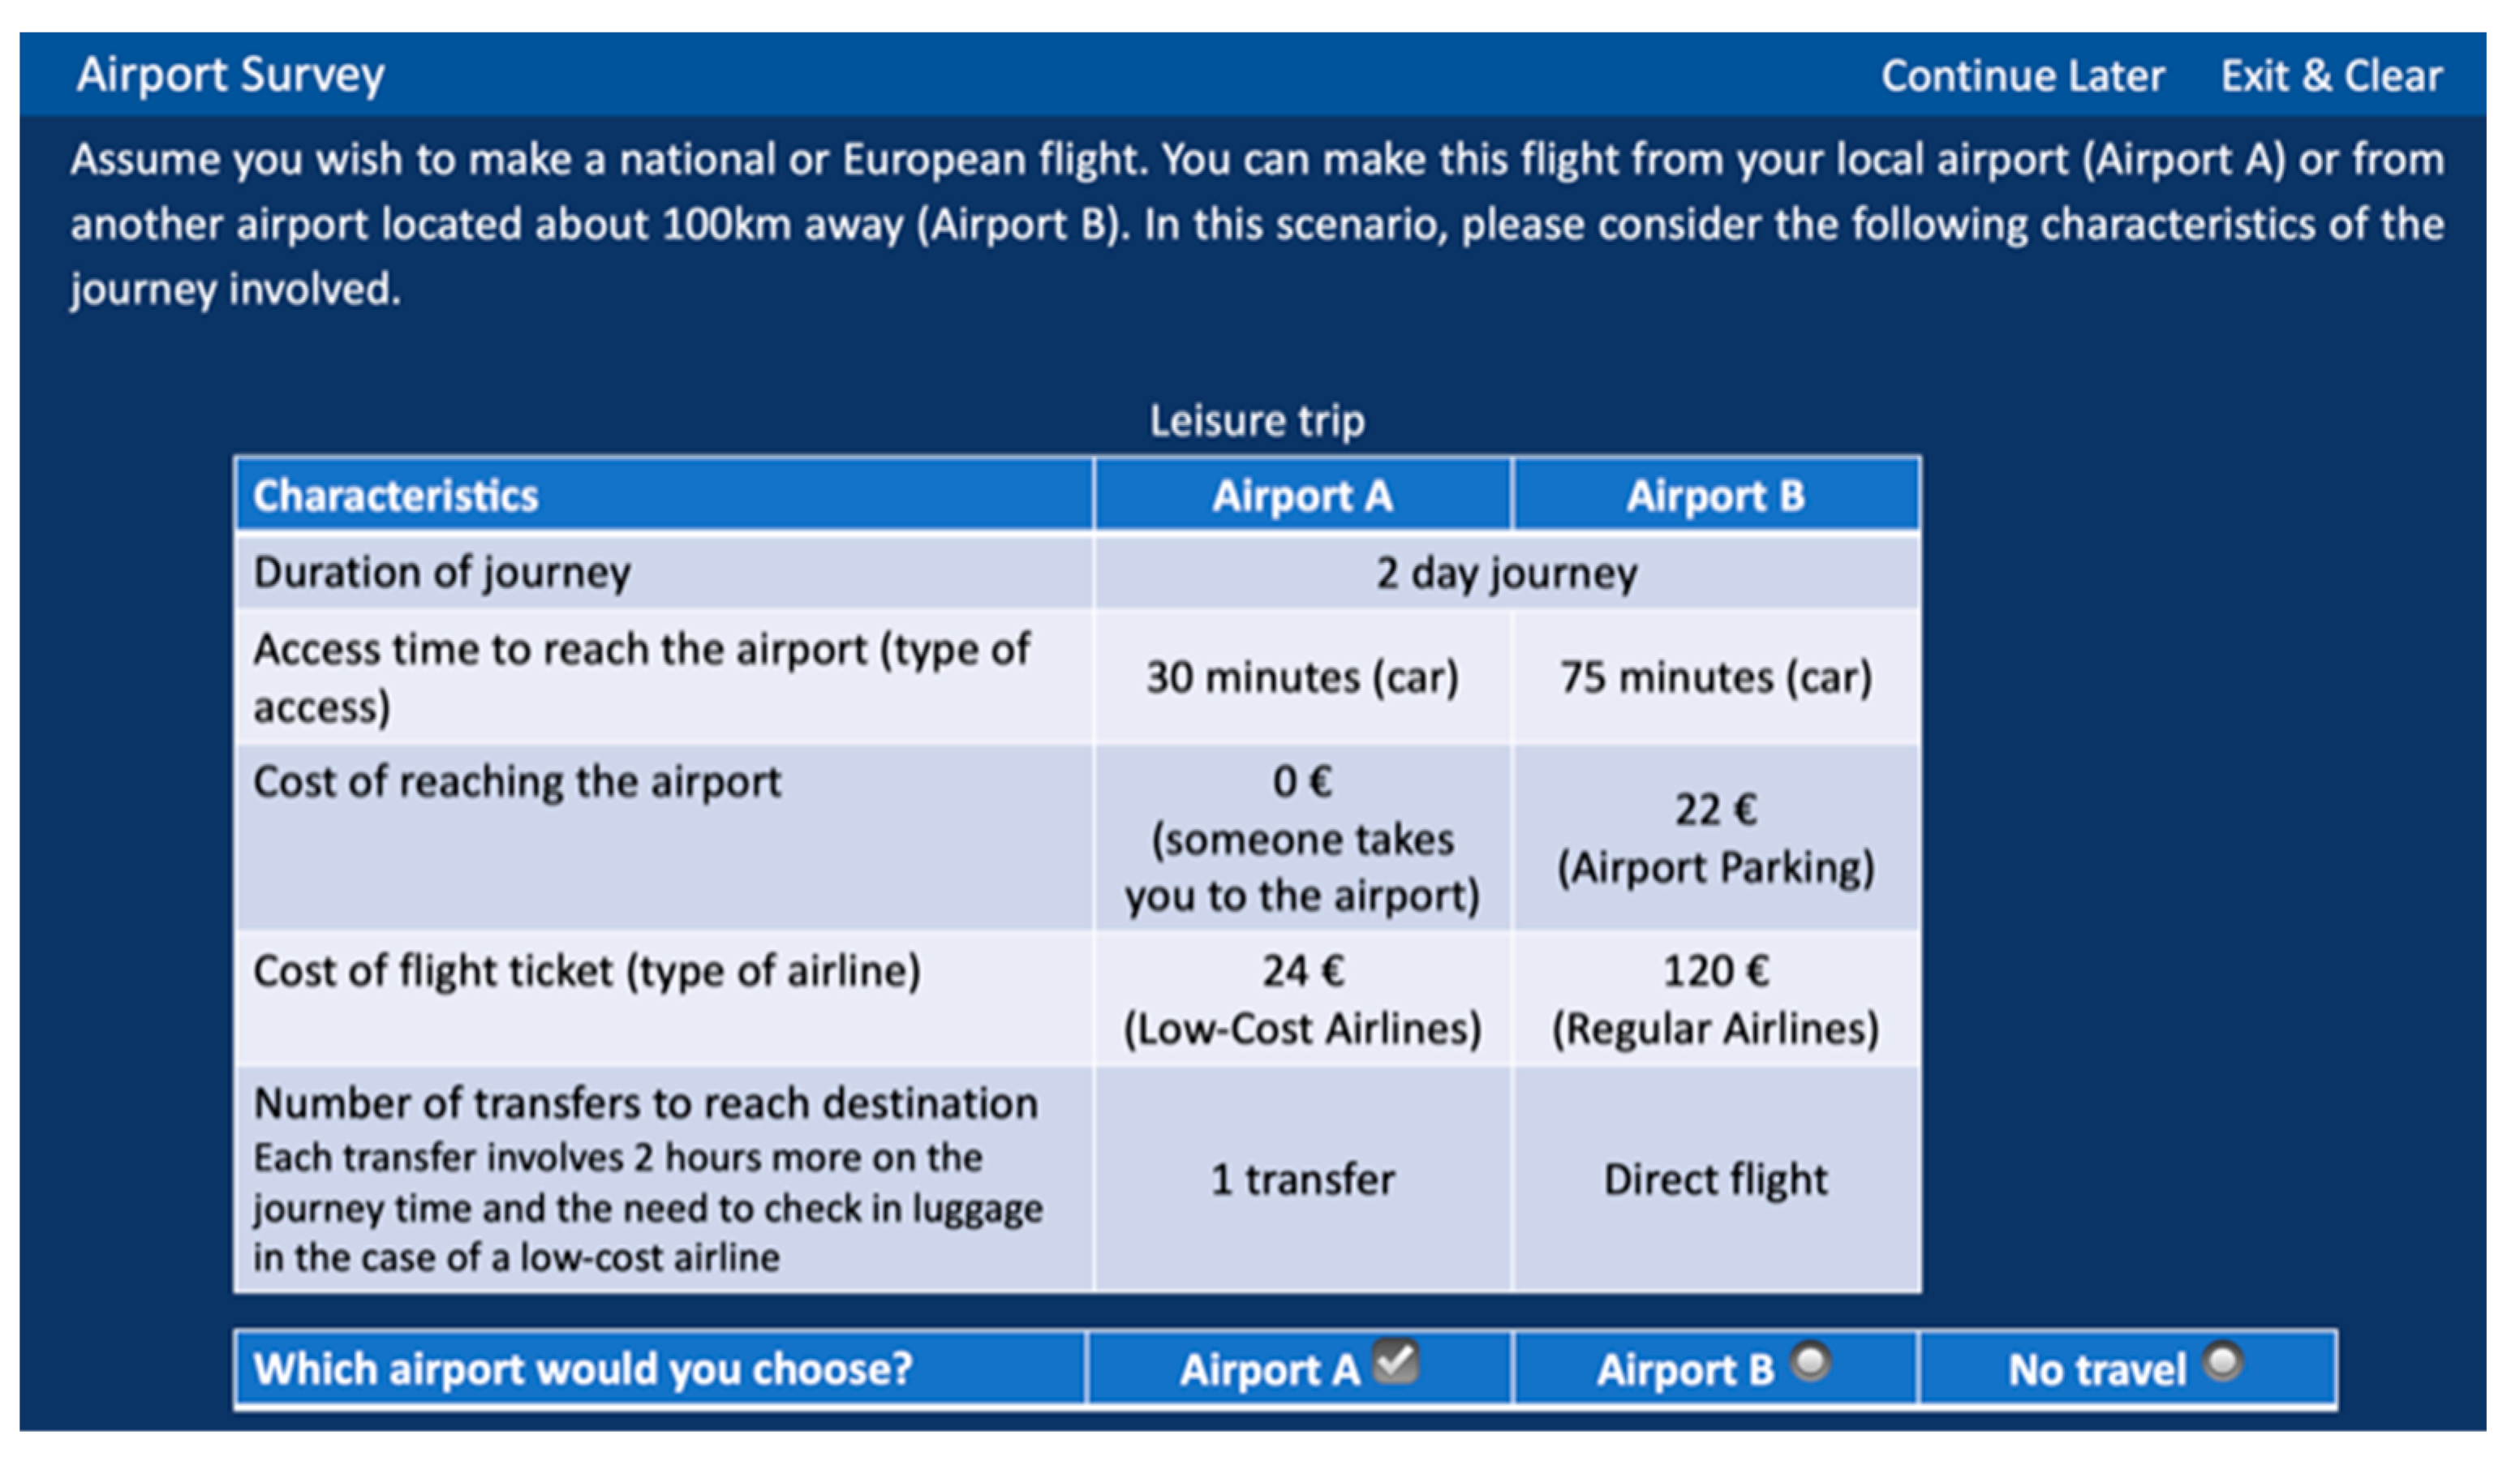
This questionnaire consisted of 12 possible scenarios (6 for leisure and 6 for business) of choice, which were shown to users in a pivoted manner depending on the answer to the question on the travel motive (leissure/business). Respondents were finally presented with 4 of the 6 scenarios within their travel purpose to avoid vague responses in a very long questionnaire. These scenarios gave the option to choose between 3 alternatives (nearest airport (A1), farthest airport (A2), or the option not to travel (A3)). For example, a scenario presented to a respondent who indicated that their reason for travel was leisure could have been: “Imagine you are planning a holiday trip to a specific destination. You have two airport options: Airport A1, which is closer to your home but has higher fares and requires at least one stopover en route, and Airport A2, which is further away from your home, has lower fares and offers direct flights to your destination. Alternatively, you also have the option of not traveling at all. Which of these options would you choose?” Also, within these options, they were presented with 3 variables that defined the characteristics of the option shown for their choice. Table 1 shows the variables and values for the leisure travel motive scenarios, and Table 2 for those with business as a motive. Figure 1 shows an example of the questionary shown to a leisure survey.
To carry out the efficient design of the scenarios shown in Table 1 and Table 2, a pilot survey was used. The pilot survey was conducted with 49 users selected to show no significant statistical bias in order to represent a wide range of travel behaviors. They were presented with a series of hypothetical scenarios in an orthogonal design and asked to indicate their preferences [40]. These preferences were analyzed to identify patterns and trends in responses, and were used to inform the configuration of the scenarios in the final survey. In particular, special attention was paid to variables that showed the greatest variation in user responses.
The results of the pilot survey were used to derive appropriate priors for the efficient design of the choice scenarios in the final survey. This process was carried out following the methodology proposed by Rose and Bliemer [39] and was performed using the NGENE software [41]. The findings from the pilot survey allowed us to design a final survey that effectively captured the variation in user preferences regarding airport choice, which in turn allowed us to develop a latent class logit model that accurately reflects these choice behaviors.
The final survey was carried out in two cities located in the north of Spain. On the one hand, the airport mentioned corresponds to the Seve Ballesteros airport in the city of Santander, whose area of influence is around 280,000 inhabitants and, on the other hand, the airport of Bilbao, which is located in an area of influence of around 900,000 inhabitants [42]. These airports are also connected by the Spanish state road network and the provincial government of Bizkaia at a distance of 105 km by car. There is also a bus connection between Santander airport and Bilbao city center with a journey time of 1 h and 30 min and a cost of EUR 8 in 2023. To complete this connection, a transfer must be made at the Bilbao bus station with a direct connection to the airport, taking 20 min and increasing the cost by EUR 2.50. Finally, Table 3 shows the operational characteristics of both airports.
4. Methodology
According to the theory of the latent class model (LCM), individual behavior is influenced by both observable attributes and latent heterogeneity, which is determined by factors that are not observed by the analyst [43]. This heterogeneity can be analyzed using a model that incorporates discrete parameter variation. In this framework, individuals are assumed to belong to a predetermined set of Q (q) classes. However, the specific class to which each individual belongs, whether or not they are aware of it, remains unknown to the analyst. The primary behavioral model used in this context is a logit model, which allows for discrete choice among Ji alternatives for individual i, observed in Ti (t) choice situations, as defined in Equation (1):
The number of observations and the size of the choice set can differ across individual respondents. In our case, the choice set is fixed to 3 alternatives and the number of observations is constant and is equal to 6 for each respondent. We assume that, given the class assignment, the Ti events are independent. The assignment of classes, however, remains unknown. Let Hiq represent the prior probability of class q for individual i. Different formulations have been utilized for this purpose, as mentioned in Hensher et al. [43]. One particularly convenient form is the multinomial logit (MNL) model, which is illustrated in Equation (2):
In the model for class membership, the variable zi represents a collection of observable characteristics or covariates that are included as factors. The log-likelihood (LL) is shown in Equation (3):
The methodology to implement a latent class logit model involves several key steps based on the referenced studies [31,44,45,46,47,48]:
Step 1: Data Collection and Preparation: The first step in conducting a latent class logit model is to collect data on the observed variables of interest. These variables can be categorical or binary in nature. The data should be appropriately prepared, cleaned, and organized for analysis.
Step 2: Latent Class Analysis: Latent class analysis (LCA) is applied to identify latent classes or segments within the data based on patterns in the observed variables [45,49]. LCA assumes that individuals within each latent class have similar preferences or characteristics. The number of latent classes is determined through model fitting indices, such as Bayesian Information Criterion (BIC) or Akaike Information Criterion (AIC) [43]. The LCA aims to uncover the heterogeneity within the population and group individuals into distinct classes.
Step 3: Latent Class Logit Model Estimation: Once the latent classes have been identified, a latent class logit model is estimated to examine the relationship between the latent class membership and the choice behavior [43,44]. The latent class logit model is a conditional logistic regression analysis that accounts for the heterogeneity among individuals within each class. The probabilities of choosing different alternatives are estimated based on the latent class membership and covariates.
Step 4: Incorporating Covariates: Incorporating covariates into the latent class logit model allows for a better understanding of the composition of different latent class segments. Covariates such as demographics, socioeconomic factors, or contextual effects can be included to examine their influence on the latent class membership and choice behavior [43].
Step 5: Model Validation: Validation is crucial to assess the goodness-of-fit of the latent class logit model. Various statistical techniques can be employed, such as assessing model convergence, checking for statistically significant coefficients, parameter sign consistency, and comparing different model specifications [46].
Step 6: Interpretation and Policy Implications: The final step involves the interpretation of the estimated parameters and drawing policy implications from the latent class segments and their characteristics. The results can provide valuable insights into understanding the preference heterogeneity among individuals and inform decision-making processes.
As a novelty, unlike other studies, the logit model incorporates the option of not traveling (A3). Incorporating this option is not trivial since its omission may bias the results of the models by forcing the respondent to choose between one option (A1) or another (A2), when option A3 is a very real option as shown, especially in the case of class 1 users. Furthermore, both the design of the survey and the logit models incorporate a series of variables that aim to study how the user’s travel behavior varies depending on certain situations that may occur with a certain frequency, such as traveling with children, with a partner, etc.
5. Results and Discussion
The final questionnaire was completed by 393 respondents who answered the characterization and four scenarios according to their travel purpose, so that the parameters of the estimated model have been made with 1572 observations. This number is bigger than the s-estimate (VALOR) provided by NGENE so assuming that priors are correct the parameters finally used reached the 95% of confidence level of statistical significance.
The variables used and their coding within the model presented are described below.
- ○
- AIRFARE (A1) = Cost of airfare from airport A1
- ○
- AIRFARE (A2) = Cost of airfare from airport A2
- ○
- ACCOST (A1) = Access cost to the airport A1
- ○
- ACCOST (A2) = Access cost to the airport A2
- ○
- NT (A1) = Number of transfers for departures from airport A1
- ○
- NT (A2) = Number of transfers for departures from airport A2
- ○
- LOWCOST (A1) = Dummy variable with a value of 1 if the flight in airport A1 is Lowcost and 0 otherwise.
- ○
- PARTNER (A1) = Dummy variable that is 1 if traveling with a partner from the airport A1 and 0 otherwise.
- ○
- PARTNER (A2) = Dummy variable that is 1 if traveling with a partner from the airport A2 and 0 otherwise.
- ○
- TPAID (A1) = It is worth 1 if on business trips from A1 airport the cost of the ticket is paid by the company and 0 otherwise.
- ○
- CON (A2) = Alternative specific constant of A2
- ○
- CON (A3) = Alternative specific constant of A3
- ○
- ACCT (A2) = Access time to the airport A2
- ○
- CHILDREN (A2) = It is worth 1 if traveling with children from the airport A2 and 0 otherwise.
- ○
- OFAMILY (A2) = It is worth 1 if traveling with other family members from the airport A2 and 0 otherwise.
Table 4 gives the final description of the sample used in the study with a summary of the 393 respondents.
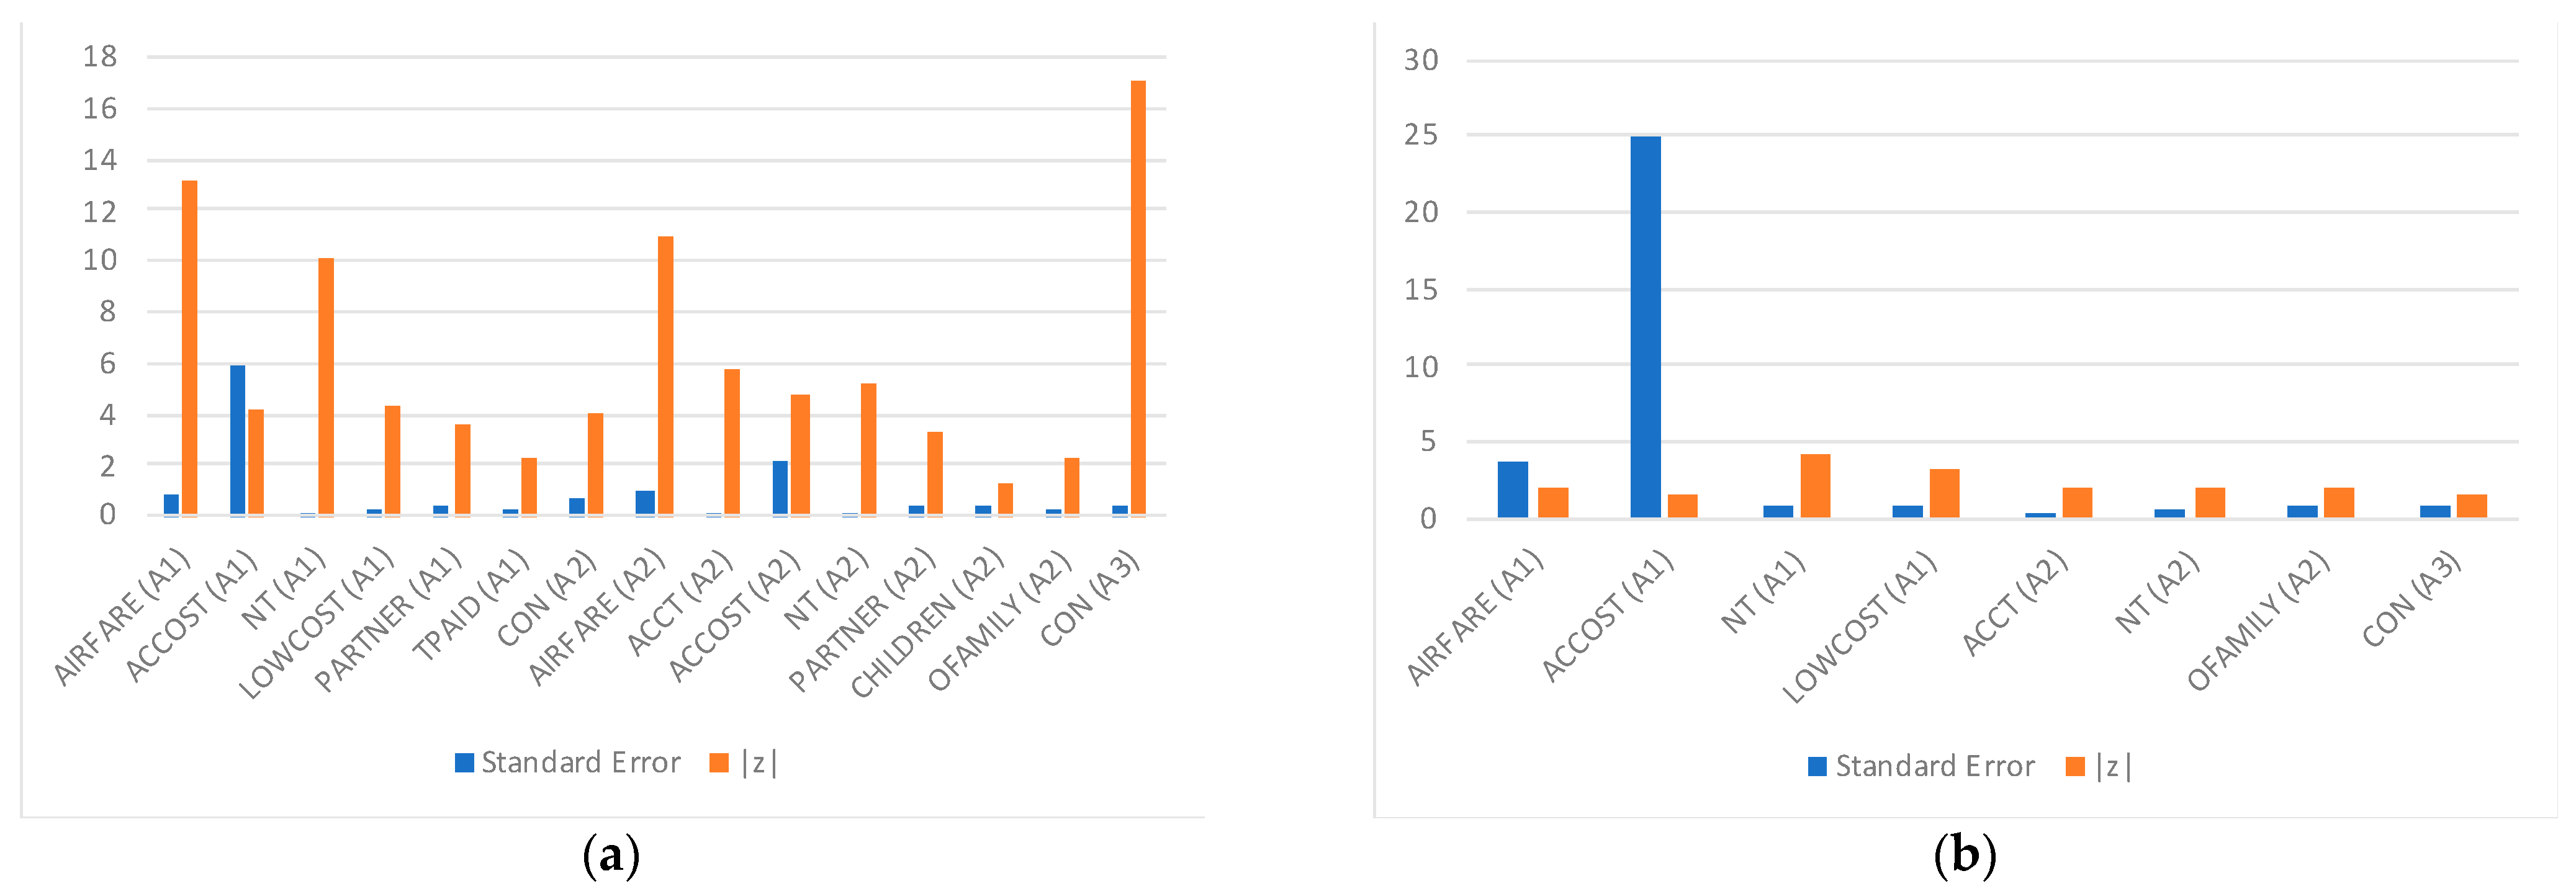
The final estimated model (Table 5 and Figure 2) considers two latent classes as a result of several estimated models with a variable number of classes. It should be noted that, of these two classes, class 1 is the one with the highest probability of belonging (90%), while class 2 has a lower probability (10%). In relation to the validation of the model, we can state that the model fit is very high, achieving a fit of 0.542 (McFadden Pseudo R-squared), which is very high for this type of model. Moreover, all the estimated parameters have consistent signs, and most of them are statistically significant at more than 95% confidence level with the exceptions of the parameters associated with the variables CHILDREN (A2) in class 1 and ACCOST (A1) and CON (A3) in class 2. This means that traveling with children detracts from the usefulness of the choice of airport A2, but its effect is not appreciable, and the same is true for the access time to the nearest airport A1, whose effect is also not appreciable. The low statistical significance for the parameter CON (A3) indicates that for those belonging to class 2, the alternative of not traveling is not considered at all or at least does not depend on any relevant variable.
If we compare class 1 with class 2, we can compare both the signs of the common parameters and their size. Furthermore, by comparing class 1 with class 2, we can see that the only parameter that does not change its weight between the two classes is NT (A2). The rest of the parameters significantly change their weight considering that some of them lose 50% of their value if we compare class 1 to class 2, such as AIRFARE (A1) and ACCT (A2), and others double their value such as ACCOST,(A1) NT(A1), and LOWCOST(A1). There are other attributes that are no longer significant and others that end up influencing class 2 and 1, respectively. The parameter CON(A3) has a very large weight in class 1 and eight times smaller weight in class 2, indicating that users belonging to class 2 have a much lower disutility in choosing not to travel. In the case of the cost of airfare (AIRFARE (A1)), we can see how the perception of the fare is much more negative for users belonging to class 1 (almost twice as negative); the same happens with the cost of access to the A1 airport (ACCOST (A1)) where, despite being larger in absolute value for class 2, it is not statistically significant and also has a very large standard deviation. The number of transfers needed to reach the final destination from A1 is perceived more negatively by class 2 users than by class 1 users, and furthermore, if the flight at A1 is a low-cost flight, the probability of choosing A1 is higher for class 2 users than for class 1 users (more than twice as high). The cost of tickets from airport A2 has a very similar weight to the cost for flights from A1, but this parameter was not found to be significant (and was therefore eliminated) for class 2 users.
The access time to airport 2 is twice as negative for users belonging to class 1 as for those belonging to class 2. The number of transfers required to reach the final destination departing from A2 is perceived in the same way regardless of the class, but it should be noted that its value is less negative than that of NT (A1), which tells us that when traveling from A2, transfers are perceived less negatively than when departing from A1.
Traveling with other members of the household is a disutility for choosing both airports, but evidently the parameter is four times more negative if departing from the more distant airport A2. Only for users belonging to class 1 does the PARTNER variable turn out to be negative and significant for both A1 and A2 departures, which indicates that traveling with a partner reduces the utility of choosing both A1 and A2 airports. The parameter TPAID (a1) indicates that if traveling for work purposes and the trip is paid for by the company, traveling from the nearest airport is usually chosen as an option.
Overall, if we differentiate between the two latent classes, we can conclude that members who are more likely to belong to class 1 have a more negative perception of the costs of travel (both airfare and access costs) and access times. However, those in class 2 perceive more negatively the number of transfers needed to reach the final destination from airport A1 and the fact of traveling with other members of the household from the more distant airport. It seems that the users most likely to belong to class 2 are higher income or business travelers, whereas class 1 is a class that unites most of the travelers who travel for tourism purposes. What is demonstrated is that when traveling with a partner or with other members of the family, there is a tendency to choose the nearest airport, and that the presence of low-cost airlines is obviously an attractive factor in the choice of airport.
6. Conclusions
The main conclusion of this study is that we can identify two main classes of users, with the probability of belonging to class 1 being 90% and that of belonging to class 2 being 10%. Despite this difference, as class 2 are a minority (10% of users), their behavior and preferences can have a significant impact on airport and airline strategies. Class 2 unites higher income users because of the lower weight they attribute to the cost of travel and the cost of access to the furthest airport; these passengers may be less price-sensitive and more attracted by factors such as comfort and efficiency [50,51]. This suggests that differentiation strategies, beyond price, may be effective in attracting this segment of users. For these users, the presence of low-cost airlines is an incentive to travel at the nearest airport with double the weight of class 1 users. The number of transfers to reach the final destination is curiously perceived more negatively if traveling from the nearest airport than from the furthest airport.
Minimizing the number of transfers is therefore generally perceived as positive. For class 2 users, traveling as a family from the furthest airport is perceived as a major disutility, as well as traveling with children or a partner for class 1 users.
Overall, it is clear from the results that in order to improve the competitiveness of nearby airports, it is undoubtedly important to have low-cost airlines with as many direct connections as possible and that these should be alternatives to the connections from the furthest airport. Furthermore, it is important to bear in mind that airport size and parking facilities are factors that can influence the perceived attractiveness of an airport as predicted by authors such as Panou et al. [52].
Another important conclusion is that accessibility to both airports is crucial. It is not only about improving access times, but also about reducing access costs, e.g., through better connectivity with public transport. This underlines the importance of working in partnership with public transport providers and local authorities to improve airport accessibility as a policy to improve interconnectivity.
In relation to the perception of the number of transfers needed to reach the final destination, in order to reduce the negative perception of the number of stopovers and the correlated transfer time, it is important to improve the direct reciprocal connections between the two airports, as it can help to use these airports for transfers between the two airports. A good direct connection between the two nearby airports would not only facilitate the transfer but also facilitate a mutual use as an arrival and/or departure airport depending on the most convenient fares between destinations shared between the two airports, thus creating a competition between the two airports that may favor lower fares.
Finally as a policy recommendation, based on the findings of our study, we propose the following specific and practical recommendations for airport operators and transport authorities: They should consider service differentiation, particularly the inclusion of premium services to attract class 2 users, who prioritize comfort and efficiency over cost. Encouraging the presence of low-cost airlines and the reduction of transfers by adding more direct flights can increase the attractiveness of airports. Airport accessibility is also essential, so it is vital to work together with transport authorities to improve public transport connections and reduce airport access costs, such as parking. Finally, improving direct connections between nearby airports can facilitate transfers and allow mutual use as an arrival and/or departure airport, thus introducing healthy competition that could lead to lower fares. These concrete actions can significantly improve airport choice and the overall traveler experience and provide an interesting starting point as future research lines to test the effect of user behavior by considering different policy actions resulting from the proposals made.
Author Contributions
Conceptualization, L.d.; Methodology, L.d.; Validation, A.R. and S.S.; Formal Analysis, A.R. and S.S.; Investigation, L.d., A.R. and S.S.; Data Curation, A.R.; Writing—Original draft preparation, L.d., S.S. and A.R.; Writing—Review & Editing, L.d., S.S. and A.R.; Visualization, L.d., A.R. and S.S.; Supervision: L.d.; Project Acquisition, L.d.; Funding Acquisition, S.S. All authors have read and agreed to the published version of the manuscript.
Funding
This research has been possible thanks to the Margarita Salas Grant financed with NextGenerationEU funds from the European Union through the “Plan de Recuperación Transformación y Resiliencia” (Recovery, Transformation, and Resilience Plan).
Institutional Review Board Statement
Not applicable.
Informed Consent Statement
Not applicable.
Data Availability Statement
Not applicable.
Conflicts of Interest
The authors declare no conflict of interest.
References
- Fuellhart, K. Airport Catchment and Leakage in a Multi-Airport Region: The Case of Harrisburg International. J. Transp. Geogr. 2007, 15, 231–244. [Google Scholar] [CrossRef]
- Bel, G.; Fageda, X. Privatization, Regulation and Airport Pricing: An Empirical Analysis for Europe. J. Regul. Econ. 2009, 37, 142–161. [Google Scholar] [CrossRef]
- De Moura, F.H.S.; Caetano, M.; Severino, M.R. Airport Competitiveness Analysis From Aircraft and Passenger Movement. J. Transp. Logist. 2020, 5, 143–157. [Google Scholar] [CrossRef]
- Liao, W.; Cao, X.; Li, S. Competition and Sustainability Development of a Multi-Airport Region: A Case Study of the Guangdong–Hong Kong–Macao Greater Bay Area. Sustainability 2019, 11, 2958. [Google Scholar] [CrossRef] [Green Version]
- Suau-Sanchez, P.; Voltes-Dorta, A. Drivers of Airport Scheduled Traffic in European Winter Tourism Areas: Infrastructure, Accessibility, Competition and Catchment Area. J. Air Transp. Manag. 2019, 81, 101723. [Google Scholar] [CrossRef]
- Gardiner, J.M.; Humphreys, I.R.; Ison, S. Freighter Operators’ Choice of Airport: A Three-stage Process. Transp. Rev. 2005, 25, 85–102. [Google Scholar] [CrossRef]
- Heyns, G.J.; Carstens, S. Passenger Choice Decisions at a Regional Airport in South Africa. J. Transp. Supply Chain Manag. 2011, 5, 186–201. [Google Scholar] [CrossRef]
- Percoco, M. Airport Activity and Local Development: Evidence From Italy. Urban Stud. 2010, 47, 2427–2443. [Google Scholar] [CrossRef]
- Dziedzic, M.; Warnock-Smith, D. The Role of Secondary Airports for Today’s Low-Cost Carrier Business Models: The European Case. Res. Transp. Bus. Manag. 2016, 21, 19–32. [Google Scholar] [CrossRef]
- Trojanek, R. The Impact of Aircraft Noise on the Value of Dwellings—The Case of Warsaw Chopin Airport in Poland. J. Int. Stud. 2014, 7, 155–161. [Google Scholar] [CrossRef]
- Gupta, S.; Vovsha, P.; Donnelly, R.M. Air Passenger Preferences for Choice of Airport and Ground Access Mode in the New York City Metropolitan Region. Transp. Res. Rec. J. Transp. Res. Board 2008, 2042, 3–11. [Google Scholar] [CrossRef]
- HE, H.; LIU, S. Study on the Coupling Effect of Airport Land-Side Traffic and Passenger Radiation Range. In Proceedings of the Seventh International Conference on Electromechanical Control Technology and Transportation (ICECTT 2022), Guangzhou, China, 27–29 May 2022; Volume 12302. [Google Scholar]
- Mishra, V.; Dominguez, F.; Lettenmaier, D.P. Urban Precipitation Extremes: How Reliable Are Regional Climate Models? Geophys. Res. Lett. 2012, 39, L03407. [Google Scholar] [CrossRef] [Green Version]
- Wei, M.; Zhang, S.; Sun, B. Airport Passenger Flow, Urban Development and Nearby Airport Capacity Dynamic Correlation: 2006-2019 Time-Series Data Analysis for Tianjin City, China. Electron. Res. Arch. 2022, 30, 4447–4468. [Google Scholar] [CrossRef]
- Falcão, V.A.; da Silva, F.A. Airport Competition in Brazil’s Northeast Region. Res. Soc. Dev. 2022, 11, e21511213454. [Google Scholar] [CrossRef]
- Górecka, A. Factors Influencing Passengers’ Choice of Transport Mode to Warsaw Chopin Airport. Logist. Sustain. Transp. 2016, 7, 51–57. [Google Scholar] [CrossRef] [Green Version]
- Pulugurtha, S.S. Modeling and Evaluating Alternatives to Enhance Access to an Airport and Meet Future Expansion Needs; Mineta Transportation Institute Publications: San José, CA, USA, 2023. [Google Scholar] [CrossRef]
- Vaishnav, M. Opportunities and Obstacles in Obtaining Air Connectivity for Residents of Federally Designated Essential Air Service Communities. Transp. Res. Rec. J. Transp. Res. Board 2011, 2206, 84–91. [Google Scholar] [CrossRef] [Green Version]
- El-Fadel, M.; Chahine, M.; Baaj, H.; Mezher, T. Assessment of Noise Impacts at Airports. Int. J. Environ. Stud. 2002, 59, 447–467. [Google Scholar] [CrossRef]
- Harvey, G. Airport Choice in a Multiple Airport Region. Transp. Res. Part A Gen. Gen. 1987, 21, 439–449. [Google Scholar] [CrossRef]
- Hess, S.; Polak, J.W. Exploring the Potential for Cross-Nesting Structures in Airport-Choice Analysis: A Case-Study of the Greater London Area. Transp. Res. E Logist. Transp. Rev. 2006, 42, 63–81. [Google Scholar] [CrossRef] [Green Version]
- Ben-Akiva, M.; Mcfadden, D.; Train, K.; Walker, J.; Bhat, C.; Bierlaire, M.; Bolduc, D.; Boersch-Supan, A.; Brownstone, D.; Bunch, D.S.; et al. Hybrid Choice Models: Progress and Challenges. Mark. Lett. 2002, 13, 163–175. [Google Scholar] [CrossRef] [Green Version]
- Bergantino, A.S.; Capurso, M.; Hess, S. Modelling Regional Accessibility to Airports Using Discrete Choice Models: An Application to a System of Regional Airports. Transp. Res. Part A Policy Pract. 2020, 132, 855–871. [Google Scholar] [CrossRef]
- Hao, J.; Zhang, L.; Ji, X.; Wu, X.; Liu, L. Investigating the Accessibility Between Civil Airports and Tourist Locations in Tourist Cities in Yunnan Province, China. Sustainability 2020, 12, 3963. [Google Scholar] [CrossRef]
- Murça, M.C.R.; Correia, A.R. Análise Da Modelagem Da Escolha Aeroportuária Em Regiões de Múltiplos Aeroportos. J. Transp. Lit. 2013, 7, 130–146. [Google Scholar] [CrossRef]
- Pratt, S.; Zeng, C.Y.H. The Economic Value and Determinants of Tourists’ Counterfeit Purchases: The Case of Hong Kong. Tour. Econ. 2019. [Google Scholar] [CrossRef]
- Hult, G.T.M.; Morgeson, F.V.; Morgan, N.A.; Mithas, S.; Fornell, C. Do Managers Know What Their Customers Think and Why? J. Acad. Mark. Sci. 2016, 45, 37–54. [Google Scholar] [CrossRef]
- Chen, J.; Li, S. Mode Choice Model for Public Transport With Categorized Latent Variables. Math. Probl. Eng. 2017, 2017, 7861945. [Google Scholar] [CrossRef] [Green Version]
- Wang, Z.-Q.; Lu, J.; Cheng, L. A New Approach to Identify the Target Market of New Gateway Airports. In IOP Conference Series: Materials Science and Engineering; IOP Publishing: Bristol, UK, 2019. [Google Scholar] [CrossRef]
- Zhang, Y.; Xie, Y. Small Community Airport Choice Behavior Analysis: A Case Study of GTR. J. Air Transp. Manag. 2005, 11, 442–447. [Google Scholar] [CrossRef]
- Wu, W.; Daziano, R.A. On Assignment to Classes in Latent Class Logit Models. Transp. Res. Rec. J. Transp. Res. Board 2022, 2677, 1137–1150. [Google Scholar] [CrossRef]
- Yu, J.W. Outbound Air Travelers’ Airport Choice Model Using Aggregate Observation Data. J. Korean Soc. Transp. 2018, 36, 392–401. [Google Scholar] [CrossRef]
- Ubogu, A.E. Determinants of Passengers’ Choice: A Case Study of Mallam Aminu Kano International Airport (Nigeria). Int. J. Traffic Transp. Eng. 2013, 3, 230–242. [Google Scholar] [CrossRef] [Green Version]
- Muñoz, C.; Córdoba, J.; Sarmiento, I. Airport Choice Model in Multiple Airport Regions. J. Airl. Airpt. Manag. 2017, 7, 1–12. [Google Scholar] [CrossRef]
- Tien, S.-L.; Schonfeld, P. Passenger Market Equilibrium for Competing Airports in Multiple Airport Region. Transp. Res. Rec. J. Transp. Res. Board 2007, 2007, 13–21. [Google Scholar] [CrossRef]
- Reynolds, T.; Barrett, S.F.; Dray, L.; Evans, A.; Köhler, M.O.; Morales, M.T.V.; Schäfer, A.; Winebrake, J.J.; Britter, R.; Hallam, H.; et al. Modelling Environmental and Economic Impacts of Aviation: Introducing the Aviation Integrated Modelling Project. In Proceedings of the 7th AIAA ATIO Conf, 2nd CEIAT Int’l Conf on Innov and Integr in Aero Sciences, 17th LTA Systems Tech Conf; followed by 2nd TEOS Forum, Belfast, Northern Ireland, 18–20 September 2007. [Google Scholar] [CrossRef] [Green Version]
- Kouwenhoven, M. The Role of Accessibility in Passengers’ Choice of Airports. OECD/ITF Joint Transport Research Centre, Discussion Papers. 2008; Volume 36, pp. 1–36. Available online: https://www.oecd-ilibrary.org/transport/the-role-of-accessibility-in-passengers-choice-of-airports_235278552305 (accessed on 6 August 2023). [CrossRef]
- Gosling, G.D. Predictive Reliability of Airport Ground Access Mode Choice Models. Transp. Res. Rec. J. Transp. Res. Board 2006, 1951, 69–75. [Google Scholar] [CrossRef]
- Rose, J.M.; Bliemer, M.C.J. Constructing Efficient Stated Choice Experimental Designs. Transp. Rev. 2009, 29, 587–617. [Google Scholar] [CrossRef]
- Louviere, J.J.; Hensher, D.A.; Swait, J.D.; Adamowicz, W. Stated Choice Methods: Analysis and Applications; Cambridge University Press: Cambridge, UK, 2000; ISBN 9780521788304. [Google Scholar]
- ChoiceMetrics. Ngene 1.2 User Manual & Reference Guide; ChoiceMetrics, Ed.; ChoiceMetrics: Sydney, Australia, 2018. [Google Scholar]
- INE Padrón Municipal de Habitantes (Municipal Register of Inhabitants). Available online: https://www.ine.es/dyngs/INEbase/es/categoria.htm?c=Estadistica_P&cid=1254734710990 (accessed on 6 August 2023).
- Hensher, D.A.; Rose, J.M.; Greene, W.H. Applied Choice Analysis; Cambridge University Press: Cambridge, UK, 2015; ISBN 9781107092648. [Google Scholar]
- Sivey, P. The Effect of Waiting Time and Distance on Hospital Choice for English Cataract Patients. Health Econ. 2011, 21, 444–456. [Google Scholar] [CrossRef] [PubMed] [Green Version]
- Greene, W.H.; Hensher, D.A. Revealing Additional Dimensions of Preference Heterogeneity in a Latent Class Mixed Multinomial Logit Model. Appl. Econ. 2013, 45, 1897–1902. [Google Scholar] [CrossRef] [Green Version]
- Wen, C.-H.; Huang, W.; Fu, C.; Chou, P.-Y. A Latent Class Generalised Nested Logit Model and Its Application to Modelling Carrier Choice With Market Segmentation. Transp. A Transp. Sci. 2013, 9, 675–694. [Google Scholar] [CrossRef]
- Liljenstolpe, C. Demand for Value-Added Pork in Sweden: A Latent Class Model Approach. Agribusiness 2010, 27, 129–146. [Google Scholar] [CrossRef]
- Lidbe, A.; Adanu, E.K.; Tedla, E.; Jones, S.J.M. Role of Passengers in Single-Vehicle Drunk-Driving Crashes: An Injury-Severity Analysis. Safety 2020, 6, 30. [Google Scholar] [CrossRef]
- Karlõševa, A.; Nõmmann, S.; Nõmmann, T.; Urbel-Piirsalu, E.; Budziński, W.; Czajkowski, M.; Hanley, N. Marine Trade-Offs: Comparing the Benefits of Off-Shore Wind Farms and Marine Protected Areas. Energy Econ. 2016, 55, 127–134. [Google Scholar] [CrossRef] [Green Version]
- Bellizzi, M.G.; Eboli, L.; Mazzulla, G. An Online Survey for the Quality Assessment of Airlines’ Services. Res. Transp. Bus. Manag. 2020, 37, 100515. [Google Scholar] [CrossRef]
- Eboli, L.; Bellizzi, M.G.; Mazzulla, G. A Literature Review of Studies Analysing Air Transport Service Quality from the Passengers’ Point of View. Promet. Traffic Transp. 2022, 34, 253–269. [Google Scholar] [CrossRef]
- Panou, K.; Panou, K. Factors Influencing Car Users Propensity to Shift to Other Modes and Their Impacts on Demand for Airport Parking Facilities. J. Airl. Airpt. Manag. 2014, 4, 26–47. [Google Scholar] [CrossRef]
Figure 1.
Example of the survey for choosing between alternatives.

Figure 2.
Standard error and |z| for variables in latent class (a) class 1 (b) class 2.


Table 1.
Stated Preference Survey Scenarios by Purpose: Leisure.
| Variable Definition | Variable Name | Scenarios | |||||
|---|---|---|---|---|---|---|---|
| 1 | 2 | 3 | 4 | 5 | 6 | ||
| Cost of airfare from airport A1 (€) | AIRFARE (A1) | 360 | 160 | 120 | 240 | 120 | 300 |
| Access time to the airport A1 (min) | ACCT (A1) | 5 | 30 | 30 | 15 | 30 | 15 |
| Access Cost to the airport A1 (€) | ACCOST (A1) | 0 | 5 | 5 | 12 | 0 | 12 |
| Cost of airfare from airport A2 (€) | AIRFARE (A2) | 360 | 240 | 240 | 160 | 300 | 160 |
| Access time to the airport A2 (min) | ACCT (A2) | 90 | 75 | 75 | 60 | 75 | 60 |
| Access Cost to the airport A2 (€) | ACCOST (A2) | 180 | 12 | 15 | 0 | 15 | 0 |
Table 2.
Stated Preference Survey Scenarios by Purpose: Business.
| Variable Definition | Variable Name | Scenarios | |||||
|---|---|---|---|---|---|---|---|
| 7 | 8 | 9 | 10 | 11 | 12 | ||
| Cost of airfare from airport A1 (€) | AIRFARE (A1) | 300 | 360 | 160 | 80 | 80 | 240 |
| Access time to the airport A1 (min) | ACCT (A1) | 15 | 30 | 5 | 5 | 5 | 15 |
| Access Cost to the airport A1 (€) | ACCOST (A1) | 12 | 24 | 24 | 24 | 0 | 5 |
| Cost of airfare from airport A2 (€) | AIRFARE (A2) | 120 | 80 | 360 | 300 | 80 | 120 |
| Access time to the airport A2 (min) | ACCT (A2) | 75 | 90 | 90 | 60 | 90 | 60 |
| Access Cost to the airport A2 (€) | ACCOST (A2) | 0 | 180 | 12 | 180 | 15 | 12 |
Table 3.
Data relating to the two airports involved in the study.
| Santander | Bilbao | |
|---|---|---|
| Pasengers per year | 1,102,439 | 5,129,583 |
| Number of flights (year) | 11,258 | 44,919 |
| Distance to city center (km) | 5.6 | 12.8 |
| Boarding gates | 4 | 12 |
| Boarding desks | 8 | 36 |
| Parking spaces | 740 | 3596 |
Table 4.
Summary of the main results of the user characterization survey.
| Traveling Purpose | Gender | Age | Occupation | Number of Journeys | Income | Travel Mode | |||||||
|---|---|---|---|---|---|---|---|---|---|---|---|---|---|
| Leisure | 82% | Female | 56% | <25 | 37% | Full time | 48% | 0–2 Journeys/year | 63% | <EUR 900/month | 24% | Always alone | 4.1% |
| Part time | 11% | ||||||||||||
| 25–34 | 8% | ||||||||||||
| EUR 900–1500/month | 19% | Normally alone | 10.6% | ||||||||||
| Occasional work | 2% | ||||||||||||
| 35–44 | 20% | With friends | 23.7% | ||||||||||
| 3–5 Journeys/year | 23% | ||||||||||||
| Unemployed | 3% | With couple | 32.7% | ||||||||||
| EUR 1500–2500/month | 20% | ||||||||||||
| Business | 18% | Male | 44% | 45–54 | 24% | Student | 29% | ||||||
| >EUR 2500/month | 17% | With children | 6.2% | ||||||||||
| House work | 3% | ||||||||||||
| >6 Journeys/year | 14% | ||||||||||||
| 55–64 | 9% | With family | 20.4% | ||||||||||
| Pensioner | 1% | ||||||||||||
| No answer | 20% | With work mates | 2.1% | ||||||||||
| >65 | 2% | ||||||||||||
| Other | 3% | ||||||||||||
Table 5.
Latent class logit model.
| Variable | Coefficent | Standard Error | z |
|---|---|---|---|
| Random Utility Parameter in Class 1 | |||
| AIRFARE (A1) | −11.229 | 0.854 | −13.150 |
| ACCOST (A1) | −24.501 | 5.911 | −4.140 |
| NT (A1) | −1.393 | 0.139 | −10.050 |
| LOWCOST (A1) | 0.943 | 0.219 | 4.300 |
| PARTNER (A1) | −1.504 | 0.428 | −3.520 |
| TPAID (A1) | 0.609 | 0.264 | 2.310 |
| CON (A2) | 2.742 | 0.676 | 4.050 |
| AIRFARE (A2) | −10.718 | 0.981 | −10.930 |
| ACCT (A2) | −0.048 | 0.008 | −5.710 |
| ACCOST (A2) | −10.207 | 2.151 | −4.750 |
| NT (A2) | −0.818 | 0.158 | −5.190 |
| PARTNER (A2) | −1.480 | 0.442 | −3.350 |
| CHILDREN (A2) | −0.400 | 0.335 | −1.200 |
| OFAMILY (A2) | −0.453 | 0.204 | −2.220 |
| CON (A3) | −7.910 | 0.463 | −17.070 |
| Random Utility Parameter in Class 2 | |||
| AIRFARE (A1) | −6.891 | 3.673 | −1.980 |
| ACCOST (A1) | −35.812 | 24.854 | −1.440 |
| NT (A1) | −2.865 | 0.671 | −4.270 |
| LOWCOST (A1) | 2.476 | 0.767 | 3.230 |
| ACCT (A2) | −0.019 | 0.009 | −2.030 |
| NT (A2) | −0.889 | 0.458 | −1.960 |
| OFAMILY (A2) | −1.693 | 0.807 | −2.100 |
| CON (A3) | −0.988 | 0.692 | −1.430 |
| Estimated Latent Class Probabilities | |||
| P_Class_1 | 0.906 | 0.019 | 48.310 |
| P_Class_2 | 0.094 | 0.019 | 5.020 |
| Log likelihood function | −791.67288 | ||
| Restricted log likelihood | −1727.01852 | ||
| McFadden Pseudo R-squared | 0.542 | ||
| AIC/N | 1038 | ||
| Number of Observations | 1572 | ||
Disclaimer/Publisher’s Note: The statements, opinions and data contained in all publications are solely those of the individual author(s) and contributor(s) and not of MDPI and/or the editor(s). MDPI and/or the editor(s) disclaim responsibility for any injury to people or property resulting from any ideas, methods, instructions or products referred to in the content. |
© 2023 by the authors. Licensee MDPI, Basel, Switzerland. This article is an open access article distributed under the terms and conditions of the Creative Commons Attribution (CC BY) license (https://creativecommons.org/licenses/by/4.0/).
Share and Cite
MDPI and ACS Style
dell’Olio, L.; Rodríguez, A.; Sipone, S. Modeling Airport Choice Using a Latent Class Logit Model. Aerospace 2023, 10, 703. https://doi.org/10.3390/aerospace10080703
AMA Style
dell’Olio L, Rodríguez A, Sipone S. Modeling Airport Choice Using a Latent Class Logit Model. Aerospace. 2023; 10(8):703. https://doi.org/10.3390/aerospace10080703
Chicago/Turabian Styledell’Olio, Luigi, Andrés Rodríguez, and Silvia Sipone. 2023. "Modeling Airport Choice Using a Latent Class Logit Model" Aerospace 10, no. 8: 703. https://doi.org/10.3390/aerospace10080703
Note that from the first issue of 2016, this journal uses article numbers instead of page numbers. See further details here.