Article

Parametric Approach to Assessing Performance of High-Lift Device Active Flow Control Architectures

Aerospace Systems Design Laboratory, School of Aerospace Engineering, Georgia Institute of Technology, Atlanta, GA 30332, USA
*
Author to whom correspondence should be addressed.
Aerospace 2017, 4(1), 6; https://doi.org/10.3390/aerospace4010006
Submission received: 16 December 2016 / Revised: 27 January 2017 / Accepted: 3 February 2017 / Published: 10 February 2017
(This article belongs to the Special Issue Aircraft Design (SI-1/2017))

Abstract

:
Active Flow Control is at present an area of considerable research, with multiple potential aircraft applications. While the majority of research has focused on the performance of the actuators themselves, a system-level perspective is necessary to assess the viability of proposed solutions. This paper demonstrates such an approach, in which major system components are sized based on system flow and redundancy considerations, with the impacts linked directly to the mission performance of the aircraft. Considering the case of a large twin-aisle aircraft, four distinct active flow control architectures that facilitate the simplification of the high-lift mechanism are investigated using the demonstrated approach. The analysis indicates a very strong influence of system total mass flow requirement on architecture performance, both for a typical mission and also over the entire payload-range envelope of the aircraft.

Graphical Abstract

1. Introduction

Active Flow Control (AFC) has been the focus of considerable research effort due to the potential aircraft-level performance benefits that can result from its successful incorporation. The fundamental principle of AFC is to improve aircraft performance by modifying the airflow surrounding the vehicle through the addition of an acceptable amount of flow energy. Recent work in this field has included theoretical studies [1,2,3], experimental research [4,5], and some flight-test demonstrations [6,7].
One attractive AFC application is its use to augment the performance of the aircraft high-lift devices [2,3]. The high-lift system, even with considerable design refinement over the past few decades [8], continues to add significant weight to the aircraft and is also maintenance-intensive. There is also a drag penalty due to the flap fairings [2] which must be incorporated on the underside of the wings to house parts of the complex flap retraction/extension mechanism. Application of AFC may be beneficial in this regard if it permits a transition from the current slotted flap designs to simply-hinged flap designs, with the resulting aerodynamic performance shortfall recovered through the operation of the AFC system. Due to mechanical simplification, a simply-hinged flap allows for flap mechanism weight savings compared to, for instance, a single-slotted flap. Further, the simpler and more compact kinematics of a simply-hinged flap permit the elimination of the flap fairings currently found in the high-lift systems of existing commercial transports. This in turn results in a significant reduction in the drag experienced in flight [3]. At the same time, incorporation of the High-Lift Active Flow Control (HLAFC) subsystem imposes some penalties on performance due to weight and system power requirements.
The net impact of such subsystem architecture changes on a mission-level metric such as fuel consumption occurs through multiple avenues, as shown in Figure 1. For the same mission profile, the impact of weight changes (first avenue) is to alter the induced drag (and thus, the thrust required to offset it) and also the thrust required to overcome inertia while accelerating or climbing. Similarly, changes in zero-lift drag directly affect the thrust requirement. The third and fourth avenues of Figure 1 account for changes in the non-propulsive (secondary) power consumption by the subsystem architecture. Changes in these power off-takes, either in the form of bleed air or shaft-power from the engines or Auxiliary Power Unit (APU), result in a change in the specific fuel consumption (rate of fuel consumption per unit thrust or power produced).
For the case of HLAFC, since the period of system operation (takeoff and landing phases) is only a small fraction of the total mission duration, the HLAFC system’s mass and drag impacts are assumed in this work to be much more significant than the secondary power requirements. However, it is not immediately obvious how the mass additions due to the HLAFC system compare in magnitude to the mass reduction due to flap mechanism simplification. Therefore, in addition to considering the drag and mass reduction of the flap mechanism, this work explicitly ties the sizing of major HLAFC system components to the system’s mass flow requirements.
The mass flow requirements themselves are not immediately obvious either. In fact, a review of past work by other researchers [2,3] reveals predicted mass flow requirements that are not only of considerable magnitude, but which are sensitive to modeling assumptions, actuator positioning, etc. It is clear that such predictions, especially when made with only the limited information available in early design phases, are subject to considerable uncertainty. Therefore, this work, rather than using a single mass flow rate estimate for the HLAFC system, assesses its performance over a sweep (range) of mass flow rates.
The high mass flow rates predicted in previous works [2,3] pose another significant challenge in that they are beyond the bleed supply capabilities of the main engines and the APU. This work, therefore, considers external ram air as an additional air supply source, and shaft-power extraction (as opposed to only bleed air extraction) as an additional secondary power source. In fact, large enough system mass flow requirements may necessitate the use of multiple air supply sources and secondary power types. This leads to multiple architecture possibilities for the HLAFC system, of which this work considers four.
Since conventional aircraft do not possess AFC solutions, weight relationships developed from regressions of historical data that have traditionally been used in early design are of limited use. Therefore, evaluating the performance of such architectures necessitates a physics-based approach, which is undertaken in this work. The system-level assessments presented as part of the demonstrated approach are obtained using the Rapid Architecture Tradeoff Environment (RATE), an Excel-based tool that facilitates the propagation of subsystem architecture changes to corresponding vehicle and mission-level impacts (Section 2). Though its scope is not restricted to the analysis of any particular subsystems, this work focuses exclusively on the sizing of HLAFC architecture components for a large twin-aisle aircraft (Section 3). This integrated approach allows a comparative assessment of the overall fuel consumption impacts of the four HLAFC architectures considered over the mass flow rate sweep, as well as the impact of HLAFC incorporation on payload-range capabilities (Section 4).

2. An Overview of the Rapid Architecture Tradeoff Environment (RATE)

The Rapid Architecture Tradeoff Environment (RATE) was created for the system level assessment of various subsystem architectures. The environment consists of three modules which are described in the following subsections. The data flow between the modules is illustrated in Figure 2. The main user interface of RATE (Figure 3) is primarily built in Microsoft Excel, where the analyst specifies the aircraft point performance and mission performance requirements and also parametrically defines one or more subsystem architectures to be analyzed. The function of the subsystem tabs is to perform a physics-based sizing of relevant subsystem components and determine changes in aircraft empty weight, parasite drag, and engine thrust-specific fuel consumption arising due to the subsystems. The net impact of these effects on the aircraft’s performance for both design and off-design missions is then ascertained. RATE also offers the option to re-size the aircraft in response to subsystem-driven impacts. The three main modules of RATE are described in the following section.

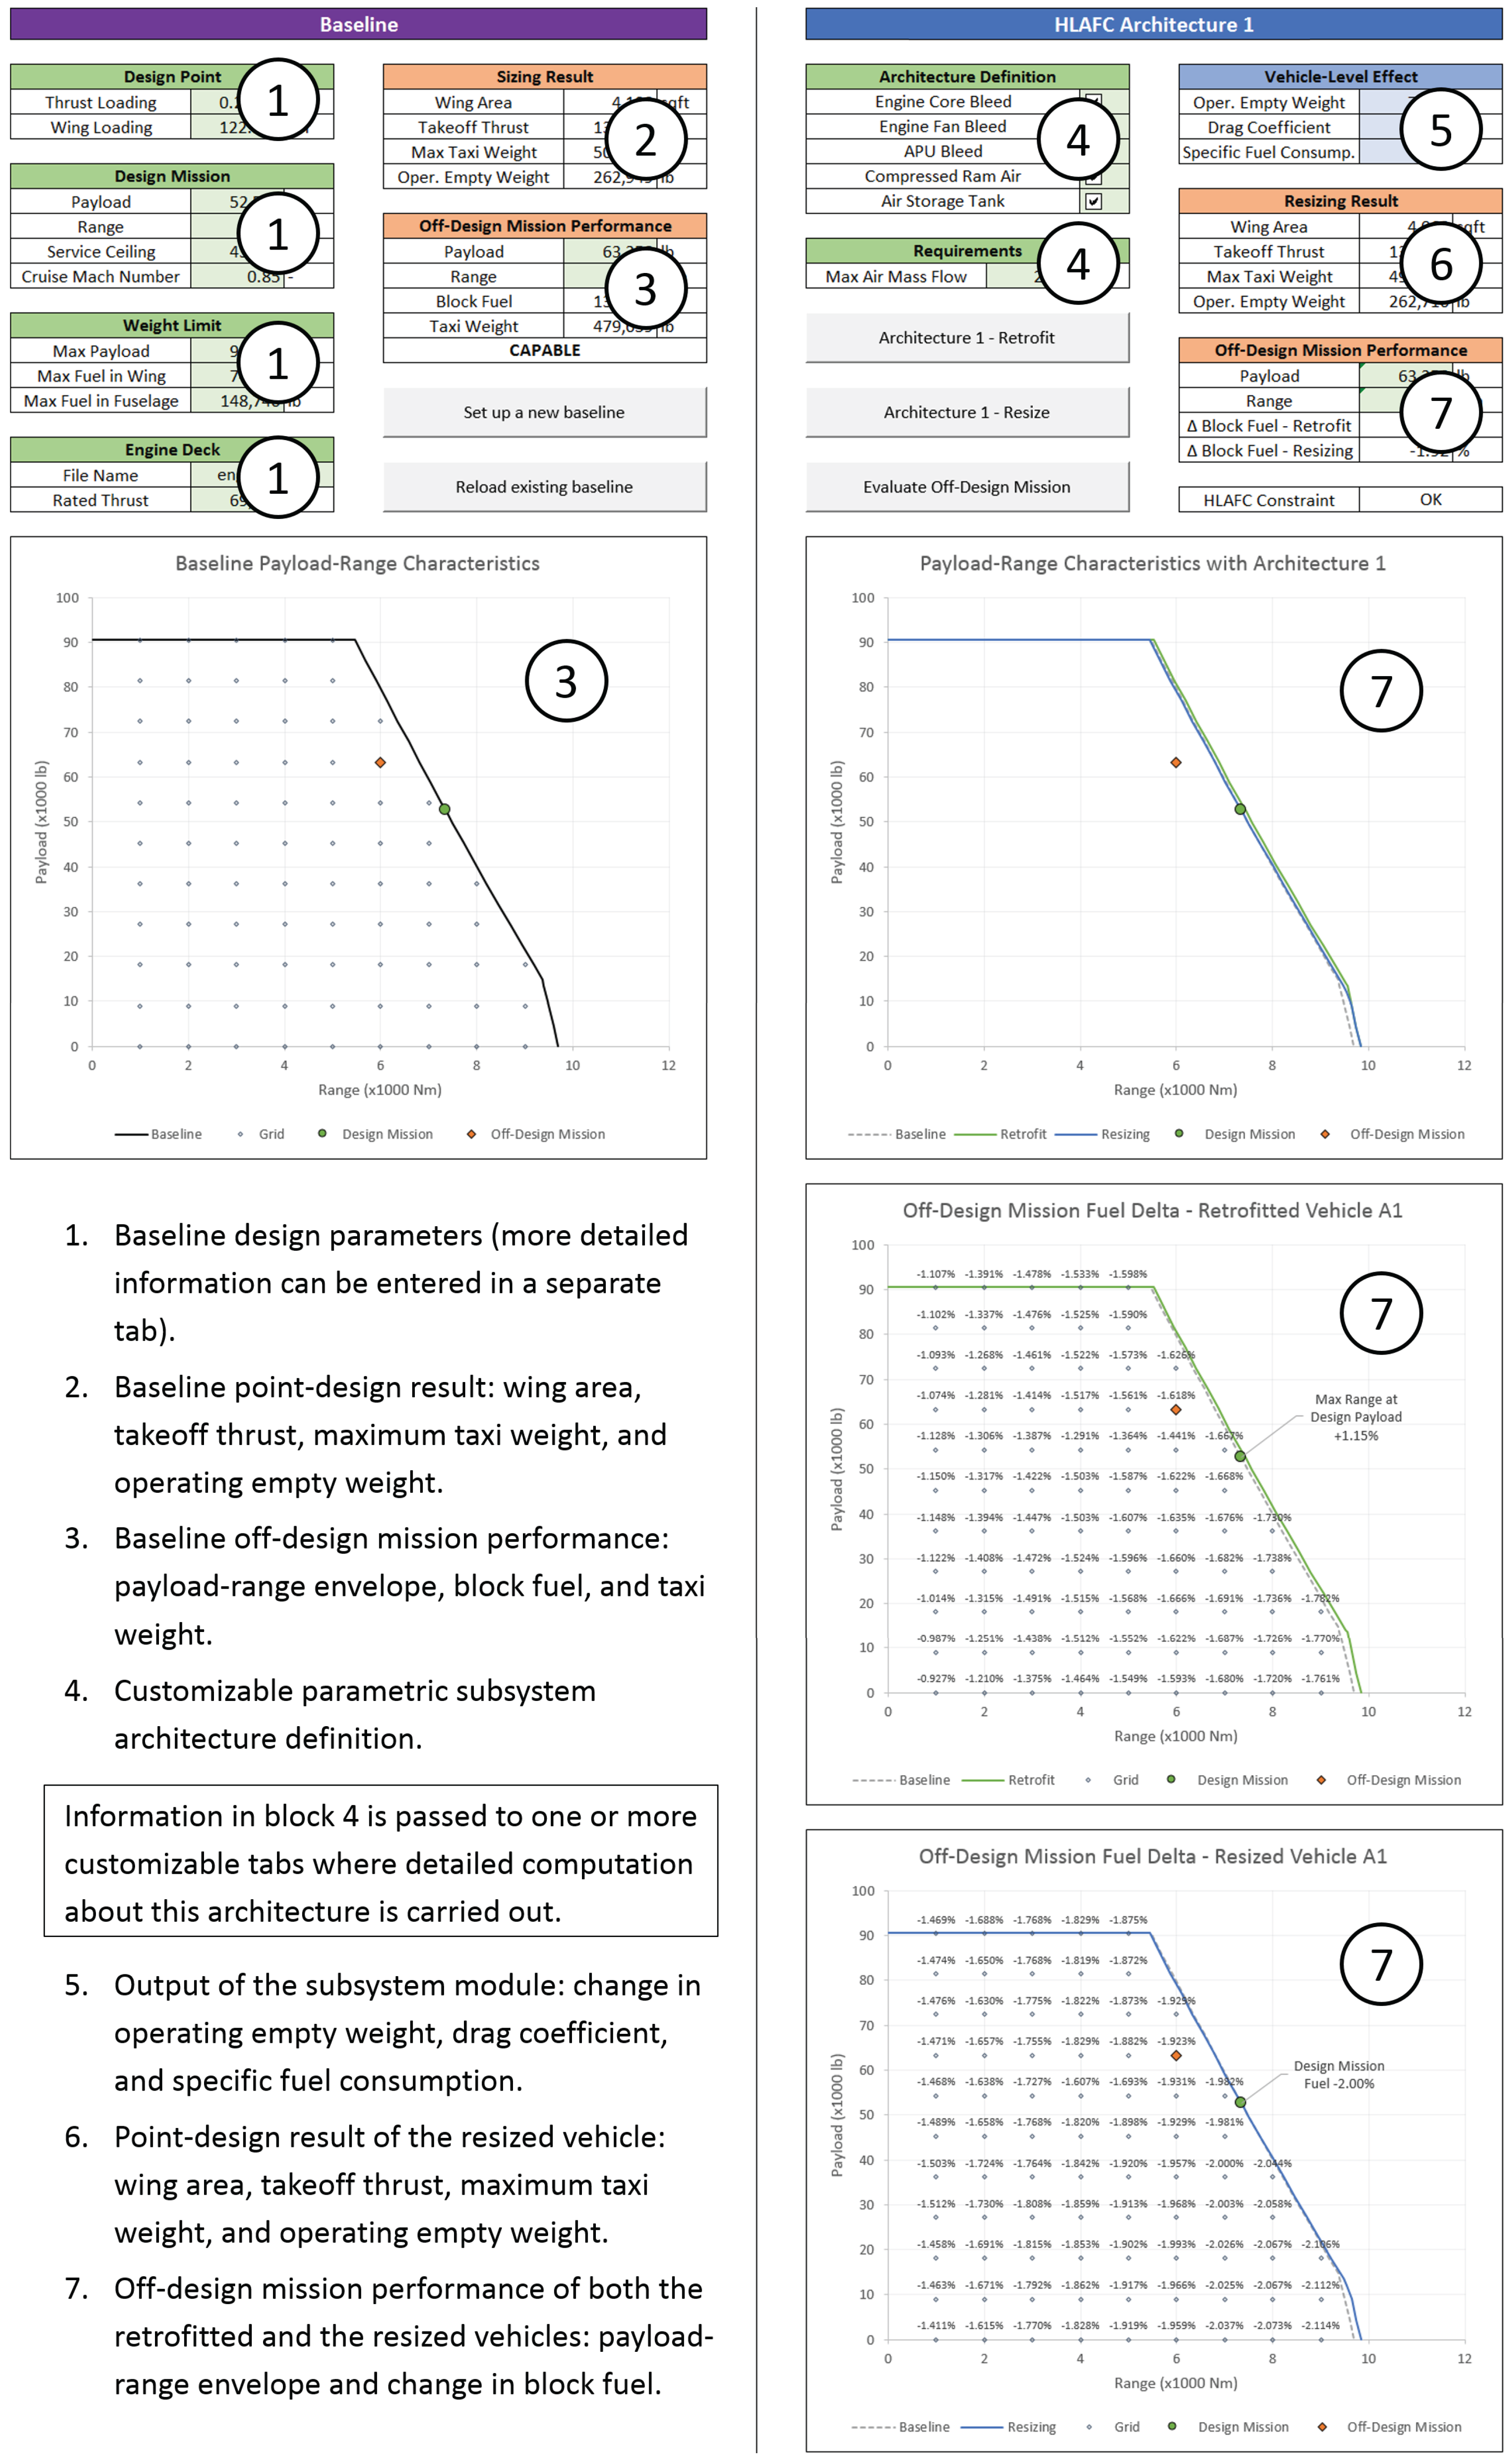
2.1. Conventional Aircraft Sizing and Mission Performance Evaluation

This module receives key aircraft design parameters, including the takeoff thrust-to-weight ratio, T S L / W T O , the takeoff wing loading, W T O / S W , the design payload weight, W P , the design range, R, a mission profile, and a prescribed parametric engine deck which can be resized within limits to fit the aircraft’s mission thrust requirements. Additional information related to vehicle geometry and weight buildup computation can also be specified on a separate tab as required. A mission performance analysis is first performed for an aft-tailed tube-and-wing jet-powered commercial transport aircraft with conventional subsystem architecture. The main outputs of this module include the sizing results such as the wing area, S W , the required sea-level static thrust, T S L , the maximum takeoff weight, W T O , and the operating empty weight, W E . Other outputs including the instantaneous thrust, vehicle gross weight, fuel burn, lift, and drag are also available for processing in the other modules.
In addition to the point design result, based on the input weight limits including the maximum payload weight, W P , max , and maximum fuel capacity, W F , max , off-design mission analyses are also performed at different payload levels to predict the corresponding maximum ranges of the baseline vehicle. A chart of payload-range characteristics is generated to visualize the payload-range envelope of the baseline vehicle. Within the payload-range envelope, off-design mission analyses are performed at different payload-range combinations to obtain the corresponding takeoff gross weight and fuel required. The performance of the baseline aircraft (with conventional subsystem architecture) thus established serves as the reference (or datum) for comparing the relative performance of non-conventional subsystem architectures.
Both the sizing and off-design mission analyses in this module are performed using Flight Optimization System (FLOPS), a legacy tool developed by NASA Langley Research Center (Hampton, VA, USA) [9]. The aircraft weight buildup relationships within FLOPS are based on regressions of historical data, and therefore apply to conventional subsystem architectures. The engine performance data tables (engine decks) used by FLOPS are generated using the industry-standard Numerical Propulsion System Simulation (NPSS) [10] tool. NPSS is not directly integrated with RATE, but is instead used off-line to generate engine deck files which can be imported into RATE and used in the FLOPS sizing and mission performance analyses. The architectures considered in this work were evaluated using a single engine deck generated using NPSS for a Large Twin-asile Aircraft (LTA) thrust-class engine. Changes in APU or engine cycle design parameters that may be necessitated by changes in magnitudes of secondary power extraction were not considered within the scope of this work.

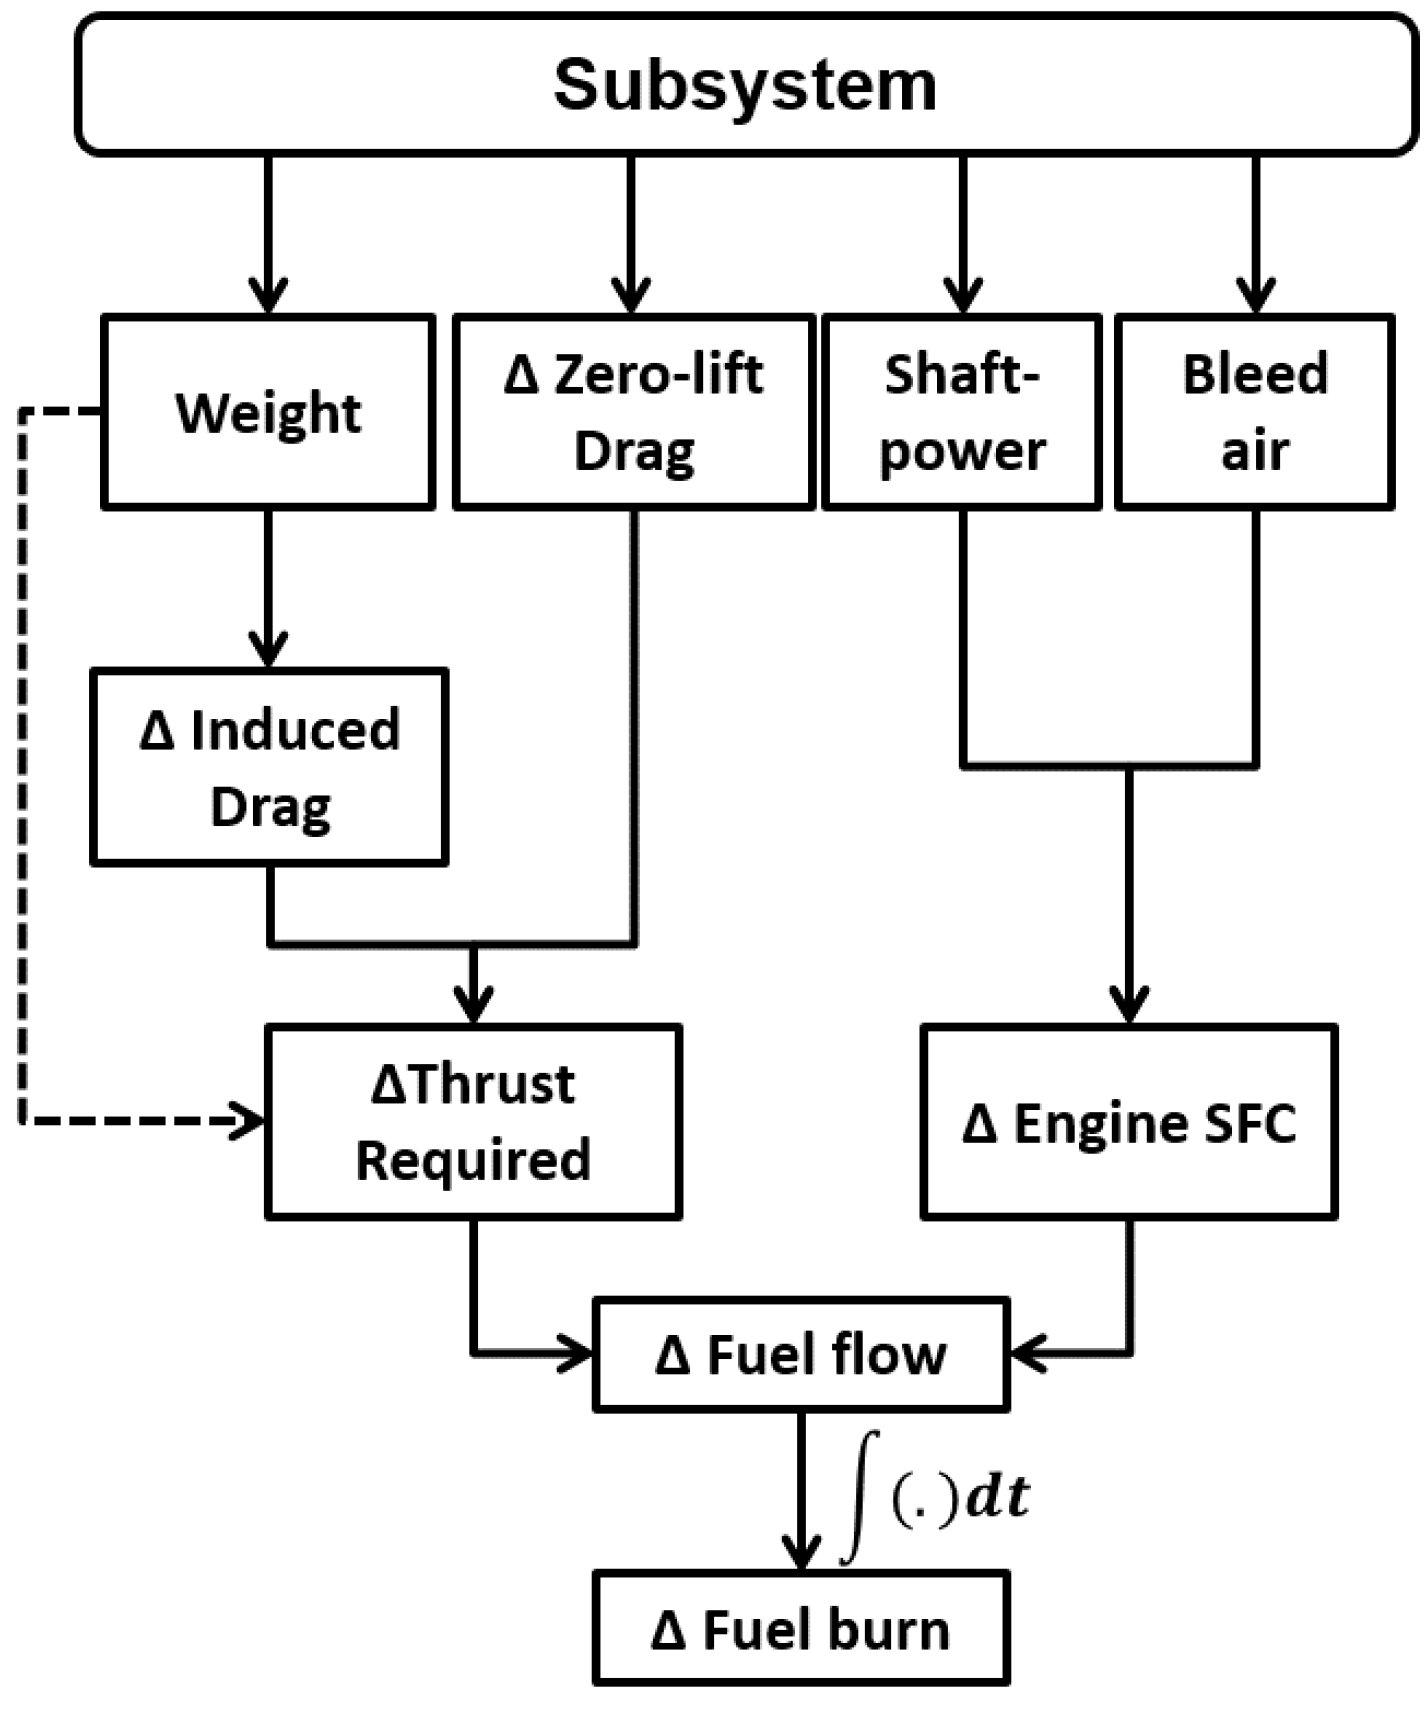
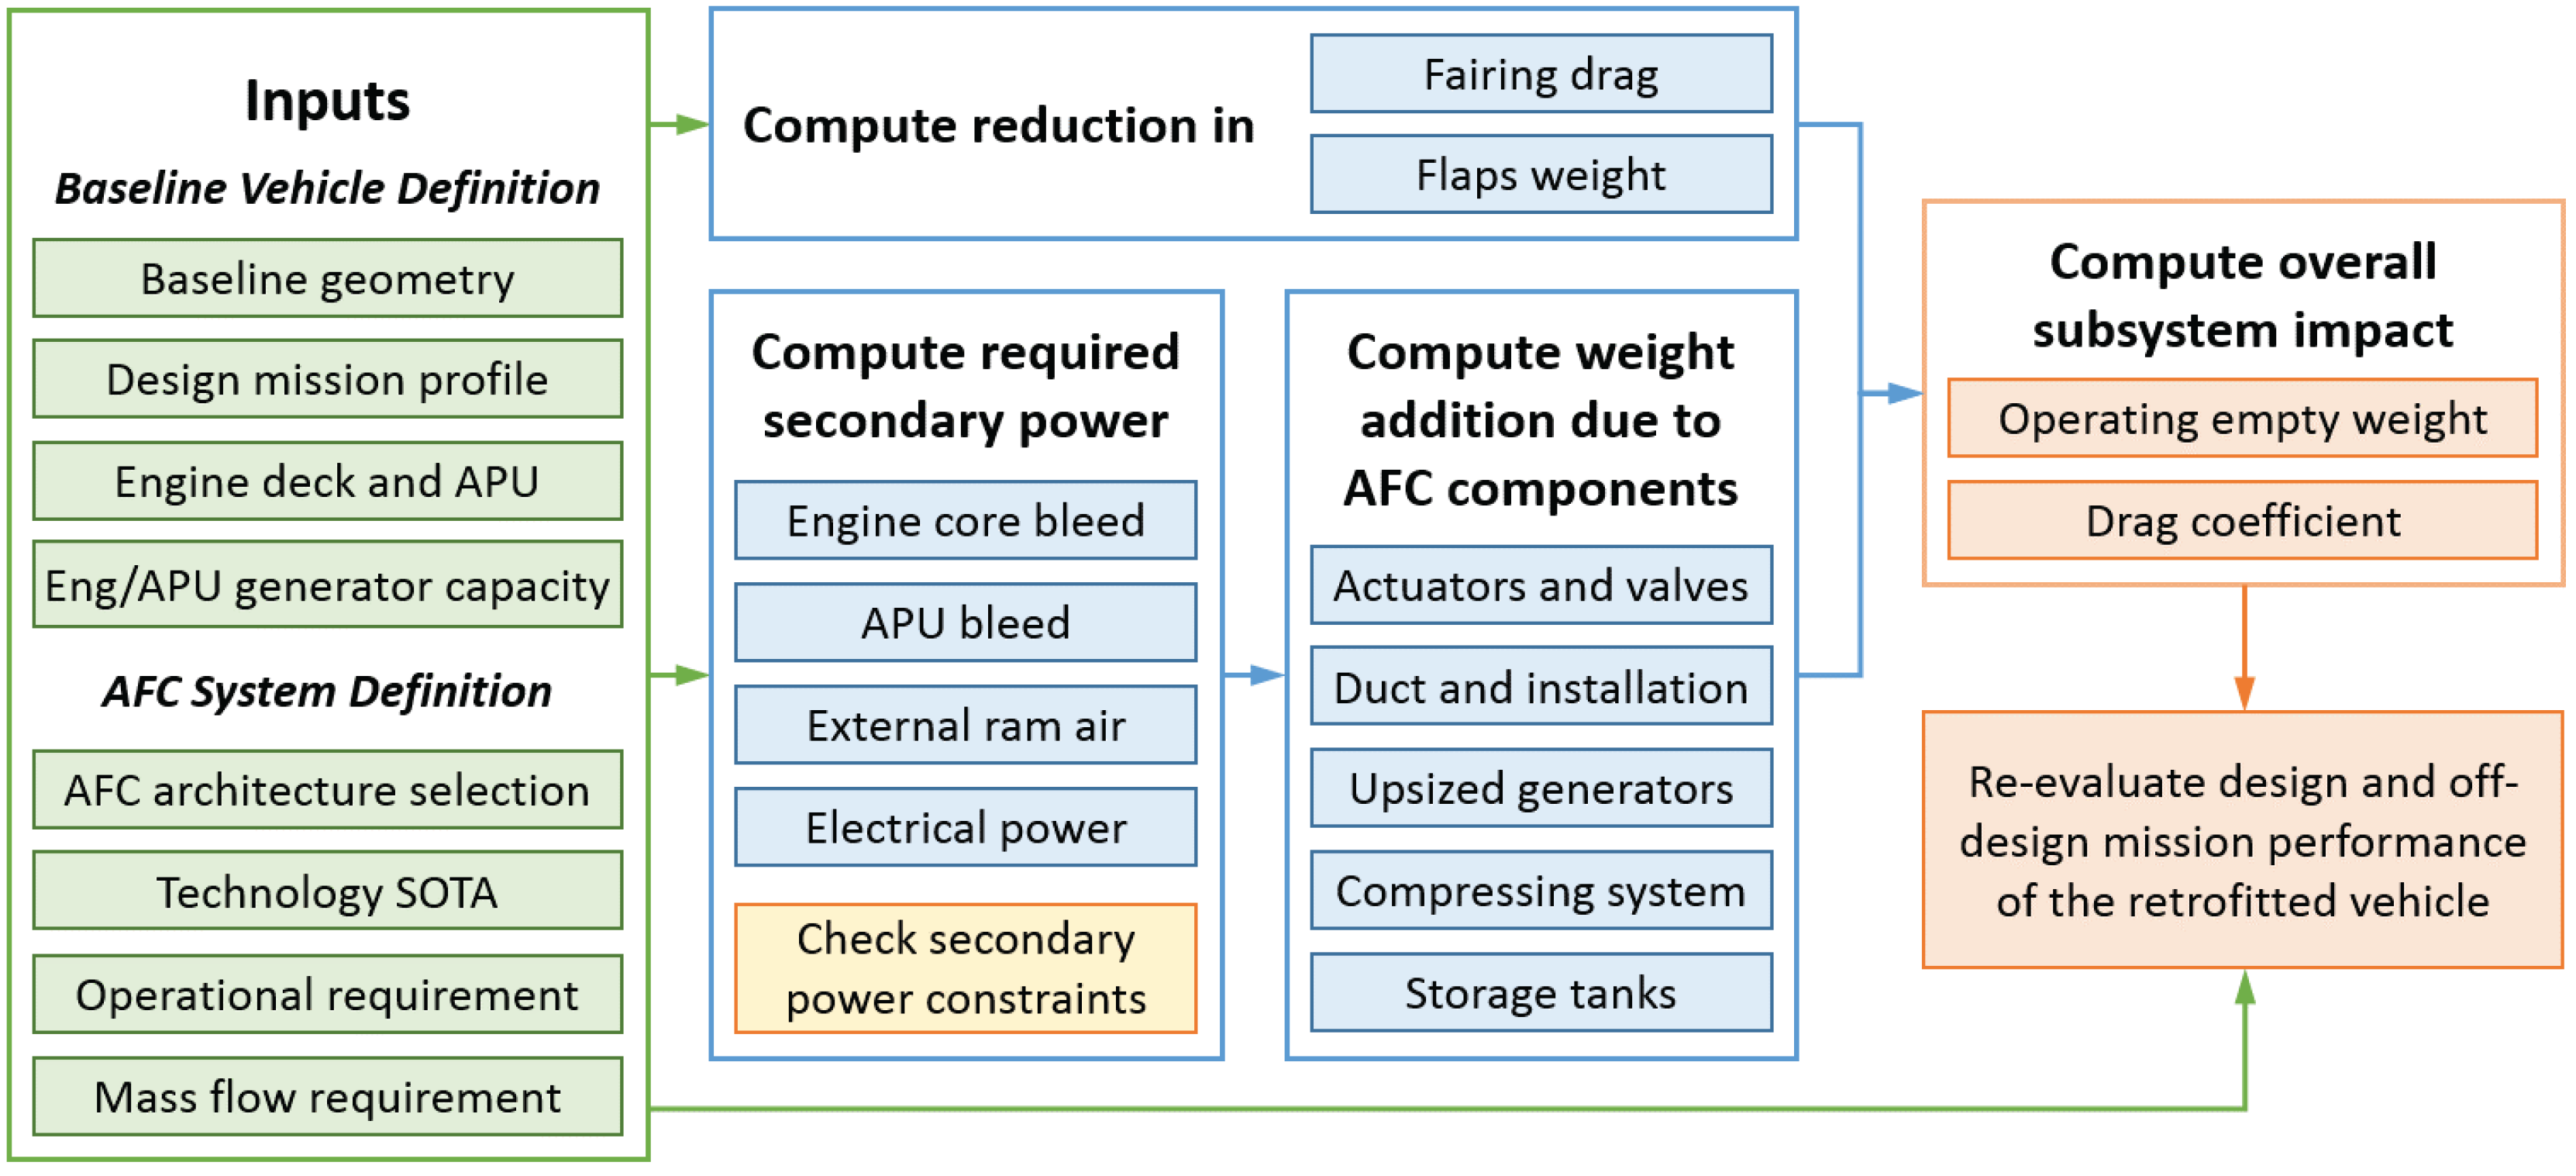
2.2. Subsystem Analysis

This module allows customized and parametric definition of many subsystem architectures, which are tabulated in their dedicated tabs. As shown in Figure 2, each subsystem in this module receives its architecture definition from the main user interface. With this and the baseline aircraft definition, the major components within the architecture are then sized, and the subsystem non-propulsive power requirements and drag impacts (if applicable) are assessed. Each subsystem may be analyzed individually, but the subsystem tabs may also communicate with each other to account for interactions between them. Outputs of this module include three adjustment factors: change in vehicle empty weight, Δ W E , change in time-averaged drag coefficient, Δ C D , and change in time-averaged thrust-specific fuel consumption, Δ c t , all relative to the conventional baseline. The adjustment factors generated by each subsystem tab are then summed up and passed to Module #3, in order to assess the impact on the aircraft’s mission performance.
Computation of the subsystem characteristics as described above is subsystem-specific, and may be carried out either in Excel or using other tools which can be interfaced through a data link with Excel. The assessment of HLAFC architectures in the current work uses a combination of the above. The subsystem characteristics are mainly computed in Excel, while sizing of certain components that require time-domain simulation is performed using MATLAB scripts (The Mathworks, Inc., Natik, MA, USA) which are called by Excel through Visual Basic for Applications (VBA) using Spreadsheet Link. Detailed HLAFC subsystem analysis flow is presented subsequently in Section 3.

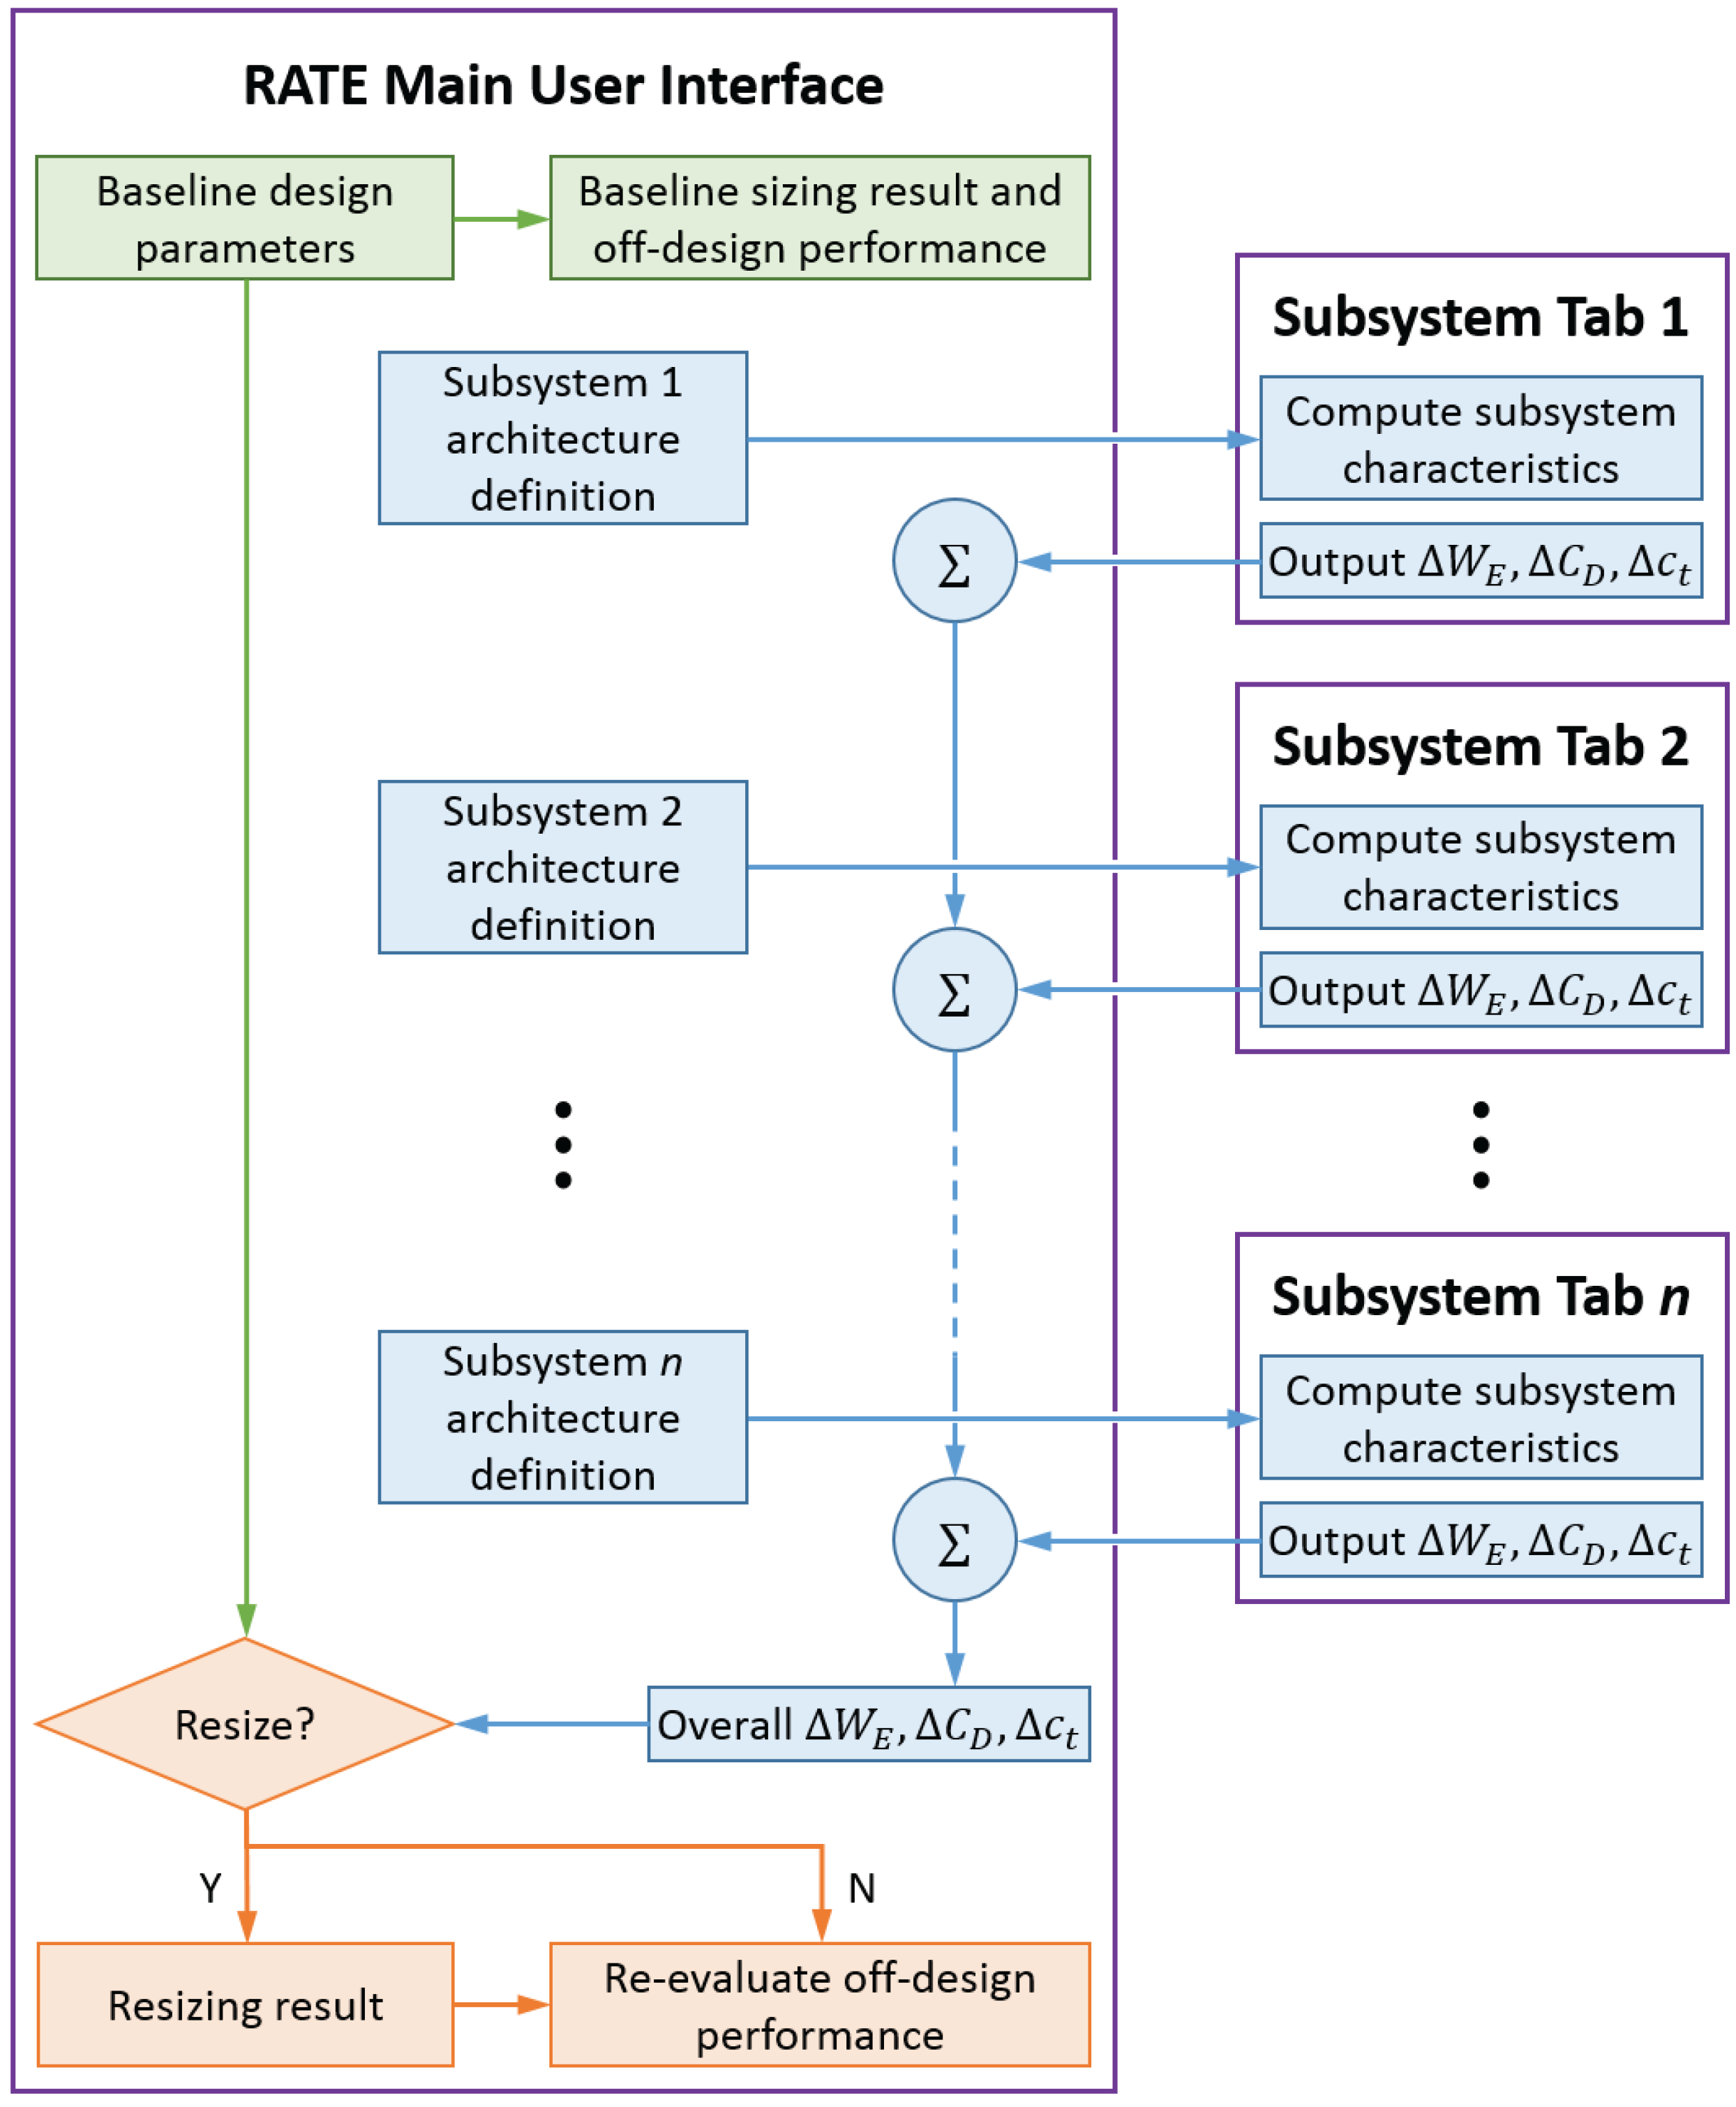
2.3. Retrofit and/or Resizing Impact Assessment

This module re-evaluates the mission performance using the outputs from the subsystem analysis module ( Δ W E , Δ C D , and Δ c t ) to assess the impact of the subsystem architecture. In this regard, there are two possible scenarios:
  • Scenario 1: The vehicle may be assumed to be retrofitted, in which case the weight limits (maximum takeoff weight, maximum payload weight, and maximum fuel capacity), essential geometry (fuselage, wing and tail), and engine deck are held invariant. The weight difference due to the subsystem architecture, Δ W E , is directly added to the baseline operating empty weight, W E , to obtain an updated operating empty weight of the retrofitted vehicle. With changes in empty weight, drag, and fuel consumption, the maximum range of the retrofitted vehicle at each payload level is re-computed to generate an updated payload-range envelope, and mission performance may be re-evaluated at different payload-range combinations. Note that the retrofitted vehicle may or may not be able to fly the original design range when carrying the design payload. Primary outputs of the retrofit scenario include payload-range characteristics with updated fuel consumption, takeoff gross weight, and change in the fuel required to fly specified off-design missions.
  • Scenario 2: The vehicle may be assumed to be resized, for the same design mission as with the baseline, using the same sizing method except that the weight buildup relationships, the drag coefficient, and the specific fuel consumption are modified according to the output from the subsystem analysis module (Module # 2). The resized vehicle maintains the same takeoff thrust-to-weight ratio, takeoff wing loading, design payload weight, design range, and maximum payload weight. However, depending on the subsystem impacts, the operating empty weight, the maximum takeoff weight, the wing area, the sea-level static thrust, and the maximum fuel capacity may be different from those of the conventional baseline. Off-design mission analysis is performed similar to that in the retrofit scenario, and the outputs include an updated payload-range envelope, and updated fuel consumption, takeoff gross weight, and change in fuel required at each specified off-design mission.
The approach to HLAFC architecture assessment demonstrated in this work corresponds to Scenario 1. Therefore, each AFC-equipped architecture retains the same maximum takeoff weight, maximum payload weight, maximum fuel capacity, maximum takeoff and landing lift coefficients, wing and tail planform areas, and engine thrust rating as the conventional (non-AFC equipped) baseline. As mentioned previously, the impact of mass and drag changes driven by the HLAFC system outweigh those due to its power draw while in operation. Therefore, the architecture assessments involve the computation of Δ W E and Δ C D but not Δ c t . The extraction of additional bleed or shaft-power offtake from the engines results in a loss in thrust. Since the thrust rating of the engines is not changed, the loss of thrust due to HLAFC operation results in a degradation of takeoff field length for the AFC-equipped aircraft (as seen in [2,3]).

3. High-Lift Active Flow Control (HLAFC) Sizing and Analysis Approach

To assess the system level effect of HLAFC technology on the vehicle-level performance, an LTA baseline is first established. Some of its relevant characteristics are tabulated in Table 1. This conventional baseline is not equipped with HLAFC, and serves as the reference point for comparing the considered AFC-equipped architectures.
The sizing and analysis approach demonstrated for the HLAFC system is illustrated in Figure 4. The inputs for the sizing and analysis include (1) the baseline aircraft definition, including geometry, weights, mission profile, and secondary power capabilities, and (2) the definition of the HLAFC system, including the architecture, and assumptions for system component technology state-of-the-art (SOTA), operational parameters, and the system total mass flow rate requirement. Due to the previously-mentioned uncertainty and difficulty in accurately predicting the system mass flow requirement, the approach adopted in this work is to generate additional insight by assessing each considered HLAFC architecture over a range of assumed mass flow requirements. The following sections expand on the HLAFC architectures considered within the scope of this work, the sizing approach for major system components, and the performance assessment of the AFC-equipped aircraft architectures. A summary of assumed technological SOTA, material properties, etc., is presented in Appendix Table A1.

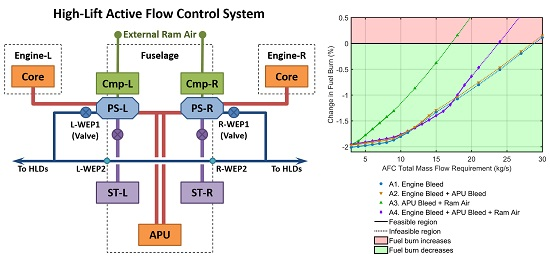
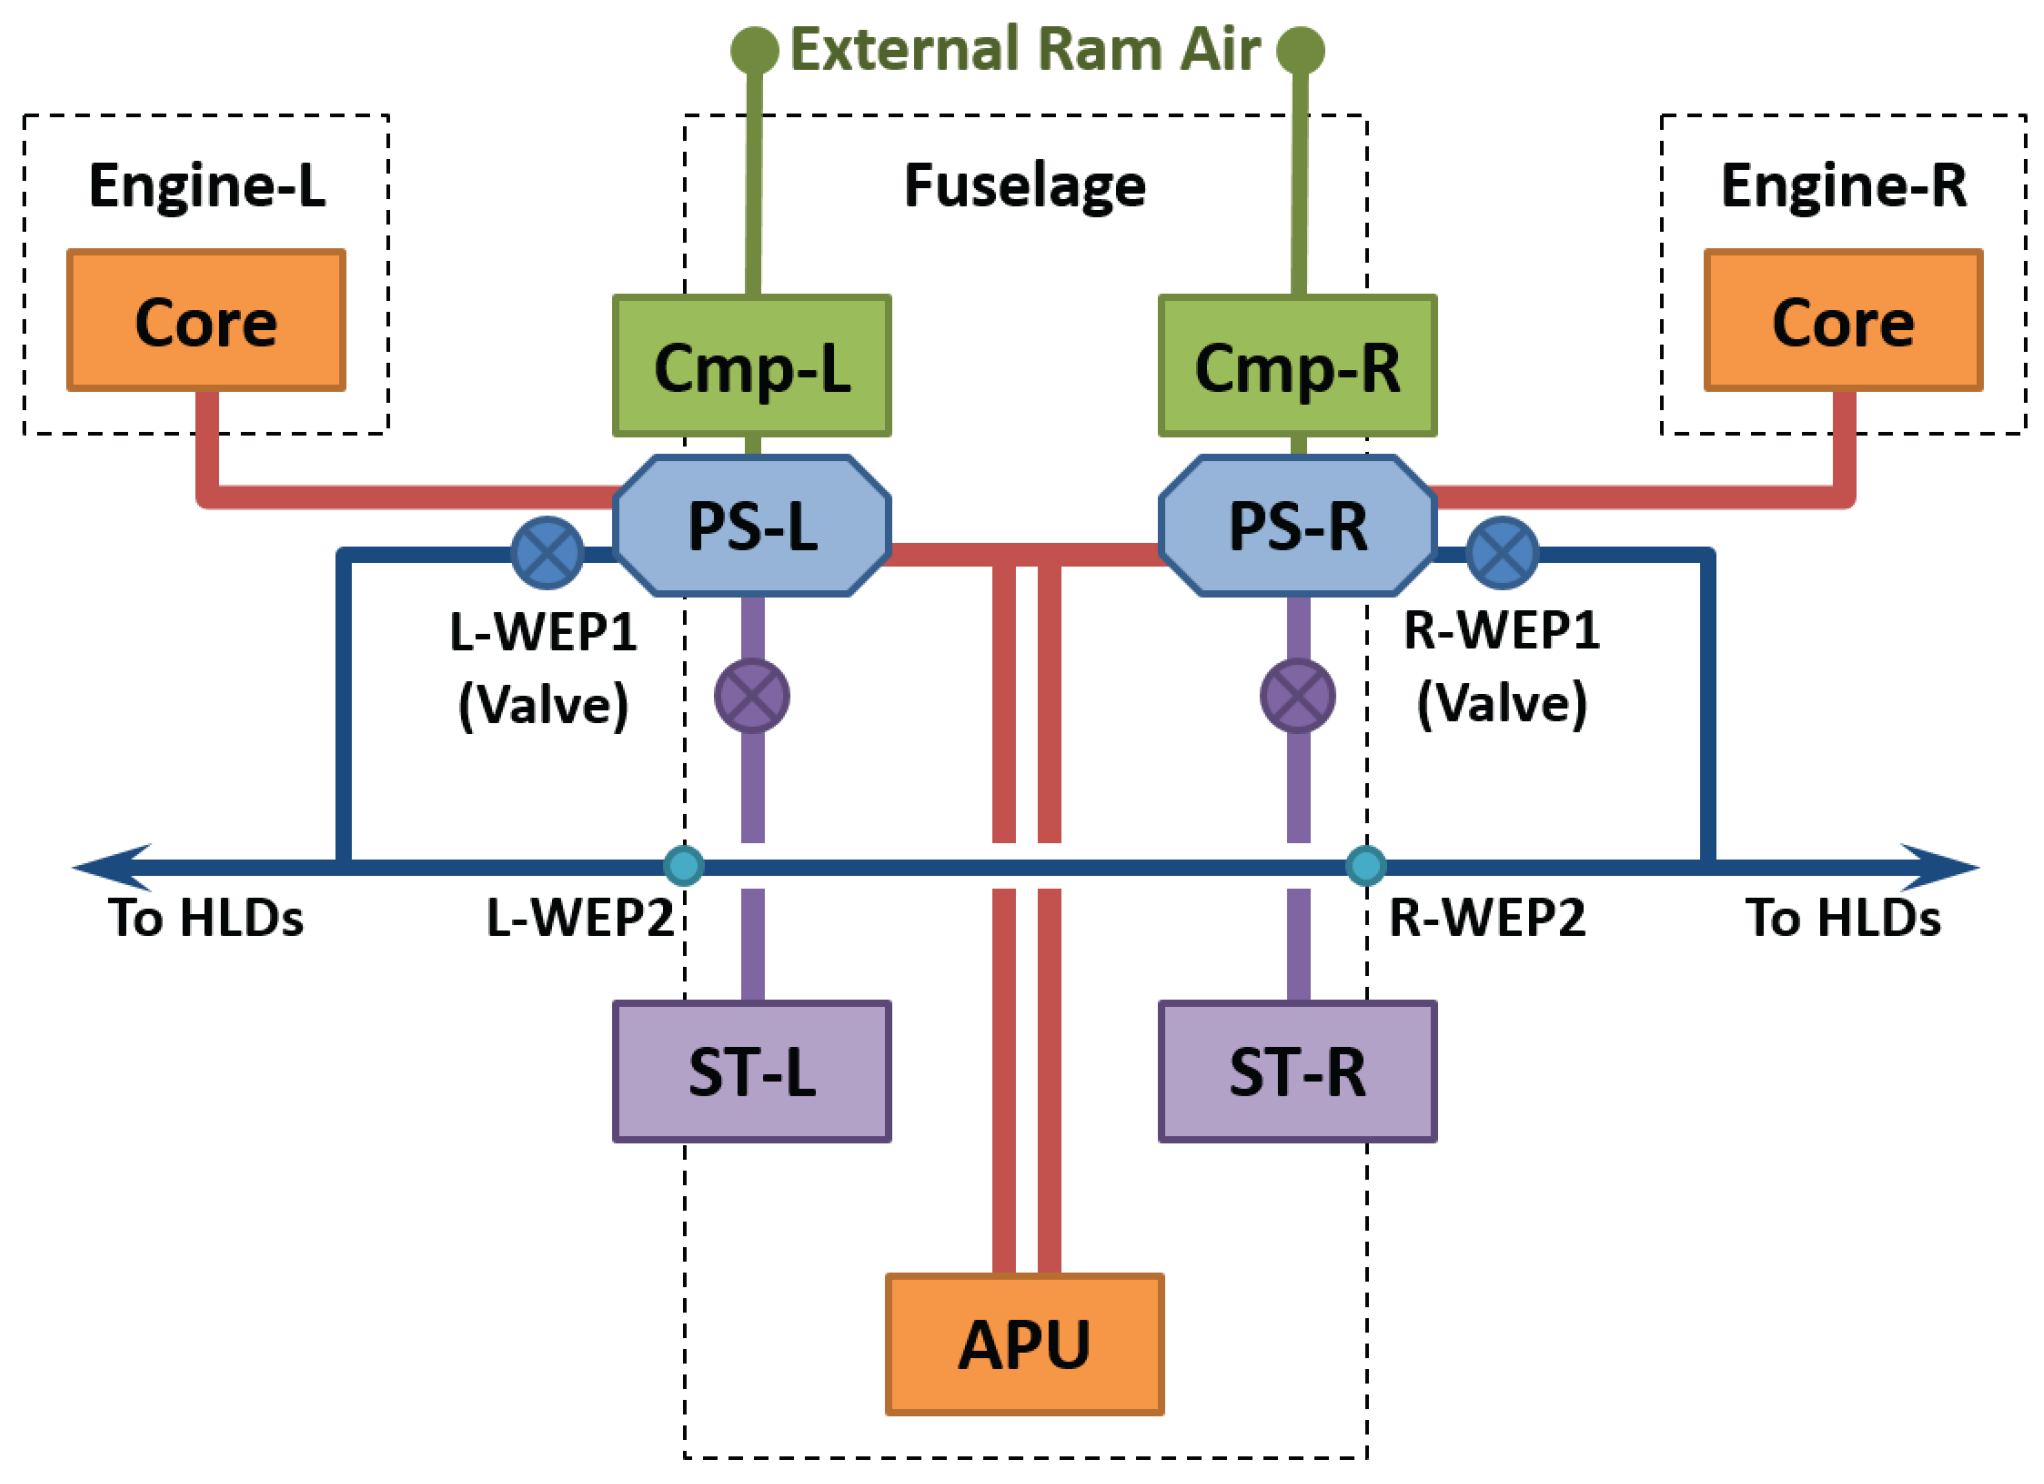
3.1. HLAFC Architectures Considered

For the HLAFC architectures, pneumatically-powered sweeping jet actuators are considered. These are positive net mass flow actuators which augment aerodynamic performance by introducing high-energy flow. These actuators, therefore, require a supply of air at the necessary pressure and temperature in order to function. Existing users of pneumatic power on-board the aircraft (such as the environmental control system and ice protection system) use bleed air extracted from the main engines or the Auxiliary Power Unit (APU). The most obvious possibility, therefore, is to supply the HLAFC system with bleed air coming from either the main engines, or the APU, or both. In fact, recent flight test demonstrations that showcased AFC applied to the vertical tail used APU bleed air to supply the AFC actuators [6,7].
There are, however, certain challenges that must be overcome in this regard. First, the industry is currently trending towards the reduction of bleed air off-takes through More Electric Aircraft architectures [11]. This applies to both bleed from the main engines and the APU. Second, the bleed air capabilities of the APU are intended to be sufficient for powering the environmental control system on the ground and for engine starting, and as such, are not of considerable magnitude [1]. Third, and pertaining specifically to AFC-augmented high-lift systems, prior analyses by other researchers [2,3] have estimated system bleed air requirements that are in excess of the bleed extraction capabilities of the main engines and the APU.
In light of the above, and especially if HLAFC bleed air requirements are sufficiently high, additional sources of air supply must be considered. One possibility is to use externally admitted ram air, which is currently used as a heat sink for the aircraft’s environmental control system [11]. In addition to ram drag penalties and the need to size larger ram air inlets to admit higher flow rates, another challenge arises from the fact that the pressure of the incoming ram air is insufficient for supplying the AFC system. Therefore, external ram air must be compressed to the appropriate pressure using compressors that are electrically powered by the main engine and/or APU generators. Further, high enough mass flow requirements may necessitate the simultaneous usage of multiple supply sources for the HLAFC system.
In this work, four different HLAFC architectures (A1–A4) are considered and summarized in Table 2. A1 uses engine core bleed exclusively, while A2 adds the full bleed capability of the APU. A3 uses APU bleed but not engine core bleed, and electrically compressed external ram air . Finally, A4 uses all the three possibilities for supplying the HLAFC system. For architectures where the APU and ram air are used simultaneously (A3 and A4), only APU bleed air off-take is considered and not APU shaft-power off-take.
Regardless of the type of secondary power used to supply the HLAFC system, physical upper limits exist on the magnitudes of bleed air and shaft-power that can be extracted. The bleed air capabilities of the engines (13.2 kg/s total [12]) and the APU (3.2 kg/s total [1]) were identified from public domain data (summarized in Appendix A, Table A1). The nominal mass flow requirements of the environmental control system and ice protection system were subtracted from the engine maximum bleed capability to obtain the maximum engine bleed available for the HLAFC system. In a similar manner, the existing electrical demands from in-flight entertainment and galleys were subtracted from the baseline electrical generator capacity ( 2 × 120 kVA [13]) to obtain the electrical power available for the HLAFC system. If this proves insufficient, an upper bound of 2 × 2 × 250 kVA [11] was also imposed to limit the maximum up-sizing possible for the engine generators.
The general order of utilizing the secondary power sources is (1) APU bleed → (2) engine bleed → (3) ram air, i.e., APU bleed is fully utilized first if used in an architecture. Each source involved in a given architecture is loaded in this sequence until a constraint (maximum bleed air flow or electrical generator capacity) becomes active. If a system mass flow requirement cannot be realized without satisfying all constraints, then the architecture becomes infeasible. In this case, the excess mass flow is still allocated to the last source being loaded, and HLAFC component sizing and aircraft mission performance analyses are still performed. However, the architecture is flagged as being overall infeasible due to constraint violation.
In addition to the supply sources, the connectivity of major system components within the HLAFC architectures must also be explicitly considered from the point of view of redundancy. Conventional state-of-the-art high-lift devices are centrally actuated, mechanically synchronized, and electronically monitored [8], and have a proven reliability record. Further, the high-lift system is not flight-critical given the safeguards that are implemented as part of current design practice to prevent flap asymmetry and inadvertent system operation [14]. Moreover, once deployed, the aerodynamic performance of conventional high-lift devices is not contingent upon continued operability of the actuation mechanism.
For AFC-augmented high-lift devices, however, the aerodynamic benefit (augmentation) requires the continuous supply of air to the AFC actuators. Providing a reliable and uninterrupted air supply despite the possible occurrence of system faults necessitates the incorporation of redundant system components, as illustrated in Figure 5. This illustration shows all three sources of air supply in use, and thus corresponds directly to A4. For the other architectures (A1–A3), it is clear from the illustration that connectivity to certain supply sources may be eliminated.
As depicted in Figure 5, the redundancy concerns influenced the duplication of major system components through an essential mirroring of the system into left (L) and right (R) halves. This extends to the pneumatic systems (PS), the electric compressors (Cmp), and the APU supply duct. Further, cross-ducting allows supply sources (e.g., engine or external ram air) located on one side to supply the actuators on the other side following a system fault or failure of the supply sources on that side. This pneumatic synchronization is akin to the mechanical synchronization seen in conventional high-lift systems, and is necessary to ensure continued symmetric lift augmentation for both wings following the occurrence of system faults or failures on one side. The distribution ducting leading to the AFC actuators on the flaps is also duplicated. Two supply ducts are shown to enter the wings at geometrically separated wing entry points (WEP), and ducting is further branched downstream (not shown) to ensure two supply ducts leading to each flap panel.
Operation of the HLAFC system following failure of both engines through common-mode causes (e.g., fuel contamination, fuel exhaustion, or foreign object damage) must also be considered, even though the probability of occurrence is known to be low. Since the HLAFC system requires a continuous supply of airflow while in operation, a complete disruption or drastic reduction in this airflow due to multiple engine failure would result in a precipitous loss of lift augmentation. This, in turn, may result in aerodynamic stall which, especially at low-altitude/low-airspeed flight conditions, may have catastrophic consequences. By regulation, the occurrence of such a catastrophic event (loss of control due to sudden aerodynamic stall caused by stoppage of system airflow) must be shown to be extremely improbable. Therefore, two air storage tanks (ST) are considered within each HLAFC architecture. When the HLAFC system is not in operation, the tanks are charged by the same supply sources that power the system when it is in operation. Under failure conditions, the tanks provide gradually diminishing emergency airflow, which allows a gradual rather than sudden reduction in the magnitude of AFC-augmentation. This is meant to provide sufficient time for the aircraft to be re-trimmed (nose down) for a higher airspeed, at which it may be flown with only the basic (un-augmented) aerodynamic performance of the simply-hinged high-lift devices.

3.2. Flap Weight and Drag Reduction

Simplification of the high-lift mechanism from single-slotted flaps to simply-hinged flaps allows for a reduction in weight. In this work, it is assumed that the flap stowed area, S t e f , remains unaltered. The baseline aircraft was assumed to have a single-slotted flap mechanism with link/track end support, similar to that seen in modern aircraft [15]. For such a system, Rudolph [8] provides a specific weight (weight divided by stowed flap area) of w s s = 30.8 kg/m 2 , with a further decomposition into constituent components as shown in Table 3.
Due to the lack of similar data in the open literature for a simply-hinged flap for an aircraft of this size, its specific weight, w s h , was estimated using two approaches. The first used a relationship given by Torenbeek to compute w s h using the takeoff gross weight [16]. This yields w s h = 26 . 3 kg/m 2 , but strictly speaking, the relationship is valid for takeoff gross weights lower than 90,000 kg. In the second approach, w s h was estimated based on the specific weight breakdown of Table 3, under the assumption that the simply-hinged flaps would allow the contribution of the flap fairings as well as half of that of the supporting structures to be eliminated. This yields w s h = 26.6 kg/m 2 . Since these two estimates agree fairly well, a mean value of w s h = 26.4 kg/m 2 was selected for subsequent analysis. With the baseline stowed flap area S t e f = 48 . 9 m 2 , w s s = 30 . 8 kg/m 2 , and w s h = 26 . 4 kg/m 2 , the flap weight reduction, Δ W t e f , was estimated as:
Δ W t e f = S t e f ( w s h w s s )
This predicted a 215 kg weight reduction, which was applied as a contribution to the weight adjustment factor of each of the four architectures.
The use of simply-hinged flaps allows the removal of flap track fairings, which therefore reduces excrescence drag. The flap fairing drag is proportional to the maximum cross section area perpendicular to the airflow [17]. According to Hartwich et al, for a 275-passenger LTA commercial aircraft, the removal of flap fairings reduces excrescence drag by 1.65 counts per external fairing pair [3]. Under the assumption that the LTA baseline in the current work is geometrically similar to the 275-passenger LTA commercial aircraft considered by Hartwich et al. [3], with a total of three flap fairing pairs, a total excrescence drag reduction of 4.95 counts was assessed. For each architecture, the effect of this drag reduction was propagated into the mission performance analysis through the drag adjustment factor.

3.3. Sizing of Air Storage Tanks and Compression System

Two cylindrical storage tanks with spherical caps provide redundancy for the high-lift AFC system. The dimensions of the storage tanks (diameter 1.5 m, length 4.0 m) are fixed based on an estimate of the available space in the fuselage. Prior to charging, The minimum pressure inside the tank, p m i n , is set to be the sum of the plenum pressure and the computed pressure loss through downstream ducting. Initially, the mass of air inside the tank is given by M a i r , i = p m i n V t a n k / ( R T b a y ) , where T b a y is the cargo bay temperature. During the charging process, the mass of air that needs to be pumped into the tank is given by Δ M a i r = m ˙ ¯ d i s Δ t d i s , where m ˙ ¯ d i s is the average required discharge mass flow rate and Δ t d i s = 20 s (Table A1, Appendix A) is the discharge time interval, which is estimated to be sufficient for a flight crew or an automated flight control system to re-trim the aircraft. The final mass of air after the charging process is therefore M a i r , f = M a i r , i + Δ M a i r . As the tank is charged, its temperature rises, and a still-air convective heat loss coefficient h 0 = 5 W · m 2 · K 1 is used to compute the rate of heat loss from the tank to the surrounding bay.
In charging mode, the required compressor power rating is determined through a simulation of the charging process. A compressor power rating, P c m p , is first checked to determine whether it is sufficient to pump Δ M a i r into the tank within stipulated charging time ( Δ t c h g = 600 s, Table A1, Appendix A), which is estimated from an examination of normal aircraft operating procedures. P c m p is then updated iteratively to find the minimum power rating required P c m p , c h g to accomplish charging.
A fallout of the charging simulation is the final pressure p t a n k , f of the tank at the end of charging, which is used to determine the necessary wall thickness of tank from the circumferential stress relationship for thin-walled cylindrical pressure vessels,
t t , w a l l = Δ p t a n k D t a n k 2 σ p e r m ,
where Δ p t a n k = p t a n k , f p b a y is the pressure difference across the tank wall, D t a n k is the diameter of the tank and σ p e r m is the permissible tensile stress. The permissible tensile stress is calculated by σ p e r m = λ · σ y , m a t / F O S , where σ y , m a t is the yield tensile strength of the tank material, F O S = 1 . 4 is the factor-of-safety, and λ < 1 is a temperature-dependent de-rating factor [18] to account for the reduction in tensile strength at elevated temperatures. Maraging steel [18] is used as the tank material, and the calculated wall thickness, t w a l l , with t w a l l , m i n = 0 . 1 mm, is used uniformly over the entire tank. The mass of the tank is then calculated based on its geometry, wall thickness, and the material density.
For the architectures utilizing ram air as a supply source, the compressors (in supply mode) pressurize admitted air from the ram air inlet to the required supply pressure, p s u p , and the power required is given by
P c m p , s u p = m ˙ r a · C P · T c m p , i n · Π ( γ 1 ) / γ 1 η c m p ,
where m ˙ r a is the ram air mass flow rate and η c m p is the compressor efficiency. The pressure ratio across the compressor, Π = p s u p / p c m p , i n , is calculated from p s u p and the total pressure of the air, p c m p , i n . The total temperature, T c m p , i n , and pressure, p c m p , i n , of air entering the compressor are obtained from the thermodynamic relationships for a diffusion process (through the ram air diffusers).
For architectures using the compressors only for charging the storage tanks, the compressor power requirement is naturally set by the charging process. For architectures using compressors for both charging storage tanks and supplying the actuators, it is assumed that the same electrical compressors are able to switch between charging and supply modes. In this case, the compressor required power rating is given by the maximum value between the power required for charging mode and supply mode: P c m p = max ( P c m p , s u p , P c m p , c h g ) . The mass of compression system, M c m p , s y s , can be obtained by adding the compressor mass, the electric motor mass and the power electronics mass:
M c m p = P c m p ( P / M ) c m p
M e m = P c m p ( P / M ) e m
M p e = P c m p ( P / M ) p e η e m η p e
M c m p , s y s = M c m p + M e m + M p e
Here, ( P / M ) c m p , ( P / M ) e m and ( P / M ) p e are power-to-mass ratios for compressor, electric motor, and power electronics respectively. η e m and η p e are efficiencies for electric motor and power electronics. Their nominal values are tabulated in Table A1 in Appendix A.

3.4. Sizing of Pneumatic Ducting

Sizing of additional ducts required for the AFC system starts from the inner diameter of each segment, which was computed based on a modified form of the relationship given by Parilla [19]:
D i 4 . 8 = 0 . 14211 R T n o m p n o m μ 0 . 2 m ˙ 1 . 8 Δ p L 1
In the above equation, D i is the inner diameter of the duct, R is the gas constant for air, T n o m is the nominal duct temperature, p n o m is the nominal duct pressure, μ is the viscosity of air, m ˙ is the maximum mass flow rate in the segment, Δ p is the maximum permissible pressure loss between pneumatic system and actuator, and L is the longest path between pneumatic system and any actuator (see Table A1 in Appendix A for their nominal values). The sizing mass flow rate, m ˙ , is set considering the critical operating condition, in which one of the AFC pneumatic system main-line ducts fails and the other has to supply the total required mass flow (see Figure 5). The wall thickness of the duct is again sized through the circumferential stress relationship, given by
t d , w a l l = p b D i 2 σ e f f
where p b is the burst pressure obtained as the nominal pressure, p n o m , multiplied by the burst pressure factor, and σ e f f is the tensile strength of Grade 2 Titanium [20], the chosen material for ducts. The masses of individual ducts are calculated based on length, wall thickness, and the material density.

3.5. Sizing of Actuators and Valves

The additional mass of the actuators and associated control valves is calculated using the total number of actuator-and-control-valve combinations (ACVs), the ACV unit weight, and the total spanwise extent of flaps, which for the LTA baseline is 34.1 m. With the nominal spanwise spacing 0.23 m, a total number of 148 ACVs is needed for the HLAFC system. Based on Mooney et al. [1], the unit weight of each actuator and control valve is taken as 0.50 and 0.45 kg, respectively. This gives a nominal ACV total weight of W A C V = 141 kg, which is used as a constant value for all architectures.

3.6. Up-Sizing of Electrical Generators

The baseline aircraft is equipped with main engine generators with a total capacity of 2 × 120 kVA [13]. Without resorting to any up-sizing of the engine generators, the available power rating for the compression system is the unused power capacity of the baseline main engine generators, computed from total capacity of the baseline generators and the existing on-board electrical power off-take (Table A1 in Appendix A). When this is insufficient to power the compression system, the required up-sizing of electrical generation capacity, Δ P g e n , i n c , is computed as the difference between required and available power, but the total capacity may not exceed a specified upper bound of 1000 kVA ( 2 × 2 × 250 kVA) [11]. Additional electrical generator mass, Δ M g e n , i n c , brought on due to up-sizing is calculated using the power-to-mass ratio of the electrical generators, ( P / M ) g e n :
Δ M g e n , i n c = Δ P g e n , i n c ( P / M ) g e n

4. Assessing Integrated High-Lift Active Flow Control Architectures

The following sections present a comparative assessment of the fuel burn performance of the aircraft with these four HLAFC architectures as well as the HLAFC system’s impact on the payload-range capabilities of two of the architectures.

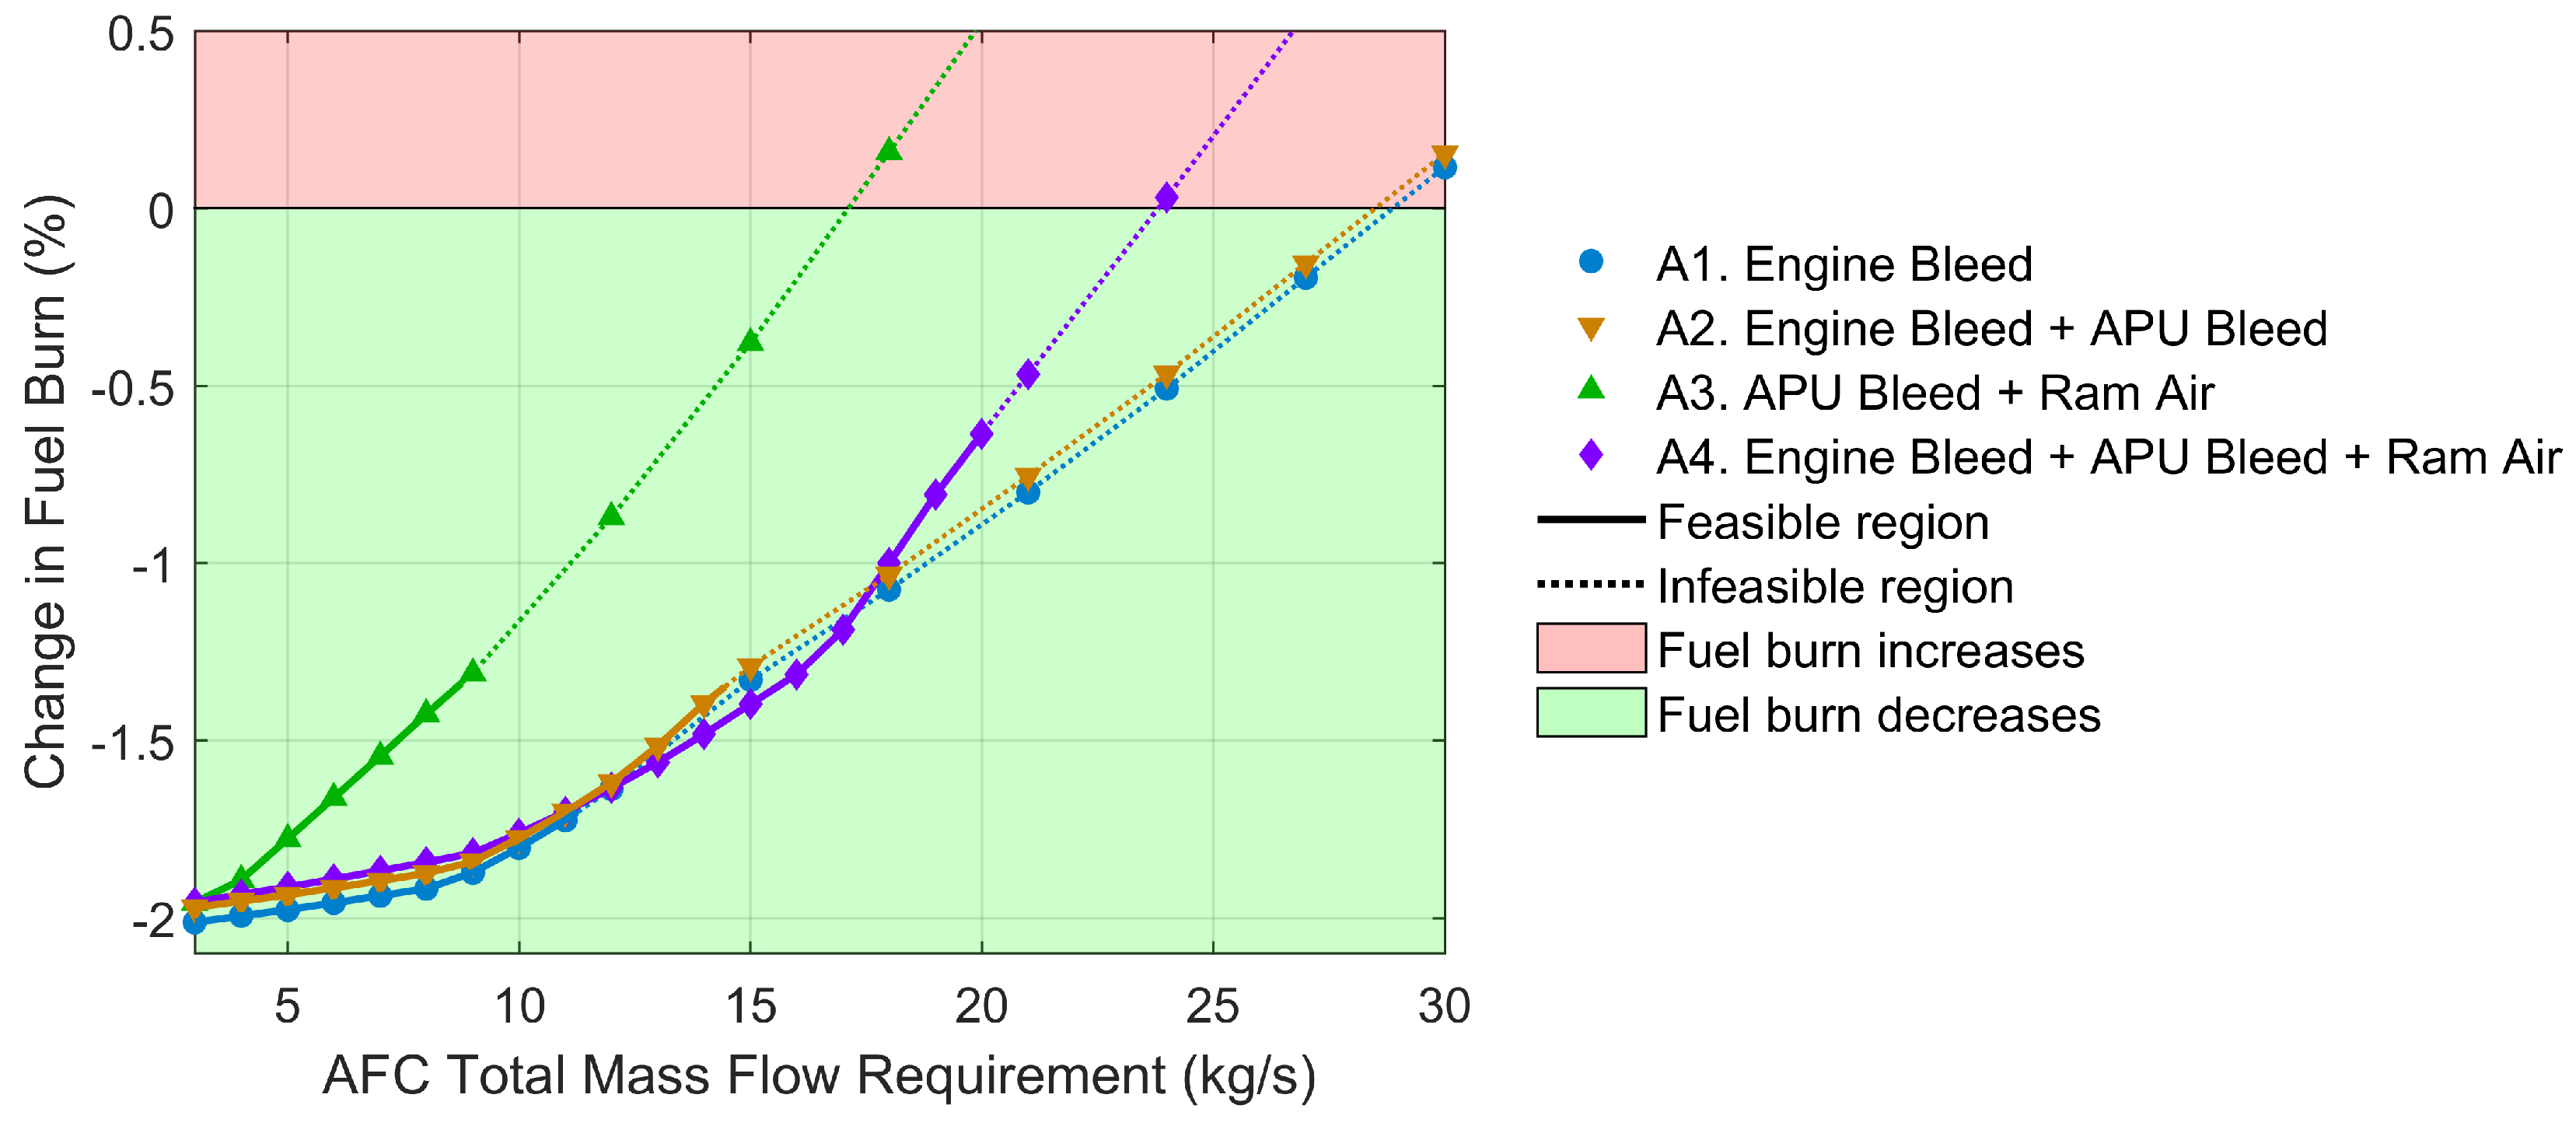
4.1. Comparative Assessment of Architecture Performance for Range of Mass Flow Requirements

Depending on the relative magnitude of the subsystem-induced weight and drag impacts, a vehicle fitted with HLAFC may or may not be able to fly over the design range (7355 nmi or 13,621 km) when carrying the design payload (23,820 kg). Therefore, an off-design mission was identified as the reference mission for comparing architecture performance. For this mission, the vehicle carries a payload of 28,735 kg (70% of the maximum payload), and flies over a range of 6000 nmi, or 11,112 km.
Instead of considering a single representative mass flow rate requirement, the considered AFC architectures were sized while the required mass flow was swept over a considerably wide range. As the mass flow requirement increases, the increasing mass of system hardware components partially negates the weight and drag benefits arising from simplification of the flap mechanism. With the retrofit strategy, the net impact of these counteracting factors for the AFC architectures considered is shown in Figure 6, where the curve for each architecture consists of two segments: the solid segment corresponds to where the AFC system is feasible on the vehicle without violating any constraint, while the dotted segment represents where the AFC system would violate at least one of the constraints. In this work, unconstrained architecture evaluations are first obtained, and thereafter the status of constraint flags is used to differentiate feasible solutions from infeasible ones. The maximum feasible mass flow rates, m ˙ m a x , for architectures A1–A4 and the corresponding active constraints are as follows:
  • A1 becomes infeasible above m ˙ m a x = 11 . 26 kg/s due to insufficient bleed;
  • A2 becomes infeasible above m ˙ m a x = 14 . 45 kg/s due to insufficient bleed;
  • A3 becomes infeasible above m ˙ m a x = 8 . 76 kg/s due to insufficient generator capacity;
  • A4 becomes infeasible above m ˙ m a x = 20 . 03 kg/s due to insufficient generator capacity.
The only appropriate way to draw inferences from Figure 6 given any point ( x , y ) in the feasible segment of the curve for Architecture k is as follows:
For Architecture k, if the AFC system requires at most x kg/s of air mass flow to recover the baseline high-lift system performance, then the resulting net impact on vehicle-level fuel burn relative to the conventional baseline is y%.
The relative performance inferred from Figure 6 is of a strictly if-then nature. The curves provide no information or guarantee regarding the feasibility of recovering the necessary high-lift performance with a given mass flow rate. The reader is again reminded that due to the uncertainty regarding AFC mass flow rate requirements, the latter was deliberately varied over a wide range to establish the resulting impact on architecture sizing and fuel savings potential. Further, the results are subject to the assumption that additional fuel consumption due to secondary power requirements of the HLAFC system are negligible compared to the fuel burn impacts from drag and mass changes.
For all four architectures studied, the flap weight reduction and fairing drag reduction are invariant with the required mass flow. However the weight addition from the HLAFC system increases with the mass flow requirement. This increased weight progressively negates the fuel burn advantage (mainly due to increased induced drag), resulting in a positive slope for each curve.

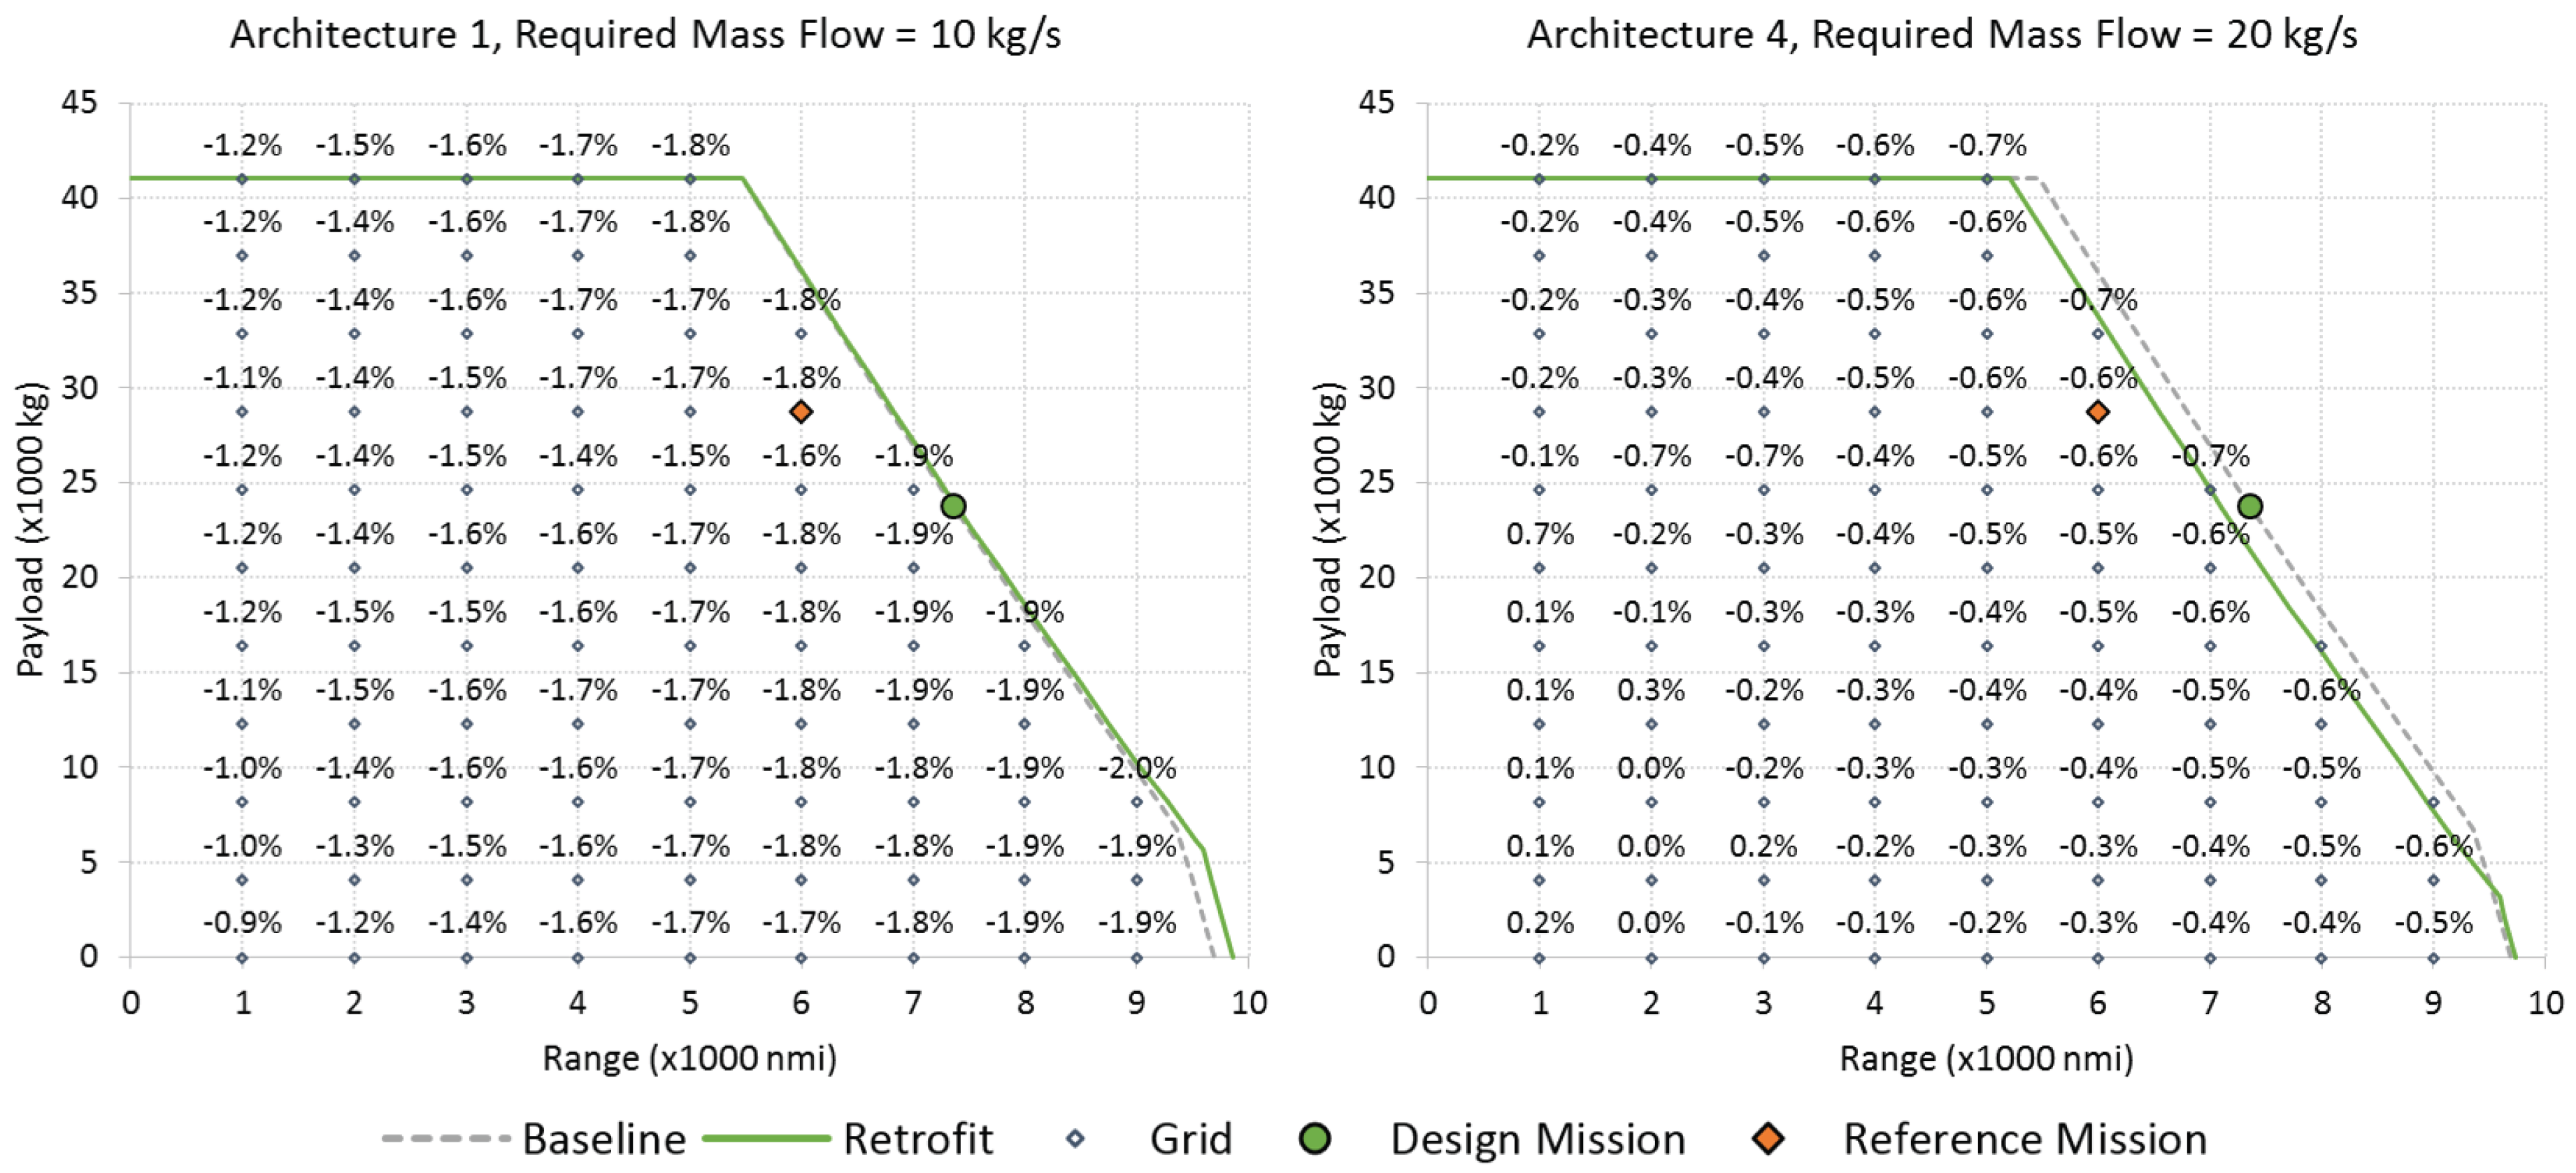
4.2. Impact on Payload-Range Envelope

Figure 7 shows the impact of incorporating HLAFC on the payload-range capabilities of A1 and A4. The mass flow rate in each case (10 kg/s for A1 and 20 kg/s for A4) is set near the upper limit of the corresponding architecture’s maximum feasible capability. Note that, as seen from Figure 6, if the necessary high-lift performance can be recovered with a mass flow rate of 10 kg/s, then A1 (engine core bleed only) gives the greatest fuel burn savings. However, if, on the other hand, the required mass flow rate becomes 20 kg/s, then A4 (using a combination of engine core bleed, APU bleed, and external ram air) remains the only feasible architecture. Table 4 and Figure 7 present the net impact of these two scenarios on empty weight, block fuel, and key ranges for the two architectures.
As shown in Table 4, both scenarios see an increase in the operating empty weight, but this effect is counteracted by the elimination in fairing drag, giving a net fuel burn decrease for the reference mission. Since the empty weight increase of A1 is lower than that of A4, the fuel savings for the reference mission is greater. However, this is contingent upon it being possible to recover the necessary high-lift system performance with a total flow rate of 10 kg/s. Since both the harmonic range (maximum range with full payload) and the range at design payload are constrained by the same maximum takeoff weight, the increase in empty weight requires a decrease in the maximum amount of fuel at takeoff. Therefore, these two ranges are largely influenced by the required mass flow rate. On the other hand, the ferry range (maximum range with zero payload) is constrained by the aircraft fuel capacity which is invariant with the mass flow rate, therefore the ferry range still increases in both scenarios. These combined effects can also be observed from the shifted boundaries of the payload-range envelopes in Figure 7.
Figure 7 also shows the net impact on fuel burn for a number of off-design missions within the payload-range envelope. Note that the fuel burn comparison is valid only for missions that can be flown by both the baseline and the AFC-equipped aircraft. For a given architecture and given mass flow requirement, the fuel burn advantage is more significant when the aircraft is operating a heavy-payload long-range mission. Among all the off-design missions evaluated, scenario 1 (A1 at 10 kg/s) always sees a fuel burn savings greater than or equal to 0 . 9 %, while scenario 2 (A4 at 20 kg/s) gains a fuel burn advantage at most off-design missions but is disadvantageous at many short-range missions, where the fuel savings due to drag reduction is less compared to the fuel penalty experienced in climb due to increased aircraft empty weight. For missions over a certain range, as the payload weight increases, the HLAFC system weight penalty becomes a smaller fraction of the takeoff weight, resulting in less fuel penalty (or more fuel saving).

5. Conclusions and Future Work

This work demonstrated a system-level approach to assessing the relative performance of multiple high-lift device active flow control system architectures for a large twin-aisle aircraft. The approach uses the Rapid Architecture Tradeoff Environment (RATE) to link the physics-based sizing of the active flow control system components to the corresponding impacts on aircraft mission performance. Redundancy requirements were considered while determining the system architecture layouts, leading to the incorporation of duplicated system components and dedicated storage tanks for failure scenarios. The analysis revealed that the system total mass flow requirement, which was swept over a wide range for each architecture considered, had a significant influence on the fuel savings and also determined which architecture was the best-performing. Similarly, mass flow requirements had a prominent influence on off-design mission performance as well, influencing not only the payload-range envelope boundary, but also the fuel burn impact of the AFC-equipped aircraft when operating within its new envelope. Additionally, this work highlighted the need to evaluate and trade off multiple system architectures to determine their relative advantages and disadvantages. Overall, this work implied a projected benefit in terms of fuel burn performance. However, there are additional considerations related to cost of installation/manufacturing, cost of maintenance, etc. which were beyond the scope of this work. On the other hand, these considerations are very important in the manufacturer’s decision to incorporate new technology into aircraft. These along with the industry’s overall conservatism likely explain why this technology is not yet seen in in-service aircraft. Extension of the scope of the analysis to include active flow control architectures that do not require pneumatic power, application to other aircraft sizes, uncertainty analyses to test sensitivity of model predictions to various assumptions, and impact of this technology on costs and manufacturing form interesting avenues for future work.

Author Contributions

Yu Cai developed the top-level Excel interfacing and the data flow to/from the FLOPS sizing and mission performance analyses. Zhenyu Gao and Imon Chakraborty developed and implemented the sizing and analysis approach for the AFC subsystem components. These three authors contribtued equally to writing the manuscript. Simon Briceno and Dimitri Mavris provided detailed technical supervision and conducted progress reviews. All five authors shared in the review of the manuscript.

Conflicts of Interest

The authors declare no conflict of interest.

Appendix A

Table A1. Summary of technology state-of-the-art parameters, operational parameters, component efficiencies, material properties, and other assumptions.
ParameterValueUnitReference/Comments
Maximum total core bleed13.2kg/s[12]
Maximum total APU bleed3.2kg/s[1]
Core bleed deduction0.5kg/min/PAX[21]
Bleed pressure330kPa[22]
Bleed temperature453K[22]
Baseline engine generator capacity, total240kVA[13]
Maximum generator capacity, total1000kVA[11]
Existing electrical power off-take0.37kW/PAX[23]
Power factor0.9-Assumed
AC distribution efficiency0.95-[24]
Power electronics efficiency0.97-[25]
Motor efficiency0.9-[25]
Compressor efficiency0.85-[23]
Diffuser efficiency0.97-Assumed
Generator power-to-mass ratio2.76kW/kg[23]
Power electronic power-to-mass ratio2kW/kg[23]
Motor power-to-mass ratio4kW/kg[23]
Compressor power-to-mass ratio2.5kW/kg[23]
Landing altitude0mAssumed
Approach airspeed140 (259)knots (km/h)Assumed
Charging altitude3048mAssumed
Charging airspeed250 (463)knots (km/h)Assumed
Ram air inlet area0.163m 2 Assumed
Number of tanks2-Assumed
Tank diameter1.5mAssumed
Tank length4.0mAssumed
Tank charging time300sAssumed
Tank discharging time20sAssumed
Tank material tensile strength2400MPa[18]
Tank material density8105kg/m 3 [18]
Tank safety factor1.4-Assumed
Tank minimum wall thickness1mmAssumed
Actuator spanwise spacing0.2268m[26]
Actuator unit weight0.4990kg[1]
Control valve unit weight0.4536kg[1]
Plenum pressure253kPa[1]
Duct design pressure330kPa[22]
Duct design temperature473K[22]
Duct longest path41.74mBaseline geometry
Duct allowable stress49.5MPa[19]
Duct burst pressure factor3-[27]
Duct non-ferrous factor0.4-[20]
Duct material density4510kg/m 3 [19]
Duct minimum wall thickness1mmAssumed
Duct maximum pressure loss35kPaAssumed
Number of AFC pneumatic system2-Assumed
AFC pneumatic system unit weight4.536kgAssumed
K-miscellaneous0.15-Assumed

References

  1. Mooney, H.P.; Brandt, J.B.; Lacy, D.S.; Whalen, E.A. AFC-Enabled Vertical Tail System Integration Study; NASA/CR-2014-218168; The Boeing Company: Huntington Beach, CA, USA, 2014. [Google Scholar]
  2. Hartwich, P.M.; Dickey, E.D.; Sclafani, A.J.; Camacho, P.; Gonzales, A.B.; Lawson, E.L.; Mairs, R.Y.; Shmilovich, A. AFC-Enabled Simplified High-Lift System Integration Study; NASA/CR-2014-218521; The Boeing Company: Huntington Beach, CA, USA, 2014. [Google Scholar]
  3. Hartwich, P.M.; Shmilovich, A.; Lacy, D.S.; Dickey, E.D.; Scalafani, A.; Sundaram, P.; Yadlin, Y. Refined AFC-Enabled High-Lift System Integration Study; NASA/CR-2016-219170; The Boeing Company: Huntington Beach, CA, USA, 2016. [Google Scholar]
  4. Andino, M.; Lin, J.; Washburn, A.; Whalen, E.; Graff, E.; Wygnanski, I. Flow Separation Control on a Full-Scale Vertical Tail Model using Sweeping Jet Actuators. In Proceedings of the AIAA SCITECH Conference, Kissimmee, FL, USA, 5–9 January 2015; American Institute of Aeronautics and Astronautics: Reston, VA, USA, 2015. Number AIAA-2015-0785. [Google Scholar]
  5. Whalen, E.A.; Lacy, D.S.; Lin, J.C.; Andino, M.Y.; Washburn, A.E.; Graff, E.C.; Wygnanski, I.J. Performance Enhancement of a Full-Scale Vertical Tail Model Equipped with Active Flow Control. In Proceedings of the 53rd AIAA Aerospace Sciences Meeting, Kissimmee, FL, USA, 5–9 January 2015; American Institute of Aeronautics and Astronautics: Reston, VA, USA, 2015. Number AIAA-2015-0784. [Google Scholar]
  6. Lin, J.C.; Andino, M.Y.; Alexander, M.G.; Whalen, E.A.; Spoor, M.A.; Tran, J.T.; Wygnanski, I.J. An Overview of Active Flow Control Enhanced Vertical Tail Technology Development. In Proceedings of the AIAA SCITECH Conference, San Diego, CA, USA, 4–8 January 2016. Number AIAA-2016-0056.
  7. Whalen, E.A. Flight Services and Aircraft Access: Active Flow Control Vertical Tail and Insect Accretion and Mitigation Flight Test; NASA/CR-2016-219005; The Boeing Company: Hazelwood, MO, USA, 2016. [Google Scholar]
  8. Rudolph, P. High Lift Systems on Subsonic Commercial Airliners; NASA Contractor Report 4746 CONTRACT A46374D(LAS); National Aeronautics and Space Administration: Washington, DC, USA, 1996.
  9. McCullers, L. Aircraft Configuration Optimization including Optimized Flight Profiles. In Proceedings of the Symposium on Recent Experiences in Multidisciplinary Analysis and Optimization; NASA Langley Research Center: Hampton, VA, USA, 1984. NASA CP-2327. pp. 395–412. [Google Scholar]
  10. Claus, R.W.; Evans, A.L.; Follen, G.J. Multidisciplinary Propulsion Simulation using NPSS. In Proceedings of the 4th Symposium on Multidisciplinary Analysis and Optimization, Cleveland, OH, USA, 21–23 September 1992; American Institute of Aeronautics and Astronautics: Reston, VA, USA, 1992. Number AIAA-92-4709-CP. [Google Scholar]
  11. Sinnett, M. Boeing 787 No-Bleed Systems: Saving Fuel and Enhancing Operational Efficiencies. Boeing Aero Magazine. Quarter 4. 2007. Available online: http://www.boeing.com/commercial/aeromagazine/articles/qtr_4_07/article_02_1.html (accessed on 14 December 2016).
  12. EASA Type Certification Data Sheet No. IM.E.102—General Electric Company—GEnx Series Engines; European Aviation Safety Agency (EASA): Cologne, Germany, 2016.
  13. Queen, H. Introducing the 767-400 Extended Range Airplane. Boeing Aero Magazine. Quarter 3. 1998. Available online: http://www.boeing.com/commercial/aeromagazine/aero_03/textonly/ps01txt.html (accessed on 14 December 2016).
  14. Bennett, J. Fault Tolerant Electromechanical Actuators for Aircraft. Ph.D. thesis, School of Electrical, Electronic and Computer Engineering, Newcastle University, Newcastle upon Tyne, UK, November 2010. Available online: https://theses.ncl.ac.uk/dspace/bitstream/10443/990/1/Bennett%2010.pdf (accessed on 14 December 2016). [Google Scholar]
  15. Nelson, T. 787 Systems and Performance. Available online: http://myhres.com/Boeing-787-Systems-and-Performance.pdf (accessed on 14 December 2016).
  16. Torenbeek, E. Development and Application of a Comprehensive, Design-sensitive Weight Prediction Method for Wing Structures of Transport Category Aircraft; Report LR-693; Delft University of Technology (TU Delft): Delft, The Netherlands, 1992. [Google Scholar]
  17. Schoensleben, S. Integrated Trailing Edge Flap Track Mechanism for Commercial Aircraft. Master’s Thesis, Swiss Federal Institute of Technology Zurich (ETH Zurich), Zurich, Switzerland, 2006. Available online: http://e-collection.library.ethz.ch/eserv/eth:28634/eth-28634-01.pdf (accessed on 14 December 2016). [Google Scholar]
  18. 18 Percent Nickel Maraging Steels—Engineering Properties. Available online: http://www1.diccism.unipi.it/Valentini_Renzo/slides%20lezione%20met.%20meccanica/18_NickelMaragingSteel_EngineeringProperties_4419_.pdf (accessed on 14 December 2016).
  19. Parrilla, X. Hybrid Environmental Control System Integrated Modeling Trade Study Analysis for Commercial Aviation. Ph.D. Thesis, University of Cincinnati, Cincinnati, OH, USA, 19 February 2014. Available online: https://etd.ohiolink.edu/!etd.send_file?accession=ucin1396454368&disposition=inline (accessed on 14 December 2016). [Google Scholar]
  20. Peacock, D.K. Effective Design Using Titanium. Available online: http://www.ginattatecnologie.it/Docs/Meeting6/VI%20Meeting%20-%2003.pdf (accessed on 14 December 2016).
  21. Advisory Circular 25-20—Pressurization, Ventilation and Oxygen Systems Assessment for Subsonic Flight Including High Altitude Operation. Available online: https://www.faa.gov/documentLibrary/media/Advisory_Circular/AC25-20.pdf (accessed on 14 December 2016).
  22. Airbus A330 Flight Crew Operating Manual—Pneumatic. Available online: http://www.smartcockpit.com/aircraft-ressources/A330-Pneumatic.html (accessed on 14 December 2016).
  23. Chakraborty, I. Subsystem Architecture Sizing and Analysis for Aircraft Conceptual Design. Ph.D. Thesis, Guggenheim School of Aerospace Engineering, Georgia Institute of Technology, Atlanta, GA, USA, 2015. Available online: https://smartech.gatech.edu/handle/1853/54427 (accessed on 14 December 2016). [Google Scholar]
  24. Advisory Circular AC 43.13-1B—Acceptable Methods, Techniques, and Practices—Aircraft Inspection and Repair. Available online: http://www.faa.gov/documentLibrary/media/Advisory_Circular/AC_43.13-1B_w-chg1.pdf (accessed on 14 December 2016).
  25. Whyatt, G.; Chick, L. Electrical Generation for More-Electric Aircraft Using Solid Oxide Fuel Cells; Report PNNL-21382; Pacific Northwest National Laboratory: Richland, WA, USA, 2012. [Google Scholar]
  26. Hiller, B.; Cai, Y.; Karagoz, E.; Wilhelms, C.; Chakraborty, I.; Briceno, S.; Collins, K.; Mavris, D. Framework for Assessing Impact of Active Flow Control Technologies for Commercial Aircraft. In Proceedings of the AIAA Aviation 2016 Conference, Washington, DC, USA, 13–17 June 2016. Number AIAA-2016-3283.
  27. Airworthiness Standards: Transport Category Airplanes. Available online: http://www.ecfr.gov/cgi-bin/text-idx?SID=9bb59ae94aca021a7954ca55ae1219cc&mc=true&node=pt14.1.25&rgn=div5 (accessed on 14 December 2016).
Figure 1. Tracing impact of subsystem architecture changes on fuel burn performance.
Aerospace 04 00006 g001
Figure 2. Data flow between RATE main user interface and subsystem tabs.
Aerospace 04 00006 g002
Figure 3. Main user interface of RATE (enumerated notes correspond to the annotated numbers 1–7).
Aerospace 04 00006 g003
Figure 4. Illustration of sizing and analysis approach for considered HLAFC architectures.
Aerospace 04 00006 g004
Figure 5. Redundancy-driven HLAFC system architecture layout considered in this work. Illustration pertains directly to A4; for A1–A3, connections to the relevant supply sources are omitted. Cmp—electrical compressor; PS—pneumatic system; ST—storage tank.
Aerospace 04 00006 g005
Figure 6. Change in mission block fuel vs. total mass flow requirement for the four HLAFC architectures, evaluated for the reference mission with payload of 28,735 kg and range of 6000 nmi (11,112 km).
Aerospace 04 00006 g006
Figure 7. Payload-range characteristics and change in block fuel of two HLAFC architectures at different mass flow rates.
Aerospace 04 00006 g007
Table 1. Data summary for LTA conventional baseline (this baseline is not equipped with the HLAFC system, and serves as the reference for comparing the AFC-equipped architectures).
ItemValueUnit
Passenger capacity242-
Design payload weight23,820kg
Design range7355nmi
13,621km
Harmonic range5470nmi
10,130km
Ferry range9696nmi
17,957km
Cruise Mach number0.85-
Maximum ramp weight227,365kg
Maximum payload weight41,050kg
Operating empty weight119,271kg
Maximum fuel capacity101,323kg
Sea-level static thrust2 × 309.1kN
Wing planform area380.9m 2
Wingspan60.4m
Wing aspect ratio9.59-
Wing taper ratio0.159-
Wing 1/4-chord sweep32.1deg
Wing dihedral7.0deg
Trailing-edge flaps stowed area48.9m 2
Trailing-edge flaps span33.2m
Horizontal tail planform area75.8m 2
Horizontal tail aspect ratio5.22-
Horizontal tail taper ratio0.243-
Horizontal tail 1/4-chord sweep36.6deg
Vertical tail planform area40.8m 2
Vertical tail aspect ratio1.80-
Vertical tail taper ratio0.327-
Vertical tail 1/4-chord sweep40.6deg
Table 2. Summary of supply sources for HLAFC architectures considered in this work.
AFC ArchitectureEngine Core BleedAPU BleedExternal Ram Air
A1X
A2XX
A3 XX
A4XXX
Table 3. Specific weight breakdown for single-slotted flap with link/track end support [8].
ComponentSpecific Weight (kg/m 2 )
Flap Panels13.2
Supports7.3
Actuation9.8
Fairing0.5
Total30.8
Table 4. Weight and performance impacts of the two architectures at different mass flow rates.
Weight and Performance ImpactsArchitecture 1 at 10 kg/sArchitecture 4 at 20 kg/s
Δ Operating empty weight + 0 . 90 % + 3 . 00 %
Δ Block fuel (28,735 kg payload, 6000 nmi range) 1 . 80 % 0 . 64 %
Δ Harmonic range (max 41,050 kg payload) + 7 nmi/ + 13 km 260 nmi/ 481 km
( + 0 . 13 %)( 4 . 75 %)
Δ Range at design payload (23,820 kg payload) + 29 nmi/ + 53 km 259 nmi/ 479 km
( + 0 . 39 %)( 3 . 52 %)
Δ Ferry range (zero payload) + 162 nmi/ + 300 km + 42 nmi/ + 78 km
( + 1 . 67 %)( + 0 . 43 %)

