High Reynold Number LES of a Rotating Two-Pass Ribbed Duct

1
Department of Mechanical Engineering, Virginia Tech, Blacksburg, VA 24061, USA
2
Department of Energy and Power Engineering, Nanjing University of Aeronautics and Astronautics, Nanjing 210016, China
*
Author to whom correspondence should be addressed.
Aerospace 2018, 5(4), 124; https://doi.org/10.3390/aerospace5040124
Submission received: 28 October 2018
/
Revised: 12 November 2018
/
Accepted: 19 November 2018
/
Published: 23 November 2018
(This article belongs to the Special Issue Cooling/Heat Transfer)
Abstract
:Cooling of gas turbine blades is critical to long term durability. Accurate prediction of blade metal temperature is a key component in the design of the cooling system. In this design space, spatial distribution of heat transfer coefficients plays a significant role. Large-Eddy Simulation (LES) has been shown to be a robust method for predicting heat transfer. Because of the high computational cost of LES as Reynolds number (Re) increases, most investigations have been performed at low Re of O(104). In this paper, a two-pass duct with a 180° turn is simulated at Re = 100,000 for a stationary and a rotating duct at Ro = 0.2 and Bo = 0.5. The predicted mean and turbulent statistics compare well with experiments in the highly turbulent flow. Rotation-induced secondary flows have a large effect on heat transfer in the first pass. In the second pass, high turbulence intensities exiting the bend dominate heat transfer. Turbulent intensities are highest with the inclusion of centrifugal buoyancy and increase heat transfer. Centrifugal buoyancy increases the duct averaged heat transfer by 10% over a stationary duct while also reducing friction by 10% due to centrifugal pumping.
1. Introduction
One of the many important technical challenges driving the gas turbine industry is the capability to cool the combustor walls, hub endwall, and high-pressure nozzle vanes and blades downstream of the combustor. This has been driven by the need for high turbine inlet temperatures, which have increased from between 1000–1100 °C three decades ago to between 1500–1700 °C for current and future designs. During this time, the permissible metal temperature of high temperature Ni-Cr super alloys dictated by structural integrity has increased nominally from approximately 800 °C to the current 900–950 °C. To make up the difference in turbine inlet temperature thermal barrier coatings (TBCs) which provide an additional insulating layer to protect the metal have been utilized. In this mix, active cooling of endwalls, nozzle vanes, wheel hubs, and blades play a critical role. The overall cooling effectiveness is maximized by permitting as little heat as possible to be conducted into the metal, but once conducted into the metal, by removing as much of this heat as possible. On the hot gas side, the flow is highly turbulent with high free-stream turbulence intensities exiting the combustor, which is further augmented by nozzle-vane wake induced unsteadiness. Thus, convective heat transfer coefficients are not only high in the stagnation region of vanes and blades but also on the suction and pressure surfaces, often exacerbated by transition of the nominally laminar boundary layer that develops on the blade surfaces and secondary vortices which develop at endwall junctions, blade tips, etc. The heat flux convected to the metal can be reduced by reducing the temperature of the gas adjoining the wall while limiting any increase in the convective heat transfer coefficient that such an action might precipitate. This is accomplished by film cooling in which cooler air is ejected through discrete slots or holes onto surfaces and at the same time limiting the increase in convective heat transfer coefficient caused by turbulence which is generated during injection. Heat that is conducted into the metal has to be removed as effectively as possible. This is done by internal cooling which is accomplished by circulating cooler air in serpentine passages in nozzle vanes and blades. Internal cooling mandates that for a given coolant inlet temperature, the convective heat transfer coefficient is as high as possible without excessive pressure losses in the flow circuit. Thus different heat transfer coefficient enhancement techniques are used to turbulate the flow in the passages by placing features in the form of ribs [1,2], pins [3], dimples [4], and other more esoteric combinations [5,6] often combined with slot and jet impingement techniques [6,7,8,9,10,11], skin cooling, etc. In the past, and even to some extent in the present, internal cooling geometries have been limited by manufacturing constraints—however, with advances in additive manufacturing and 3D printing of metals and alloys, this constraint will eventually be eliminated to a large degree.
The maximum blade metal temperature is captured by the overall cooling effectiveness, which is defined as the ratio of the difference between the hot gas temperature and blade surface temperature to the difference between the hot gas temperature and the coolant inlet temperature. This quantity is of crucial importance to the design of the cooling circuit and accurate predictions can have a large impact on enhanced designs and durability. Being able to predict the blade metal temperatures has profound impact on thermal and aerodynamic efficiencies, reducing fuel consumption and emissions. In this pursuit, the accurate prediction of external and internal heat transfer coefficients and their distributions are key. This is easier said than done because the complex high Reynolds number turbulent flow poses a gamut of turbulence modeling challenges. The external flow is dominated by high free-stream turbulence, wake induced unsteadiness and turbulence, film-cooling induced turbulence, favorable and adverse pressure gradient effects on turbulence and transition, whereas the internal flow is dominated by non-canonical effects that are driven by flow separation, reattachment, and geometry and rotation induced secondary flows, all of which impact turbulence and influence the heat transfer coefficients. The challenge is compounded by the large parameter space introduced by different cooling geometries—a slight change in geometry affects the local distribution much more than the mean. Thus it is important that prediction techniques not only capture spatially averaged values accurately but also the distribution.
Internal cooling passages with transverse and angled ribs have been studied extensively in the experimental literature since the 1980s [1,2,12,13,14,15,16,17,18,19,20,21,22,23,24,25,26,27,28,29,30,31,32,33,34], and remains a current subject of research [35,36,37,38,39,40,41]. Ribbed geometries provide a rich set of fundamental prediction challenges for turbulence models. Invariably the presence of ribs either transverse or angled (V-shaped, W shaped, etc.) is accompanied by flow separation at the leading edge of the rib. The inner part of the separated shear layer can potentially reattach on the rib to form a small recirculating zone on top of the rib, but the dominant recirculating and reattachment region lies downstream of the rib. The presence of the ribs induces weak secondary flow in the duct, but which are particularly strong near the rib locations. At the rib-lateral wall junction, the secondary flow induced lateral velocity reaches up to 20% of the mean flow velocity impinging on the wall and creating a region of high heat transfer [42]. Contrary to transverse ribs, angled ribs by virtue of their skewed orientation to the flow, produce a strong lateral pressure gradient inducing a lateral velocity to the flow as it separates at the leading edge of the rib. The lateral velocity combines with the streamwise velocity to form energetic helical vortices in the wake immediately behind the rib. Because of the strong momentum transfer into the shear layer, unlike a transverse rib, no separation zone exists in the wake of the angled rib. In fact, heat transfer augmentation is maximum immediately behind the transverse rib at the origin of the helical vortex and on the opposite lateral wall on which the helical vortex impinges [24]. The strong lateral flow induced by the rib angle also sets up two well-defined counter-rotating secondary flow cells in the cross-section of the duct.
In developing stationary passages, because of the large flow perturbation induced by the presence of the ribs, the flow quickly transitions to turbulence and for all practical purposes the heat transfer reaches a fully-developed state within the first 3 to 4 ribs. In a multi-pass configuration, as the flow approaches the 180° bend, the flow at the inner wall accelerates and separates as it is unable to traverse the sharp curvature of the bend. The degree of separation depends on the inner bend geometry and clearance from the tip [21,43,44], but nevertheless the strong flow acceleration at the outer bend together with the separated shear layer at the inner bend augment turbulence production and as a result the flow coming out of the bend exhibits large turbulent intensities. In addition, secondary flows (Dean vortices) manifest in the bend region as a result of the transverse pressure gradient caused by the centrifugal acceleration of the flow as it traverses the bend.
Rotational effects in the form of Coriolis forces and centrifugal forces add an additional layer of complexity. The Coriolis acceleration or force is written as:
and the centrifugal force as:
For orthogonal rotation about the z-axis only, ,
and
where and is the radial vector from the axis of rotation to the location in the cooling duct. Rotational forces are characterized by the Rotation number which is the ratio of a measure of the mean flow timescale to the rotational time scale and is given by —large rotation number signifies a faster rotational time scale compared to the mean flow time scale.
Coriolis forces affect the mean flow as well as turbulent quantities and by association the heat transfer coefficient. A simplified interpretation of Equation (3) for the mean flow in the duct can be obtained by assuming a positive u-velocity at the center of the duct with a negligible v-velocity to begin with. The Coriolis force will induce a negative v-velocity, which in turn will reduce the x-directional velocity till a balance is reached with all the transport processes in the conservation equations. From phenomenological arguments one can reason that a fluid particle traveling in the axial direction will move away from the leading wall as it recedes with rotation towards the trailing wall. Effectually, the axial flow is pushed into the trailing wall and the maximum axial velocity shifts from the center of the duct towards the trailing wall. This phenomenon also sets up a pressure gradient in the duct cross-section which has a counter-effect and transports fluid from the trailing to the leading wall. The combination of these two mechanisms sets up a secondary flow in the duct with fluid transported from the leading wall to the trailing at the center of the cross section—impinging on the trailing wall moving laterally towards the side walls and back again from the trailing side towards the leading side of the duct along the lateral walls. This is shown schematically in Figure 1a. The secondary flow not only augments the heat transfer at the trailing walls of the duct and shifts the location of peak heat transfer towards the lateral walls, but also on the lateral walls as the flow travels from the trailing to the leading side of the duct.
Coriolis forces directly impact the production of turbulent shear stress. In ribbed ducts, most of the turbulence production takes place in the separated shear layers emanating from the ribs compared to the inner wall boundary layer in smooth ducts. Turbulent shear stress production happens by the rapid mixing of packets of low speed and high-speed fluid fluctuations which are referred to in the literature as bursts and sweeps. Bursts are characterized by low x-momentum fluid () moving away from the wall () and a sweep is high x-momentum fluid () moving towards the wall (). As illustrated in Figure 1b, on the trailing side, the bursts and sweeps fall in the second and fourth quadrant whereas on the leading side of the duct, the events fall in the first and third quadrant. From Equation (3), it can be deduced that on the trailing side of the duct, Coriolis forces augment the burst and sweep events by acting in tandem with them, whereas on the leading side of the duct the Coriolis forces act against these events and lie in the second and fourth quadrant. Thus, Coriolis forces augment the production of turbulent shear stress on the trailing side and attenuate turbulent shear stress on the leading side. Equation (5) shows the effect of Coriolis forces on turbulence production in a plane channel [45].
where the overbar denotes Reynolds-averaging. Coriolis forces affect production of turbulence directly (terms with Ro) and indirectly through turbulent stresses in a highly non-linear feedback mechanism. For and , the direct contribution of Coriolis forces is to increase shear stress production on the trailing side and decrease production on the leading side. However, if then the direct effect of Coriolis forces will be opposite, increasing production on the leading side while decreasing it on the trailing side. The direct effect of Coriolis forces on streamwise turbulent fluctuations is to decrease production on the trailing side and increase it on the leading side, whereas production of is always augmented on the trailing side and attenuated on the leading side. As the rotation number increases, we can entertain the scenario that on the trailing side as increases, the rate of production of slows down and that slows the production of and , thus limiting the augmentation in turbulence. Previous investigations in different rotating geometries [45,46,47] have shown that there is a sharp increase in turbulent kinetic energy (TKE ) on the trailing side up to Ro = 0.2, after which there is only a slight increase up to about Ro = 0.35–0.4, after which the TKE starts decreasing as Ro increases. This also has direct implications on the heat transfer at the trailing wall which increases sharply only to level out as the rotation number increases further. Similarly, on the leading wall there is a sharp decrease in TKE at low rotation numbers (Ro < 0.2), after which the TKE does not change substantially [46]. This trend is also reflected in the heat transfer which decreases sharply at low rotation numbers but then only slightly as the rotation number increases [23,48,49].
Centrifugal force in a constant density flow simply provides additional pumping force in radially outward flow and vice versa in radially inward flow and has no net effect in a two pass channel. However, when combined with density variations in the cross-section it gives way to centrifugal buoyancy. This effect is characterized by the Buoyancy parameter which is given by
where is a characteristic density difference, is the characteristic density, and is the characteristic radius from the axis of rotation. In the first pass in radially outward flow, centrifugal forces are always acting in the flow direction. However, because of the effect of Coriolis forces on heat transfer, the density of the coolant near the trailing side of the duct is higher than the density on the leading side of the duct. Thus more coolant is pumped outward near the trailing side of the duct. For a fixed mass flow rate, the coolant near the leading side thus has to slow down to compensate. So in the first pass or radially outward flow, centrifugal buoyancy strengthens the flow induced by the Coriolis forces, increasing turbulence, strengthening the secondary flow, and increasing heat transfer on the trailing side while reducing the heat transfer further on the leading side. In contrast, during radially inward flow in the second pass, centrifugal forces always act in opposition to the main flow. The Coriolis effect is reversed for inward flow and the coolant at the leading side of the duct has a higher heat transfer coefficient and a higher density whereas the coolant at the trailing side will be hotter with lower density. Thus in this case, centrifugal buoyancy acts to oppose the Coriolis force effect on flow and heat transfer. Its action is to reduce turbulence and heat transfer at the leading side with a corresponding increase on the trailing side.
The numerical treatment of centrifugal buoyancy can be implemented through the Boussinesq approximation which assumes that the density change () is a small perturbation about and which is only felt through the centrifugal force term. Under this approximation, , the constant property Navier–Stokes equations are solved with a source term on the RHS in the x- and y-momentum equation as , where is the volumetric thermal expansion coefficient approximated as for an ideal gas and is the radial vector from the axis of rotation. An assumption implicit to the Boussinesq approximation is that density follows a linear variation with respect to temperature. While this is acceptable for small temperature changes (a few 10 s of °C), the assumption breaks down for larger temperature differences. In such instances, together with the non-linear change of density with temperature, changes in other properties such as the dynamic viscosity and thermal conductivity, and specific heat become important and the variable property Navier–Stokes have to be solved.
The milieu of complex fluid dynamic phenomena makes for a challenging prediction environment. RANS turbulence models have been used extensively for design and analysis since the 1990’s. The full range of RANS models based on the linear eddy-viscosity concept, k-ε and Realizable k-ε model [43,50,51,52,53,54,55,56,57], k-ω model [58,59], SST k-ω model [43,59,60], v2-f model [43,56,61,62], and full closure of the Reynolds stresses with the algebraic stress model (ASM) assumption [63] and full transport solutions [64,65,66,67,68,69,70,71], have been used and evaluated for different ribbed duct configurations with mixed results. While a detailed evaluation of all studies is outside the scope of this paper, some general broad conclusions can be made. RANS models when used carefully by incorporating best practices such as grid independency and model specific near wall resolution can predict mean spatially-averaged heat transfer coefficients to within ±20%. However, the spatial distribution of Nusselt number is not predicted very well with localized over- and under- predictions compensating to give a reasonable mean value. Local heat transfer coefficients affected by turbulence, or more generally unsteady phenomena, manifested in secondary strain rates which cannot be represented by mean in-plane gradients challenge all isotropic Eddy-viscosity models. One example of this is the high heat transfer coefficients experienced by normal ribs at their junction with the lateral walls. In the unsteady framework, this region is characterized by vortices aligned in a direction parallel to the rib height, but which are stretched and tilted in the flow direction as they traverse the rib. The mean effect of this highly unsteady phenomenon is the induction of high lateral velocities in the vicinity of the lateral wall producing a region of high heat transfer coefficients. Most RANS models do not capture this phenomenon [61]. In contrast, the flow impingement and high heat transfer coefficients on lateral walls downstream of a skewed or angled rib, which is directly driven by the rib geometry and flow redirection is captured reasonably well by RANS models [68,69].
Modeling Coriolis effect on turbulent stresses remains yet another challenge in the RANS Eddy-viscosity model (EVM) framework. Two equation eddy-viscosity models (k-ε & k-ω) have no direct representation of the Coriolis effect in the k-equation (Equation (5)). Even if the direct contribution could be included, the indirect contributions would be challenging to model in an isotropic eddy-viscosity framework. In early work (Bradshaw) proposed a modified mixing length model based on the local Richardson number, , where , where is a constant and Ri acts as a local stability parameter with a negative value denoting an unstable region. Other than modifications such as these [72,73] to sensitize EVMs to rotation, the other choices are to solve for the full Reynolds stress model (RSM) [74] or its algebraic equivalent (ASM) [75].
Since the 2000s as computers have become more powerful, Large-Eddy Simulations has been used for simulating internal cooling ducts. LES resolves most of the turbulent length and time scales in the calculation and only the small scales are left to be modeled. Unlike RANS models, subgrid stress (SGS) models do not play a significant role in solution accuracy as long as the LES is able to resolve the important energy producing scales up to the inertial range—this of course becomes a challenge near heat transfer surfaces as the Reynolds number increases. At the very least, SGS models should prevent energy accumulation in the high wavenumber (or frequency) resolved spectrum. The most common SGS models that have been used in internal cooling geometries are based on the Eddy-viscosity Smagorinsky model [76] with near wall damping, or its dynamic equivalent [77]. Murata and Mochizuki [78] used the dynamic Smagorinsky model to simulate inline normal ribs in stationary and rotating ducts of aspect ratios 1, 2, and 4. Reynolds numbers ranging from 4100 to 9200 and rotation numbers up to 0.35 were investigated in a periodic unit of a single rib pitch with a grid resolution of 104,000 computational cells. They followed this study by investigating centrifugal buoyancy effects in a square duct at Re = 3360 to 4238, Ro = 0.33 to 0.55 and Grashoff numbers varying from 5.6 × 10⁷ to 2.8 × 10⁸ for ribs inclined at 90° and 60° to the flow direction [79]. Subsequently, they also used LES to investigate the heat transfer in a square duct with a 180° turn with 7 ribs in the first and second pass [80]. They considered both transverse as well as angled rounded ribs. The maximum Re ~ 5000 and Ro varied from 0 to 3.25. The cross-sectional grid was kept the same as previous studies (47 × 47) with 965 grid cells in the flow direction to resolve the 14 rib pitches and the 180° turn. Watanabe and Takahashi [81] conducted LES in a rectangular duct of AR = 0.5 with transverse ribs at Re = 1.7 × 10⁵ with a grid resolution of 104 × 78 × 75 for fully-developed flow and heat transfer. They used the Smagorinsky model with van Driest wall damping and the dynamic Smagorinsky model for the calculations. The same authors conducted another LES study on rectangular channels of varying aspect ratios from 0.5 to 2 with angled ribs at Re = 50,000 and 120,000 under fully developed conditions with similar grid resolutions [82]. Tyagi and Acharya [83] investigated normal ribs in rotating duct at Re = 12,500, Ro = 0.12 and = 0.13 under the fully developed assumption (periodic in flow direction). To model SGS terms they used a dynamic mixed model [84]. Their grid consisted of (82 × 82 × 81) computational cells. Ahn et al. [85] performed LES at Re = 30,000 with square and semi-circular ribs in a periodic unit with grid resolutions of 128 × 128 × 128 and 128 × 160 × 48 for sharp and rounded ribs using the dynamic Smagorinsky model. Tafti [42], investigated the role of subgrid modeling using the dynamic Smagorinsky model in a periodic geometry for normal ribs at Re = 20,000 with grid resolutions of 128 × 128 × 128 and 96 × 96 × 96. Abdel-Wahab and Tafti (2004) predicted the effect of Coriolis forces and centrifugal buoyancy on flow and heat transfer at Re = 20,000, Ro = 0.18, 0.35 and 0.7 and Bo = 0.12 to 0.29 on a 1283 grid. Using the same framework, Abdel-Wahab and Tafti [86] investigated 45° angled ribs at Re = 47,300 with a grid of 160 × 128 × 128 followed by Viswanathan and Tafti [87] who investigated the effect of rotation on this same geometry at Re = 50,000 and Ro = 0.1. Viswanathan et al. [88] investigated high blockage ratio 45° ribs at Re = 27,000 using LES. Sewall et al. [89], investigated the developing flow in a stationary duct with 180° bend, as well as rotating duct with Coriolis and centrifugal buoyancy effects [90] for Re = 20,000, Ro = 0.3 and Bo = 0.25 to 0.65. Validation of mean and turbulent statistics, and heat transfer coefficients showed excellent agreement with experiments. Tyacke and Tucker [91] investigated a number of non-linear SGS models for LES in a two-pass duct with 24 pairs of ribs at Re = 20,000 with a grid consisting of 7 million cells. They found the results to be quite insensitive to the SGS models. Labbe [92] conducted an LES study on transverse high blockage ribs at Re = 40,000 on developing flow with 5 ribs with a total of 38 million grid cells in the calculation domain using the Monotonic Integrated Large-Eddy Simulations (MILES) approach.
To reduce the computational burden of LES, a number of studies have investigated hybrid URANS-LES or Detached Eddy Simulations (DES) in internal cooling ribbed geometries. Viswanathan and Tafti [93] compared DES with URANS at Re = 20,000 in a two pass duct with 25 pairs of normal ribs and a grid resolution of 643 per pitch. In spite of DES taking a longer spatial extent to reach a fully-developed state, once it did so the predictions were in much better agreement with LES than URANS which failed to capture the secondary flows. In stationary fully-developed flow [94] and with rotation [95] at Re = 20,000, Ro = 0.18 to 0.67 and Bo up to 0.29, it was shown by Viswanathan and Tafti that DES was superior to RANS and URANS in capturing the effects of Coriolis and centrifugal buoyancy forces. Along the same lines of reducing the computational burden of LES, Patil and Tafti [96] used a zonal two layer-wall model for LES. In this model the inner wall layer is modeled by solving for the tangential velocity near the wall assuming one-dimensional variation in the direction normal to the wall. Using the outer tangential velocity at the first off-wall grid point, a suitable velocity profile is constructed in the inner layer which is used to calculate quantities such as turbulent wall shear, temperature or heat flux.
It can be concluded from past work that out of all the turbulence modeling techniques, LES is the most capable of accurately predicting mean and turbulent quantities as well as heat transfer in internal cooling geometries. Predicted flow features such as separation and reattachment lengths, turbulence induced secondary flows, Coriolis and centrifugal buoyancy effects on mean as well as turbulent quantities and heat transfer predictions are not only superior but more robust and repeatable when using LES compared to other techniques. The major limitation of LES is that it is computationally expensive and cannot easily be extended to high Reynolds numbers. Most past studies in the literature have been performed at low to moderate Reynolds numbers O(104) and the studies which have ventured to Re of O(105) and above have only done so under the fully-developed assumption limiting the streamwise length to one pitch length. This study extends the application of LES to a Reynolds number of 100,000 in a two-pass duct with 17 pairs of staggered normal ribs. Three cases are calculated—a stationary duct, a rotating duct (Ro = 0.2) without and with centrifugal buoyancy (Bo = 0.5). To facilitate validation, the geometry chosen is the same as the experimental geometry of Iacovides et al. [97,98,99]. The paper critically evaluates local predictions of mean and turbulent quantities with measured data under stationary as well as rotating conditions and heat transfer coefficients under stationary conditions. The effect of Coriolis and centrifugal buoyancy on the mean and turbulent flow field and the effect on heat transfer is investigated in detail.
2. Computational Methodology
2.1. Geometry and Computational Domain
The two pass square cross-section duct is shown in Figure 2c. It consists of 17 staggered rib pairs with = 0.1 and = 10. The inlet section extends a length before the first rib whereas the outlet section in the second pass extends downstream of the last rib. The bend has an outer radius of whereas the inner radius is . In the first pass flow is in the negative x-direction and in the positive x-direction in the second pass.
To investigate the effect of rotation, the geometry is rotated in the positive z-direction for orthogonal rotation in Figure 2a with the axis of rotation located at a x-location (x > 14) at y = 0. Thus, the outer wall represents the leading side in the first pass (radially outward flow) and the trailing side in the second pass (radially inward flow). It is noted that in conventional blade designs the first and second pass are distributed along the blade chord and each pass occupies the full thickness of the blade, and the ribbed walls are placed adjacent to the suction and pressure surfaces of the blade. The design of the experiments shown in Figure 2b represents a geometry which has two passes with one pass adjoining the suction surface and the other pass adjoining the pressure surface of the blade. As far as the flow development and convective heat transfer is concerned, this does not change the interpretation of results in the first pass for both stationary and rotating blades, but it does result in different flow and heat transfer on the ribbed walls in the second pass by the observation that the ribs are situated on the inner and outer walls of the bend whereas in conventional designs they are not. Recently, this type of duct design has been evaluated by Singh et al. [100] to augment heat transfer on the suction as well as pressure surfaces during rotation. This would be accomplished in the design in Figure 2b by switching the flow direction where for positive rotation the wall adjoining the suction surface and the wall adjoin the pressure surface would both experience heat transfer augmentation.
2.2. Mathematical Formulation
The low speed variable property mass, momentum and energy conservation equations are solved in the domain. The dynamic viscosity and thermal conductivity variations with temperature are represented using Sutherland’s law for gases whereas the specific heat of the coolant is assumed to be constant at the inlet temperature. The non-dimensional form of these equations are listed as.
Continuity:
Momentum:
Energy:
Here, density is normalized by the inlet density calculated by the ideal gas law for a nominal coolant inlet pressure of 15 bar and temperature of 800 K, pressure is normalized by twice the dynamic head of the incoming flow , velocity is normalized by the inlet velocity, and geometrical length scales are normalized by the hydraulic diameter Dh of the duct. The temperature is non-dimensionalized by , in which is maintained at 1223 K. The dynamic viscosity and thermal conductivity are normalized by their respective inlet values at = 800 K.
With orthogonal rotation about the z-axis, where , is the rotational speed (rad/s), is the unit vector in the z-direction, and is the inlet velocity in m/s. The centrifugal force term can be written as with an implied Buoyancy parameter defined as:
The Reynolds and Prandtl numbers are defined by and with assumed values of 100,000 and 0.7, respectively. For application in generalized coordinates, Equations (7)–(9) are mapped from physical coordinates to logical/computational coordinates by a boundary conforming transformation [101].
The subgrid stress eddy viscosity is calculated using the localized dynamic Smagorinsky model [102]. The local Smagorinsky constant calculated by the dynamic procedure is constrained to be positive with a maximum permissible value of Cs = 0.2. The turbulent Prandtl number is assumed to be 0.5 such that the thermal eddy-diffusivity is twice the calculated hydrodynamic Eddy-viscosity. Because of the high Reynolds number, a zonal two layer LES wall model is also used to model the inner turbulent boundary layer. Details of this procedure are given in Patil and Tafti [96,103]. However, it should be noted that in addition to the LES wall model, it is imperative that the shear layers which emanate from the ribs are well resolved because unlike wall shear dominated flows where most of the turbulence production takes place in the boundary layers and which are modeled reasonably well by the two-layer zonal model, in the presence of ribs, most of the turbulence production occurs in the separated shear layer from the ribs. If these shear layers are not well resolved then no amount of near wall resolution will give accurate solutions, particularly for heat transfer coefficients.
The conservation equations are solved in a finite-volume framework. For all the calculations, the convection terms in the momentum equations are discretized using a second-order accurate central difference approximations except for cases when centrifugal buoyancy effect is included. In these cases, the convection terms in the energy equation use a TVD limited second-order central difference approximation. In all cases the viscous terms use second-order central difference approximations. Time-integration is performed by using a semi-implicit fractional step procedure in which the momentum equations are advanced in time by an implicit Crank-Nicolson treatment of the viscous terms and an explicit second-order Adams–Bashforth approximation for the convection terms to get an intermediate velocity field. The pressure equation is then solved to correct the intermediate velocity field and make it satisfy discrete continuity. To solve the resulting linear systems, BiCGSTAB is used with a sub-structured Jacobi iterative preconditioner [104]. The momentum, energy, and pressure equations are converged to a residual L1 norm below 1 × 10⁻⁷ at each time step. More details on the software GenIDLEST used in this study can be found in [42,101,105].
2.3. Boundary Conditions
A uniform non-dimensional flow velocity of unity (u = 1) and non-dimensional temperature (θ = 0) is specified at the inlet (x = 9.5 in Figure 2c) to the first pass. Previous studies [89,91] have shown that the state of the inlet conditions (whether steady uniform or unsteady turbulent) has very little effect on the flow development after the second or the third rib because of the massive flow perturbations introduced by the ribs. At the outflow of the second pass (x = 13.5 in Figure 2c), zero gradient conditions (dφ/dx = 0; φ = u, v, w, θ, p) are used. All surfaces have no slip, zero penetration boundary conditions imposed on them with dp/dn = 0. Unless mentioned specifically, all the calculations have a constant temperature boundary condition imposed on all surfaces of the duct. Expressed in non-dimensional terms, the inlet coolant temperature, θin = 0, and all heat transfer surfaces are specified with temperature θw = 1.
2.4. Grid Distribution
The domain is mapped by a block-structured grid with 127 blocks in the first pass, 16 blocks in the bend region and 135 blocks in the second pass for a total of 278 blocks. Each rib pitch has 14 blocks with a nominal grid size of 1.44 million grid cells with 136 × 136 × 78 cells in the x, y and z-directions. Each rib is resolved by 28 × 28 cells in the x, and y-directions, respectively. The total grid size is approximately 28.554 million cells. Figure 3 shows the grid spacing in a typical rib pitch for all three coordinate directions. In the streamwise (x-) and cross-stream (y-) direction, the spacing is finest in the vicinity of the rib and the ribbed wall. In the z-direction, the grid is refined in the vicinity of the smooth or lateral walls. Post computation, maximum values of are observed in the flow exiting the bend at Bo = 0.5, which is the most energetic. These are well within with range of validity of the zonal wall model.
2.5. Calculation Details
Typically each new calculation is started from a previous run to provide a good initial guess. For example, to initiate a run with rotation, the stationary flow and thermal fields are used as initial fields. A time step of 50 nanoseconds is used for the stationary calculations which is reduced further to 36 nanoseconds under rotation. It takes approximately 5 milliseconds for the flow to traverse the full calculation domain taking about 100,000 time steps for a single flow through. Starting from a fairly good initial guess, the flow is allowed to develop for 2.5 milliseconds before time-averaging is initiated after which mean and turbulent quantities are sampled for an additional 7.5 milliseconds. Each calculation takes approximately 25 days of wall clock time on 139 Intel E5-2680v3 2.5GHz (Haswell) cores.
The time averaged results are used to calculate the Nusselt numbers and the friction coefficient. In terms of the computed non-dimensional variables, the Nusset number is calculated as
where , is the mixed mean temperature as a function of the streamwise distance (s) measured along the flow path at the center of the duct from the inlet, and h is the heat transfer coefficient. is calculated as
where is the velocity in the streamwise direction. Note that the numerator in Equation (11) is calculated from the constructed turbulent temperature profile in the zonal treatment of the wall inner layer. The side-averaged Nusselt number on the ribbed inner and outer walls is calculated by averaging in the z-direction,
whereas the side-averaged Nusselt number on the smooth lateral walls is calculated by averaging in the y-direction.
The duct-averaged Nusselt number the ribbed sections and the 180° bend and over all heat transfer surfaces including ribs is given by
where is the total heat transfer surface area.
The friction coefficient (f) is calculated by finding the average inlet and exit pressure in the cross-sections at x = 9.5 in Figure 2c. With the non-dimensionalization used in the calculation
where S is the non-dimensional flow path length measured at the center of the duct including only the straight ribbed sections and the curved path through the bend (S = 2 × 9.5 + 2.04 = 21.04).
As is standard practice, enhancement or amplification factors of heat transfer coefficients and friction coefficients are calculated by using turbulent correlations for smooth straight duct flows given by the Dittus–Boelter correlation as
and
For Re = 100,000 and Pr = 0.7, and .
2.6. Grid Sensitivity Study
To investigate the sensitivity of the mean and turbulent quantities on the grid, three grids are investigated. The base grid of 28.6 million is supplemented by a coarser grid of 21.99 million cells and another grid of 35.288 million. Each pitch in the 22 million grid is meshed by a distribution of 120 × 120 × 80 cells in the x, y, and z directions in which the rib is resolved by 24 × 24 cells compared to the 28 × 28 cells used in the 28 million grid. In the 35 million grid, each pitch is meshed with 120 × 152 × 82 cells in the x-, y-, and z-directions, respectively with 30 × 30 cells for each rib. In addition the grid in the z-direction is redistributed to make it finer at the center. The main features of the three grids are summarized in Table 1. In all cases Δxmin is at the rib, Δymin at the rib and ribbed wall, and Δzmin at the lateral smooth walls of the duct. All grids followed the same protocol for attaining stationary conditions and time-averaging.
On the base grid of 28 million, typically, the values, where is the normal distance from the wall of the first grid point, and is the calculated local wall shear stress magnitude, are less than unity except for regions which experience strong shear such as the bend region and rib-smooth wall junction, where the very localized values reach about 20. These values are well within the accepted bounds for the wall model.
Figure 4 compares the predicted mean streamwise velocity profiles at locations before and after the bend with measured values of Iocovides et al. [98]. At location C at outer rib 9, the flow is seen to start accelerating in the inner bend region. In the middle of the bend at location H, there is very strong flow acceleration soon after which the flow separates as it navigates the inner bend turn. This is manifest in the velocity profile at location E at the 9th inner rib with the rib engulfed in the separated flow coming out of the bend. The negative flow in the separated region is compensated by accelerated flow at the outer bend.
Mean rms profiles of streamwise velocity (Urms = ) are plotted at two locations after the bend, at inner rib 10 (K) and outer rib 10 (L) in Figure 5. At location-K, the large turbulent intensities of Urms ~ 0.7 near the outer wall result from the turbulence augmentation in the flow exiting the bend aided by the shear layer from rib 10 on the outer wall. The simulations predict that Urms does not decay from location K to L which is half a pitch downstream of it whereas the experiments measure a lower Urms.
There is no substantial difference between the three grids and all of them predict the mean and turbulent field with good accuracy. Whereas the quoted uncertainty of mean and rms measurements are 2% of the mean velocity, considerable uncertainty is introduced during digitizing the measured quantities from plots given in the paper. Besides numerical errors introduced by the grid resolution, time-averaging the unsteady flow with large fluctuations about the mean can also introduce additional differences between measured and predicted values. However, judging from the close match in mean quantities between the 28 m and 35 m simulations, this does not seem to be the case.
Iacovides et al. [97] also measured the heat transfer coefficients for a stationary duct. In these experiments they applied a constant heat flux on the ribbed walls while keeping the side walls insulated. A separate set of calculations were done at Re = 100,000 on the three grids with constant heat flux applied at the inner and outer ribbed walls and zero heat flux on the smooth walls of the duct. Based on their analysis, the ribs were also assumed to be adiabatic. Expressed in non-dimensional form when the normalizing temperature scale is written as , the Nusselt number on the ribbed wall is calculated as:
where is the wall temperature obtained from the zonal wall layer model [103]. The mixed mean temperature is calculated as per Equation (12). Side-averaged Nusselt numbers are obtained as per Equation (13) to compare to experiments.
Figure 6 shows these comparisons starting after inner rib 2 and outer rib 3 up to the bend region. The predictions show large peaks upstream of the ribs which the experiments do not show and which have been observed even in past computations at lower Reynolds numbers [42,89]. These regions of high heat transfer are a result of unsteady vorticity at the junction between the rib and the ribbed wall. Immediately downstream of the rib, there is a region of low heat transfer in the primary separation zone behind the rib which gradually increases to reach a maximum near the mean reattachment line. The predictions and measurements show good agreement up to inner rib 4 and outer rib 5. Further downstream towards the bend, the experiments show the Nusselt number increasing steadily whereas the predictions show a fully-developed periodic variation between ribs till the last pitch before the bend. In effect, the experimental Nusselt numbers do not reach a fully developed state which is contrary to many past experimental [18,22,48,106,107] and computational investigations [89] in stationary ducts with similar rib configurations. In these studies the pitchwise variation in Nusselt number reaches a steady state by the third or fourth rib after which the variation remains at a constant level. The current predictions on all three grids follow that pattern. There are minor differences between the 22 million grid and the 28 and 35 million grids in predicting the peak Nusselt number, both of which give near identical predictions of the peak Nu ~ 420 and pitch mean Nu ~ 375.
While the predicted velocity and turbulent fields match well with experiments, there are some differences in the heat transfer predictions. Since the results on the 28 m and 35 million are nearly identical in all respects, the 28 million grid is used for the rest of the calculations. Further validation of mean and turbulent quantities for the stationary as well as rotating duct (Ro = 0.2) are given in the Results section.
3. Results and Discussion
The results first discuss the instantaneous flow field, followed by the mean velocity field and induced secondary flows. The mean turbulent field is then investigated by comparing Urms and turbulent shear stress with experiments and the turbulent kinetic between the three cases. Finally, heat transfer results are discussed in relation to the hydrodynamics.
3.1. Instantaneous Fields
Figure 7 compares the instantaneous coherent vorticity (λ) obtained by extracting the magnitude of complex eigenvalues of the strain rate tensor [108] and is representative of the turbulence intensities generated in the flow. The entering flow as it encounters the ribs generates turbulence in the rib induced separated shear layers which gradually diffuses to the center of the duct. In all case the flow coming out of the bend is much more turbulent than before the bend. Turbulence is generated by the shear layer which forms at the inner bend and also by the strong curvature and flow acceleration in the bend. In the stationary duct, this region is seen to exist midway between the inner and outer bend walls but which shifts towards the outer wall with rotational Coriolis and centrifugal forces. The first outer rib in the second pass as it encounters the highly accelerated flow coming out the bend generates very high turbulence intensities in the separated shear layer.
From Figure 7, in the first pass with the introduction of rotation, turbulence generation in the separated shear layers from ribs at the inner wall (trailing side) is more than that at the outer leading wall. This trend is much more evident at Bo = 0.5 together with the observation that as the flow progresses into the first pass, more turbulence diffuses to the center of the duct. Conversely, in the second pass, after the first few ribs at which the flow is dominated by the turbulence exiting the bend, for Ro = 0.2, the inner wall (leading side) shear layers have noticeably higher turbulence, which is somewhat augmented at Bo = 0.5. However, there is a clear difference between Bo = 0 and Bo = 0.5 at the outer or trailing wall. Because of the larger flow-opposing centrifugal buoyancy force acting at the inner leading wall more flow is pushed towards the outer or trailing wall which leads to higher turbulence generation—this effect opposes that of Coriolis forces and tends to equalize turbulence production on the two sides of the duct.
Figure 8 shows the corresponding instantaneous temperatures at the same instant in time. The coolant enters at a dimensionless temperature of zero and is heated by the duct walls. The thermal effect of the ribbed walls takes longer to penetrate to the center of the duct when the duct is stationary but with the introduction of rotation, the increasing turbulence and the strengthened secondary flows, which promote mixing in the cross-section of the duct, cross-stream heat transport happens faster. Higher instantaneous temperatures are present in the immediate wake of the ribs and also on the outer leading side of the first pass with the introduction of rotation. The lower turbulence intensities on the leading outer wall results in higher instantaneous temperatures at the outer wall of the bend—this is most evident in the absence of centrifugal buoyancy effects. It is only after the first 3 to 4 ribs in the second pass that the distribution of instantaneous temperature is substantially different between the three cases, after which the effect of Coriolis forces and centrifugal buoyancy set in. At this point, even instantaneously, the opposing effect of centrifugal buoyancy on the leading inner wall of the second pass can be discerned by the higher temperatures near the wall.
3.2. Mean Flow
Figure 9 plots the planar flow streamlines through the duct. Each rib is characterized by four recirculation regions—a recirculating eddy at the rib-wall junction upstream of the rib, a small recirculation region at the top of the rib, a primary recirculating region behind the rib and a secondary opposing recirculation region in the immediate wake of the rib. Instantaneously the mean recirculation regions are manifested in a highly unsteady vortex dominated flow. For the stationary duct, the predicted mean reattachment is between 4e to 4.25e, which matches well with past studies at lower Reynolds numbers [42]. In the presence of rotation, the recirculation region grows in size to about 6e at the outer leading side for Ro = 0.2, while the reattachment length decreases to 3.5e at the inner trailing side and remains at the value in the presence of centrifugal buoyancy forces. In contrast, buoyancy has a large impact on the recirculating region at the outer leading wall where the separated shear layer fails to reattach but combines with the recirculating zone on the windward size of the next rib to form a continuous recirculating region which completely engulfs the ribs.
Approaching the bend, flow near the outer wall experiences an adverse pressure gradient and as it moves into the bend a recirculation region forms at the outer wall which tends to get larger as rotation and buoyancy effects further reduce flow momentum at the outer leading wall in the approach flow. In the stationary duct the flow streamlines injected at the inlet follow a straight path through the first pass but then predominantly flow through the inner part of the bend. This boundary can be discerned by the cluster of streamlines emanating from the last outer rib before the bend. All the streamlines injected at the inlet in the z = 0.5 plane are bounded by this cluster showing that the bulk of the main flow flows through the inside of the bend. With rotation, the streamlines injected at the inlet move towards the inner trailing side of the duct in the first pass but move towards the inner leading side of the duct in the second pass consistent with the mean effect of Coriolis forces. Interestingly, as centrifugal buoyancy effects are activated, the streamlines (flow) move towards the inner trailing surface of the duct initially in the first pass but after the fifth rib veer towards the leading outer wall. This is attributed to the secondary flow which gains strength and transport fluid from the inner trailing wall to the outer leading wall of the duct. The difference with Ro = 0.2 is more stark in the second pass in which counter to the effect of Coriolis forces, centrifugal buoyancy pushes the flow towards the outer trailing wall.
As the flow enters the second pass, the accelerated flow velocities create a large recirculation zone behind the first outer rib it encounters with a much smaller recirculation at the next rib. These results are consistent with experimental observations [98]. It is observed that the flow redirection in the second pass to the inner leading wall for Ro = 0.2 and to the trailing outer wall for Bo = 0.5 starts as soon as the flow exits the bend. Because of the high turbulence intensities in the flow, both Coriolis and centrifugal buoyancy forces do not have as large an effect on rib induced separation zones as they did in the first pass.
As alluded to in Figure 9, secondary flows set up in the cross-section also have an effect on transport of momentum and heat. Figure 10 shows the secondary flows in the cross-section of the duct in the first pass. Two locations are selected, one at which the rib is at the inner or trailing wall and the other with the rib at the outer leading wall. For the stationary configuration, the general structure of the secondary flow is the same at both locations at which flow is directed away from the rib towards the center of the duct with small eddy zones forming on the side or smooth walls biased towards the side opposite to the rib. The main effect of the secondary flow is on the smooth side walls. In both cases regions of high velocity (~20% of mean flow velocity) form near the junction of the rib with the side smooth wall. Also associated with the secondary flow is a z-directional component of velocity (not shown) directed towards the smooth wall at the rib-wall junction.
With the introduction of rotation, asymmetries appear at the two locations. The secondary flow generated by the rib at the inner wall (x = 3.05) is stronger than that generated by the rib at the outer wall (x = 3.55) and dominates. The flow streamlines show that the outward flow generated at the inner wall is quickly diverted towards the smooth walls and entrained into the secondary flow structures near the smooth walls. The effect of this is to increase the negative v-velocity near the smooth wall and increase shear and heat transfer. Contrary, the flow originating from the outer rib exhibits a very different secondary flow structure which is dominated by the secondary flow structures generated at the inner wall rib. Streamline patterns show that part of the flow directed towards the inner wall is entrained into the recirculating flow at the smooth walls thus replenishing the strength of the secondary flow till the next inner rib. This not only influences heat transfer to the smooth walls but also changes the magnitude and distribution of heat transfer on the inner wall. The flow redirected from the center of the duct towards the smooth walls results in regions of high shear at the inner wall biasing the peak heat transfer towards the smooth walls.
Canonical secondary flows in 180° bends are characterized by Dean vortices which result from radial pressure gradients because of the accelerating flow around the bend and streamline curvature. Dean vortices are characterized by radially outward flow at the center of the cross-section, off-center impingement on the outer wall after which the flow is re-directed radially inward along the side walls of the bend setting up two well defined rotational cells in each half [89,109]. It is noted that in most previous studies of flow in 180° bends, the smooth walls in the straight section lead into the bend to form the inner and outer radial walls of the bend. In the present study, the ribbed walls (inner trailing wall and outer leading wall) lead into the bend and thus rotation and centrifugal buoyancy will have a much larger impact on the flow structure in the bend. Because of this, the secondary flow structures in the bend are topologically more complex and do not resemble canonical Dean Vortices. Figure 11 shows planar streamlines and the x-directional velocity (or radially outward velocity) distribution in the center plane of the bend at y = 0 (location H in Figure 2c). Also shown is the z-directional velocity in the close vicinity of the outer wall created by the up wash and downwash of the secondary flow. In all three cases there is a radially outward velocity between 50–60% of the mean flow velocity. The radially outward flow sets up two counter-rotating cells, one each in half the cross-section. The asymmetries about y = 0 exist because of the finite time-averaging of the highly unsteady and turbulent flow in the bend. The formation of these cells induces high radially inward velocities at the smooth walls and high positive and negative z-directional velocities of the order of 40% of the mean flow velocity in the vicinity of the outer wall. The introduction of rotation tends to weaken the secondary flow reducing the induced z-directional velocity near the outer wall and also the radial velocity at the smooth walls. This results from the reduced momentum of flow at the outer leading wall in the first pass. With the introduction of centrifugal buoyancy effects at Bo = 0.5, the secondary flow starts gathering strength again.
Figure 12 plots the mean velocity at different streamwise locations in the center of the duct at z = 0.5 starting from locations A–B in the first pass. Combined half-profiles at location A and B are used to plot the mid-rib-pitch profile on the inner and outer surfaces. For the stationary duct, the velocity profile at (A–B) is symmetric about the center. Asymmetries appear with the introduction of rotation—on the outer leading wall the growth of the recirculating zone behind the rib is captured by the negative velocity which becomes larger under the influence of centrifugal buoyancy. At the inner trailing wall the gradient of velocity increases with rotation. At the end of the first pass (C), with rotation the peak in the mean velocity profile has shifted towards the inner trailing wall and continues to shift further for Bo = 0.5. At the entrance to the bend (F), the velocity accelerates at the inner bend and decelerates at the outer wall—the degree of acceleration increases with Coriolis and centrifugal buoyancy forces as the fluid near the inner trailing wall gains more momentum. The positive velocities at the outer wall at (F) captures the recirculation zone as the flow enters the bend. Midway through the bend (H), the streamwise velocity at the inner bend has accelerated to between 1.75 to 2.5 times the mean velocity but the flow is still attached to the inner wall.
Coming out of the bend (D), the flow at the inner wall has separated and the flow momentum has shifted from the inner to the outer part of the duct towards the trailing wall. In the predictions, Coriolis forces have no effect on the size of the separation zone at that location, whereas the measurements show a smaller separation region. The introduction of centrifugal buoyancy increases the size of the separation region at the inner wall while pushing more of the flow towards the outer wall of the duct. The first inner rib in the second pass (E) is engulfed in the separation zone as shown in Figure 9. The predicted trends at (E) show that the separation zone has increased in size with rotational Coriolis as well as centrifugal buoyancy forces. Measurements show a similar trend between the stationary and rotating duct contrary to the observed trends for flow coming out of the bend at D. As the flow progresses into the second pass and encounters the first outer rib (J), the large flow velocities combined with the relatively lower normalized (by local velocity) turbulence intensities induces a large recirculation zone in the wake of the rib. It is observed that in this region up to (L), which includes the first two ribs in the second pass, the mean flow is quite independent of Coriolis and centrifugal buoyancy effects. It is only at (L) that a noticeable difference appears between the stationary and rotating condition as the effect of Coriolis forces starts to accelerate the flow at the inner leading side of the duct. Centrifugal buoyancy at Bo = 0.5 increases the velocity on the outer or trailing side of the duct but does not significantly affect the flow profile at the inner wall. Finally, at M–N, the effect of Coriolis forces is to increase the velocity gradient at the inner leading wall while decreasing it slightly at the outer trailing wall. Centrifugal buoyancy force which opposes the main flow does not affect the profile much near the leading inner wall but increases the velocity gradient at the outer trailing wall.
Figure 13 shows the variation of mean pressure in the duct for the three cases. The pressure at the inlet is nominally zero. The effect of centrifugal pumping can be clearly seen when Bo = 0.5. During outward flow, centrifugal pumping adds pressure to the flow, which decreases during inward flow. However, there is a net loss in pressure between the exit and inlet. Table 2 shows the mean cross-sectional pressure drop between the inlet and an outlet section at x = 9.5 inline immediately after the last rib in the second pass, the friction coefficient according to Equation (16) and the ratio of , where is defined in Equation (18). Friction increases nominally under the influence of Coriolis forces but decreases when centrifugal buoyancy is included in the calculation. This effect, that the pressure head required to pump the less dense flow inward being smaller than the centrifugal pressure head gained during the outward pumping of the cooler denser flow, can only be captured when temperature dependent variable density is used in the calculation. In practice however, centrifugal pumping will increase the coolant flow.
3.3. Mean Turbulence
The contours of turbulent kinetic energy (TKE) at the center of the duct, z = 0.5 in Figure 14 gives an overall picture of the variation of turbulence as the flow develops in the duct. In the straight ribbed sections turbulence is primarily produced in the separated shear layers that form on each rib. After flow reattachment in each pitch, the developing wall boundary layer also produces turbulence. However, turbulence produced in the rib induced shear layers dominates the turbulence generation in the straight ribbed sections. This can be clearly identified in the first pass of the stationary duct, in which the maximum TKE is in the rib induced shear layers with magnitudes between 15–20% when normalized by the mean velocity squared. In comparison a canonical zero pressure gradient turbulent boundary layer has a maximum value of about 0.76%. In the bend, there are two regions of high TKE—one of them being the separated shear layer at the inner bend and the other more diffuse region is in the middle of the bend radius where strong shear is induced as the outer flow accelerates around the bend. Thus the flow exiting the bend has much higher levels of TKE than the flow entering it. These high levels are sustained for the first few ribs in the second pass after which the TKE starts decaying back to its normal value.
At Ro = 0.2, TKE production is augmented at the inner trailing wall in the first pass while it is attenuated at the outer leading wall, both in the separated shear layer and in the boundary layer. TKE levels are also higher in the flow exiting the bend with a more energetic separated shear layer at the inner bend—probably because of the high TKE entering the inner bend and also the augmenting effect of Coriolis forces at the inner leading wall in the second pass. As the flow travels into the second pass, the effect of Coriolis forces start having a larger impact on the TKE distribution by which TKE is augmented near the inner leading wall and attenuated at the outer trailing wall of the duct.
The inclusion of centrifugal buoyancy in the first pass further adds to the effect of Coriolis forces by which the magnitude of TKE at the inner trailing wall is augmented further. However, the expectation from phenomenological arguments that centrifugal buoyancy will further reduce the TKE at the outer leading wall does not come to fruition. In fact, centrifugal buoyancy increases the level of TKE. This is the result of strong shear that is created between the large recirculation zones engulfing the ribs and the main flow as shown in Figure 9. The large recirculation zones were first observed by Sewall and Tafti [110] at Re = 20,000 and later verified by experiments of Coletti et al. [41]. Because of this, the flow entering the bend is much more turbulent, which is augmented further in the bend by the separated shear layer and the strong flow curvature and acceleration. This leads to high values of TKE (up to 60%) in the separated shear layer exiting the inner bend. As the flow travels into the second pass, despite the opposition of centrifugal buoyancy forces, higher TKE values are still sustained at both the inner and outer walls more than with rotational Coriolis forces only.
Figure 15 plots the rms fluctuations of the streamwise velocity (Urms = ) at different locations in the duct. For comparison, a canonical turbulent boundary layer has a peak value of 10%. Location A–B gives an estimate of the typical mid-rib profile of Urms towards the end of the first pass but which has not yet been affected by the bend. For the stationary duct, the plotted profile lies downstream of mean reattachment and a boundary layer has started developing. The maximum in the wall boundary layer is 20% of mean velocity, increasing to between 30 to 35% in line with the rib surface, decaying to about 10% at the duct center. With the introduction of rotation, Ro = 0.2, there is an increase in the streamwise turbulent fluctuations in the boundary layer as well as the shear layer at the inner trailing side of the duct to magnitudes of approximately 25% and 45%, respectively. The increase at the inner trailing side also affects the centerline rms values which doubles to about 20%. These then decay to 25% and 15% in the shear and boundary layer at the outer leading side as Coriolis forces stabilize the flow. With the introduction of centrifugal buoyancy, Bo = 0.5, there is a sharp increase in rms values at the inner trailing side with values of 40% and 60%, respectively in the boundary layer and the shear layer. However, contrary to phenomenological arguments, according to which turbulence should decrease further at the outer leading wall, Urms values increase instead. This is a result of the strong shear between the recirculation zone surrounding the ribs and the main flow which aid the production of turbulence coupled with the transport of turbulence from the trailing side by secondary flows in the cross-section.
As the flow approaches the bend, location (C) shows similar relative trends between stationary, Ro = 0.2, and Bo = 0.5. At (F), the measured Urms is higher than the predicted values going into the bend for Ro = 0.2, particularly at the inner side, whereas there is very good agreement for the stationary case. Coming out of the bend at (D), maximum Urms values occur in the separated shear layer from the inner bend with peak values of at the interface between the inner separated flow and the outer accelerating flow reaching values of ~52%, ~62%, and 72%, respectively, for stationary, Ro = 0.2 and Bo = 0.5. In the outer half of the duct, Urms varies between 20% to 30%. Because of the highly accelerated flow at location (J) when the flow encounters the first outer rib, the shear layer that forms on the rib is highly unsteady with peak Urms values between 85% for the stationary duct and over a 100% of the mean velocity for Bo = 0.5. These large fluctuations in streamwise velocity are transported downstream and are still present at location (J) in the outer half of the duct with values ranging between 60% to 75% which are similar to the peak values in the shear layer at the inner rib. Still further into the second pass at (L), Urms is relatively uniform across the height of the duct ranging between 35% and 60%. It is noteworthy that in the early part of the second pass, Coriolis force effects are not discernable—as if the highly turbulent flow is impervious to other secondary effects. Based on phenomenological arguments, centrifugal buoyancy should oppose the flow momentum at the inner leading side more than the outer trailing side in inward flow. However, centrifugal buoyancy tends to increase Urms across the height of the duct because of the higher turbulence intensities entering the second pass when centrifugal buoyancy effects are included. About 6 to 7 rib pitches into the second pass at locations (M–N), the effect of Coriolis forces is discernable by the reduction of Urms at the outer trailing wall and the increase in Urms at the leading inner wall. However, contrary to expectations, not only does centrifugal buoyancy increase Urms at the outer trailing wall but also (though the increase is small) at the leading inner wall. It is also noteworthy that unlike the first pass in which the introduction of Coriolis and centrifugal buoyancy forces lead to recirculation zones large enough to engulf the ribs on the outer leading wall, this phenomenon is absent at the outer leading wall in the second pass as can be observed in Figure 9.
Figure 16 plots the turbulent shear stress (−uv = ) at select locations in the first and second pass. Five to six ribs into the first pass (A–B) at mid rib pitch, the peak magnitude of ~0.03 occurs in the separated shear layer on the ribs for the stationary case. In comparison, a zero pressure turbulent boundary layer exhibits a peak value of 0.0015. With the introduction of rotation, the peak shear stress is reduced to ~0.015 at the outer leading wall while it increases to ~0.07 at the inner trailing wall. The introduction of centrifugal buoyancy increases this value further to a peak of ~0.09 at the trailing wall and similar to Urms also increases the peak value at the outer leading wall to ~0.03. At the exit from the bend at (D), the magnitudes of shear stress follow the same trend as Urms and remain relatively constant in the outer trailing half of the duct with values below ~0.03. Peak magnitudes of −uv occur in the region separating the inner separated flow and the accelerated outer flow and varies between ~0.065 to −0.085. It is noted that the predicted peak values assume the same distance from the inner wall as Urms, both of which show that Coriolis forces tend to push the shear layer closer to the inner wall. These high turbulent stresses are transported to the first inner rib (E). While the shear stress in the stationary duct decays considerably at this location, both rotational flows with and without centrifugal buoyancy approach peak values of ~0.1 and ~0.2, respectively. At location (E), (J), and (K), the predicted location of peak shear stress at Ro = 0.2 is always closer to the inner wall than measurements which show a somewhat smaller peak at a location further away from the inner wall. Further downstream at (M–N), the same observations as for Urms can be made. Coriolis forces reduce turbulent shear stress at the outer trailing wall while increasing the peak value by a factor of two at the inner leading wall. Centrifugal buoyancy, on the other hand increases the turbulent shear stress at the outer trailing wall but also at the leading inner wall though the increase is of a smaller magnitude.
It is clear from the TKE contours, Urms and −uv profiles, that the augmented turbulence exiting from the inner bend, which is continuously reinforced by the ribs, dominates flow characteristics for most of the second pass. Thus, Coriolis forces and centrifugal buoyancy do not have as large an impact on the flow in the second pass as they do in the first pass.
3.4. Heat Transfer
The heat transfer coefficient has a strong correlation to flow turbulence. Figure 17 shows the distribution of the enhancement factor () on the ribbed inner and outer walls in the first pass. Generally, on the ribbed wall, maximum enhancement occurs at the upstream corner of the rib–wall junction which is populated by highly unsteady junction vortices which enhance mixing. This is followed by the region just downstream of reattachment in each rib pitch at the center of the duct. For the stationary duct, barring the first one to two rib pitches during which the flow is still developing, the maximum EF after reattachment is between 2.25–2.5. The heat transfer has reached a fully developed state by the third rib pitch after which the EF distribution does not change in magnitude till the flow approaches the bend. Just before the bend, as the flow accelerates at the inner wall, the EF increases, whereas on the outer wall the flow deceleration results in a decrease in EF.
Rotational Coriolis forces at Ro = 0.2, augments the EF on the inner trailing wall and decreases EF on the leading side. Contrary to the stationary duct, the EF does not reach a fully-developed state at the inner wall, undergoing continuous augmentation, whereas on the leading side the pitch-to-pitch variation is not as strong. This results from the secondary flow which continuously gains strength as the flow traverses the first pass.
The introduction of centrifugal buoyancy, Bo = 0.5, reinforces these trends on the trailing side with EF reaching values above 3.5 over the whole pitch. However, on the outer leading side, there is an initial decrease in EF after which it starts to recover and increase after about the fourth rib as turbulence production increases in the shear layer formed between the inner recirculation flow and the mainstream flow (Figure 14) and the secondary flow transports momentum from the inner to the outer wall. This enhances mixing and increases the heat transfer coefficient. The increase in heat transfer on the leading side, both, as Bo increases, and as the flow traverses into the first pass for low to moderate buoyancy parameter, has been observed in past experiments [48] as well as predictions [110]. Not quite evident at Ro = 0.2, but clearly visible with the introduction of centrifugal buoyancy is the shift of the peak EF from the center to the sides in the z-direction. As stated earlier, this phenomenon results from secondary flows induced by Coriolis and centrifugal buoyancy effects.
Figure 18 shows the enhancement factors in the bend. In general, the inner bend exhibits very high heat transfer resulting from the strongly accelerating flow which produce high shear and turbulence intensities. The EF increases with rotation and with centrifugal buoyancy. The heat transfer EFs at the outer wall in general trend with the secondary flow in the cross-section as shown in Figure 11. The introduction of rotation and the resulting flow stabilization at the first pass outer leading wall results in a reduction in EF at the outer wall in the bend. Regions of high heat transfer closely match regions of up wash and downwash induced by the secondary flow. Not surprisingly, the reduction in strength of the secondary flow in the bend with Coriolis forces, also reduces the heat transfer. The inclusion of centrifugal buoyancy increases the strength of the secondary flow and also the heat transfer.
Flow exiting the bend and entering the second pass is shown in Figure 19. Generally, heat transfer enhancement factors are higher in the second pass than the first pass. At the inner wall, the separated flow from the bend reattaches between the first and second rib and results in a region of high heat transfer, which is augmented further by Coriolis forces but not so much by centrifugal buoyancy effects. The presence of high turbulence intensities in this region leads to a highly energetic shear layer which forms a very small recirculation region behind the second rib where the maximum enhancement is reached. As the flow moves into the second pass, EF on the inner leading wall decays gradually while still maintaining EFs higher than or comparable to the values in the first pass. The inclusion of rotational Coriolis forces sustains a higher heat transfer coefficient than the stationary case. According to phenomenological arguments, centrifugal buoyancy should act in opposition to the effect of Coriolis forces and reduce the heat transfer. However, it has the opposite effect of increasing heat transfer further by a small amount. This can be explained by the high levels of turbulence entering the second pass under the influence of centrifugal buoyancy and which effectively counteract any other effect tending to reduce the heat transfer on the leading side.
At the outer trailing wall, the footprints of the enhancement effected by the secondary flow in the bend is present as the flow exits the bend. The outer flow has accelerated velocities between 1.5 to 2.0 times the mean velocity and relative lower turbulence intensities than the inner flow. As the flow impinges on the first rib it forms a region of high heat transfer immediately upstream of the first rib at x = 0.9 and results in a large recirculation zone behind it spanning the entire rib pitch (up to x = 1.9). The redirection of colder fluid to the wall by the recirculation enhances the heat transfer in this region. Downstream of the third outer rib at x = 3, heat transfer enhancement decreases gradually, however enhancement factors remain much higher than the outer wall in the first pass. The action of Coriolis forces decreases heat transfer as the flow traverses further into the second pass but the reduction is not as drastic as observed in the first pass. The higher turbulent intensities with centrifugal buoyancy act to increase the heat transfer coefficients.
Figure 20 summarizes the heat transfer results on the ribbed walls by plotting the pitch-averaged Nusselt numbers. In the first pass, the stationary duct has reached a fully-developed stage by the fourth rib pitch on both walls (s = 4), whereas the rotating duct does not reach a fully-developed stage at the inner wall for both, Bo = 0 and Bo = 0.5. The mean pitch-averaged augmentation ratio of ~1.8 for the stationary duct in the fully developed region matches well with the experimental investigation at Re = 60,000 by Ekkad and Han [106]. In their investigation the fully-developed pitch-averaged EF varied between 2.5 at Re = 6000 to ~1.8 at Re = 60,000. At the outer leading wall in the rotating duct after an initial steep decrease in heat transfer, the Nusselt number assumes a near constant value between the fifth and the seventh rib. It is notable that Bo = 0.5 does not reduce the Nusselt number further but increases it ever so slightly over Bo = 0.0. Leading into the bend the heat transfer increases in the open area after the last rib at the inner wall (at s = 9 in Figure 20a) but decreases drastically at the outer wall caused by loss in momentum as the flow decelerates (at s = 9.25 in Figure 20b). At the inner bend wall, heat transfer is increased for Ro = 0.2 and further at Bo = 0.5 due to the enhanced turbulence generated at the first pass inner wall. At the bend outer wall, Ro = 0.2 decreases heat transfer, but Bo = 0.5 increases it again to the same level as a stationary duct. The inner region between the exit to the bend and the first inner rib lies in the recirculation region and thus experiences low heat transfer after which the pitch-averaged heat transfer increases to a maximum in the first pitch and then decays. The decay is much more gradual for Ro = 0.2 and Bo = 0.5 than for the stationary duct. At the outer wall after the bend the heat transfer remains at nearly a constant value, except at Bo = 0.5 which shows a peak in the first section (s = 13.5) before the rib, and then starts to decay at the third rib pitch (s > 16), but still maintains values much higher than the first pass.
Together with the ribbed walls, the smooth lateral walls also play an important role in cooling. Figure 21 shows the distribution of heat transfer enhancement on the smooth wall of the duct (only one wall is shown as there are minor inconsequential differences between the two walls). The heat transfer on the smooth wall is characterized by regions of high transfer near the ribs and lower heat transfer towards the center of the wall. In the stationary duct, secondary flow in the cross section near the rib-wall junction (Figure 10) produce regions of high heat transfer with peak EF values between 3 to 3.5 in the first pass with a region of EFs between 2 to 2.5 extending to approximately two ribs heights from the ribbed wall. With the introduction of rotation, the effect of Coriolis forces is to increase the heat transfer on the inner trailing side by fortifying the secondary flow in the duct near the inner trailing wall expanding the region of high heat transfer. It is noted that the secondary flow gets stronger as the flow traverses into the first pass and the region of high heat transfer (EF extends halfway through the duct) correlates with the fortified up wash created by the secondary flow at the smooth walls in Figure 10. This is further strengthened by the effects of centrifugal buoyancy, where now the region of high EFs between 2 to 2.5 extends all the way through the duct from the inner to the outer wall.
In the bend, the net effect of Coriolis forces at Ro = 0.2 is to reduce the heat transfer on the smooth walls effected by the fact that the early part of the bend is dominated by the flow from the outer leading wall which has low turbulent intensities. At Bo = 0.5, because the secondary flow transports turbulence to the center of the duct in the first pass, the heat transfer in the bend increases again. This effect can be observed in Figure 14. For all three cases, the smooth walls in the second half of the bend experienced an increase in heat transfer as the flow accelerates around the bend and turbulent intensities in the vicinity of the wall increase. In the early part of the second pass, centrifugal buoyancy has the largest effect on heat transfer. However, as the flow progresses into the second pass, the increase in heat transfer on the leading inner side of the smooth wall under rotation is compensated by the decrease on the trailing outer side, resulting in minor differences in side-averaged heat transfer as shown in Figure 22. In Figure 22 the mean EF ranges between 1.5 to 2 in the first pass after the first 3 to 4 ribs and varies between 3 to 1.75 in the second pass as seen in Figure 22.
Table 3 summarizes the duct-average Nusselt number, averaged over the ribbed section in the first and second passes, including all rib surfaces, and in the bend region. Coriolis forces have little impact on the mean Nusselt number, whereas centrifugal buoyancy Bo = 0.5, increases the Nusselt number by 10%.
4. Conclusions
A duct with 17 pairs of transverse staggered ribs in a two-pass arrangement with a 180° turn is simulated at Re = 100,000 using LES under stationary, and rotating conditions with Ro = 0.2 and Bo = 0.5. The following major conclusions are made.
- Comparison between LES predictions and experimental measurements shows that the mean velocity and turbulent stresses agree well in spite of the highly turbulent flow. Turbulent intensities as high as 100% are present in the flow after the bend.
- Secondary flows in the first pass have a strong effect on flow and heat transfer. Rotational Coriolis and centrifugal buoyancy force increase the strength of the secondary flows as the flow traverses into the first pass. As the secondary flow strengthens it has two major effects. It transports fluid from near the leading side at the center of the cross-section and impinges on the trailing wall shifting the region of peak enhancement towards the side walls. The secondary flow also creates a strong up wash region from the trailing side to the leading side at the side walls which aids the transport of mean flow and turbulence to the leading side of the duct. The effect is strongest under centrifugal buoyancy. This results in net transport of fluid momentum towards the leading wall countering the Coriolis effect and consequently increasing turbulence and heat transfer at the leading wall towards the end of the first pass. The up wash created by the secondary flow at the side walls enhances heat transfer on the side walls as well.
- Predictions agree with phenomenological arguments on the effect of centrifugal buoyancy in radially outward flow (first pass) except for the increase in heat transfer at the leading side as the secondary flow strengthens, which can be substantial at higher Buoyancy parameters. The high turbulent intensities of flow exiting the bend under the effect of centrifugal buoyancy succeed in increasing heat transfer on both trailing and leading walls in the second pass contrary to the expected trend.
- Coriolis forces despite having a large effect on local heat transfer distributions at the trailing and leading side, have a duct averaged heat transfer coefficient which is nearly identical to the stationary duct. Centrifugal buoyancy increases the overall heat transfer coefficient by about 10% and also reduces frictional losses by 10% over a stationary duct due to centrifugal pumping.
This investigation shows that LES is a viable prediction tool at high Reynolds numbers. Because of the difference in the placement of the ribs from past studies at lower Reynolds numbers, it is not possible to make comparisons in the second pass to discern the effect of Reynolds number. In the first pass however, the qualitative behavior of the flow and heat transfer under rotating conditions is quite similar to that at lower Reynolds numbers of O(104). Quantitatively, as shown by past experimental studies, the enhancement factor of heat transfer decreases with Reynolds number. Beyond this observation, a detailed quantitative comparison of the effect of Reynolds number on flow and turbulent quantities can only be made if the same geometry is calculated under the same rotating conditions and could be the subject of future work. The comprehensive integrated flow and heat transfer data that can be obtained by LES is unparalleled by current day experimental techniques. The main drawback of high computational cost can be overcome by using modern computing architectures equipped with accelerators such as Graphics Processing Units (GPUs) [111].
Author Contributions
The authors made the following contributions to this article. Conceptualization, D.T. and C.D.; Methodology, C.D. and D.T.; Software, D.T.; Validation, C.D., X.T.; Formal Analysis, D.T., C.D.; Investigation, D.T., C.D., X.T.; Resources, D.T.; Data Curation, D.T., C.D., X.T.; Writing-Original Draft Preparation, D.T.; Writing-Review & Editing, D.T.; Visualization, D.T.; Supervision, D.T.; Project Administration, D.T.
Funding
This research received no external funding.
Acknowledgments
The authors acknowledge Advanced Research Computing (ARC) at Virginia Tech for computational resources. X. Tan was supported by the Chinese Scholarship Council.
Conflicts of Interest
The authors declare no conflict of interest.
Nomenclature
| Buoyancy parameter, | |
| Cp | Specific heat |
| Hydraulic diameter of duct | |
| e | Square rib dimension |
| EF | Enhancement factor, |
| f | Friction coefficient |
| h | Heat transfer coefficient |
| Unit normal Cartesian vectors | |
| k | Thermal conductivity |
| n | Normal coordinate direction |
| Nu | Nusselt number, |
| P | Rib pitch |
| p | Pressure |
| Pr | Prandtl number, |
| Wall heat flux | |
| Radial vector, () from axis of rotation | |
| Radial distance from axis of rotation, | |
| Re | Reynolds number, |
| Ro | Rotation number, |
| s | Distance along flow direction |
| T | Temperature |
| TKE | turbulent kinetic energy, |
| Cartesian coordinate vector, (x,y,z) or (X,Y,Z) | |
| Cartesian velocity vector, (u,v,w) or (U,V,W) | |
| −uv | Turbulent shear stress, |
| uτ | Local friction velocity |
| Us | Mean velocity in direction of flow |
| Urms | Root meam square turbulent fluctuations in x-direction, |
| Greek: | |
| β | Volumetric thermal expansion coefficient |
| μ | Dynamic viscosity |
| ν | Kinematic viscosity |
| Non-dimensional temperature, | |
| ρ | Density |
| Angular velocity, () | |
| Computational coordinates, | |
| Subscripts: | |
| 0 | Baseline value |
| exit | At exit |
| in | At inlet |
| m | Mixed mean |
| w | At wall |
References
- Han, J.C. Heat Transfer and Friction in Channels with Two opposite Rib-Roughened Walls. J. Heat Transf. 1984, 106, 774–781. [Google Scholar] [CrossRef]
- Han, J.C. Heat Transfer and Friction Characteristics in Rectangular Channels with Rib Turbulators. J. Heat Transf. 1988, 110, 321–328. [Google Scholar] [CrossRef]
- Chyu, M.K.; Hsing, Y.C.; Shih, I.-P.; Natarajan, V. Heat Transfer Contributions of Pins and Endwall in Pin-Fin Arrays: Effects of Thermal Boundary Condition Modeling. In Proceedings of the International Gas Turbine & Aeroengine Congress & Exhibition, Orlando, FL, USA, 2–5 June 1997. [Google Scholar]
- Chyu, M.K.; Yu, Y.; Ding, H.; Downs, J.P.; Soechting, F.O. Concavity Enhanced Heat Transfer in an Internal Cooling Passage. In Proceedings of the ASME 1997 International Gas Turbine and Aeroengine Congress and Exhibition, Orlando, FL, USA, 2–5 June 1997. [Google Scholar]
- Singh, P.; Pandit, J.; Ekkad, S.V. Characterization of heat transfer enhancement and frictional losses in a two-pass square duct featuring unique combinations of rib turbulators and cylindrical dimples. Int. J. Heat Mass Transf. 2017, 106, 629–647. [Google Scholar] [CrossRef]
- Parbat, S.N.; Siw, S.C.; Chyu, M.K. Impingement Cooling in Narrow Rectangular Channel with Novel Surface Features. In Proceedings of the ASME Turbo Expo 2016: Turbomachinery Technical Conference and Exposition, Seoul, Korea, 13–17 June 2016; p. V05AT13A033. [Google Scholar] [CrossRef]
- Taslim, M.E.; Pan, Y.; Bakhtari, K. Experimental Racetrack Shaped Jet Impingement on a Roughened Leading-Edge Wall with Film Holes. In Proceedings of the ASME Turbo Expo 2002: Power for Land, Sea, and Air, Amsterdam, The Netherlands, 3–6 June 2002; pp. 897–906. [Google Scholar] [CrossRef]
- Taslim, M.E.; Bakhtari, K.; Liu, H. Experimental and Numerical Investigation of Impingement on a Rib-Roughened Leading-Edge Wall. J. Turbomach. 2003, 125, 682–691. [Google Scholar] [CrossRef]
- Taslim, M.E.; Rosso, N. Experimental/Numerical Study of Multiple Rows of Confined Jet Impingement Normal to a Surface at Close Distances. In Proceedings of the ASME Turbo Expo 2012: Turbine Technical Conference and Exposition, Copenhagen, Denmark, 11–15 June 2012; p. 193. [Google Scholar] [CrossRef]
- Mensch, A.; Thole, K.A. Conjugate heat transfer analysis of the effects of impingement channel height for a turbine blade endwall. Int. J. Heat Mass Transf. 2015, 82, 66–77. [Google Scholar] [CrossRef] [Green Version]
- Martin, E.L.; Wright, L.M.; Crites, D.C. Impingement Heat Transfer Enhancement on a Cylindrical, Leading Edge Model with Varying Jet Temperatures. J. Turbomach. 2013, 135, 031021. [Google Scholar] [CrossRef]
- Liou, T.-M.; Wu, Y.-Y.; Chang, Y. LDV Measurements of Periodic Fully Developed Main and Secondary Flows in a Channel with Rib-Disturbed Walls. J. Fluids Eng. 1993, 115, 109–114. [Google Scholar] [CrossRef]
- Liou, T.-M.; Hwang, J.-J. Developing Heat Transfer and Friction in a Ribbed Rectangular Duct with Flow Separation at Inlet. J. Heat Transf. 1992, 114, 565–573. [Google Scholar] [CrossRef]
- Park, C.W.; Lau, S.C.; Kukreja, R.T. Heat (Mass) Transfer in a Rotating Channel with Ribs of Various Sizes on Two Walls. J. Thermophys. Heat Transf. 1998, 12, 452–454. [Google Scholar] [CrossRef]
- Korotky, G.J.; Taslim, M.E. Rib Heat Transfer Coefficient Measurements in a Rib-Roughened Square Passage. J. Turbomach. 1998, 120, 376–385. [Google Scholar] [CrossRef]
- Taslim, M.E.; Wadsworth, C.M. An Experimental Investigation of the Rib Surface-Averaged Heat Transfer Coefficient in a Rib-Roughened Square Passage. J. Turbomach. 1997, 119, 381–389. [Google Scholar] [CrossRef]
- Taslim, M.E.; Bondi, L.A.; Kercher, D.M. An Experimental Investigation of Heat Transfer in an Orthogonally Rotating Channel Roughened with 45 deg Criss-Cross Ribs on Two Opposite Walls. J. Turbomach. 1991, 113, 346–353. [Google Scholar] [CrossRef]
- Mochizuki, S.; Murata, A.; Shibata, R.; Yang, W.J. Detailed measurements of local heat transfer coefficients in turbulent flow through smooth and rib-roughened serpentine passages with a 180° sharp bend. Int. J. Heat Mass Transf. 1998, 42, 1925–1934. [Google Scholar] [CrossRef]
- Mochizuki, S.; Murata, A.; Fukunaga, M. Effects of Rib Arrangements on Pressure Drop and Heat Transfer in a Rib-Roughened Channel with a Sharp 180 deg Turn. J. Turbomach. 1997, 119, 610–616. [Google Scholar] [CrossRef]
- Rau, G.; Çakan, M.; Moeller, D.; Arts, T. The Effect of Periodic Ribs on the Local Aerodynamic and Heat Transfer Performance of a Straight Cooling Channel. In Proceedings of the ASME 1996 International Gas Turbine and Aeroengine Congress and Exhibition, Birmingham, UK, 10–13 June 1996; p. V004T09A061. [Google Scholar] [CrossRef]
- Liou, T.-M.; Tzeng, Y.-Y.; Chen, C.-C. Fluid Flow in a 180 deg Sharp Turning Duct with Different Divider Thicknesses. J. Turbomach. 1999, 121, 569–576. [Google Scholar] [CrossRef]
- Han, J.C.; Chandra, P.R.; Lau, S.C. Local Heat/Mass Transfer Distributions Around Sharp 180 deg Turns in Two-Pass Smooth and Rib-Roughened Channels. J. Heat Transf. 1988, 110, 91–98. [Google Scholar] [CrossRef]
- Liou, T.-M.; Chen, M.-Y.; Tsai, M.-H. Fluid Flow and Heat Transfer in a Rotating Two-Pass Square Duct with In-Line 90-deg Ribs. J. Turbomach. 2002, 124, 260–268. [Google Scholar] [CrossRef]
- Chanteloup, D.; Juaneda, Y.; Bölcs, A. Combined 3D Flow and Heat Transfer Measurements in a 2-Pass Internal Coolant Passage of Gas Turbne Airfoils. In Proceedings of the ASME Turbo Expo 2002: Power for Land, Sea, and Air, Amsterdam, The Netherlands, 3–6 June 2002; pp. 509–520. [Google Scholar] [CrossRef]
- Chang, S.W.; Liou, T.-M.; Po, Y. Coriolis and rotating buoyancy effect on detailed heat transfer distributions in a two-pass square channel roughened by 45° ribs at high rotation numbers. Int. J. Heat Mass Transf. 2010, 53, 1349–1363. [Google Scholar] [CrossRef]
- Abraham, S.; Vedula, R.P. Heat transfer and pressure drop measurements in a square cross-section converging channel with V and W rib turbulators. Exp. Therm. Fluid Sci. 2016, 70, 208–219. [Google Scholar] [CrossRef]
- Coletti, F.; Maurer, T.; Arts, T.; Di Sante, A. Flow field investigation in rotating rib-roughened channel by means of particle image velocimetry. Exp. Fluids 2012, 52, 1043–1061. [Google Scholar] [CrossRef]
- Rib-roughened, T. Effect of Rib Angle on Local Heat/Mass Transfer Distribution in a Two-Pass Rib-Roughened Channel. J. Turbomach. 2015, 110, 233–241. [Google Scholar] [CrossRef]
- Lau, S.C.; McMillin, R.D.; Han, J.C. Heat Transfer Characteristics of Turbulent Flow in a Square Channel with Angled Discrete Ribs. J. Turbomach. 1991, 113, 367–374. [Google Scholar] [CrossRef]
- Lau, S.C.; McMillin, R.D.; Han, J.C. Turbulent Heat Transfer and Friction in a Square Channel with Discrete Rib Turbulators. J. Turbomach. 1991, 113, 360–366. [Google Scholar] [CrossRef]
- Han, J.C.; Zhang, Y.M.; Lee, C.P. Augmented Heat Transfer in Square Channels with Parallel, Crossed, and V-Shaped Angled Ribs. J. Heat Transf. 1991, 113, 590–596. [Google Scholar] [CrossRef]
- Park, J.S.; Han, J.C.; Huang, Y.; Ou, S.; Boyle, R.J. Heat transfer performance comparisons of five different rectangular channels with parallel angled ribs. Int. J. Heat Mass Transf. 1992, 35, 2891–2903. [Google Scholar] [CrossRef]
- Fu, W.-L.; Wright, L.M.; Han, J.-C. Rotational Buoyancy Effects on Heat Transfer in Five Different Aspect-Ratio Rectangular Channels with Smooth Walls and 45 Degree Ribbed Walls. J. Heat Transf. 2006, 128, 1130–1141. [Google Scholar] [CrossRef]
- Liou, T.-M.; Hwang, J.-J. Turbulent Heat Transfer Augmentation and Friction in Periodic Fully Developed Channel Flows. J. Heat Transf. 1992, 114, 56–64. [Google Scholar] [CrossRef]
- Rui, K.; Li, Y.; Jing, R.; Hongde, J. Effect of Rib Configuration and Lateral Ejection on a High Aspect Ratio Trailing Edge Channel. In Proceedings of the ASME Turbo Expo 2013: Turbine Technical Conference and Exposition, San Antonio, TX, USA, 3–7 June 2013; pp. 1–10. [Google Scholar] [CrossRef]
- Liu, J.; Hussain, S.; Wang, J.; Wang, L.; Xie, G.; Sundén, B. Heat transfer enhancement and turbulent flow in a high aspect ratio channel (4:1) with ribs of various truncation types and arrangements. Int. J. Therm. Sci. 2018, 123, 99–116. [Google Scholar] [CrossRef]
- Xie, G.; Liu, X.; Yan, H.; Qin, J. Turbulent flow characteristics and heat transfer enhancement in a square channel with various crescent ribs on one wall. Int. J. Heat Mass Transf. 2017, 115, 283–295. [Google Scholar] [CrossRef]
- Singh, P.; Li, W.; Ekkad, S.V.; Ren, J. Experimental and numerical investigation of heat transfer inside two-pass rib roughened duct (AR = 1:2) under rotating and stationary conditions. Int. J. Heat Mass Transf. 2017, 113, 384–398. [Google Scholar] [CrossRef]
- Singh, P.; Ji, Y.; Ekkad, S.V. Experimental and numerical investigation of heat and fluid flow in a square duct featuring criss-cross rib patterns. Appl. Therm. Eng. 2018, 128, 415–425. [Google Scholar] [CrossRef]
- Singh, P.; Ravi, B.V.; Ekkad, S.V. Experimental and numerical study of heat transfer due to developing flow in a two-pass rib roughened square duct. Int. J. Heat Mass Transf. 2016, 102, 1245–1256. [Google Scholar] [CrossRef]
- Coletti, F.; Lo Jacono, D.; Cresci, I.; Arts, T. Turbulent flow in rib-roughened channel under the effect of Coriolis and rotational buoyancy forces. Phys. Fluids 2014, 26, 045111. [Google Scholar] [CrossRef] [Green Version]
- Tafti, D.K. Evaluating the role of subgrid stress modeling in a ribbed duct for the internal cooling of turbine blades. Int. J. Heat Fluid Flow 2005, 26, 92–104. [Google Scholar] [CrossRef]
- Schüler, M.; Neumann, S.O.; Weigand, B. Numerical investigations of pressure loss and heat transfer in a 180° bend of a ribbed two-pass internal cooling channel with engine-similar cross-sections. Proc. Inst. Mech. Eng. Part A J. Power Energy 2010, 224, 349–361. [Google Scholar] [CrossRef]
- Verstraete, T.; Coletti, F.; Bulle, J.; Vanderwielen, T.; Arts, T. Optimization of a U-Bend for Minimal Pressure Loss in Internal Cooling Channels—Part I: Numerical Method. J. Turbomach. 2013, 135, 051015. [Google Scholar] [CrossRef]
- Tafti, D.K.; Vanka, S.P. A numerical study of the effects of spanwise rotation on turbulent channel flow. Phys. Fluids A Fluid Dyn. 1991, 3, 642–656. [Google Scholar] [CrossRef]
- Abdel-Wahab, S.; Tafti, D.K. Large eddy simulation of flow and heat transfer in a 90° ribbed duct with rotation: Effect of coriolis forces. In Proceedings of the ASME Turbo Expo 2004: Power for Land, Sea, and Air, Vienna, Austria, 14–17 June 2004. [Google Scholar]
- Elyyan, M.A.; Tafti, D.K. Investigation of coriolis forces effect of flow structure and heat transfer distribution in a rotating dimpled channel. J. Turbomach. 2011, 134, 031007. [Google Scholar] [CrossRef]
- Wagner, J.H.; Johnson, B.V.; Graziani, R.A.; Yeh, F.C. Heat Transfer in Rotating Serpentine Passages with Trips Normal to the Flow. J. Turbomach. 1992, 114, 847–857. [Google Scholar] [CrossRef]
- Parsons, J.A.; Han, J.-C.; Zhang, Y. Effect of model orientation and wall heating condition on local heat transfer in a rotating two-pass square channel with rib turbulators. Int. J. Heat Mass Transf. 1995, 38, 1151–1159. [Google Scholar] [CrossRef]
- Besserman, D.L.; Tanrikut, S. Comparison of Heat Transfer Measurements with Computations for Turbulent Flow around a 180 deg Bend. J. Turbomach. 1992, 114, 865–871. [Google Scholar] [CrossRef]
- Liou, T.-M.; Hwang, J.-J.; Chen, S.-H. Simulation and measurement of enhanced turbulent heat transfer in a channel with periodic ribs on one principal wall. Int. J. Heat Mass Transf. 1993, 36, 507–517. [Google Scholar] [CrossRef]
- Acharya, S.; Dutta, S.; Myrum, T.A.; Baker, R.S. Periodically developed flow and heat transfer in a ribbed duct. Int. J. Heat Mass Transf. 1993, 36, 2069–2082. [Google Scholar] [CrossRef]
- Prakash, C.; Zerkle, R. Prediction of Turbulent Flow and Heat Transfer in a Radially Rotating Square Duct. J. Turbomach. 1992, 114, 835–846. [Google Scholar] [CrossRef] [Green Version]
- Prakash, C.; Zerkle, R. Prediction of Turbulent Flow and Heat Transfer in a Ribbed Rectangular Duct with and without Rotation. In Proceedings of the ASME 1993 International Gas Turbine and Aeroengine Congress and Exposition, Cincinnati, OH, USA, 24–27 May 1993; p. V03AT15A057. [Google Scholar] [CrossRef]
- Zhao, C.Y.; Tao, W.Q. A three dimensional investigation of turbulent flow and heat transfer around sharp 180-deg turns in two-pass rib-roughened channels. Int. Commun. Heat Mass Transf. 1997, 24, 587–596. [Google Scholar] [CrossRef]
- Gu, X.; Wu, H.-W.; Schock, H.J.; Shih, T.I.-P. Two-Equation versus Reynolds-Stress Modeling in Predicting Flow and Heat Transfer in a Smooth U-Duct with and without Rotation. In Proceedings of the ASME Turbo Expo 2002: Power for Land, Sea, and Air, Amsterdam, The Netherlands, 3–6 June 2002; pp. 1115–1124. [Google Scholar] [CrossRef]
- Shevchuk, I.V.; Jenkins, S.C.; Weigand, B.; von Wolfersdorf, J.; Neumann, S.O.; Schnieder, M. Validation and Analysis of Numerical Results for a Varying Aspect Ratio Two-Pass Internal Cooling Channel. J. Heat Transf. 2011, 133, 051701. [Google Scholar] [CrossRef]
- Heidmann, J.D.; Rigby, D.L.; Ameri, A.A. A Three-Dimensional Coupled Internal External Simulation of a Film-Cooled Turbine Vane. J. Turbomach. 1999, 122, 348–359. [Google Scholar] [CrossRef]
- Walker, D.; Zausner, J. RANS Evaluations of Internal Cooling Passage Geometries: Ribbed Passages and a 180 Degree Bend. ASME Conf. Proc. 2007, 2007, 645–660. [Google Scholar] [CrossRef]
- Lin, Y.-L.; Shih, T.I.-P.; Stephens, M.A.; Chyu, M.K. A Numerical Study of Flow and Heat Transfer in a Smooth and Ribbed U-Duct with and without Rotation. J. Heat Transf. 2001, 123, 219–232. [Google Scholar] [CrossRef]
- Ooi, A.; Iaccarino, G.; Durbin, P.A.; Behnia, M. Reynolds averaged simulation of flow and heat transfer in ribbed ducts. Int. J. Heat Fluid Flow 2002, 23, 750–757. [Google Scholar] [CrossRef] [Green Version]
- Jia, R.; Sundén, B.; Faghri, M. Computational Analysis of Heat Transfer Enhancement in Square Ducts with V-Shaped Ribs: Turbine Blade Cooling. J. Heat Transf. 2005, 127, 425–433. [Google Scholar] [CrossRef]
- Saidi, A.; Sundén, B. On Prediction of Thermal-Hydraulic Characteristics of Square-Sectioned Ribbed Cooling Ducts. J. Turbomach. 2001, 123, 614–620. [Google Scholar] [CrossRef]
- Bonhoff, B.; Tomm, U.; Johnson, B.V.; Jennions, I. Heat Transfer Predictions for Rotating U-Shaped Coolant Channels with Skewed Ribs and with Smooth Walls. In Proceedings of the ASME 1997 International Gas Turbine and Aeroengine Congress and Exhibition, Orlando, FL, USA, 2–5 June 1997; p. V003T09A027. [Google Scholar] [CrossRef]
- Iacovides, H. Computation of flow and heat transfer through rotating ribbed passages. Int. J. Heat Fluid Flow 1998, 19, 393–400. [Google Scholar] [CrossRef]
- Iacovides, H.; Raisee, M. Computation of flow and heat transfer in two-dimensional rib-roughened passages, using low-Reynolds-number turbulence models. Int. J. Numer. Methods Heat Fluid Flow 2001, 11, 138–155. [Google Scholar] [CrossRef]
- Okita, Y.; Iacovides, H. Comparisons of High-Reynolds-Number EVM and DSM Models in the Prediction of Heat and Fluid Flow of Turbine Blade Cooling Passages. J. Turbomach. 2003, 125, 585–597. [Google Scholar] [CrossRef]
- Chen, H.-C.; Jang, Y.-J.; Han, J.-C. Near-Wall Second-Moment Closure for Rotating Multiple-Pass Cooling Channels. J. Thermophys. Heat Transf. 2000, 14, 201–209. [Google Scholar] [CrossRef]
- Al-Qahtani, M.; Chen, H.-C.; Han, J.-C. A Numerical Study of Flow and Heat Transfer in Rotating Rectangular Channels (AR = 4) with 45 deg Rib Turbulators by Reynolds Stress Turbulence Model. J. Heat Transf. 2003, 125, 19–26. [Google Scholar] [CrossRef]
- Al-Qahtani, M.; Jang, Y.-J.; Chen, H.-C.; Han, J.-C. Prediction of Flow and Heat Transfer in Rotating Two-Pass Rectangular Channels with 45-deg Rib Turbulators. J. Turbomach. 2002, 124, 242–250. [Google Scholar] [CrossRef]
- Sleiti, A.K.; Kapat, J.S. Effect of Coriolis and Centrifugal Forces on Turbulence and Heat Transfer at High Rotation and Buoyancy Numbers in a Rib-Roughened Internal Cooling Channel. ASME Conf. Proc. 2004, 2004, 11–21. [Google Scholar] [CrossRef]
- Launder, B.E.; Priddin, C.H.; Sharma, B.I. The Calculation of Turbulent Boundary Layers on Spinning and Curved Surfaces. J. Fluids Eng. 1977, 99, 231–239. [Google Scholar] [CrossRef]
- Howard, J.H.G.; Patankar, S.V.; Bordynuik, R.M. Flow Prediction in Rotating Ducts Using Coriolis-Modified Turbulence Models. J. Fluids Eng. 1980, 102, 456–461. [Google Scholar] [CrossRef]
- Launder, B.E.; Tselepidakis, D.P.; Younis, B.A. A second-moment closure study of rotating channel flow. J. Fluid Mech. 1987, 183, 63–75. [Google Scholar] [CrossRef]
- Warfield, M.J.; Lakshminarayana, B. Computation of Rotating Turbulent Flow with an Algebraic Reynolds Stress Model. AIAA J. 1987, 25, 957–964. [Google Scholar] [CrossRef]
- Smagorinsky, J. General Circulation Experiments with the Primitive Equations. Mon. Weather Rev. 1963, 91, 99–164. [Google Scholar] [CrossRef]
- Germano, M.; Piomelli, U.; Moin, P.; Cabot, W.H. A dynamic subgrid-scale eddy viscosity model. Phys. Fluids A Fluid Dyn. 1991, 3, 1760–1765. [Google Scholar] [CrossRef]
- Murata, A.; Mochizuki, S. Large eddy simulation with a dynamic subgrid-scale model of turbulent heat transfer in an orthogonally rotating rectangular duct with transverse rib turbulators. Int. J. Heat Mass Transf. 2000, 43, 1243–1259. [Google Scholar] [CrossRef]
- Murata, A.; Mochizuki, S. Effect of centrifugal buoyancy on turbulent heat transfer in an orthogonally rotating square duct with transverse or angled rib turbulators. Int. J. Heat Mass Transf. 2001, 44, 2739–2750. [Google Scholar] [CrossRef]
- Murata, A.; Mochizuki, S. Effect of rib orientation and channel rotation on turbulent heat transfer in a two-pass square channel with sharp 180° turns investigated by using large eddy simulation. Int. J. Heat Mass Transf. 2004, 47, 2599–2618. [Google Scholar] [CrossRef]
- Watanabe, K.; Takahashi, T. LES Simulation and Experimental Measurement of Fully Developed Ribbed Channel Flow and Heat Transfer. In Proceedings of the ASME Turbo Expo 2002: Power for Land, Sea, and Air, Amsterdam, The Netherlands, 3–6 June 2002; pp. 411–417. [Google Scholar] [CrossRef]
- Takahashi, T.; Watanabe, K. Large Eddy Simulation of Flow and Heat Transfer in a Rectangular Channel with Crossed Angled Ribs. In Proceedings of the ASME Turbo Expo 2004: Power for Land, Sea, and Air, Vienna, Austria, 14–17 June 2004; pp. 623–632. [Google Scholar] [CrossRef]
- Tyagi, M.; Acharya, S. Large Eddy Simulations of Flow and Heat Transfer in Rotating Ribbed Duct Flows. In Proceedings of the ASME Turbo Expo 2004: Power for Land, Sea, and Air, Vienna, Austria, 14–17 June 2004; pp. 797–811. [Google Scholar] [CrossRef]
- Vreman, B.; Geurts, B.; Kuerten, H. On the formulation of the dynamic mixed subgrid-scale model. Phys. Fluids 1994, 6, 4057–4059. [Google Scholar] [CrossRef] [Green Version]
- Ahn, J.; Choi, H.; Lee, J.S. Large Eddy Simulation of Flow and Heat Transfer in a Channel Roughened by Square or Semicircle Ribs. In Proceedings of the ASME Turbo Expo 2004: Power for Land, Sea, and Air, Vienna, Austria, 14–17 June 2004; pp. 411–418. [Google Scholar] [CrossRef]
- Abdel-Wahab, S.; Tafti, D.K. Large Eddy Simulation of Flow and Heat Transfer in a Staggered 45[degree] Ribbed Duct. ASME Conf. Proc. 2004, 2004, 723–734. [Google Scholar] [CrossRef]
- Viswanathan, A.K.; Tafti, D.K. Large eddy simulation of fully developed flow and heat transfer in a rotating duct with 45° ribs. In Proceedings of the ASME Turbo Expo 2006: Power for Land, Sea, and Air, Barcelona, Spain, 8–11 May 2006. [Google Scholar] [CrossRef]
- Viswanathan, A.K.; Tafti, D.K.; Abdel-Wahab, S. Large Eddy simulation of flow and heat transfer in an internal cooling duct with high blockage ratio 45° staggered ribs. In Proceedings of the ASME Turbo Expo 2005: Power for Land, Sea, and Air, Reno, NV, USA, 6–9 June 2005. [Google Scholar] [CrossRef]
- Sewall, E.A.; Tafti, D.K.; Graham, A.B.; Thole, K.A. Experimental validation of large eddy simulations of flow and heat transfer in a stationary ribbed duct. Int. J. Heat Fluid Flow 2006, 27, 243–258. [Google Scholar] [CrossRef]
- Sewall, E.A.; Tafti, D.K. Large eddy simulation of flow and heat transfer in the developing flow region of a rotating gas turbine blade internal cooling duct with coriolis and buoyancy forces. In Proceedings of the ASME Turbo Expo 2005: Power for Land, Sea, and Air, Reno, NV, USA, 6–9 June 2005. [Google Scholar] [CrossRef]
- Tyacke, J.; Tucker, P.G. Large eddy simulation of turbine internal cooling ducts. Comput. Fluids 2015, 114, 130–140. [Google Scholar] [CrossRef]
- Labbé, O. Large-eddy-simulation of flow and heat transfer in a ribbed duct. Comput. Fluids 2013, 76, 23–32. [Google Scholar] [CrossRef]
- Viswanathan, A.K.; Tafti, D.K. A Comparative Study of DES and URANS for Flow Prediction in a Two-Pass Internal Cooling Duct. J. Fluids Eng. 2006, 128, 1336–1345. [Google Scholar] [CrossRef]
- Viswanathan, A.K.; Tafti, D.K. Detached eddy simulation of flow and heat transfer in fully developed rotating internal cooling channel with normal ribs. Int. J. Heat Fluid Flow 2006, 27, 351–370. [Google Scholar] [CrossRef]
- Viswanathan, A.K.; Tafti, D.K. Investigation of detached eddy simulations in capturing the effects of coriolis forces and centrifugal buoyancy in ribbed ducts. J. Heat Transf. 2007, 129, 778–789. [Google Scholar] [CrossRef]
- Patil, S.; Tafti, D. Large-Eddy Simulation with Zonal Near Wall Treatment of Flow and Heat Transfer in a Ribbed Duct for the Internal Cooling of Turbine Blades. J. Turbomach. 2013, 135, 031006. [Google Scholar] [CrossRef]
- Iacovides, H.; Jackson, D.C.; Kelemenis, G.; Launder, B. The measurement of local wall heat transfer in stationary U-ducts of strong curvature, with smooth and rib roughened walls. In Proceedings of the ASME 1999 International Gas Turbine and Aeroengine Congress and Exhibition, Indianapolis, IN, USA, 7–10 June 1999. [Google Scholar]
- Iacovides, H.; Jackson, D.C.; Ji, H.; Kelemenis, G.; Launder, B.E.; Nikas, K. LDA Study of the Flow Development Through an Orthogonally Rotating U-Bend of Strong Curvature and Rib Roughened Walls. In Proceedings of the ASME 1996 International Gas Turbine and Aeroengine Congress and Exhibition, Birmingham, UK, 10–13 June 1996; p. V004T09A052. [Google Scholar] [CrossRef]
- Cheah, S.C.; Iacovides, H.; Jackson, D.C.; Ji, H.; Launder, B.E. LDA investigation of the flow development through rotating U-ducts. J. Turbomach. 1996, 118, 590–596. [Google Scholar] [CrossRef]
- Singh, P.; Li, W.; Ekkad, S.V.; Ren, J. A new cooling design for rib roughened two-pass channel having positive effects of rotation on heat transfer enhancement on both pressure and suction side internal walls of a gas turbine blade. Int. J. Heat Mass Transf. 2017, 115, 6–20. [Google Scholar] [CrossRef]
- Tafti, D.K. Time-Accurate Techniques for Turbulent Heat Transfer Analysis in Complex Geometries; Advances in Computational Fluid Dynamics and Heat Transfer; Amano, R., Sunden, B., Eds.; WIT PRESS: Southampton, UK, 2011. [Google Scholar]
- Najjar, F.M.; Tafti, D.K. Study of discrete test filters and finite difference approximations for the dynamic subgrid-scale stress model. Phys. Fluids 1996, 8, 1076–1088. [Google Scholar] [CrossRef]
- Patil, S.; Tafti, D. Wall modeled large eddy simulations of complex high Reynolds number flows with synthetic inlet turbulence. Int. J. Heat Fluid Flow 2012, 33, 9–21. [Google Scholar] [CrossRef]
- Wang, G.; Tafti, D.K. Performance enhancement on microprocessors with hierarchical memory systems for solving large sparse linear systems. Int. J. High Perform. Comput. Appl. 1999, 13, 63–79. [Google Scholar] [CrossRef]
- Tafti, D.K. GenIDLEST—A scalable parallel computational tool for simulating complex turbulent flows. ASME-PUBLICATIONS-FED 2001, 256, 347–356. [Google Scholar]
- Ekkad, S.V.; Huang, Y.; Han, J.C. Detailed heat transfer distributions in two-pass square channels with rib turbulators and bleed holes. Int. J. Heat Mass Transf. 1998, 41, 3781–3791. [Google Scholar] [CrossRef]
- Chandra, P.R.; Han, J.C.; Lau, S.C. Effect of Rib Angle on Local Heat/Mass Transfer Distribution in Two -pass Rib Roughened Channel. J. Turbomach. 1988, 110, 233–241. [Google Scholar] [CrossRef]
- Chong, M.S.; Perry, A.E.; Cantwell, B.J. A general classification of three-dimensional flow fields. Phys. Fluids A 1990, 2, 765–777. [Google Scholar] [CrossRef]
- Son, S.; Kihm, K.; Han, J.-C. PIV flow measurements for heat transfer characterization in two-pass square channels with smooth and 90° ribbed walls. Int. J. Heat Mass Transf. 2002, 45, 4809–4822. [Google Scholar] [CrossRef]
- Sewall, E.A.; Tafti, D.K. Large Eddy Simulation of Flow and Heat Transfer in the Developing Flow Region of a Rotating Gas Turbine Blade Internal Cooling Duct with Coriolis and Buoyancy Forces. In Proceedings of the ASME Turbo Expo 2005: Power for Land, Sea, and Air, Reno, NV, USA, 6–9 June 2005; pp. 495–506. [Google Scholar] [CrossRef]
- Amritkar, A.; Tafti, D. Computational Fluid Dynamics Computations Using a Preconditioned Krylov Solver on Graphical Processing Units. J. Fluids Eng. 2015, 138, 011402. [Google Scholar] [CrossRef]
Figure 1.
(a) Schematic of effect of Coriolis forces on mean flow. (b) Schematic showing the augmenting and attenuating effect of Coriolis force on production of turbulent shear stress on the trailing and leading sides of the duct.
Figure 1.
(a) Schematic of effect of Coriolis forces on mean flow. (b) Schematic showing the augmenting and attenuating effect of Coriolis force on production of turbulent shear stress on the trailing and leading sides of the duct.

Figure 2.
(a) Rotational axis and direction of rotation (b) Schematic of cooling arrangement used (c) Computational geometry showing the first pass, the bend region, and the second pass. Dashed lines with boxed letters identify streamwise locations. All dimensions are normalized by Dh. In the first pass the outer wall leads, whereas in the second pass it trails, and vice versa for the inner wall.

Figure 3.
Grid distribution in a typical rib pitch for the 28 million grid.

Figure 4.
Comparisons of predicted mean streamwise velocity profile before the bend (C), in the bend (H), and after the bend (E) for a stationary duct at Re = 100,000 with experiments of Iacovides et al. [98]. Rib is shown as black square.
Figure 4.
Comparisons of predicted mean streamwise velocity profile before the bend (C), in the bend (H), and after the bend (E) for a stationary duct at Re = 100,000 with experiments of Iacovides et al. [98]. Rib is shown as black square.

Figure 5.
Urms predictions compared to measurements after the bend region in a stationary duct at Re = 100,000 with experiments of Iacovides et al. [98]. Rib is shown as black square.
Figure 5.
Urms predictions compared to measurements after the bend region in a stationary duct at Re = 100,000 with experiments of Iacovides et al. [98]. Rib is shown as black square.

Figure 6.
Face-averaged Nusselt number distribution on the (a) inner and (b) outer wall in the first pass for a stationary duct at Re = 100,000. Experimental results are from Iacovides et al. [97]. Flow direction is from right to left.
Figure 6.
Face-averaged Nusselt number distribution on the (a) inner and (b) outer wall in the first pass for a stationary duct at Re = 100,000. Experimental results are from Iacovides et al. [97]. Flow direction is from right to left.

Figure 7.
Instantaneous contours of coherent vorticity (λ) at center plane z = 0.5.

Figure 8.
Instantaneous temperature contours at center plane z = 0.

Figure 9.
Mean Flow streamlines constrained to travel in a plane at duct center line z = 0.5 for the full duct. Magnified view of streamline patterns at selected rib pitches in the first pass.
Figure 9.
Mean Flow streamlines constrained to travel in a plane at duct center line z = 0.5 for the full duct. Magnified view of streamline patterns at selected rib pitches in the first pass.

Figure 10.
Mean secondary flow in duct cross-section in first pass at (a) X = 3.05, rib at inner wall (b) X = 3.55, rib at outer wall. Planar streamlines and contours of y-directional velocity (v) are shown (v-velocity directed from outer to inner wall in figures carries a positive sign).
Figure 10.
Mean secondary flow in duct cross-section in first pass at (a) X = 3.05, rib at inner wall (b) X = 3.55, rib at outer wall. Planar streamlines and contours of y-directional velocity (v) are shown (v-velocity directed from outer to inner wall in figures carries a positive sign).

Figure 11.
Secondary flow in 180° bend. (a) Streamlines and x-velocity contours in plane y = 0 (location H). (b) induced z-directional velocity in the close vicinity of the outer wall—flow is from left-to-right and the view is from inside the duct.
Figure 11.
Secondary flow in 180° bend. (a) Streamlines and x-velocity contours in plane y = 0 (location H). (b) induced z-directional velocity in the close vicinity of the outer wall—flow is from left-to-right and the view is from inside the duct.

Figure 12.
Streamwise velocity profiles in first pass (Locations A–B, C, and F), in bend (location H) and in second pass (locations D, E, J, K, L, and M–N). symbols: experiments [98], •-stationary, Δ-Ro = 0.2. Lines: predictions. Colors: black—stationary, red—Ro = 0.2, blue—Bo = 0.5. Rib is shown as black square.

Figure 13.
Variation of mean pressure in flow direction at duct center plane z = 0.5.

Figure 14.
Distribution of turbulent kinetic energy (TKE) at center plane z = 0.5.

Figure 15.
Streamwise velocity rms (Urms) profiles in first pass (Locations A–B, C, and F), and in second pass (locations D, J, K, L, and M–N). symbols: experiments [98], •-stationary, Δ-Ro = 0.2. Lines: predictions. Colors: black—stationary, red—Ro = 0.2, blue—Bo = 0.5. Rib is shown as black square.

Figure 16.
Turbulent shear stress profiles (−uv) in first pass (Location A–B), and in second pass (locations D, E, J, K, and M–N). symbols: experiments [98], •-stationary, Δ-Ro = 0.2. Lines: predictions. Colors: black—stationary, red—Ro = 0.2, blue—Bo = 0.5. Rib is shown as black square.
Figure 16.
Turbulent shear stress profiles (−uv) in first pass (Location A–B), and in second pass (locations D, E, J, K, and M–N). symbols: experiments [98], •-stationary, Δ-Ro = 0.2. Lines: predictions. Colors: black—stationary, red—Ro = 0.2, blue—Bo = 0.5. Rib is shown as black square.

Figure 17.
Distribution of enhancement factor () at inner and outer walls of first pass.

Figure 18.
Distribution of enhancement factor () at inner and outer 180° bend walls.

Figure 19.
Distribution of enhancement factor () at inner and outer walls of second pass.

Figure 20.
Pitch averaged Nusselt numbers between successive ribs at (a) inner and (b) outer walls of the duct. Data is plotted at the mid-pitch between two ribs. The data immediately on either side of the bend is for regions leading into the bend and exiting the bend.
Figure 20.
Pitch averaged Nusselt numbers between successive ribs at (a) inner and (b) outer walls of the duct. Data is plotted at the mid-pitch between two ribs. The data immediately on either side of the bend is for regions leading into the bend and exiting the bend.

Figure 21.
Distribution of enhancement factor () at smooth walls.

Figure 22.
Side-averaged enhancement factor () at smooth lateral wall.


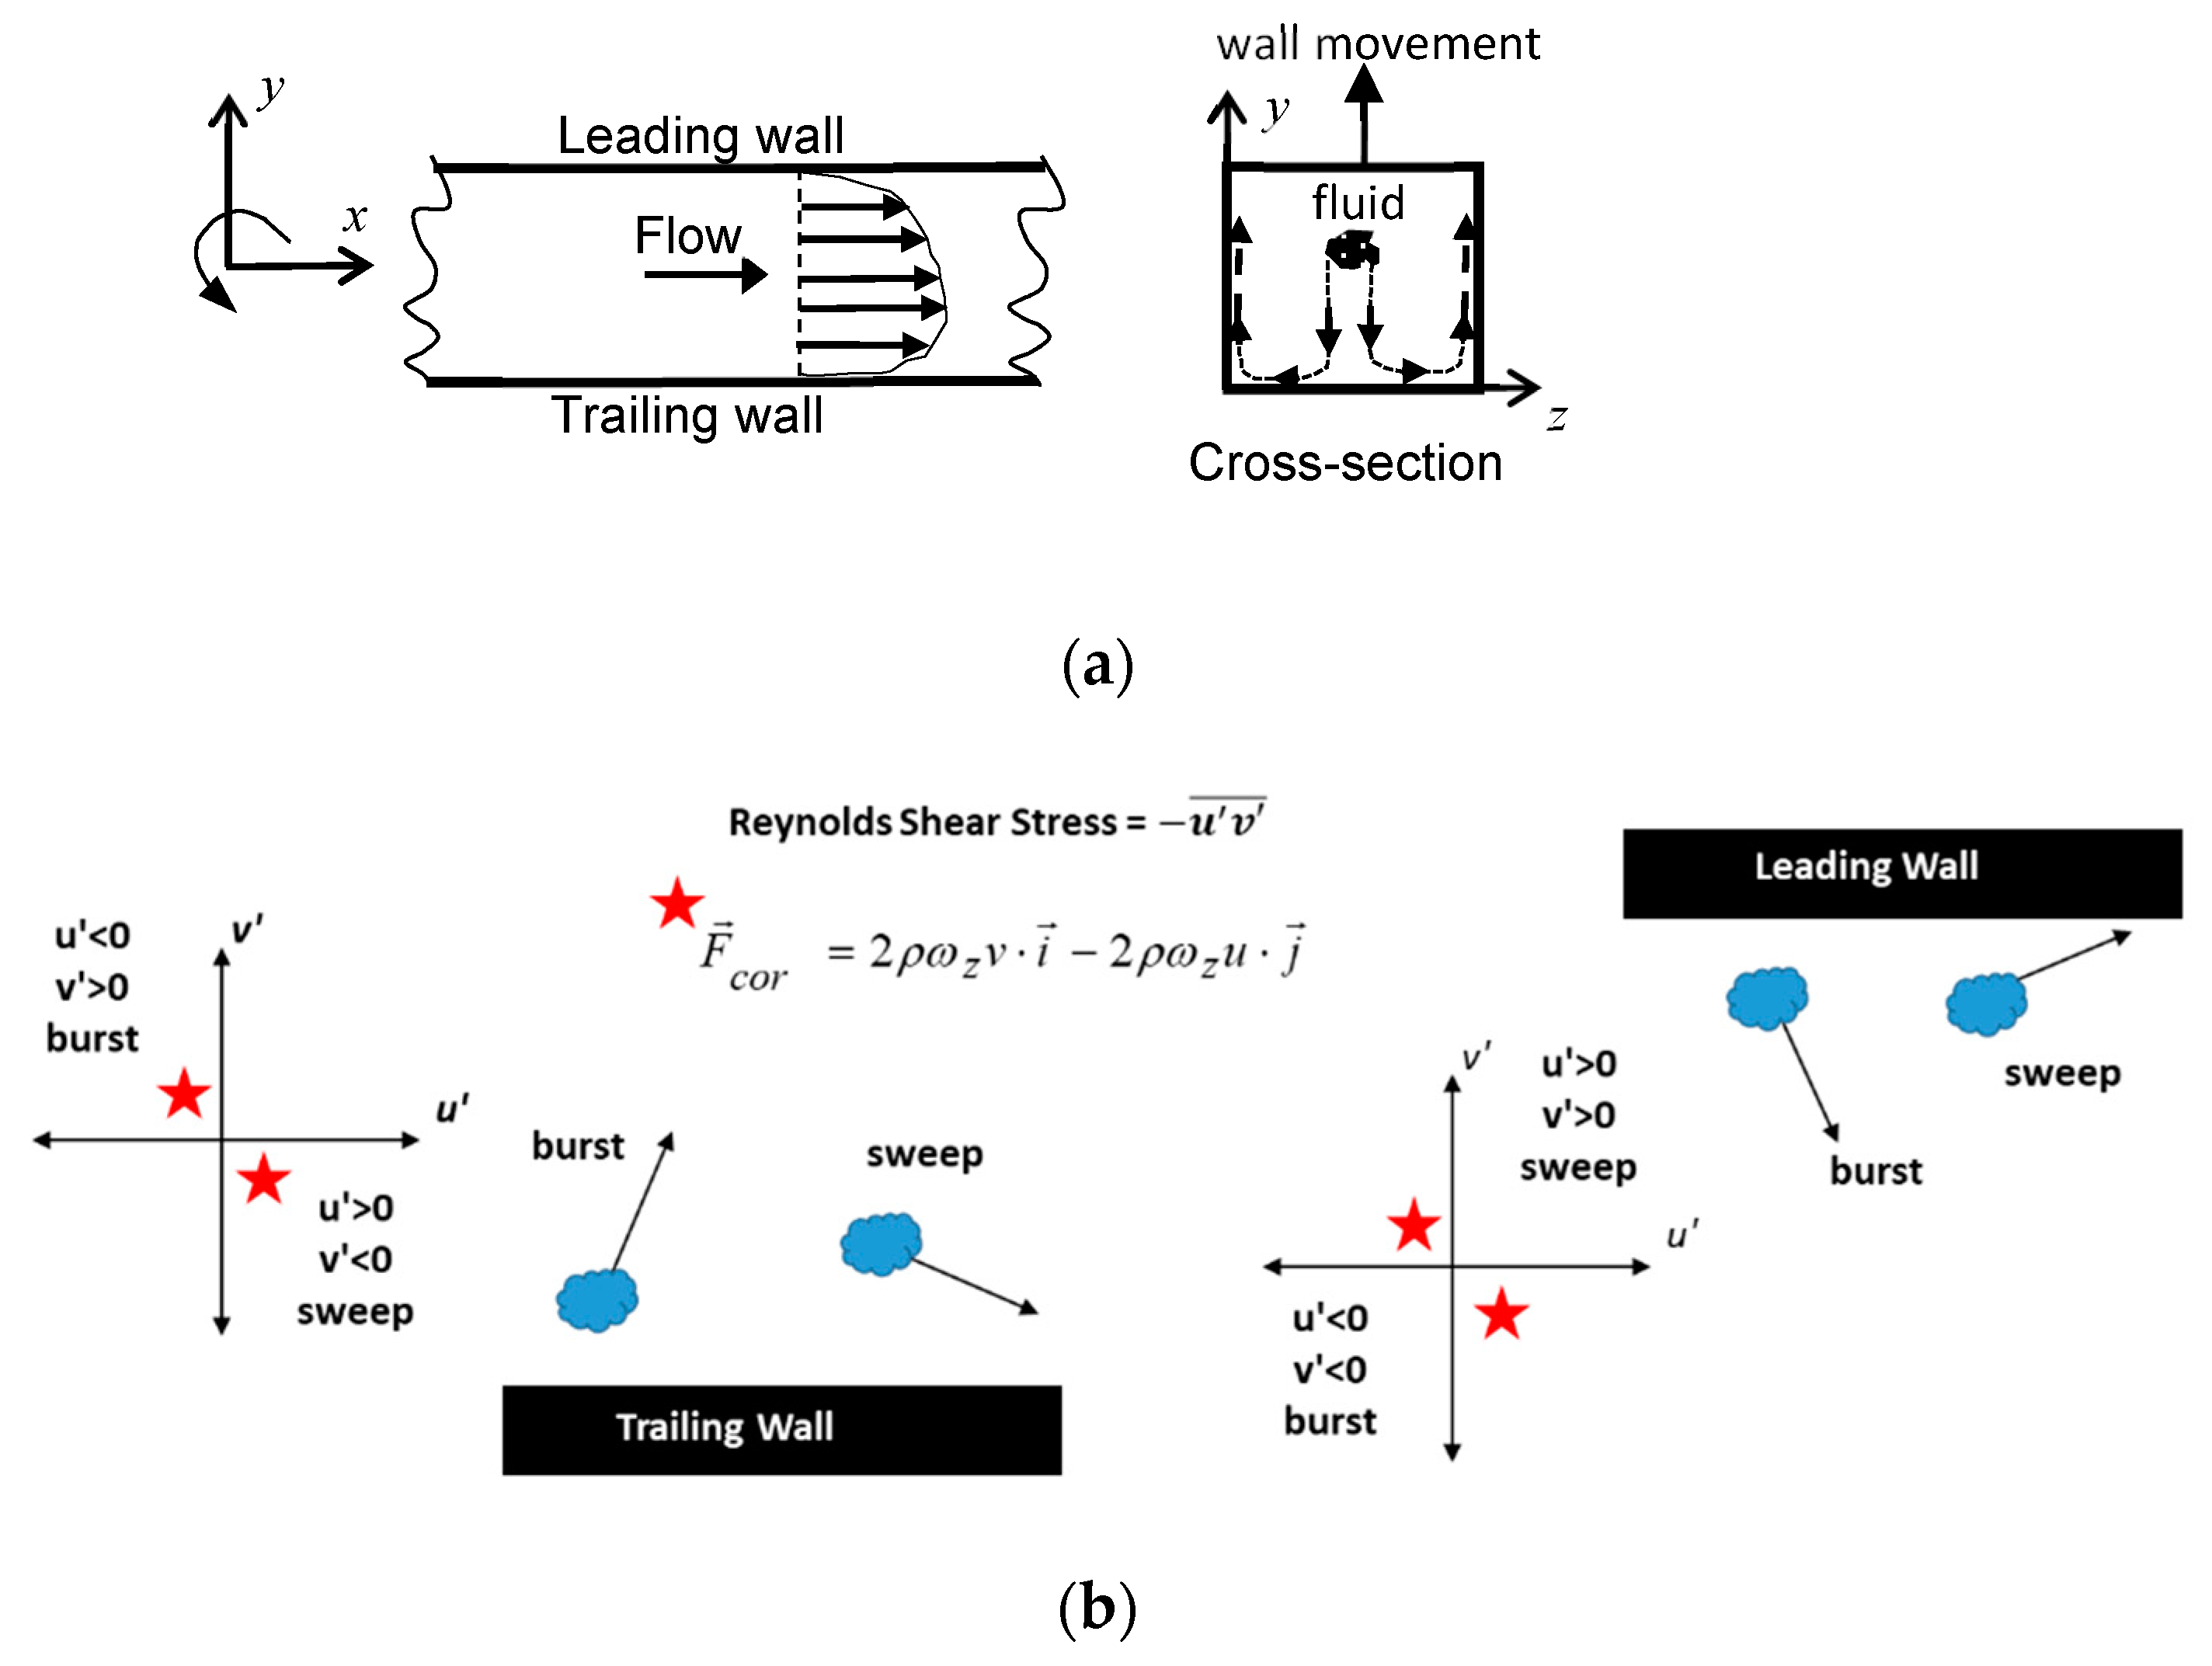
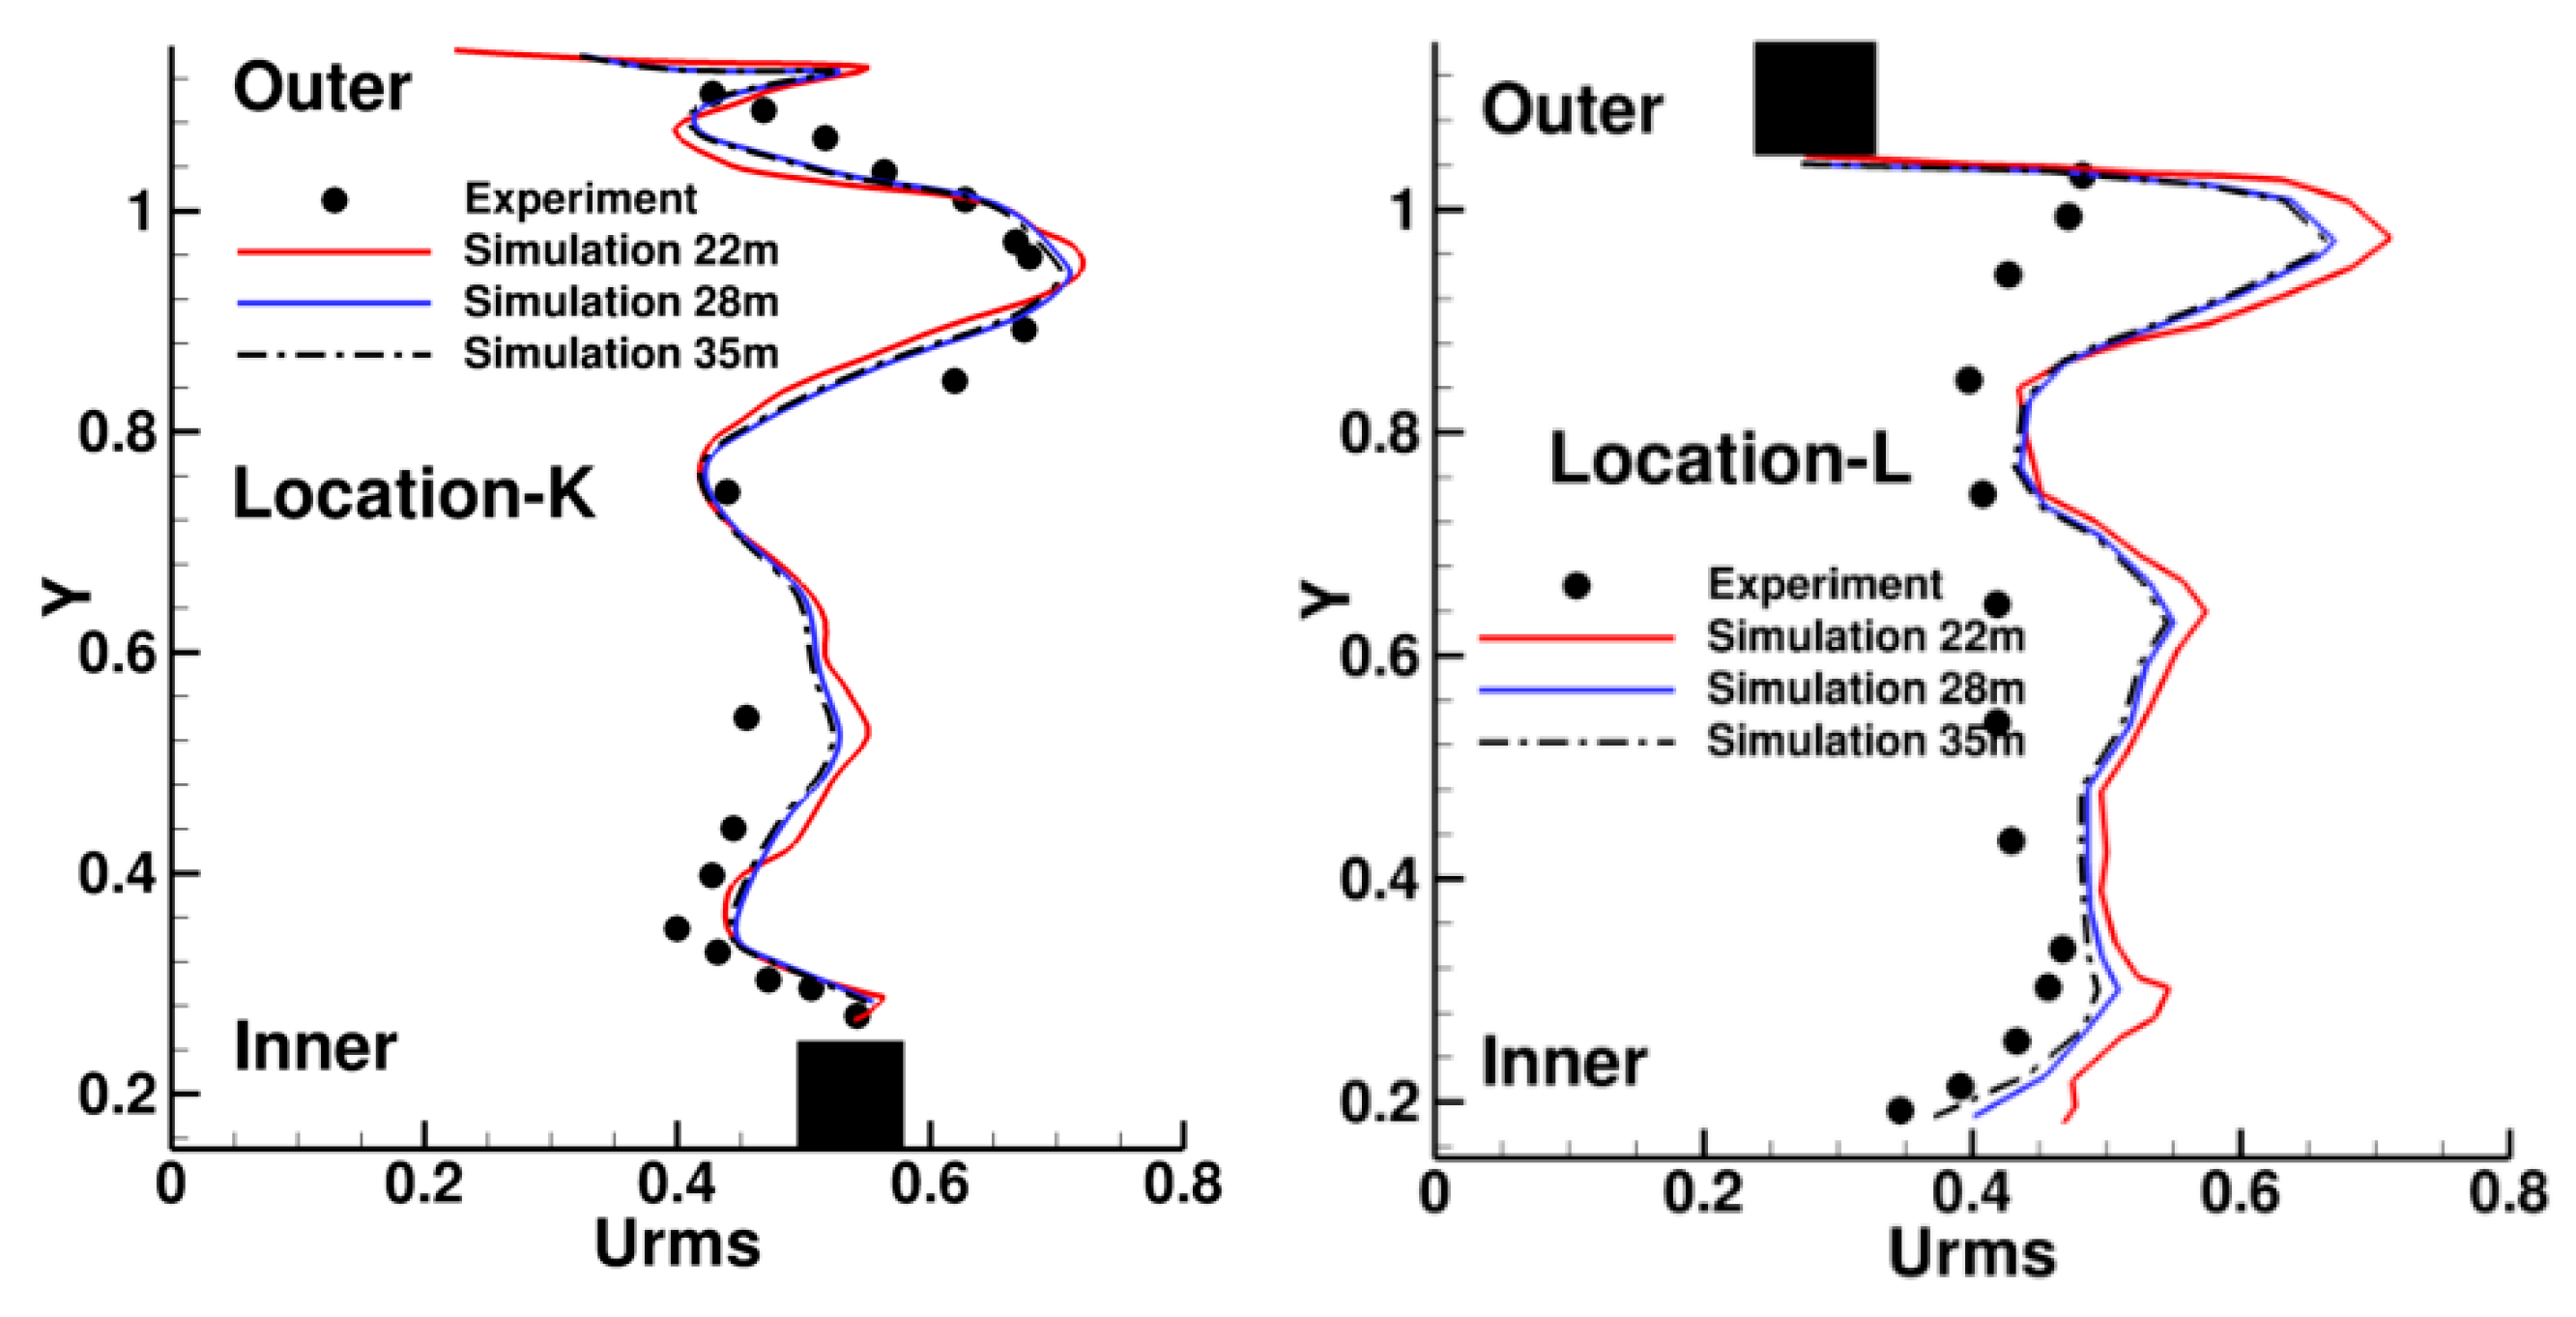
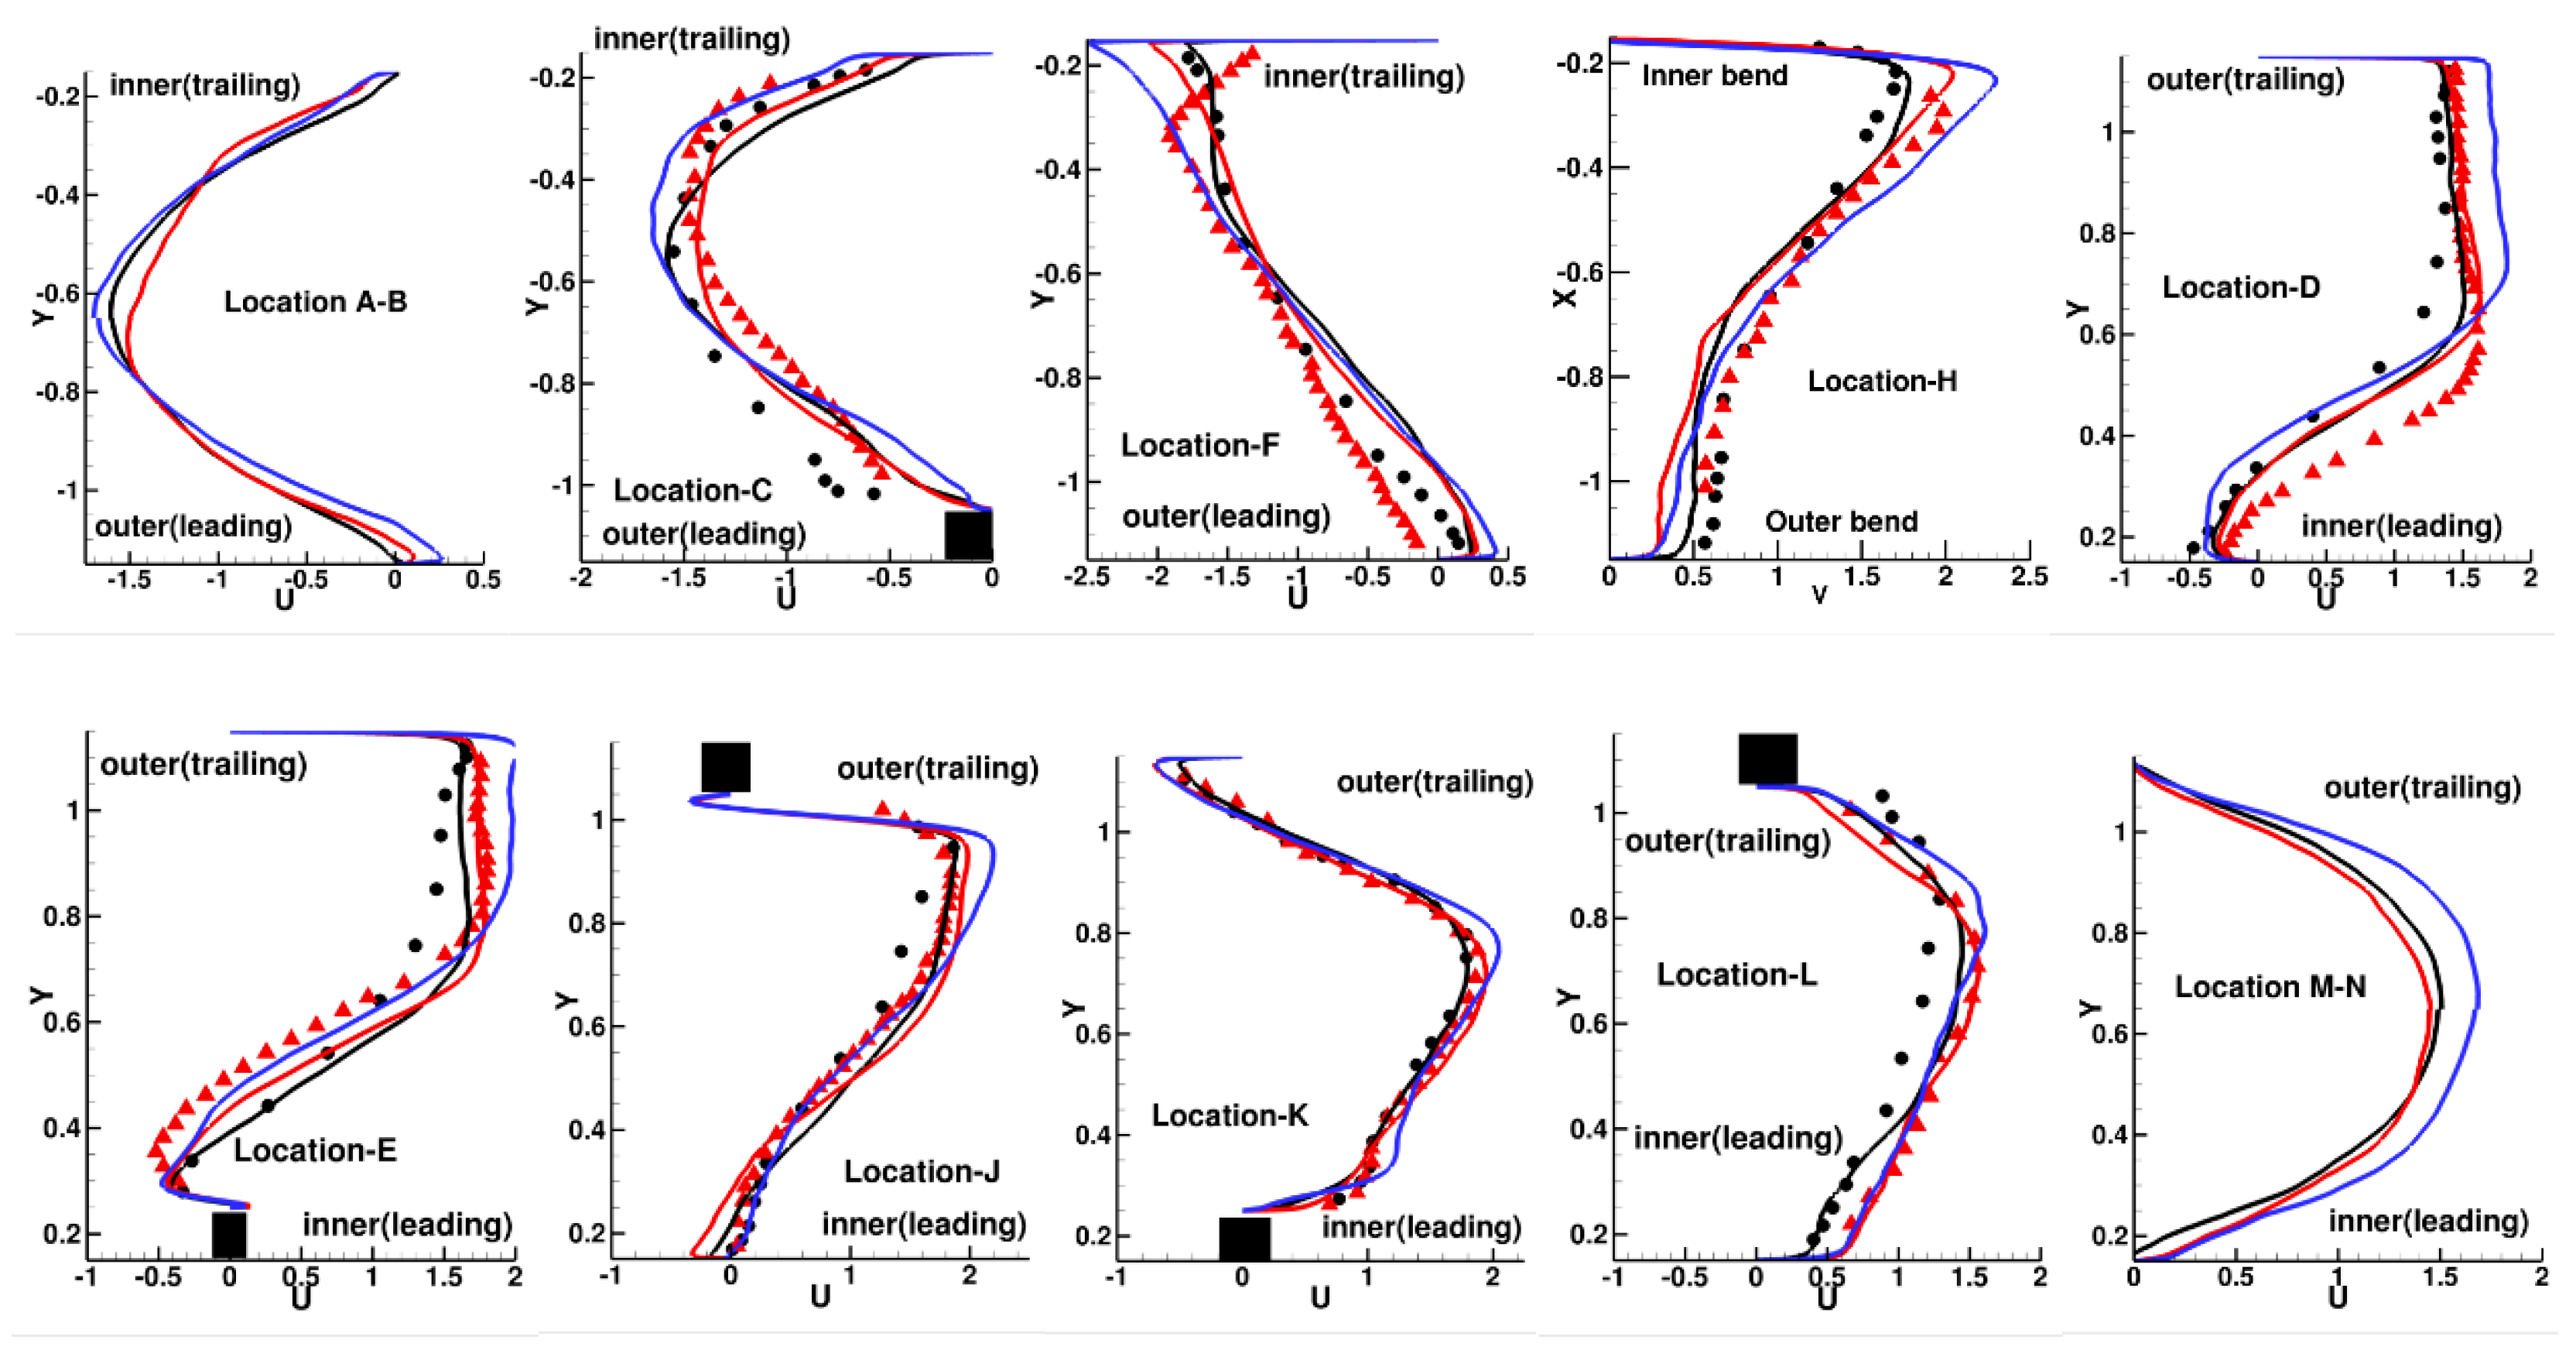
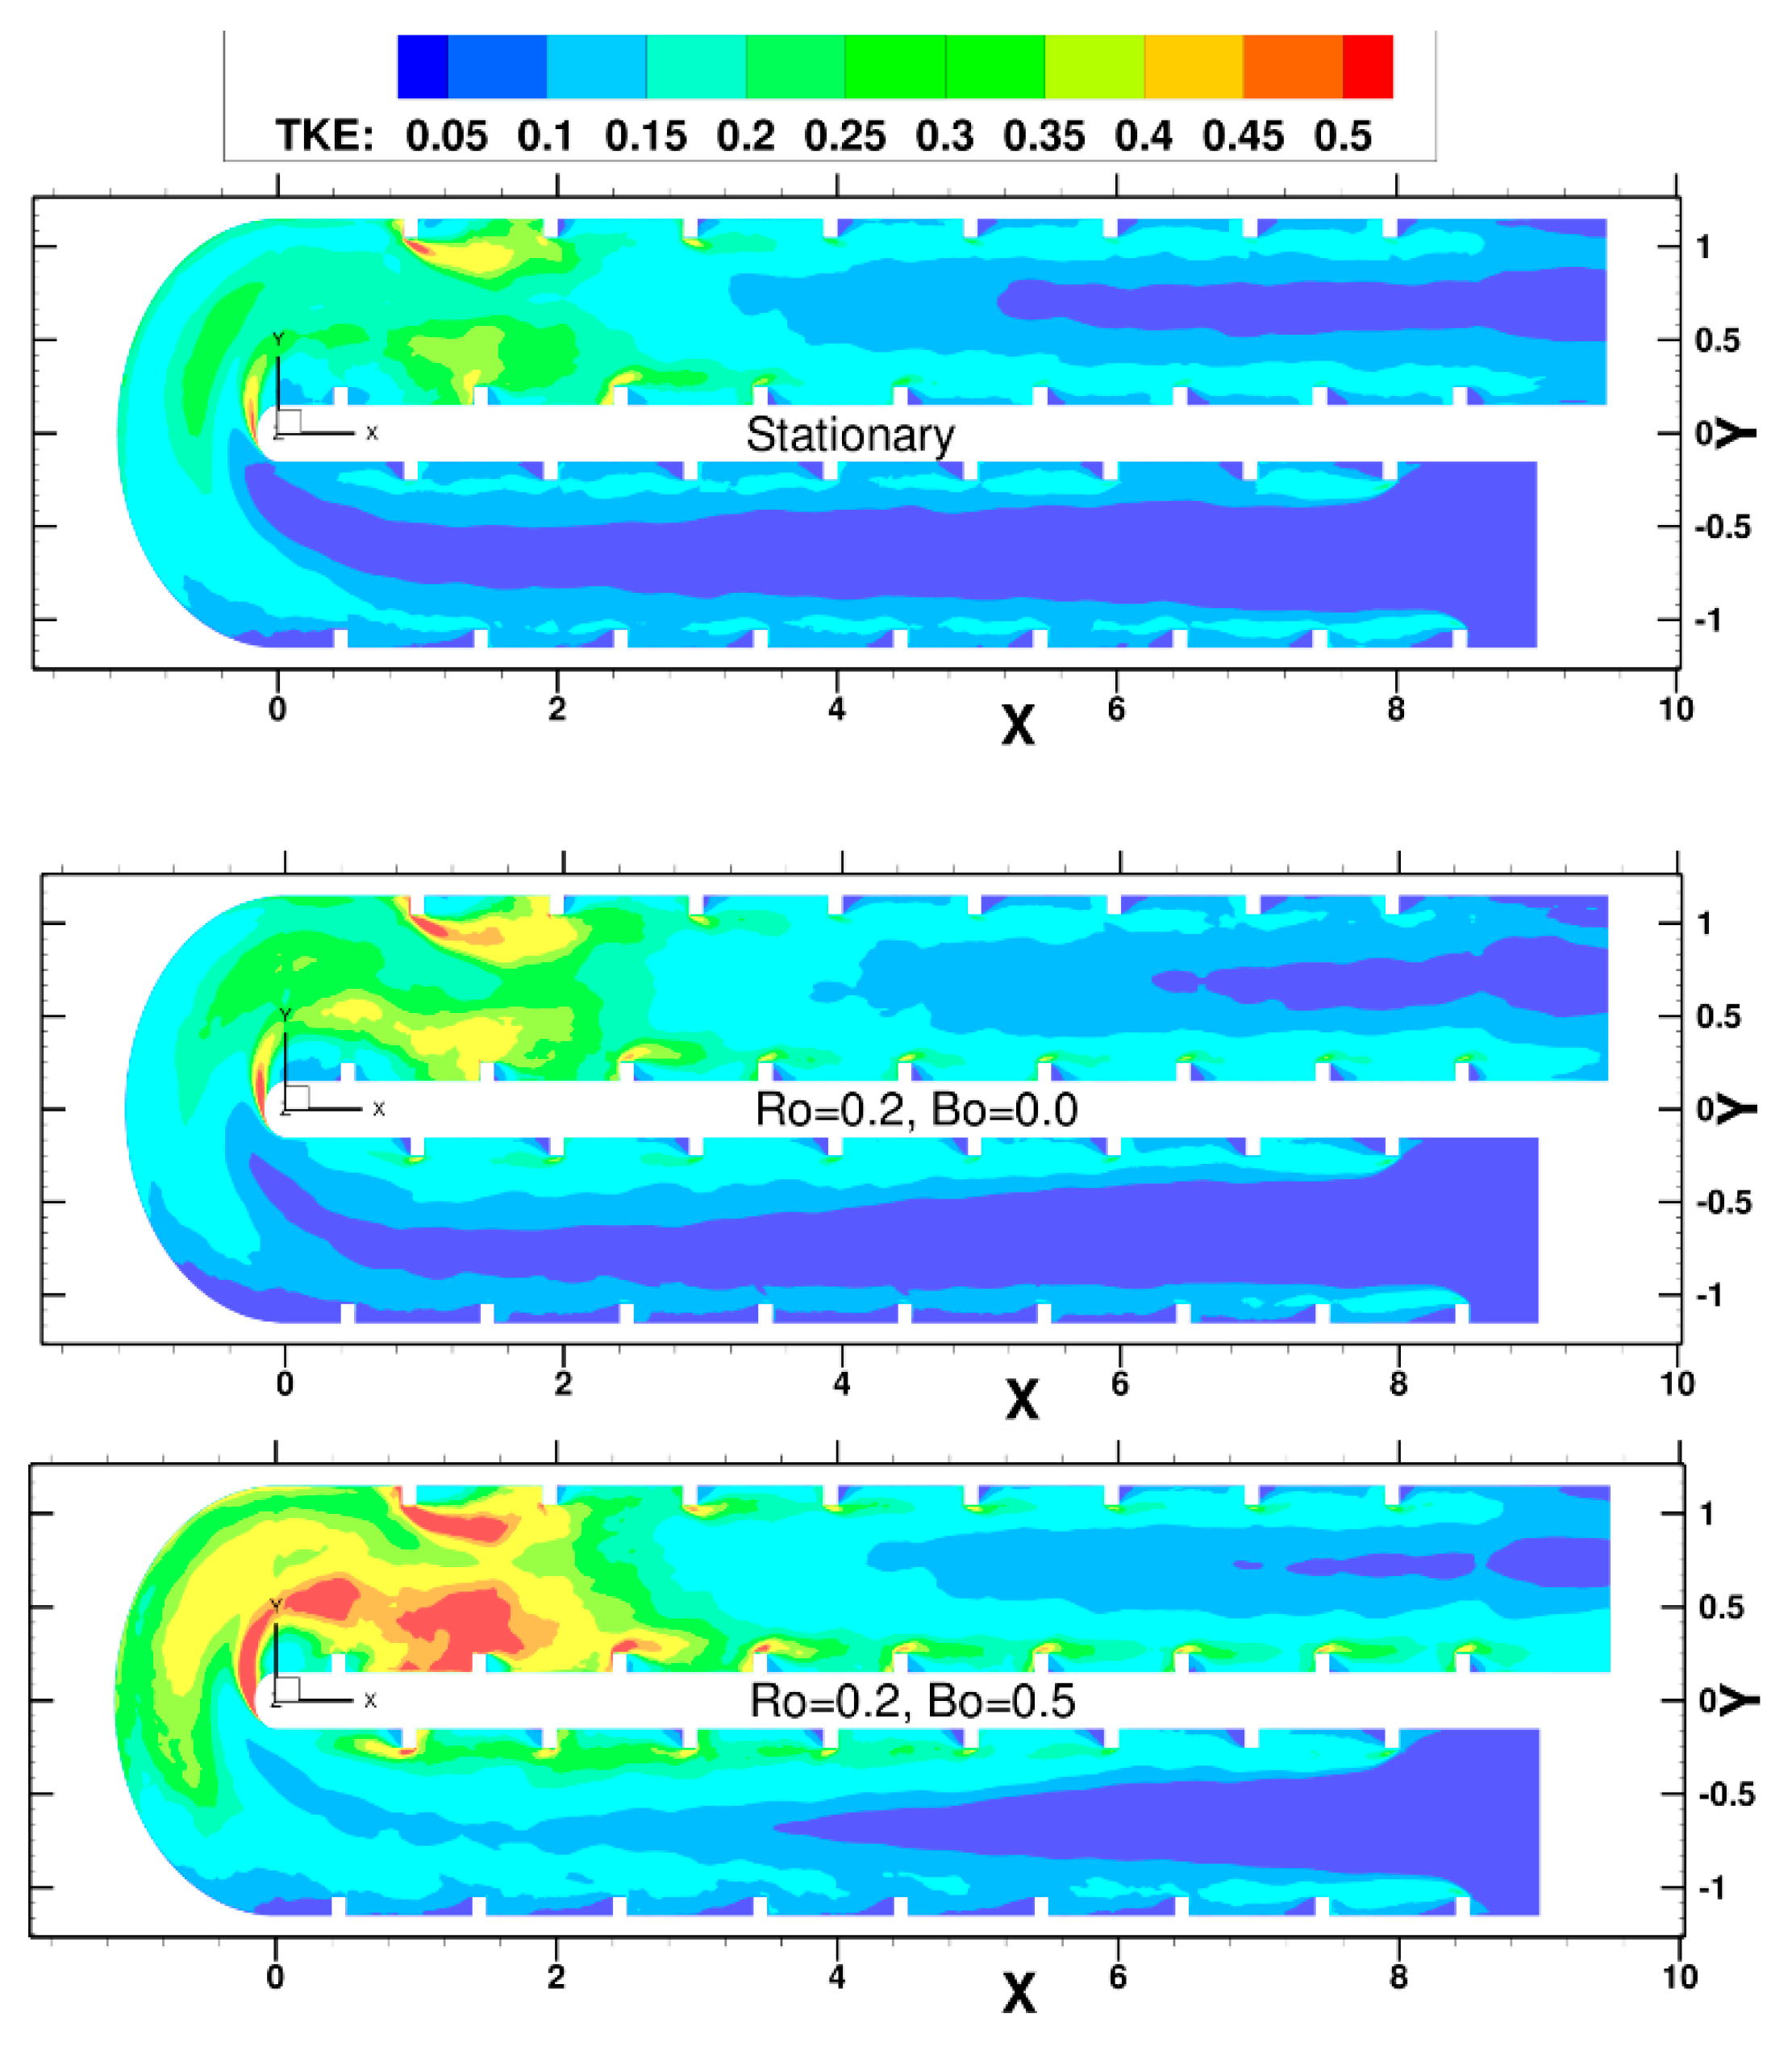
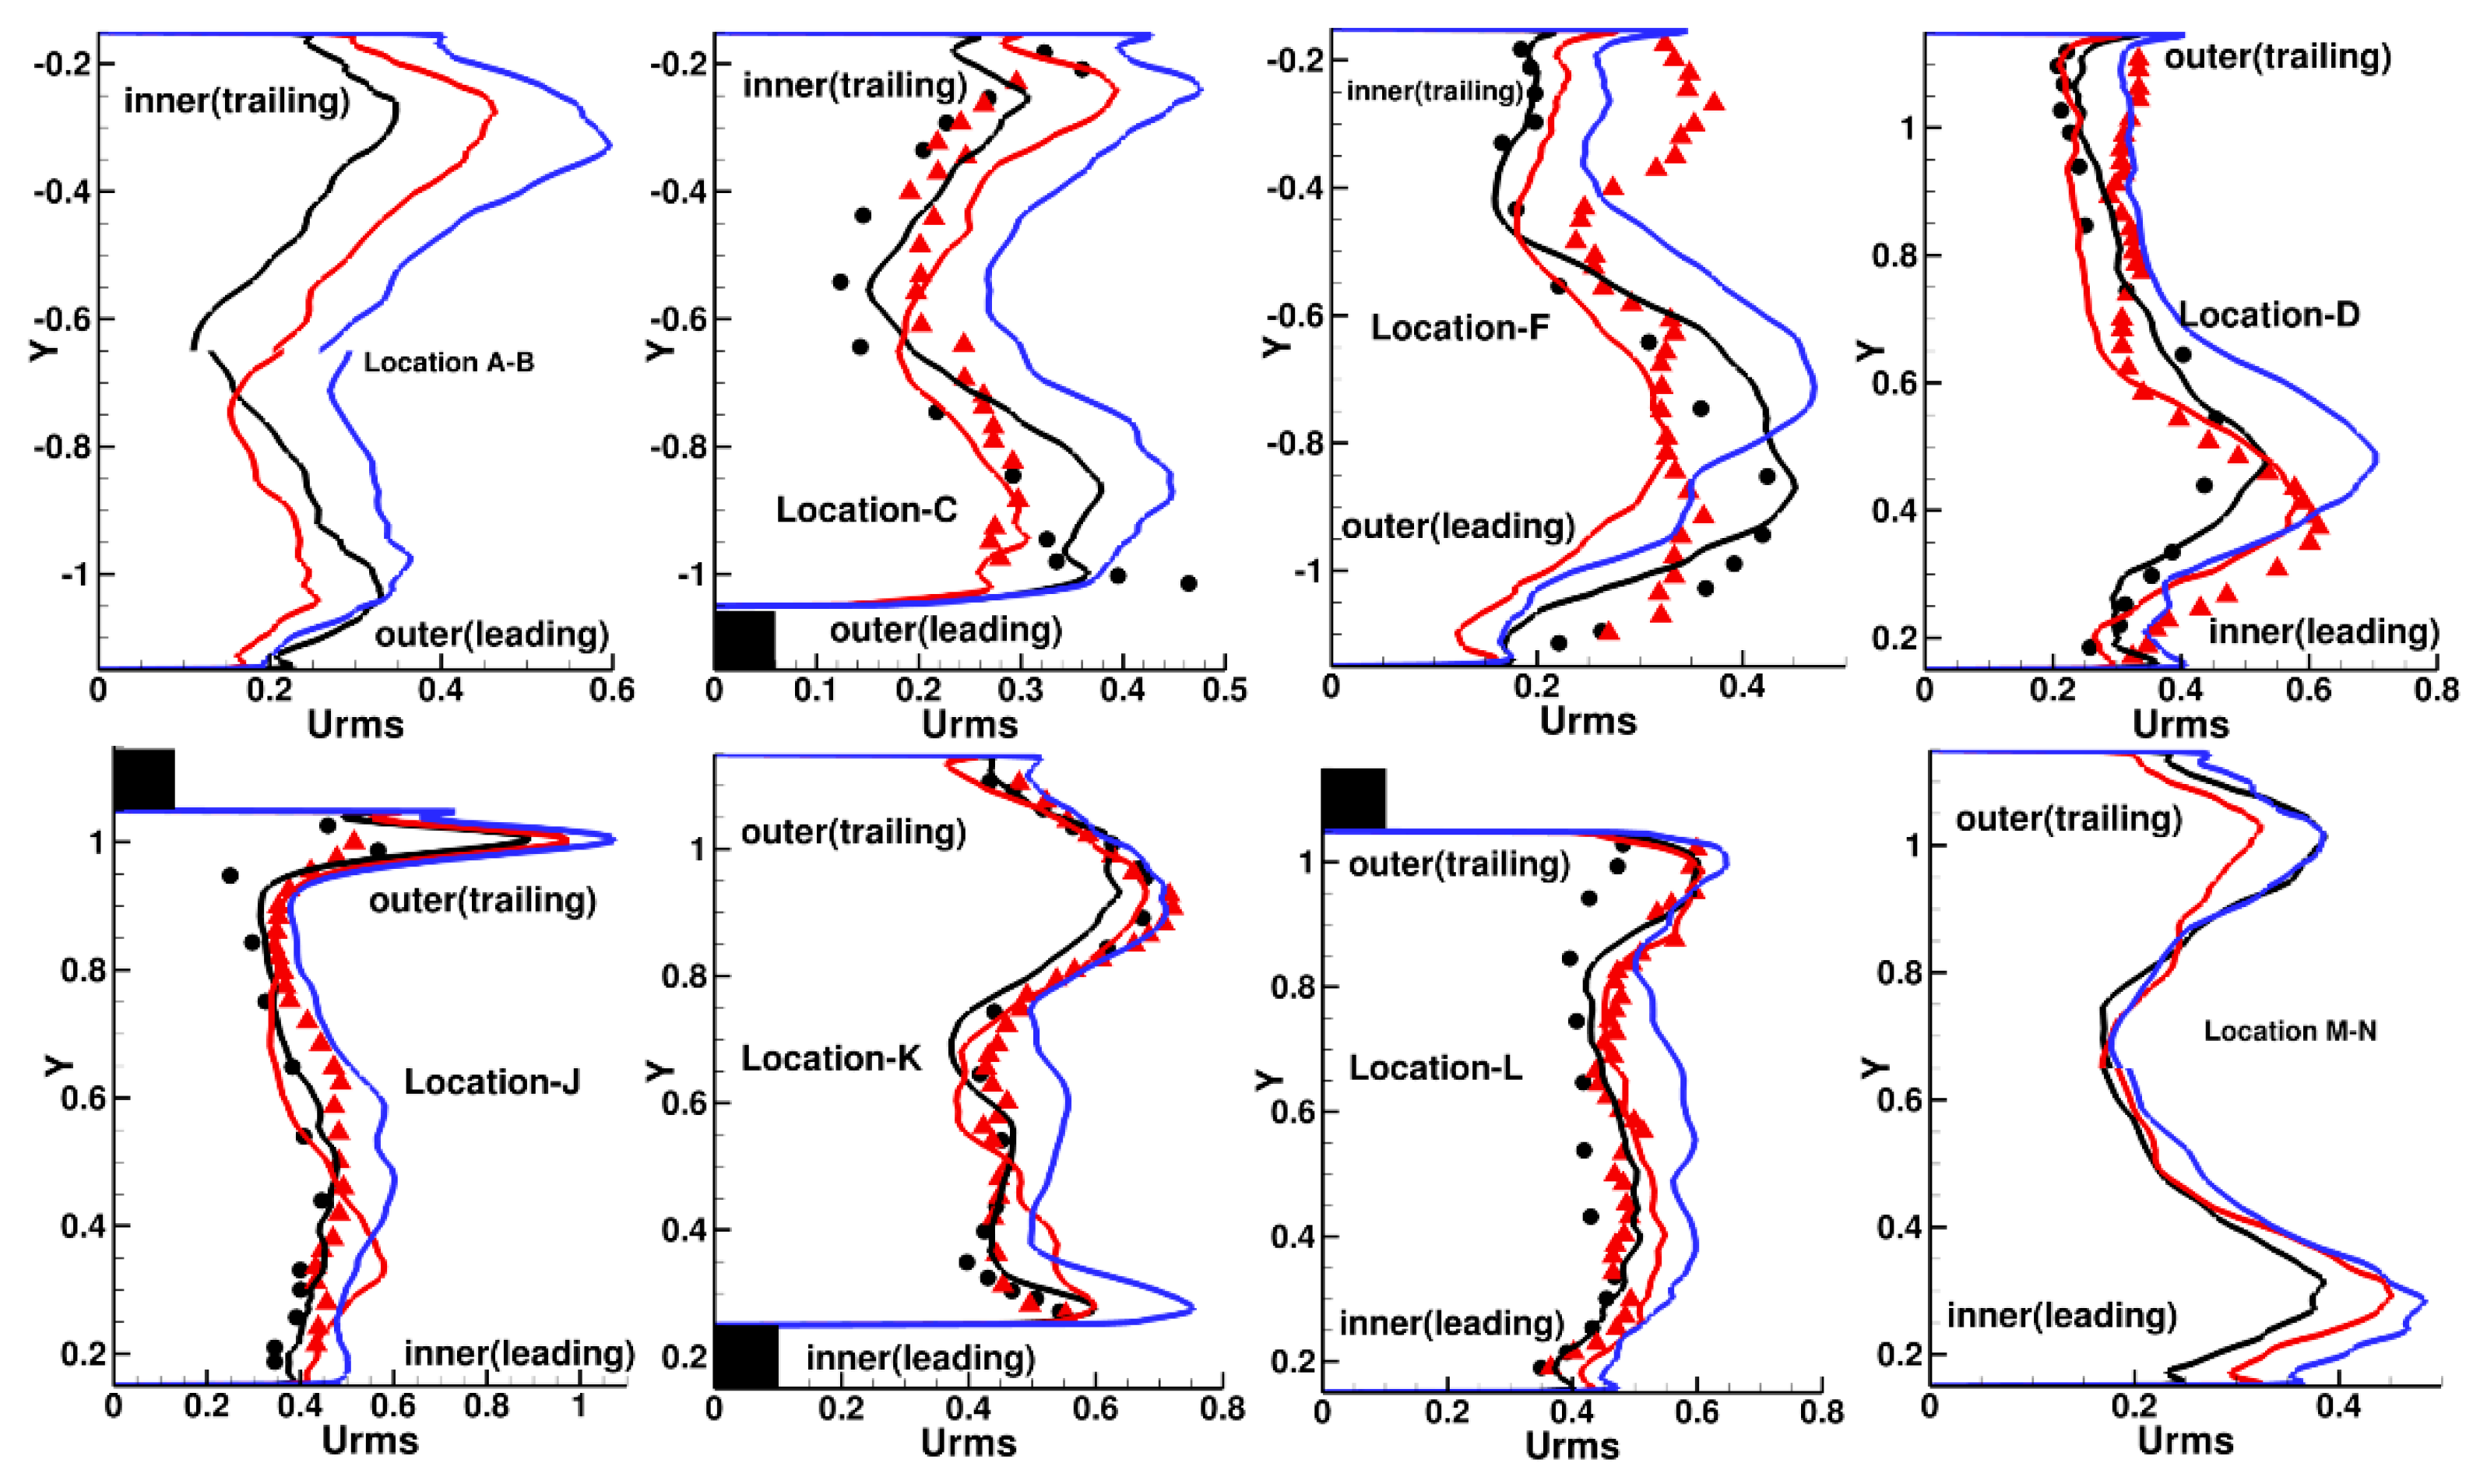
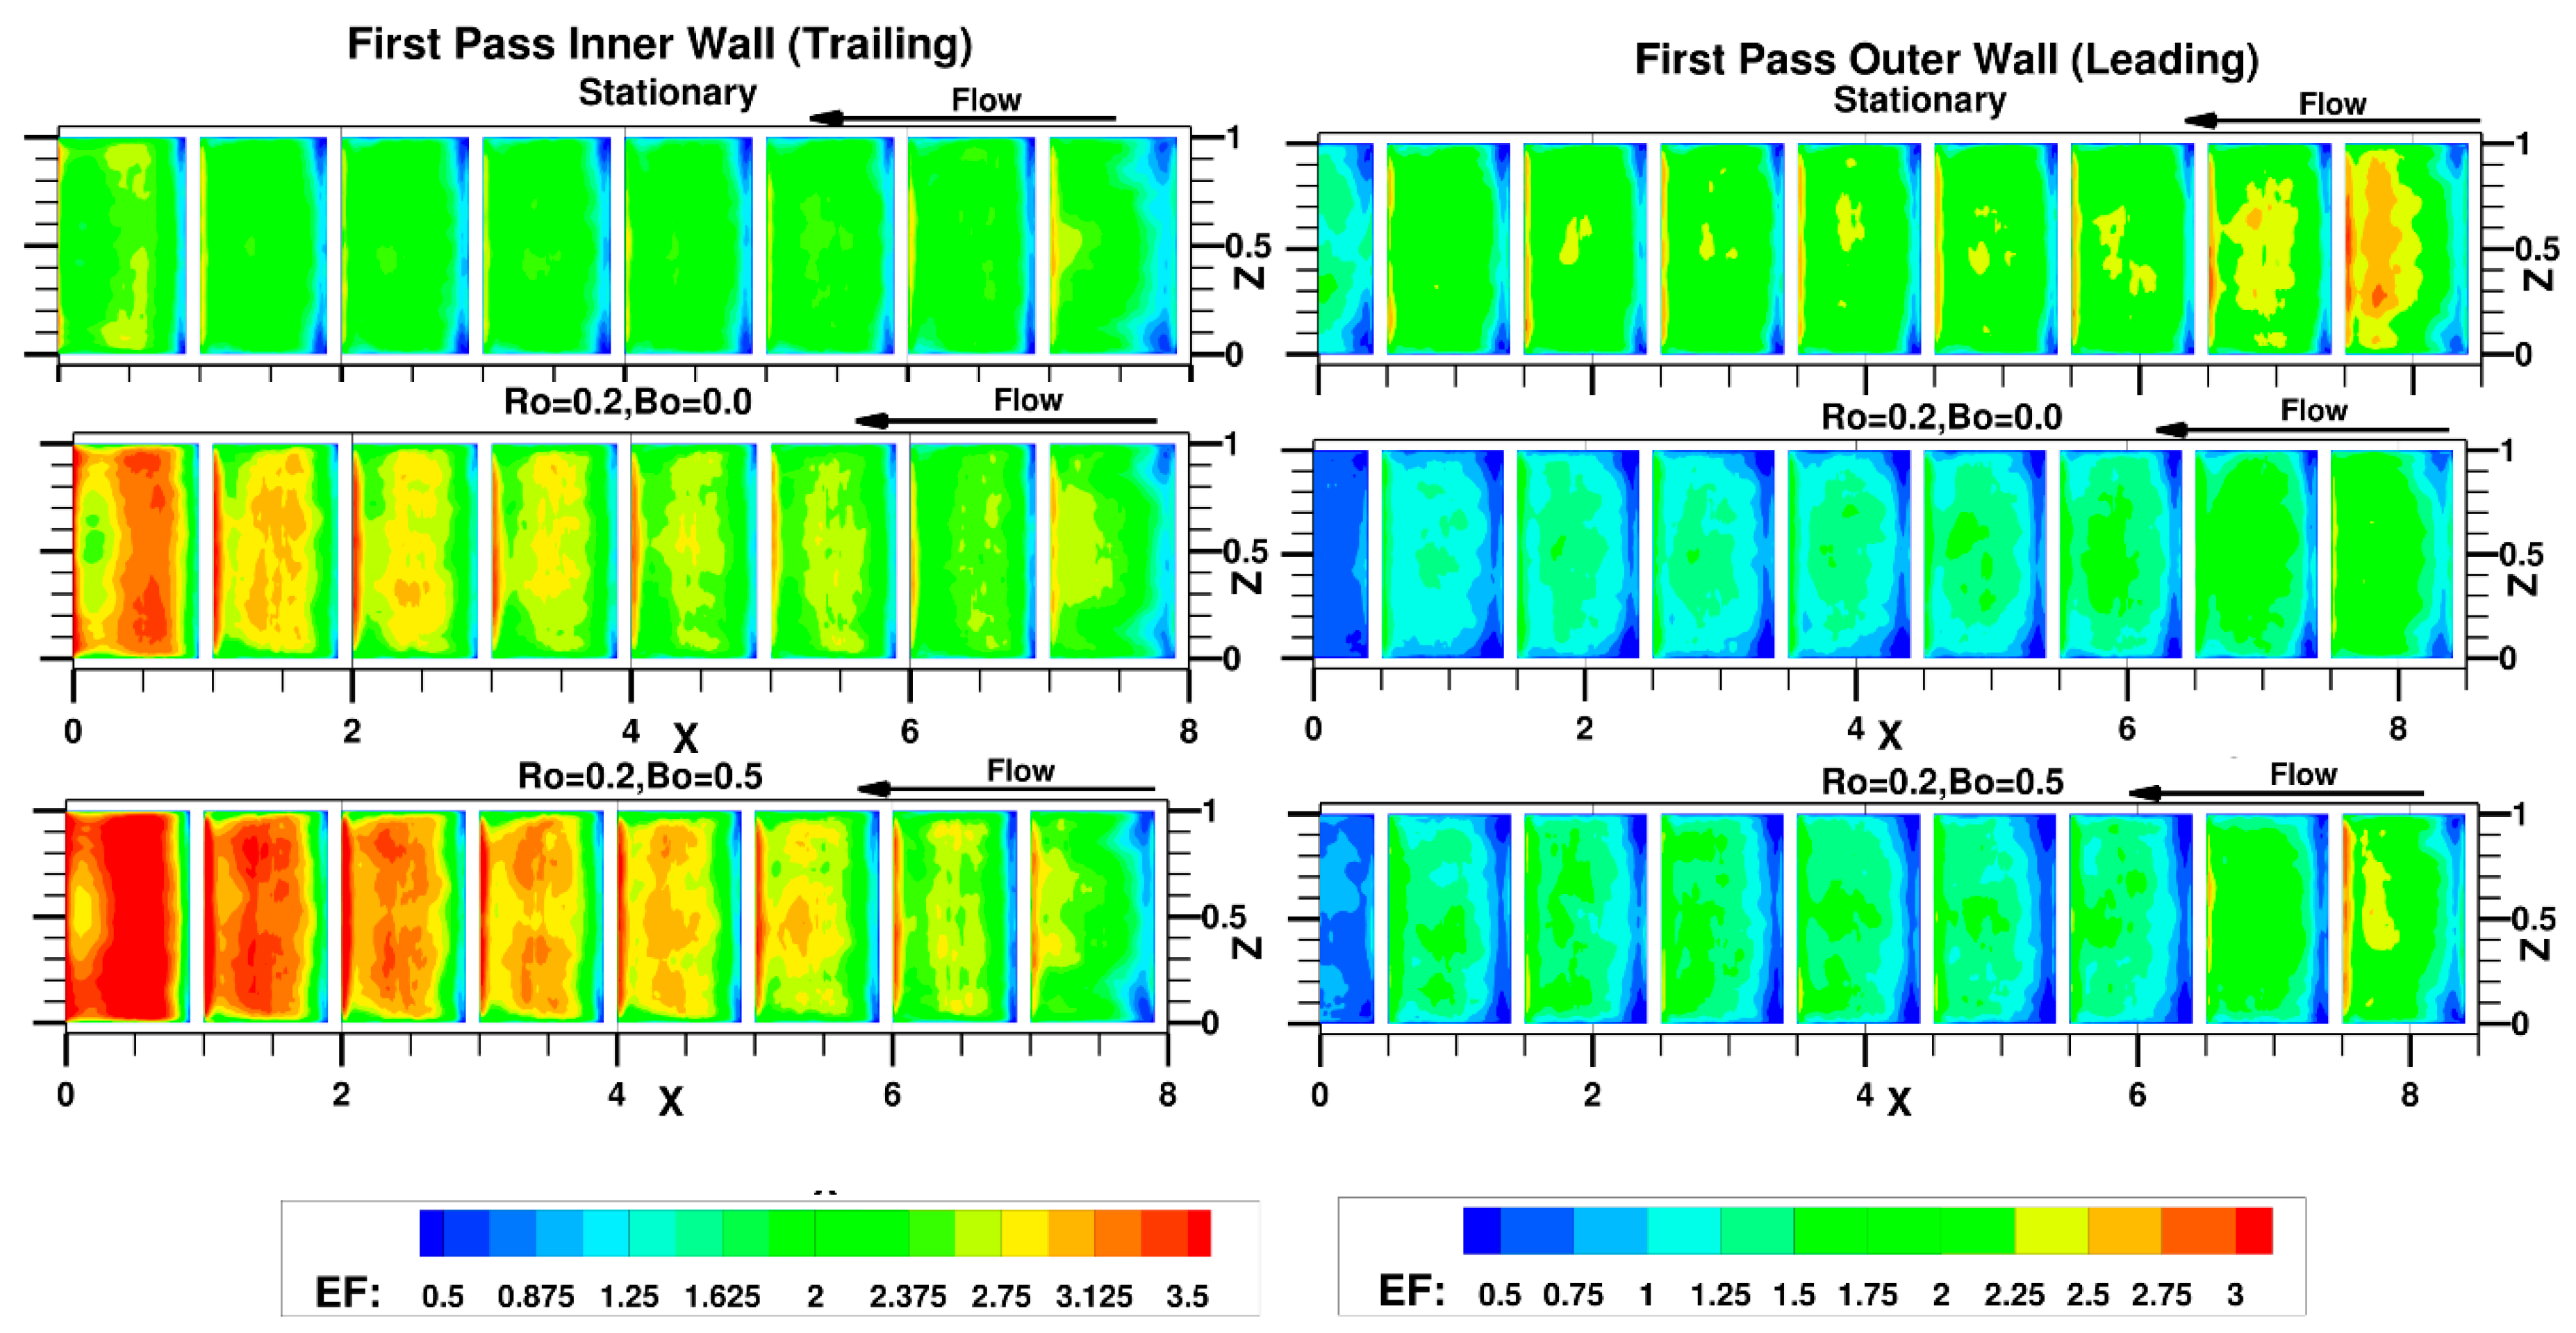
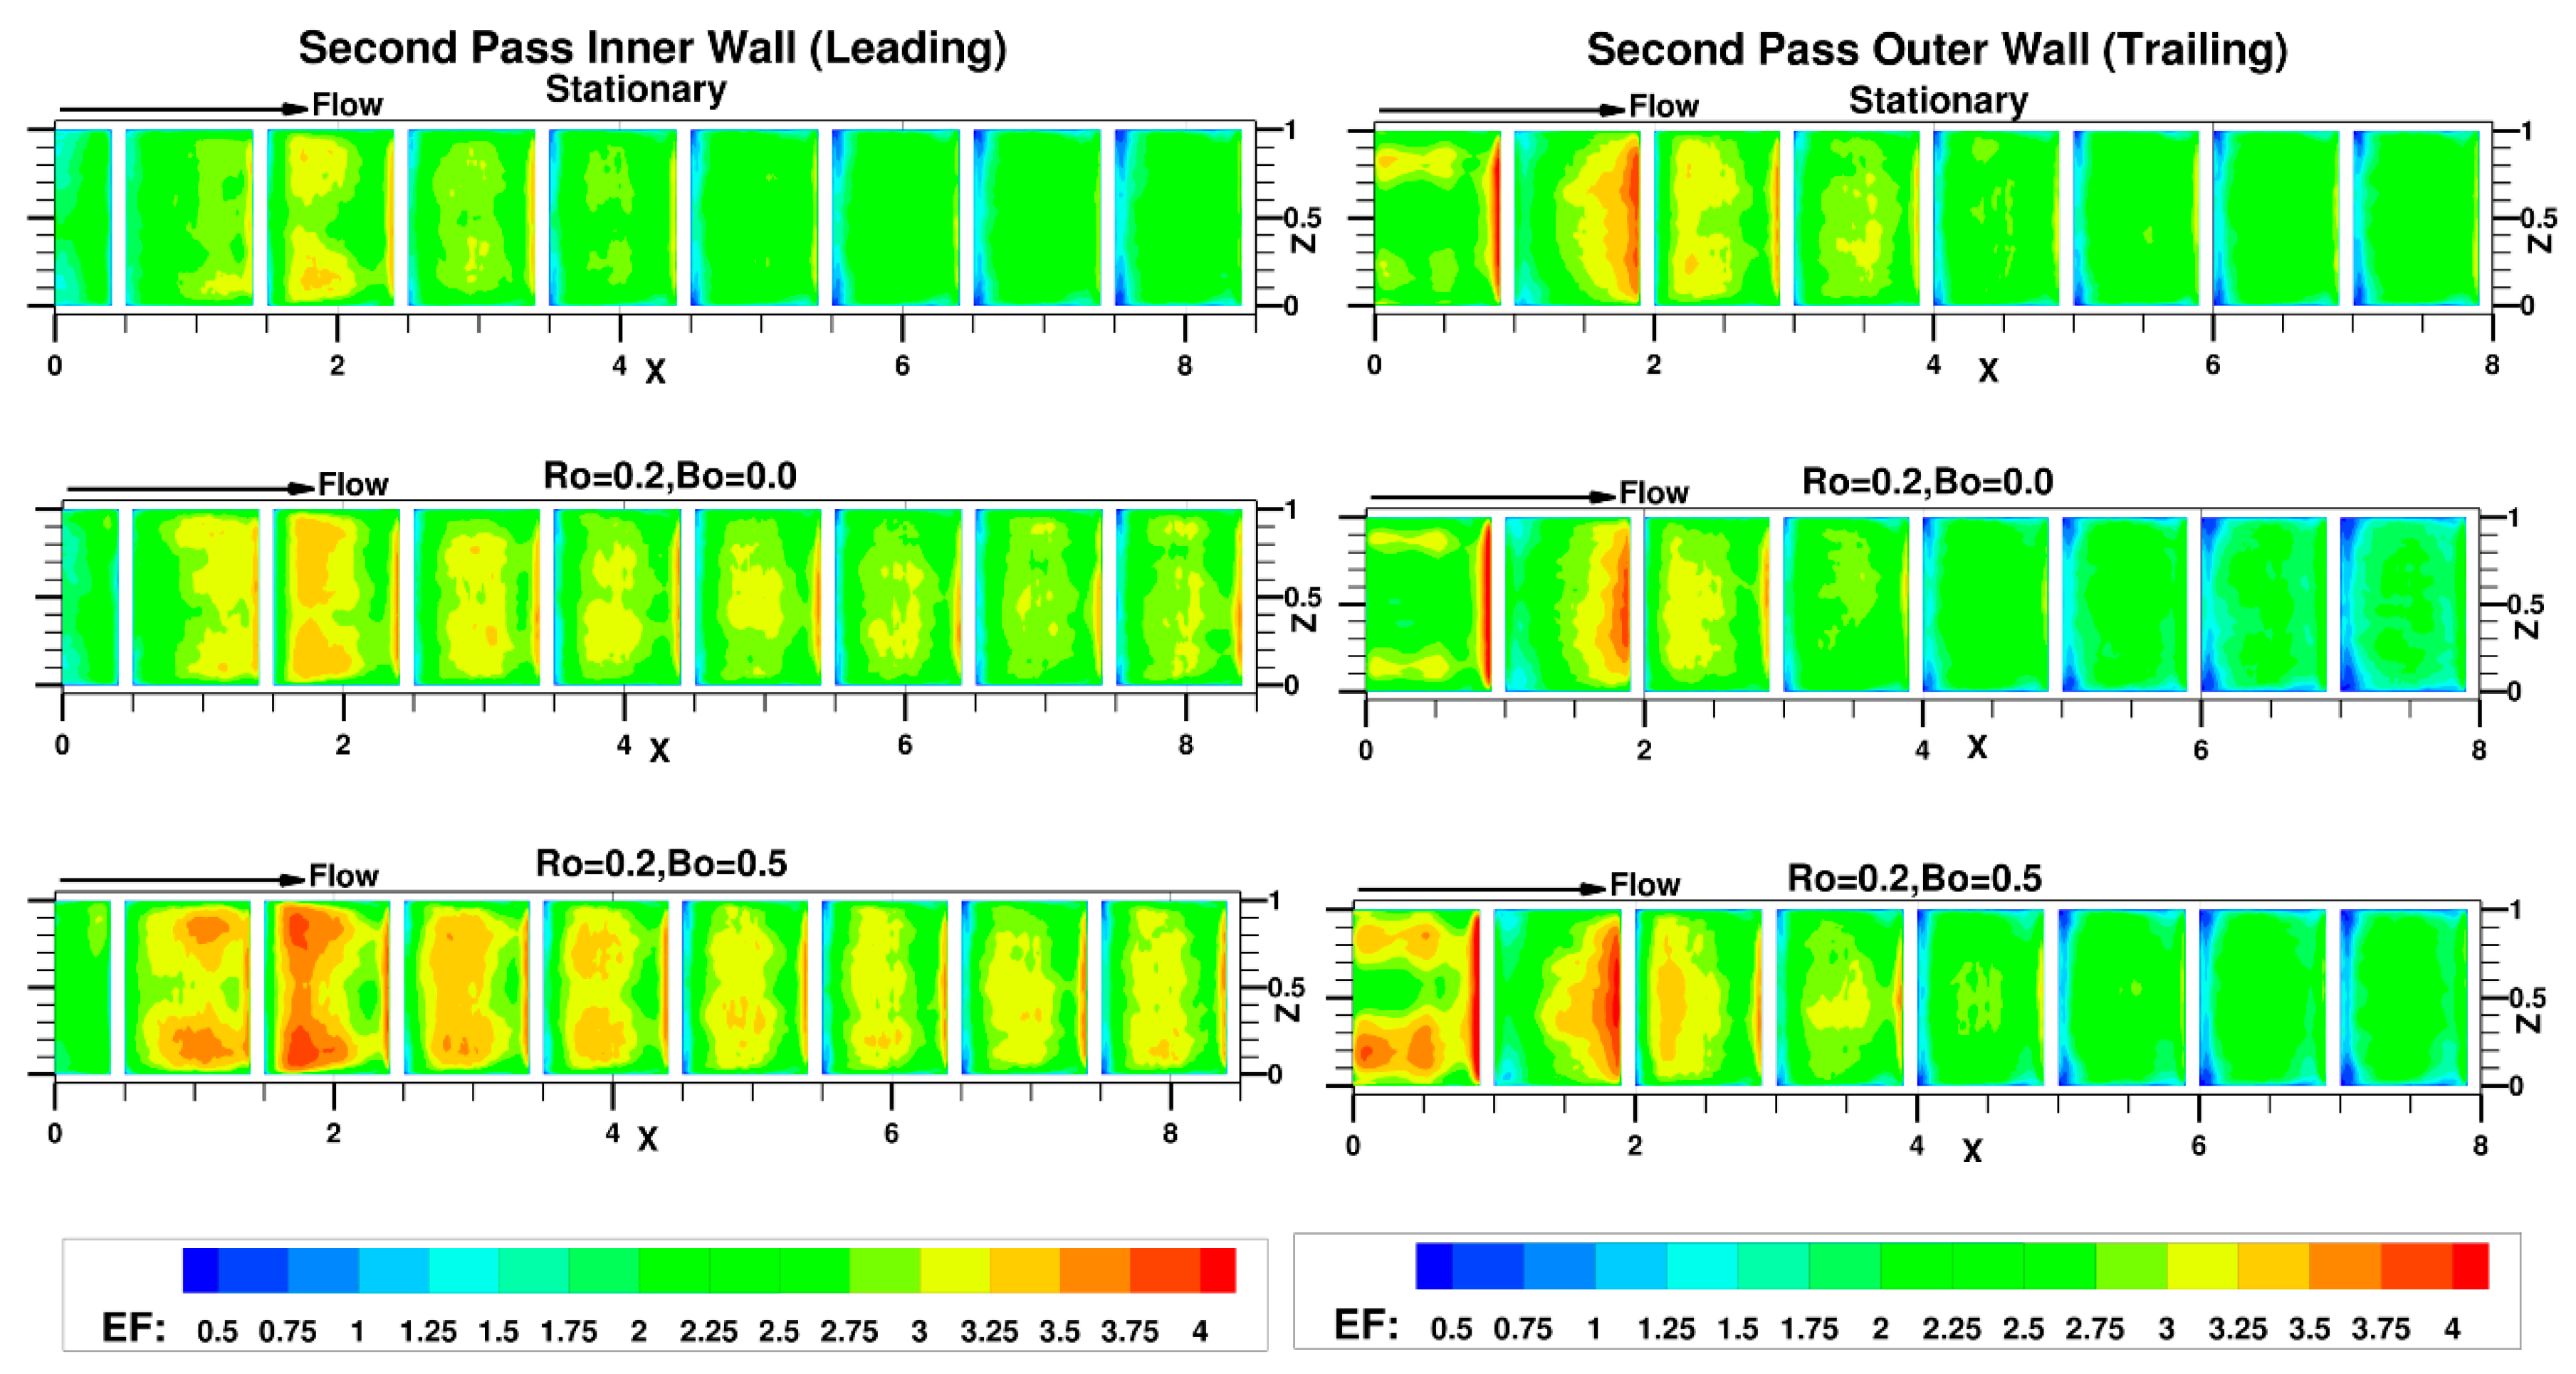
Table 1.
Grid characteristics for grid sensitivity study.
| GRID | 22 m | 28 m | 35 m |
|---|---|---|---|
| Pitch resolution (x, y, z) | 120 × 120 × 80 | 136 × 136 × 80 | 152 × 152 × 82 |
| Rib resolution (x, y) | 24 × 24 | 28 × 28 | 30 × 30 |
| Δxmin/Δxmax | 0.0025/0.025 | 0.002/0.0194 | 0.002/0.0161 |
| Δymin/Δymax | 0.0025/0.02 | 0.002/0.01655 | 0.0015/0.015 |
| Δzmin/Δzmax | 0.0025/0.02395 | 0.002/0.0265 | 0.002/0.02481 |
Table 2.
Pressure drop and friction coefficient.
| Case | |||
|---|---|---|---|
| Stationary | 2.809 | 0.06675 | 14.51 |
| Ro = 0.2, Bo = 0.0 | 3.006 | 0.0714 | 15.52 |
| Ro = 0.2, Bo = 0.5 | 2.51 | 0.05965 | 12.97 |
Table 3.
Duct-averaged Nusselt number.
| Case | ||
|---|---|---|
| Stationary | 404 | 2.02 |
| Ro = 0.2, Bo = 0.0 | 406 | 2.03 |
| Ro = 0.2, Bo = 0.5 | 443 | 2.22 |
© 2018 by the authors. Licensee MDPI, Basel, Switzerland. This article is an open access article distributed under the terms and conditions of the Creative Commons Attribution (CC BY) license (http://creativecommons.org/licenses/by/4.0/).
Share and Cite
MDPI and ACS Style
Tafti, D.; Dowd, C.; Tan, X. High Reynold Number LES of a Rotating Two-Pass Ribbed Duct. Aerospace 2018, 5, 124. https://doi.org/10.3390/aerospace5040124
AMA Style
Tafti D, Dowd C, Tan X. High Reynold Number LES of a Rotating Two-Pass Ribbed Duct. Aerospace. 2018; 5(4):124. https://doi.org/10.3390/aerospace5040124
Chicago/Turabian StyleTafti, Danesh, Cody Dowd, and Xiaoming Tan. 2018. "High Reynold Number LES of a Rotating Two-Pass Ribbed Duct" Aerospace 5, no. 4: 124. https://doi.org/10.3390/aerospace5040124
Note that from the first issue of 2016, this journal uses article numbers instead of page numbers. See further details here.