Article

A Methodological Framework for the Risk Assessment of Drone Intrusions in Airports

1
CIRA—Italian Aerospace Research Centre, Safety and Security Department, Via Maiorise, 81043 Capua, Italy
2
ONERA—The French Aerospace Lab, 2 Avenue E. Belin, CEDEX 4, 31055 Toulouse, France
3
INTA—National Institute of Aerospace Technology, Unmanned Aerial Platforms Department, Torrejón de Ardoz, 28850 Madrid, Spain
4
ENAC—Italian Civil Aviation Authority, Viale Castro Pretorio 118, 00185 Roma, Italy
*
Author to whom correspondence should be addressed.
Aerospace 2022, 9(12), 747; https://doi.org/10.3390/aerospace9120747
Submission received: 25 October 2022 / Revised: 21 November 2022 / Accepted: 22 November 2022 / Published: 24 November 2022
(This article belongs to the Collection Air Transportation—Operations and Management)

Abstract

:
Drone expansion needs to be considered as a menace in cases of negligent, illicit, or non-cooperative use. In the case of airports, a complete protection against drone intrusion should rely on an intrusion management system, aiming at avoiding the closure of the airport. This system requires the setting of proper risk assessment methodologies for airport operations, to explicitly consider the features of drone intrusion, possibly from a quantitative point of view. This work proposes a methodological framework for the risk assessment of drone intrusions in airports, tailored on drone-intrusion features, airport features, and current operations, and considering both safety-related and security-related causes. The framework is based on the combination of model-based and data-driven approaches in order to: (i) estimate an airport vulnerability index, to measure the susceptibility of the airport to drone intrusions, based on reference datasets; (ii) specify a set of event trees to evaluate the risks of the different threat scenarios related to drone intrusions. The proposed methodological framework is applied to a concrete case study, related to Milan Malpensa airport. The achieved results show the effectiveness of the approach and elicit further requirements for counter-drone systems in airports based on the assessed risks.

1. Introduction

As the European Commission’s regulations are paving the way for the drone market growth [1,2] and its associated U-space implementation [3], drone expansion needs to also be considered as a menace in case of negligent, illicit or non-cooperative use [4], especially in air traffic nodes such as airports and their surroundings. In that sense, the European Union Aviation Safety Agency (EASA) published some guidelines [5,6,7] in which counter-drone systems are considered in order to mitigate drone intrusion impact on the airport ecosystem. These systems are also named counter-UAS or c-UAS systems, where the acronym UAS stands for unmanned aerial system. Instead, the International Civil Aviation Organization (ICAO) use the acronym RPAS (remotely piloted aircraft system) to denote drones.
Countering non-cooperative drones has been identified as a challenge after incidents with commercially available drones showed that even small systems could put a threat to political leaders, critical infrastructures, and commercial businesses. One of the main examples is represented by the drone intrusion in London Gatwick airport in December 2018, during which an unknown number of overflying drones caused a 33 h paralysis of the airport’s operations [8]. In addition to the safety impacts, these episodes may seriously affect the economic costs of airport and airline operations [9]. EASA guidelines [5] report a cost of EUR 64 million in case of the 2018 Gatwick incident, and a delay cost from EUR 325,000 to EUR 514,000 in case of a 30 min runway closure for the ten largest European airports. Moreover, the occurrences of drones’ unauthorized intrusions are incrementing [10] and further increases are expected to be due to the wider diffusion of drones in future U-space scenarios, which may potentially affect other critical infrastructures (e.g., vertiports) and may imply a significant addition in the risks of safety and security incidents related to drone intrusions, as well as of the economic costs of drone incidents.
Thus, a multitude of C-UAS systems are being developed to satisfy the growing need to defend against intruding drones, especially at low-altitudes and in the operational envelope of UAS. These systems are designed to detect and then engage the threat, and so they exploit a reactive paradigm to face drone intrusions. For example, in the case of airport operations, such a paradigm consists in detecting the threat and in closing the airport overall until the threat has not been overwhelmed. More in general, considering the short time available to employ countermeasures, complementary countermeasures should be chosen to increase the effectiveness of counter-drone systems. Indeed, a comprehensive C-UAS approach must not only rely on reacting to an imminent threat, but it has to include preventive countermeasures and proactive countermeasures as well. For example, among the preventive countermeasures, there are the deterrence and the denial to enter protected areas. Instead, proactive countermeasures are mainly based on: creating a complete and timely situational awareness about drone intrusions in the airport; designing procedures and protocols to manage the intrusions in order to mitigate their impact as much as possible.
In the case of airports, a complete protection against drone intrusion shall rely on a RPAS Intrusion Management System (RIMS) or Drone Intrusion Management System (DIMS), which leverages the different building blocks, from the detection up to the mitigation. Indeed, as proposed by EASA in the counter-drone action plan [11], aerodromes shall:
  • support the assessment of the risks related to unauthorized drones;
  • mitigate risks from unauthorized drone use;
  • implement counter-drone measures from a global safety perspective.
Thus, an effective RIMS has to increase the situational awareness of drone intrusions and has to establish procedures and protocols to manage them, with minimal impact on the operations [10]. To exploit a proactive behavior, a RIMS shall try to avoid the closure of the overall airport even in case of unauthorized drone intrusions by: (i) limiting the interruption to those operations that are strictly affected by the intruder; (ii) increasing the resilience of the airport, that is minimizing the performance degradation against drone intrusions. Accordingly, this requires the setting of proper risk assessment methodologies, possibly quantitative, which explicitly consider the features of drone intrusions and of the airport. This methodology should be consistent with the observation that, even if each drone incident is specific, several common factors may arise and their evaluation may be applied for risk analysis [5].
ASPRID (airport system protection from intruding drones) project [12] has developed an operational concept and an enhanced C-UAS system in which risk assessment studies are crucial to achieve the proactive protection of the airport against drone intrusions in a safe and efficient way. Our previous work [10] puts forward the basis for a systematic process of risk management within the RIMS of an airport. In particular, this work describes a quantitative assessment of the historical features of drone intrusions in airports, using different public databases with reports about real sightings. The available features are modelled in terms of probability distributions and machine-learning models. Moreover, a preliminary analysis is provided for the definition of a vulnerability index against to drone intrusions. This paper aims at proposing a unified methodological framework for the risk assessment of airport drone intrusions, leveraging the results achieved in our previous work [10]. Such framework is based on the combination of two model-based and data-driven specifications for a given airport:
  • a vulnerability index to quantitatively assess the susceptibility of the airport to drone intrusions, based on reference datasets;
  • a set of event trees to quantitatively assess the risks of the different threat scenarios related to drone intrusions, based on the airport’s vulnerability index.
The proposed approach is applied for a concrete case study, related to Milan Malpensa airport.
The article is organized as follows. Section 1 presents a brief overview of the issues related to drone intrusions in airports, highlighting risk assessment as a mandatory tool for a proactive approach. Section 2 analyzes the related work for the risk assessment of drone intrusions. Section 3 describes the proposed methodological framework. Section 4 reports the data-driven specifications of airport vulnerability. Section 5 reports the model-based specifications of event trees. Section 6 describes the case study and the related results. Section 7 provides a discussion of the proposed approach, based on the achieved results. Section 8 provides the conclusions.

2. Related Work

This section provides an analysis of the related work about risk assessment of airport drone intrusions.
Firstly, the key terms for the risk assessment are introduced in Table 1, highlighting the applicable reference documents. Such terms are useful for the comprehension of the objectives of risk assessment in the case of drone intrusions.
The differences and the possible relationships between safety risk assessment and security risk assessment have been studied in some previous works, especially for industrial control systems [18,19]. However, several guidelines are available for the risk assessment, dealing separately with safety and security issues. For example, the international organization for standardization (ISO) has published a standard document (ISO 31000:2018) for the managing of risks faced by organizations and for the setup of a generic risk management process [20]. Instead, ISO and the international electrotechnical commission (IEC) have jointly provided a standard for the risk management specifically concerning information security [21].
In the aviation domain, a safety management manual (SMM) is made available by the ICAO [22]. Such manuals provide detailed guidance on the principles and practices of aviation safety management, and it is designed to assist States, aircraft operators, aerodrome operators, and air traffic service providers in implementing safety management systems. On the other hand, an ICAO restricted manual is available for security risk management in order to assist the aviation entities that are responsible for implementing security measures and for preventing acts of unlawful interference [23]. Also, the validation of new solutions within air traffic management (ATM) typically requires both a safety assessment and a security assessment. For example, within the single European sky ATM research (SESAR), the following documents have to be used as a guideline for the development of new ATM solutions: (i) the safety reference material [24], which provides an integrated approach to safety assessments that meet the needs of the SESAR work programme; (ii) the security reference material [17], which explains the SecRAM methodology as a set of methods, tools, and techniques to deliver the evidence necessary for a cybersecurity risk assessment related to ATM. Other guidelines are available for the risk assessment of airports, including the security perspective, such as: reference [25], the Annex A of which provides a general process for conducting vulnerability assessments and includes a model for assessing airport vulnerabilities in Appendix A; reference [26], which has been provided by the Department of Homeland Security in the United States (U.S.) to determine security needs at different airport using a risk-based security approach. Instead, in regard to the research perspective, a relevant example is represented by SATIE (security of air transport infrastructure of Europe) project [27], which has analyzed the cyber and physical threat scenarios typical of attacks that threaten airport infrastructures and the results of a risk analysis applied to these scenarios. Instead, reference [28] presents an example of the data-driven approach for risk assessment, using radar-tracking data to estimate precursors that may lead to unsafe outcomes related to traffic separations.
For the specific case of airport drone intrusions, EASA guidelines [5,6,7] represent the main reference in which some suggestions are provided for risk assessment [7]. Concerning research works, reference [29] has studied drone incidents in the vicinity of worldwide airports to deliver a quantitative and qualitative analyses, proposing possible mitigation measures. Instead, reference [30] discusses a resilience action plan for airport stakeholders to defend an airport against airborne threats from misused drones. Lastly, several works provide a detailed analysis of the technological options for counter-drone systems, e.g., [30,31,32]. Thus, our proposed work represents the first attempt at defining a joint data-driven and model-based methodological framework for the risk assessment of airport drone intrusions, considering both safety and security perspectives.

3. Risk Assessment Framework for Drone Intrusions in Airports

This section describes the proposed methodological framework for the risk assessment of drone intrusions in airports.

3.1. Problem Statement

As recommended by EASA guidelines [7], the problem of risk assessments of airport drone intrusions has to include both the aviation safety and the aviation security perspective. Thus, the issue is to develop a unified methodological framework for the risk assessment of airport drone intrusions. In detail, it shall be:
  • a methodological framework, in the sense of a sequence of steps to complete the assessment procedure;
  • unified, in the sense of a safety–security-integrated approach.
Such issues trigger the following requirements of the methodology:
  • It shall be applicable to a great variety of airports, considering their characteristics;
  • It shall support at least a semi-quantitative evaluation of risks, integrating the evaluation with mitigation actions and information about degraded performances in threat scenarios;
  • It shall use formalisms that may be easily understood by stakeholders;
  • It shall support (possibly automated) what-if analyses for the computation of qualitative/quantitative values of interest about risk-related figures and performance metrics;
  • It shall allow a reuse across multiple systems and objects (e.g., different airports, different airport assets, different drone models, etc.);
  • It shall effectively consider possible historical or statistical data (if available) about drone intrusions at a local level (i.e., for the specific airport) or at an aggregated level (i.e., for a specific region or State).
More in general, in case of security-related intrusions (i.e., deliberate attacks by means of drones), the methodology should explicitly consider the possible classes of drone intrusions [33]: (i) physical attack, i.e., attack of a physical threat with a physical impact; (ii) cyber-physical attack, i.e., attack of a physical threat with a cyber impact; (iii) cyber-physical threat, i.e., attack of a cyber threat with a physical impact; (iv) cyberattack, i.e., attack of a cyber threat with a cyber impact. With reference to this classification, being drones a physical threat, their possible malicious intrusions may be: (i) a physical attack, also named drone physical-intrusion, that is a malicious physical interference or collision with an asset; (ii) a drone cyber-physical attack, also named drone cyber-intrusion. However, for the purposes of this work, only drone physical-intrusions are considered as a reference threat in the stated problem.

3.2. Approach

To solve the stated problem, this work proposes a model-based and data-driven methodological framework. Indeed, it is:
  • model-based, since it applies modelling techniques for the specification of the reference aspects of the target system, e.g., failure-oriented behaviors, success-oriented behaviors;
  • data-driven, since it exploits available datasets for the characterization of the susceptibility of an airport with respect to the phenomenon of drone intrusions.
In detail, Figure 1 illustrates the proposed methodological framework for the risk assessment of drone intrusions for a specific airport. Such figure highlights both the activity flow and the related interfaces by reporting:
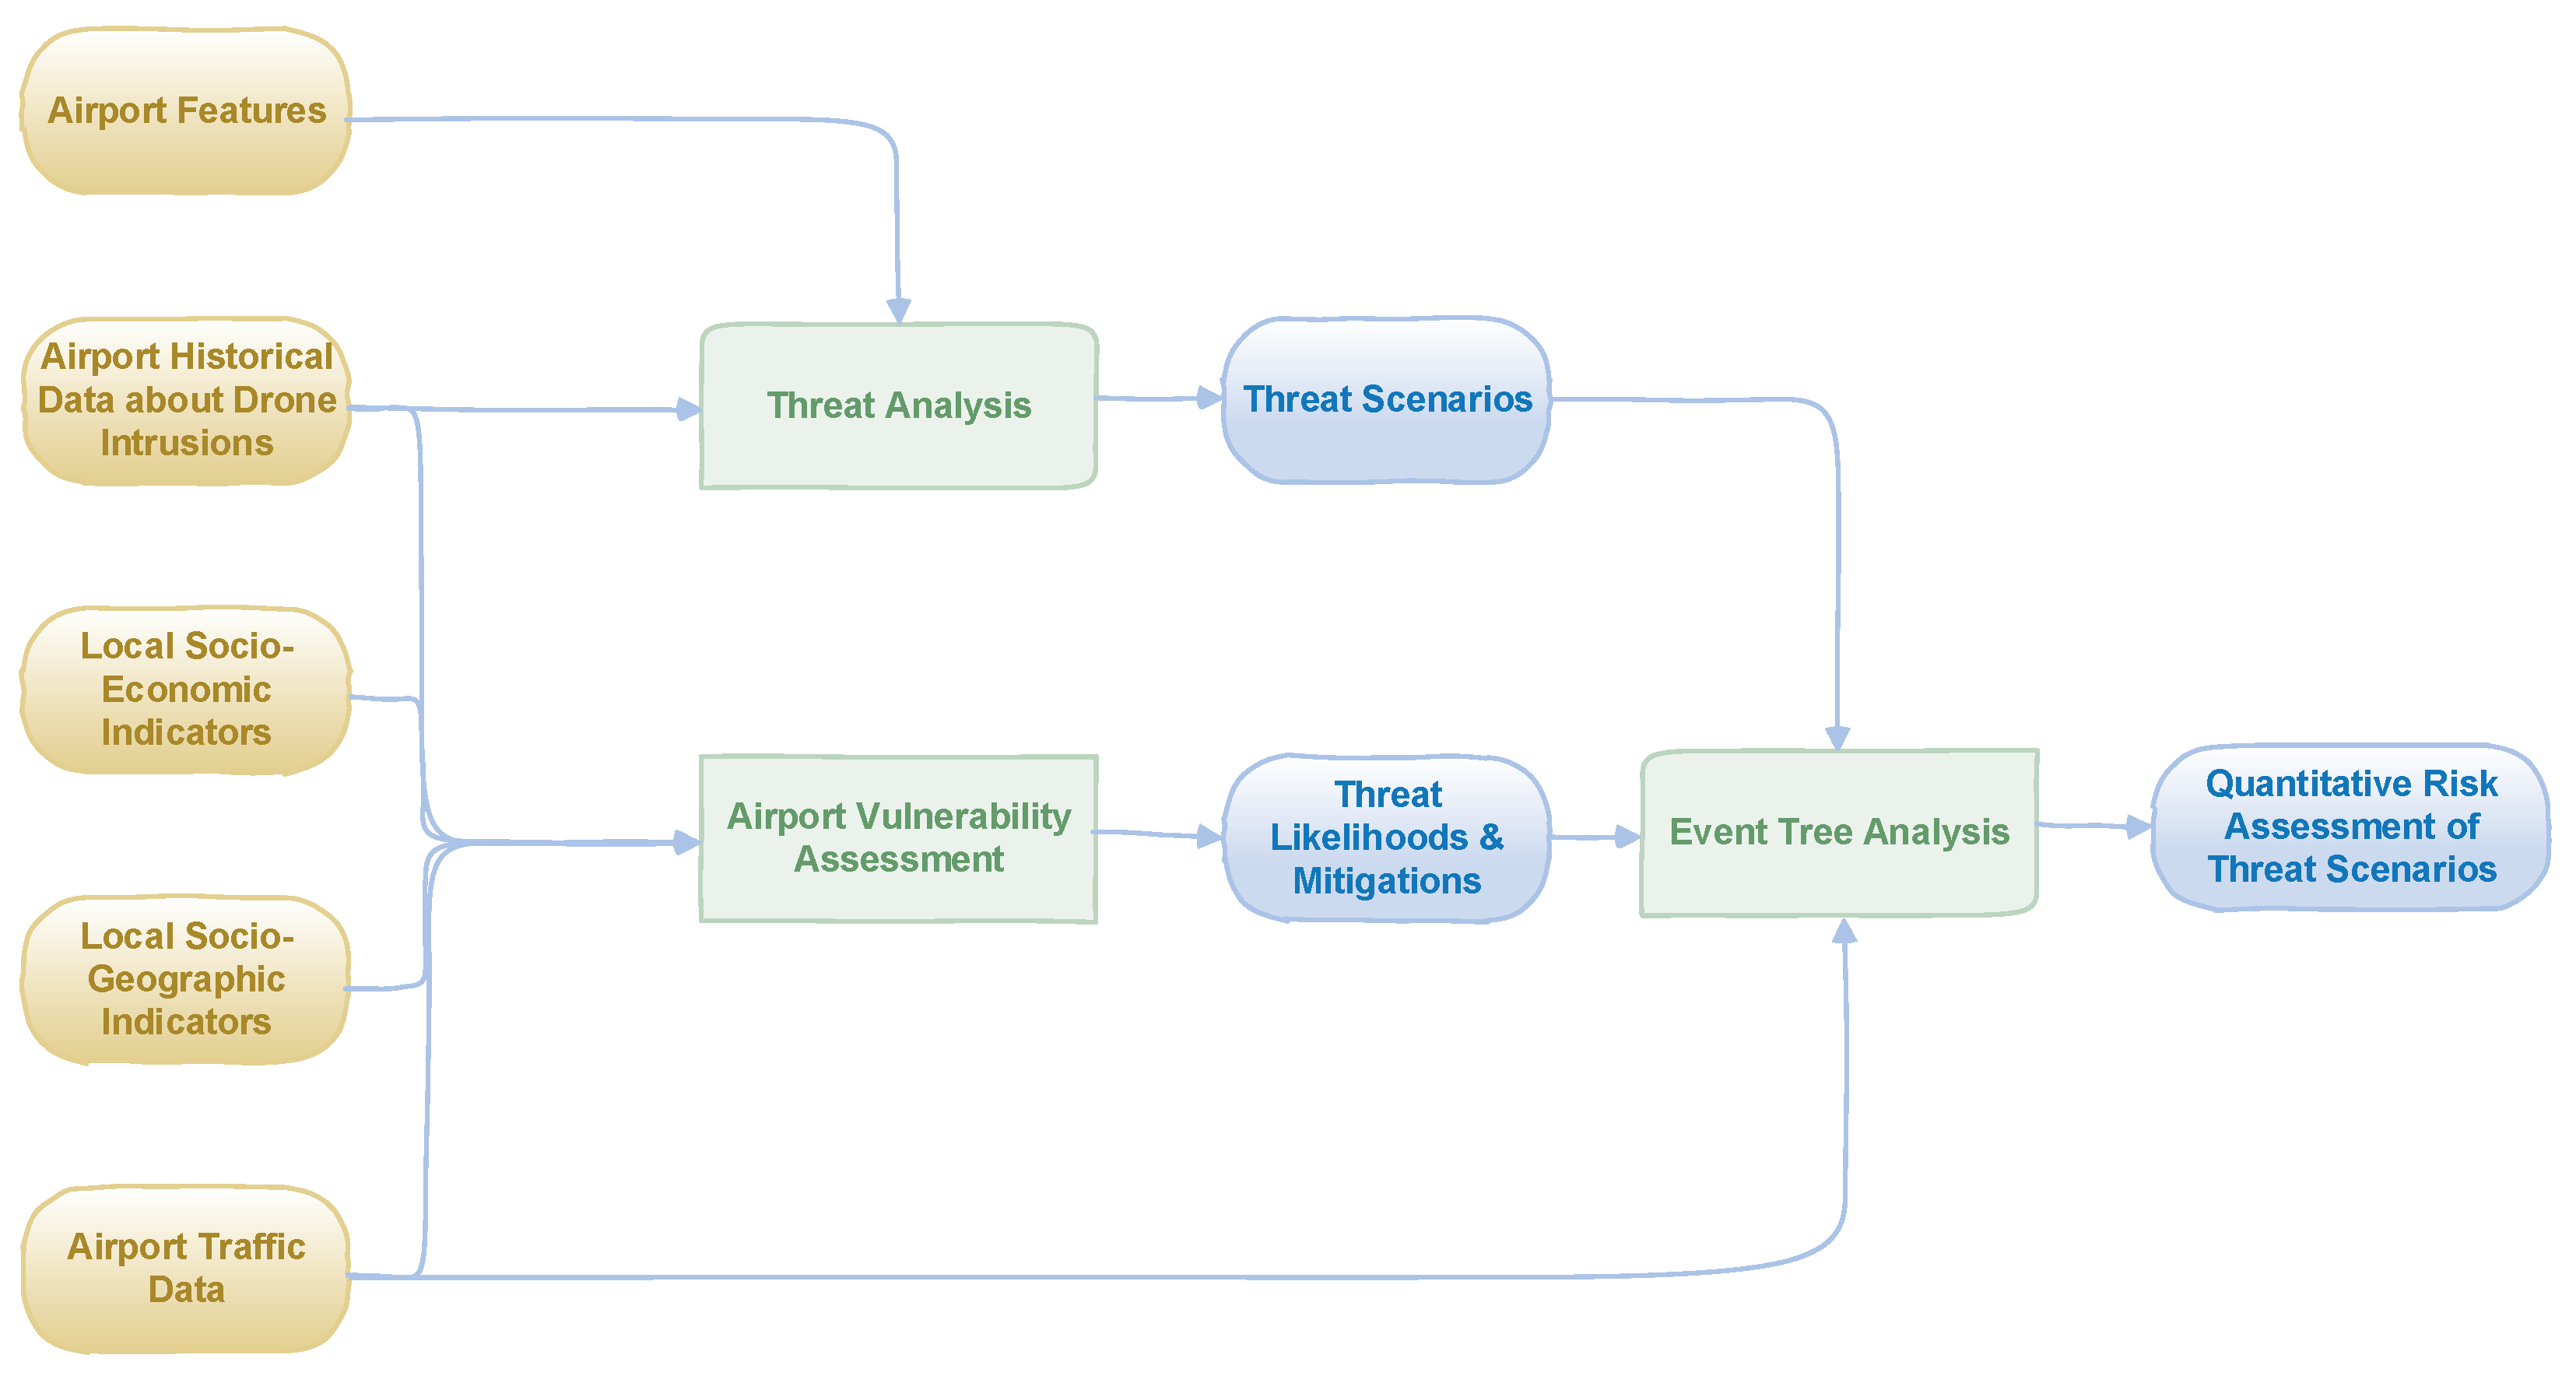
  • input data (yellow blocks);
  • activities (green blocks);
  • outcomes (blue blocks), in terms of both intermediate and final outcomes.
The proposed framework prescribes the following activities:
  • Threat analysis. This activity aims at identifying the possible threats and the related threat scenarios about airport drone intrusions, considering both safety-related (i.e., accidental) and security-related (i.e., malicious) intrusions. It is possibly fed by historical data about intrusions. It is performed by exploiting a detailed analysis of the reference airport, for example, considering the configuration of the following assets: runways, terminals (both passenger and cargo), taxiways, traffic control tower, aircraft hangars, aprons, communication, navigation and surveillance (CNS) systems, etc. Clearly, general features of possible intruding drones (e.g., maximum speed, mass, endurance, radio coverage, etc.) should be used as a reference for the analysis. For the purposes of the methodological framework, a threat is any unauthorized flight activity of a drone in the airspace or in the vicinity of an airport. Note that this choice is in line with EASA guidelines [7]. Then, threat scenarios are inferred by considering the possible physical interference of an intruder drone with respect to a given airport’s asset. In principle, such behavior may be traced to two main classes of drone’s interference: (i) fly-by and (ii) collision. In detail, given an airport’s asset: (i) the fly-by refers to the proximal presence of a drone, wherein proximal means at a distance less than a specific threshold or inside an airspace (typically centered on the asset) with an agreed shape; (ii) the collision refers to the crash of the drone with the asset, usually implying a damage to the asset according to the kinetic energy of the drone itself. Note that these main classes may be further split in sub-classes, for example: different proximity thresholds for the fly-by, which can lead to different interferences of the drone; different categories of collision according to its kinetic energy, which can lead to different damage levels; etc. All these sub-classes are associated with specific threat scenarios. In the case of fly-by, examples of threat scenarios are: unauthorized operations of a drone in the arrival path of a runway; unauthorized operations of a drone in the departure path of a runway; unauthorized operations of a drone in proximity of boarding/de-boarding passengers; unauthorized operations of a drone affecting an aircraft on the ground; unauthorized operations of a drone affecting the air traffic tower; etc.
  • Airport vulnerability assessment. This activity aims at evaluating an Airport Vulnerability Index (AVI) to quantify the exposure or susceptibility of an airport with respect to drone intrusions [10]. Such index may be assessed by explicitly considering the influence of different dimensions of the airport’s context (e.g., social, economic, etc.). Thus, the AVI may be used to provide estimations and predictions about drone intrusions in an airport, based on the exposure of the airport itself.
  • Event Tree Analysis (ETA). This activity aims at providing a quantitative assessment of the risk associated with each threat scenario by means of event trees. Indeed, event trees help to assess the acceptability of a risk related with a threat scenario fired by a drone interference (fly-by or collision) with an airport’s asset.
Note that the proposed framework is fully compliant to the requirements stated in the previous section, since it:
  • may implicitly manage different airports or different airport aggregations (i.e., at a region level or State level), considering their specific features by means of the input data (yellow blocks in Figure 1);
  • delivers a qualitative and quantitative assessment of risk levels for each threat scenario (considering the possible presence of mitigation means in both AVI and ETA), whereas threat analysis is on a qualitative basis (i.e., it is performed by means of the experience of human assessors);
  • exploits event trees, which are commonly used for risk analysis;
  • may provide what-if analyses, based on the tuning of input data (yellow blocks in Figure 1);
  • effectively considers different airports, assets, drone models, etc., based on the identified threat scenarios;
  • considers the airport’s historical data about drone intrusions as an essential input for the risk assessment.
The remainder of this work describes the data-driven activities and the model-based activities of the methodological framework in Figure 1, i.e., the airport vulnerability assessment and the ETA, respectively. Instead, the threat analysis has a qualitative nature and it is based on the experience of human assessors, on the features of the considered airport, and on the knowledge of drone features.

4. Airport Vulnerability Assessment

This section describes in detail the data-driven approach for airport vulnerability assessment, also based on our previous work [10].
Firstly, note that a vulnerability index shall consider the versatile nature of vulnerability by a acknowledging its different dimensions [14]. Indeed, generally speaking, vulnerability is influenced by a set of conditions and processes resulting from physical, social, economic, and environmental factors, which increase the susceptibility of a system or a community to the impact of hazards. Moreover, vulnerability encompasses the response and coping capability, being influenced also by the potential of the system or of the community to mitigate and react with respect to the occurrence of a feared event. For all these reasons, a vulnerability index is an “umbrella”, i.e., it may be defined as a multidimensional ensemble of multiple indicators. Such indicators are expressions of the different dimensions of vulnerabilities and are combined in a single composite index to possibly:
  • compare the vulnerability of different systems and communities;
  • compare different policies or options of the same system;
  • evaluate potential complications for recovery planning in case of occurrence of the feared event.
In particular, the ESPON hazards project [14] defined an approach for the measurement of the vulnerability of places as a combination of hazard exposure and social response within a specific geographic region, recognizing the following three dimensions for the vulnerability assessment: (i) economic dimension; (ii) social dimension; (iii) ecological or environmental dimension. Moreover, according to this approach, hazard exposure may be represented as a combination of: hazard likelihood, i.e., the probability of the hazard event; hazard mitigation, i.e., the effectiveness of the measures to reduce the likelihood of the hazard or its impacts. The combination of both variables provides the hazard tolerability.
Coherently with these basic concepts, a study has been performed to verify the possibility of defining an airport vulnerability index (AVI) to quantify the exposure or susceptibility of an airport against drone intrusions [10]. Such study has aimed also at highlighting possible additional data that would provide an added value for the identification of a complete “operational picture” underlying the processing of the AVI.
With respect to the definitions in the previous section, a tailoring has to be performed in order to adapt the generic vulnerability index to the reference context. Thus, for the sake of this analysis, the target is represented by the threat of drone intrusions in airports, which replaces the hazard concept in the previous section.
An exhaustive definition of the AVI shall address the quantification of a drone-intrusion exposure or drone-intrusion susceptibility of an airport, by breaking it down into the following components:
  • the drone-intrusion likelihood;
  • the drone-intrusion mitigation.
In this way, the following relationship shall hold for the AVI:
AVI = f P drone , M drone ,
wherein:
  • P drone is the likelihood function of a drone intrusion in the reference airport;
  • M drone is the mitigation function of a drone intrusion in the reference airport;
  • f is the combination function of the likelihood and the mitigation, and quantifies the exposure of the airport in regard to drone intrusions.
Given that the definition of a vulnerability index has to address the different vulnerability dimensions, both P drone and M drone may be expressed as a multidimensional combination of different functions, each one related to a single dimension. For example, the likelihood function may be modelled as:
P drone = g d soc , d econ , d ecol , ,
wherein the functions d soc , d econ , and d ecol represent multiple indicators to be used as dimensional influence variables for the AVI, each of which quantifies the influence of a given dimension of the airport’s context (e.g., social, economic, etc.) on the exposure with respect to drone intrusions. For example, d soc may address the influence of relevant social factors of the community around the airport, such as the presence of drone regulations and the average level of compliance to the regulations themselves. Instead, d econ may address the economic aspects related to the trends of drone market in the area.
In regard to M drone , this function quantifies the success likelihood of the available counter-drone systems/procedures of the airport in case of drone intrusion. In general, such systems and procedures rely on three main technical capabilities: the capability to detect, identify, and track a drone; the capability to assess whether a detected drone could cause a risk and decide the best mitigations to be undertaken; and the capability to mitigate a drone threat. For the latter capability, the expression “mitigate a drone threat” is intended as: (i) the neutralization of the intruder drone; and/or (ii) the execution of an operational procedure to reduce the impact of the drone intrusion (e.g., airport closure, halt of most critical operations, etc.). Clearly, the assessment of M drone requires data quantifying the efficiency of all three capabilities, as further discussed in Section 5 in regard to the ETA and in Section 6.1.3 in regard to the available data for the case study.
In the remainder of this section, the assessment of P drone is discussed. The previous work in [10] has validated the proposed definition of the AVI resorting to available public record databases about drone intrusions in airports. In detail, the online database of the federal aviation administration (FAA)—FAA UAS sighting reports [34]—has been used for the AVI validation. As prescribed by Equation (2), in addition to sighting data, some additional data are required to be used as dimensional influence variables, i.e., the economic-dimension influence, the social-dimension influence, etc. In this case, some public socio-economic data have been found to be useful for the validation in regard to the FAA reports: the population of the States in the USA, and the number of registered drones for each State in the USA. In this way, the AVI has been validated in terms of a function of socio-economic indicators (i.e., population and number of registered drones). The validation has considered only the likelihood function P drone , without the mitigation function M drone , since the available FAA reports directly show only information about the occurrences of drone sightings, whereas they do not show information about the impacts and the mitigation actions in regards to the airports.
Thus, an estimator P ^ drone of the function P drone has been achieved in [10] by means of the following expression:
P ^ drone | State = s = g p | State = s , n reg _ drones | State = s ,
wherein:
  • s is the reference State;
  • P ^ drone | State = s is the estimator of the number of drone intrusions for the airports in the reference State s ;
  • p | State = s is the population of the reference State s ;
  • n reg _ drones | State = s is the number of officially registered drones in the reference State s .
The stated definition of P drone in (2), jointly with the proposed evaluation of the estimator P ^ drone | State = s in (3), sets a modelling framework for the drone-intrusion likelihood as a part of the drone-intrusion exposure. More generally, it also contributes to the risk assessment of drone intrusions in airports. In fact, a risk R may be expressed as the product of the occurrence probability P of a feared event and the impact I of such occurrence, i.e.:
R = P I .
In the case of airport drone intrusion, the probability P coincides with the likelihood function P drone . Hence, the proposed modelling framework provides a possible input estimation for the probability of the threat scenario within the risk assessment of drone intrusions in airports, as addressed in Section 5 and Section 6.3.
Finally, the estimator P ^ drone | State = s has been modelled over a yearly time horizon for the FAA data, i.e.:
P ^ drone y | State = s = g p | State = s ,   year = y , n reg _ drones | State = s ,   year = y ,
wherein:
  • y is the reference year;
  • P ^ drone y | State = s , p | State = s ,   year = y , and n reg _ drones | State = s ,   year = y , respectively, represent the yearly estimated number of airport drone intrusions, the population and the number of registered drones in the State s for the year y .
To check the effectiveness of this modelling framework, the function P ^ drone y | State = s function has been designed with a quadratic-polynomial structure, i.e.:
P ^ drone y | State = s = a 1 x 2 + a 2 x + a 3 ,
wherein a 1 , a 2 , and a 3 are the fitting real coefficients, and x is the population p | State = s ,   year = y or the number of registered drones n reg _ drones | State = s ,   year = y in the State s for the year y . As an example, this structure has been tested with 2020 FAA’s data in order to provide the following potential models:
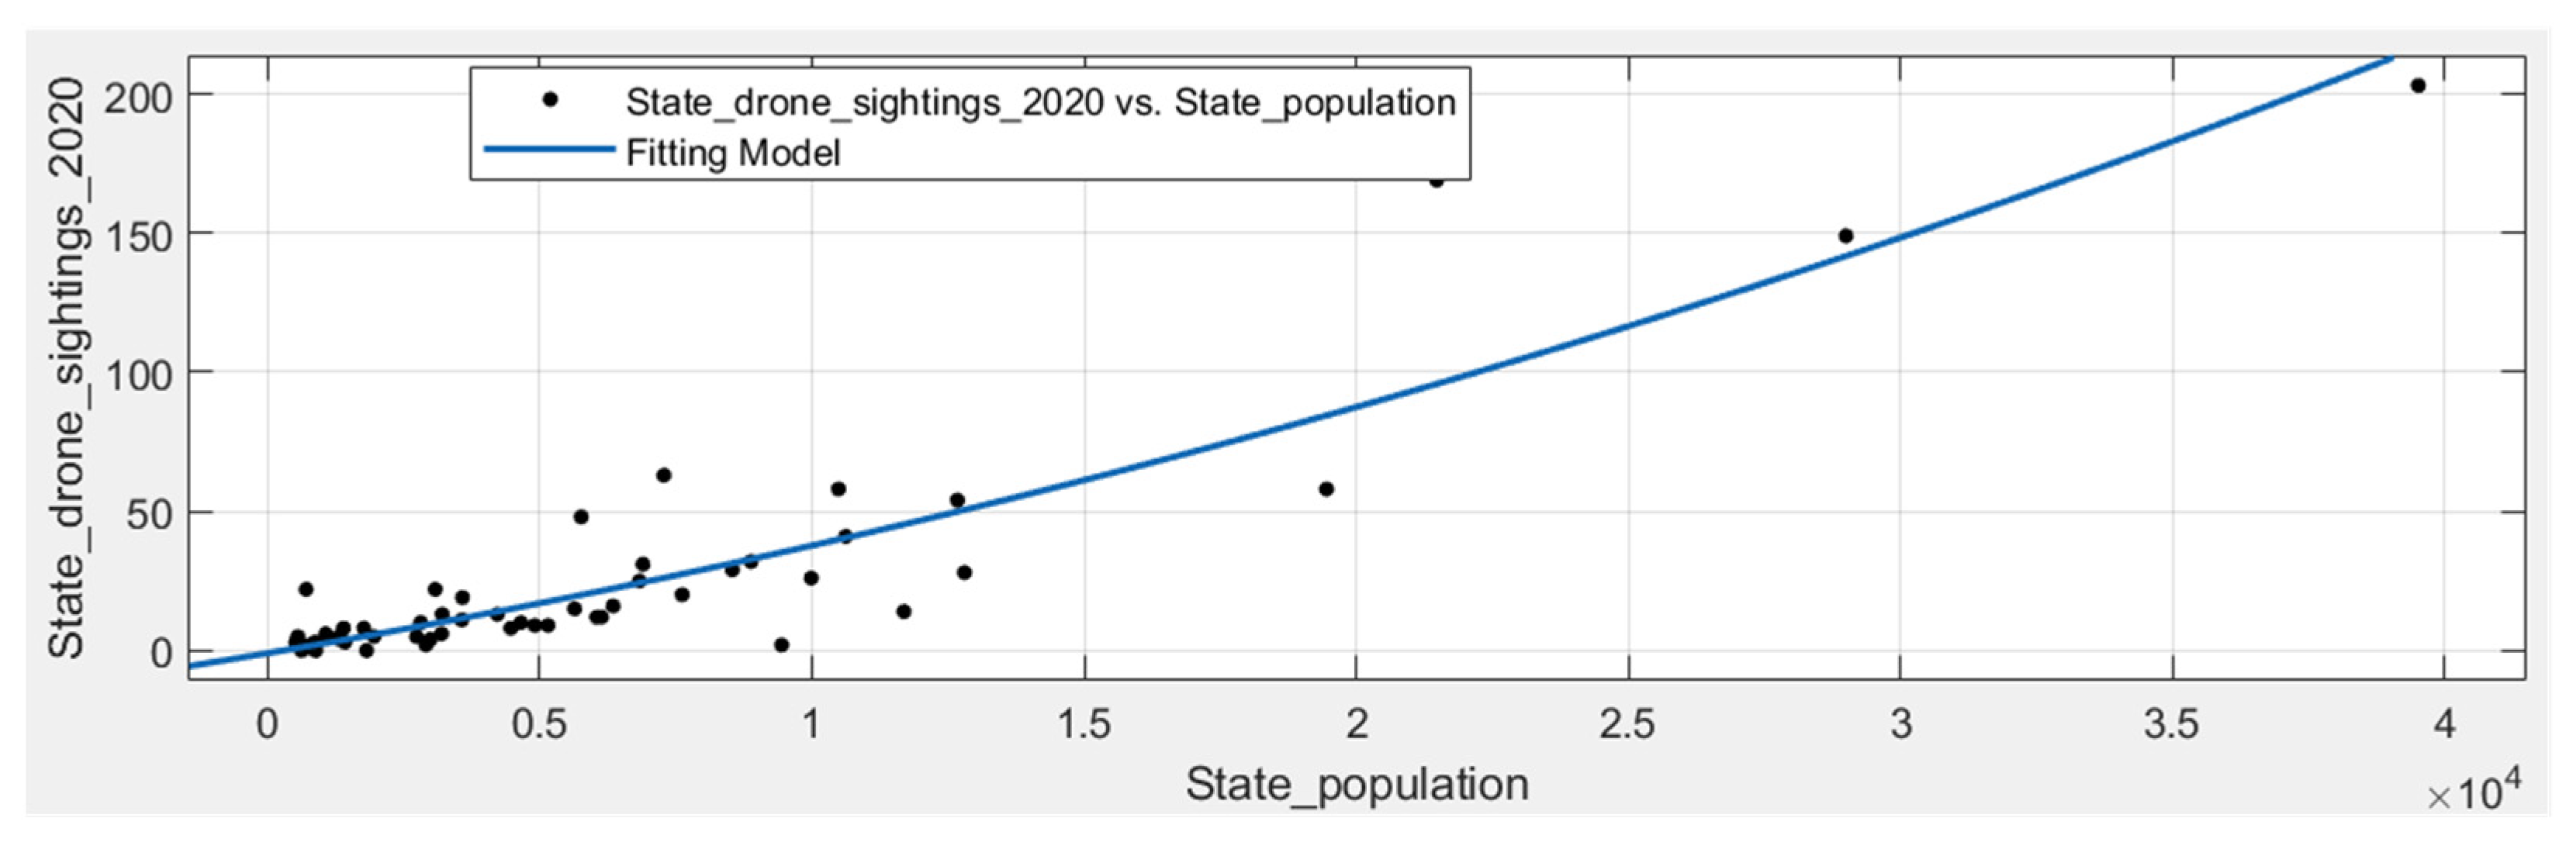
  • the correlation fitting between the population and the number of drone sightings in 2020 for each FAA’s State;
  • the correlation fitting between the number of registered drones and the number of drone sightings in 2020 for each FAA’s State.
For the first model (correlation fitting between the population and the number of drone sightings in 2020), the following coefficients have been determined by means of the curve fitting toolbox of MATLAB (Matrix Laboratory), and using the available data for by state FAA populations and drone intrusions in 2020:
  • a 1 = 5.559 × 10 8 ;
  • a 2 = 0.00331 ;
  • a 3 = 0.9511 .
Figure 2 shows the model in (6) and drawn with the aforementioned coefficients, comparing it with the observed outcomes (i.e., the real number of drone intrusions in 2020 for each FAA State). Moreover, the accuracy of the model has been assessed by means of the coefficient of determination R 2 , which is a statistical measurement quantifying the accuracy of a model in predicting or explaining an outcome. More precisely, this coefficient assesses how well a model replicates the observed outcomes by measuring the percentage of variability within the dependent variable that is explained by the modelled function of the independent variable. In detail, R 2 is 0.8478 for the achieved model, meaning the estimator P ^ drone y | State = s in (6) explains about the 85% of the variance of the dependent variable (the yearly number of drone sightings in the State s for the year y ) as a function of the independent variable (the population of the State s for the year y ).
The results of the proposed fitting model suggest that:
  • an estimator P ^ drone y | State = s according to the population is reasonable and effective to assess the yearly number of a drone intrusions in the airports of a given State;
  • the population p may be considered as a proper influence variable in regard to the drone-intrusion likelihood and the drone-intrusion exposure.
Indeed, the population is related to the geographical position of an airport and represents an index of the social context of the airport’s proximity region. Thus, the population determines an airport socio-geographical vulnerability index for drone intrusions.
The previous work in [10] provides similar validation results for an alternative estimator P ^ drone y | State = s as a function of the number of registered drones in the State s for the year y . This estimator has achieved even a greater R 2 value (0.8821), confirming that also the number of registered drones is an influence variable for the drone-intrusion likelihood and the drone-intrusion exposure. Such influence variable is related to the economic context of the airport’s proximity region, determining an airport socio-economic vulnerability index for drone intrusions.
Note that the analysis has been performed at an aggregated State-level (and not at a local level for the single airports) since the available socio-economic indexes (population and number of registered drones) refer to a geographical State scale. Of course, different geographical scales (e.g., regions, metropolitan areas, cities, etc.) may be adopted to model the drone-intrusion likelihood of different conglomerates of airports (e.g., local airports in a region, single airports, etc.). In fact, the proposed modelling framework may be tailored according to the scales of the available data for the reference variables.

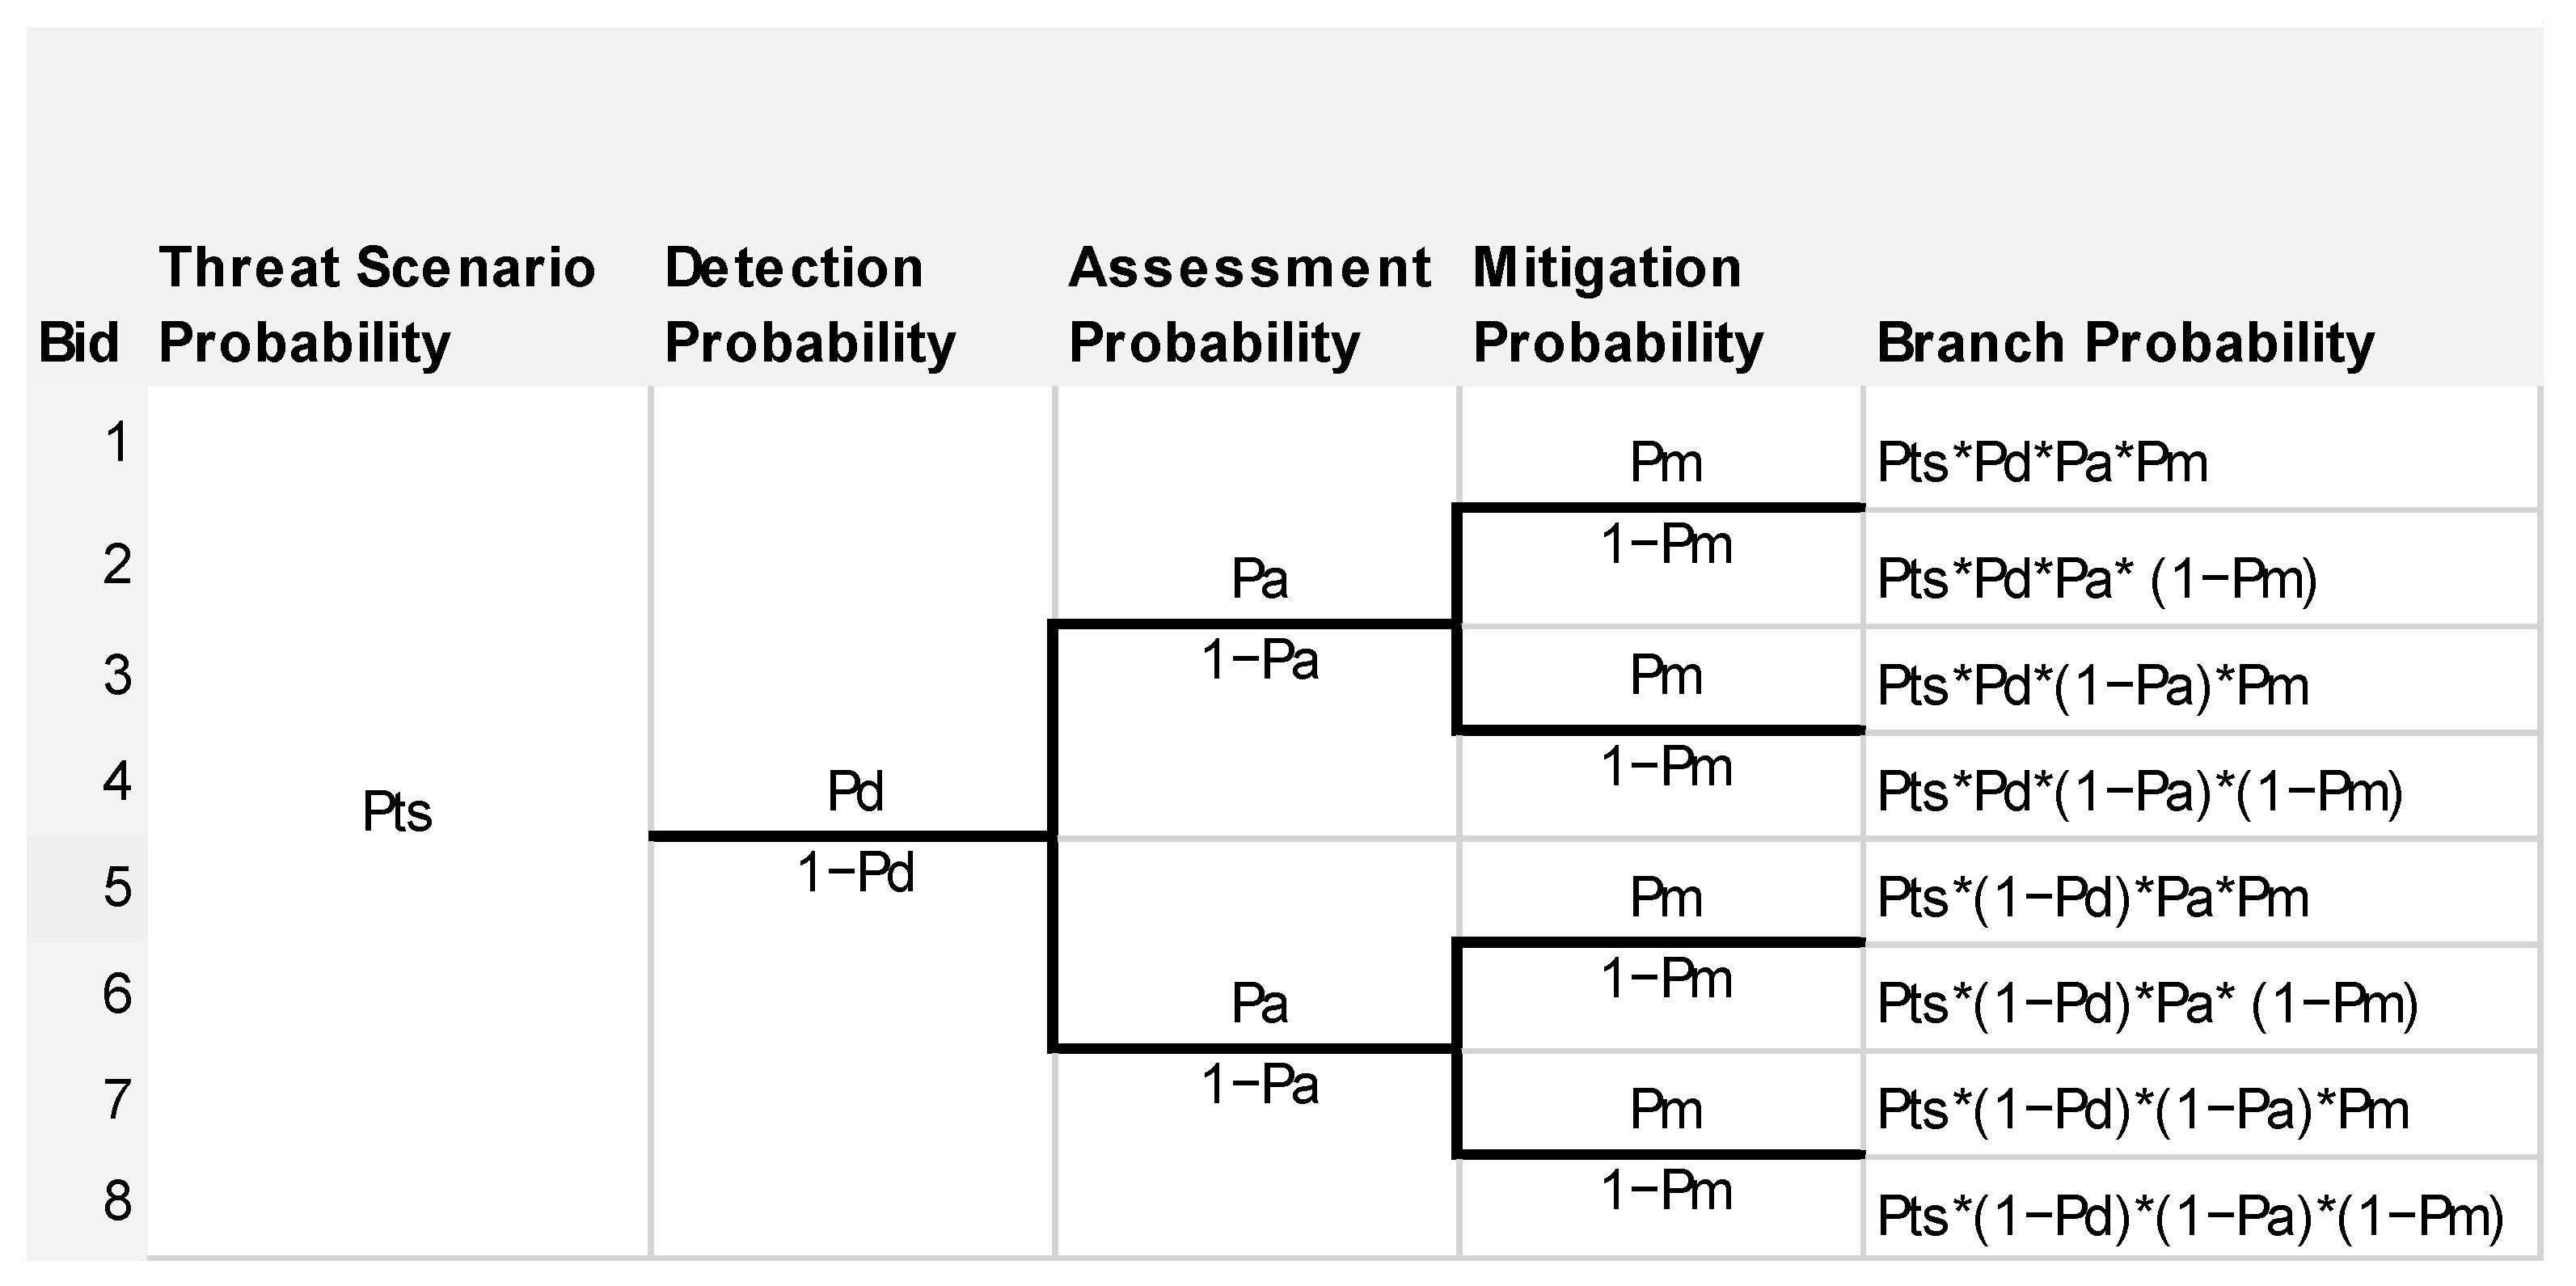
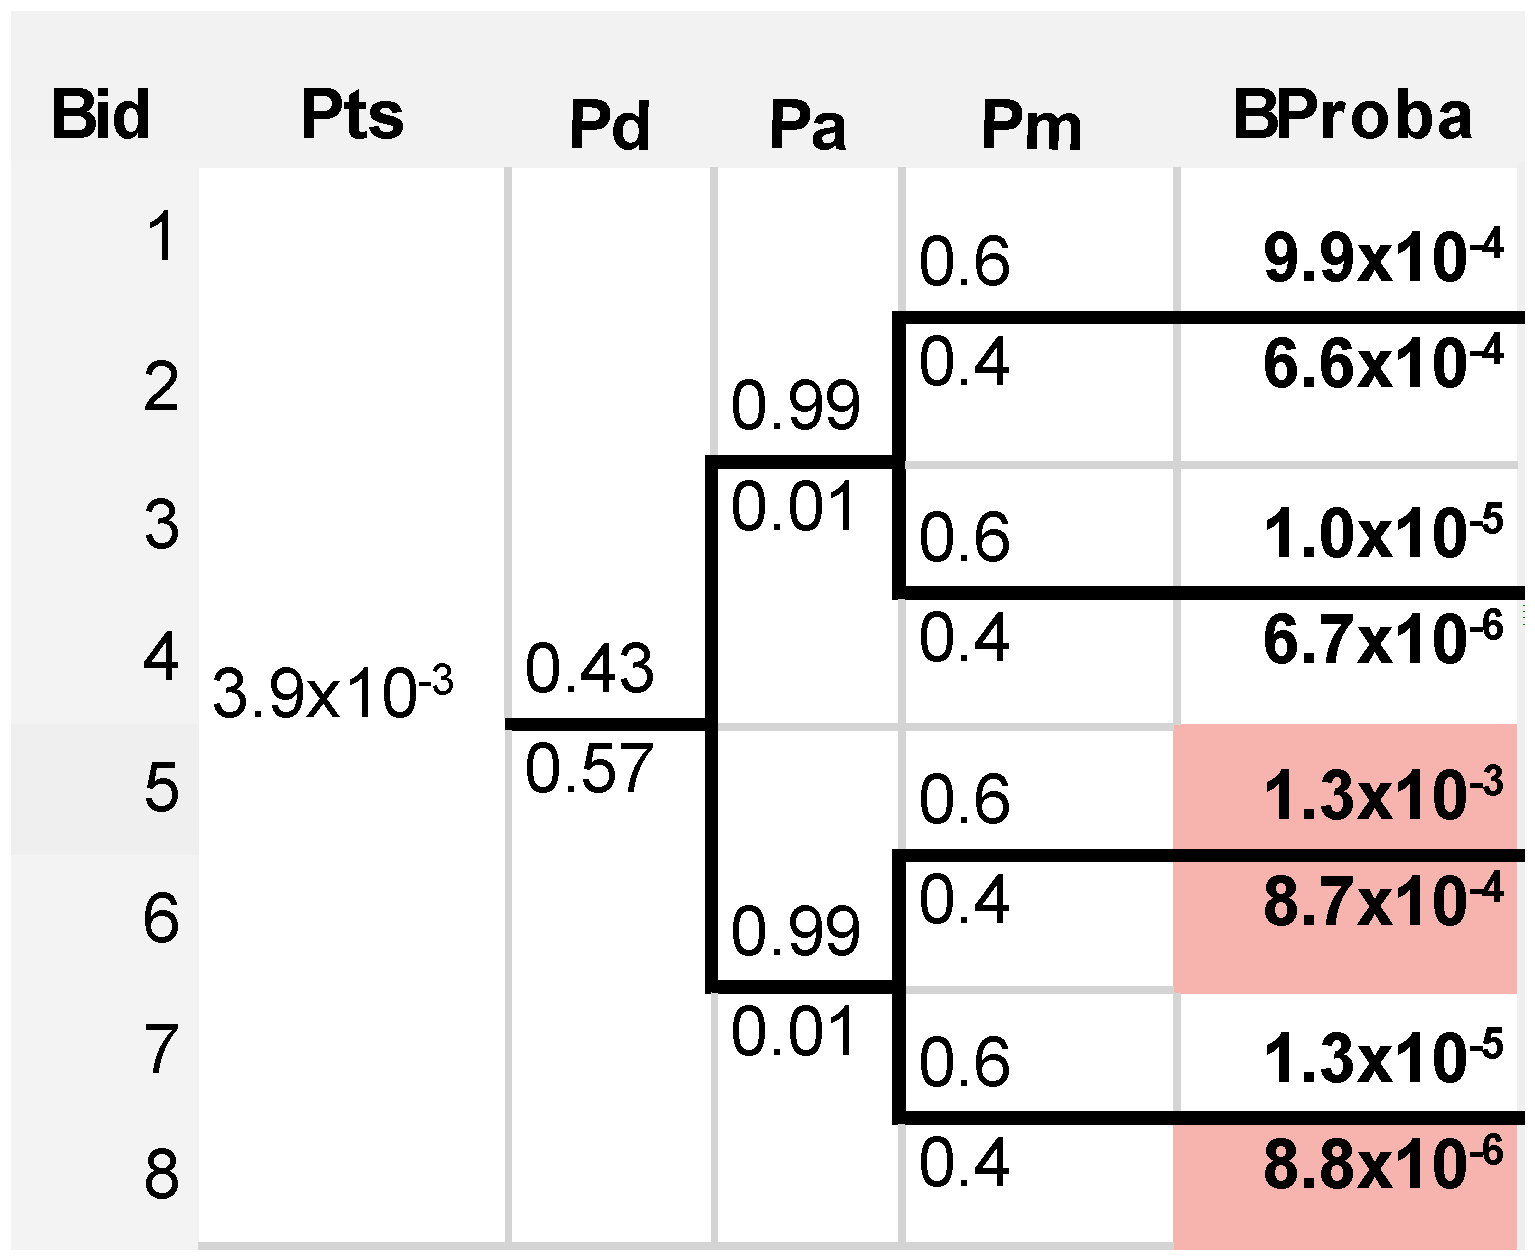
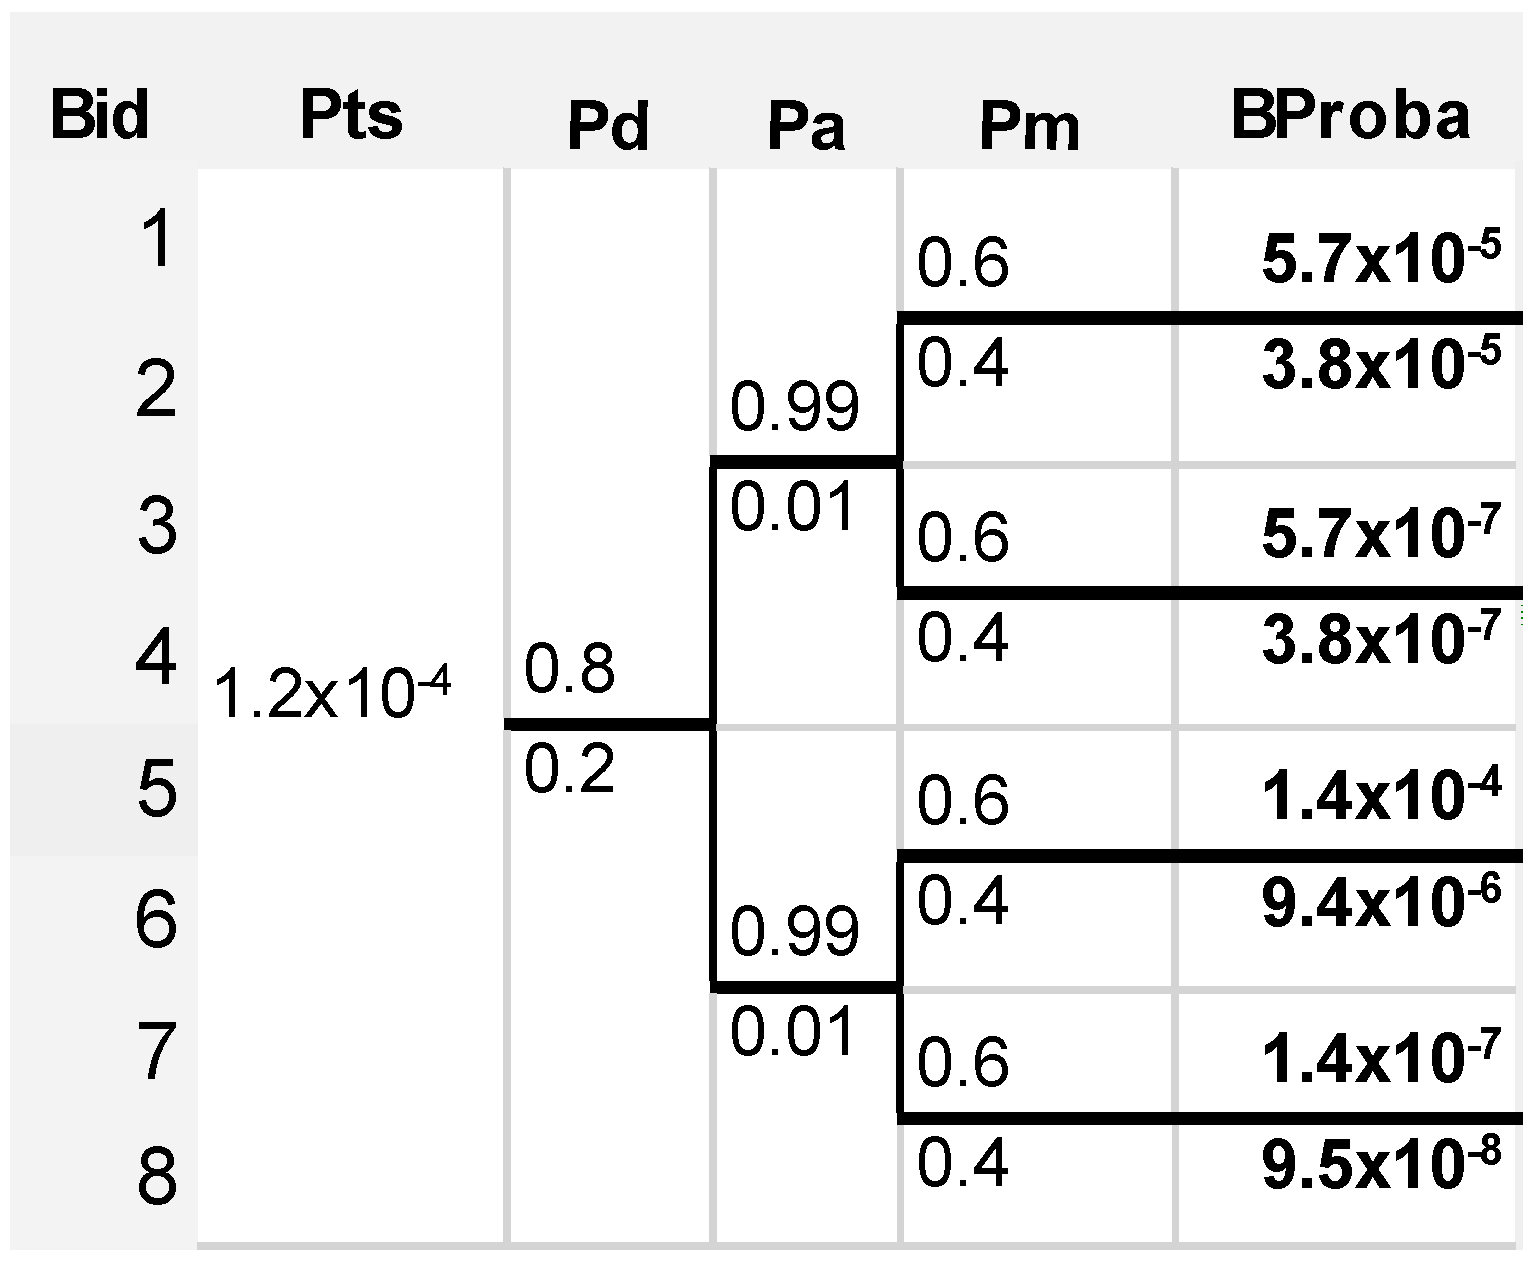
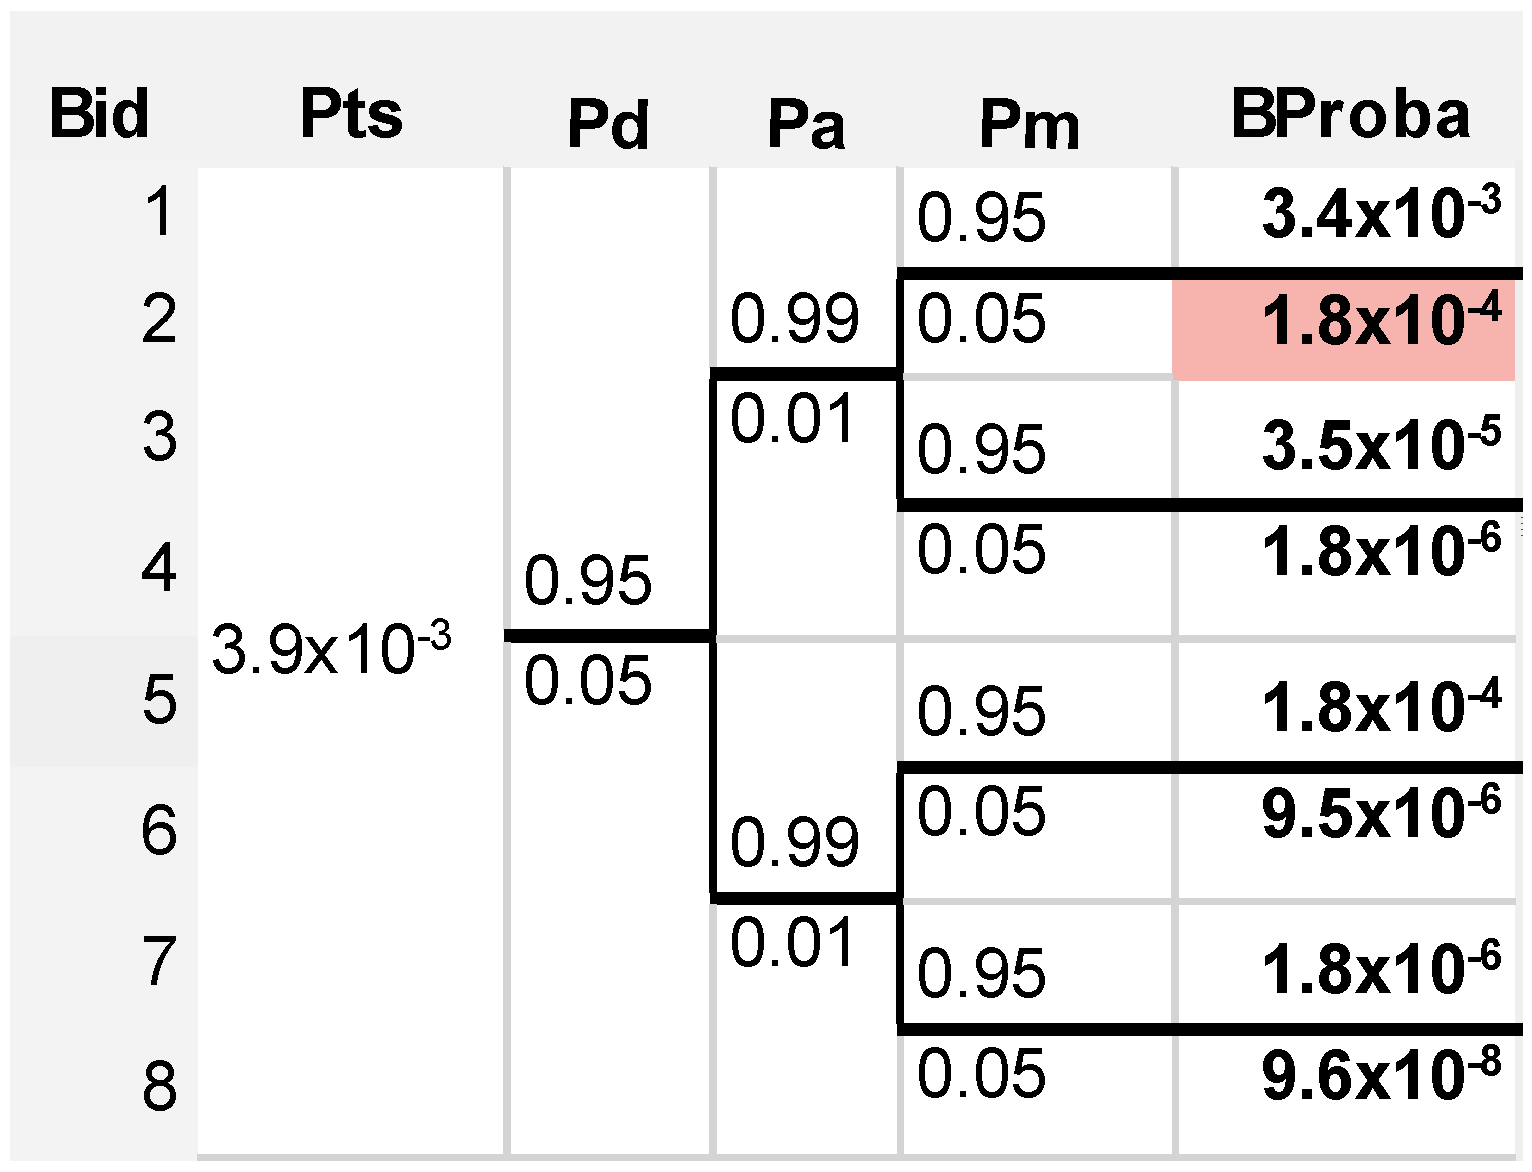
5. Event Tree Analysis

ETA provides a qualitative and quantitative analysis of drone intrusions in or near an airport.
The table in Figure 3 describes the qualitative view of the event tree for drone intrusion assessments. The table is composed of the following columns:
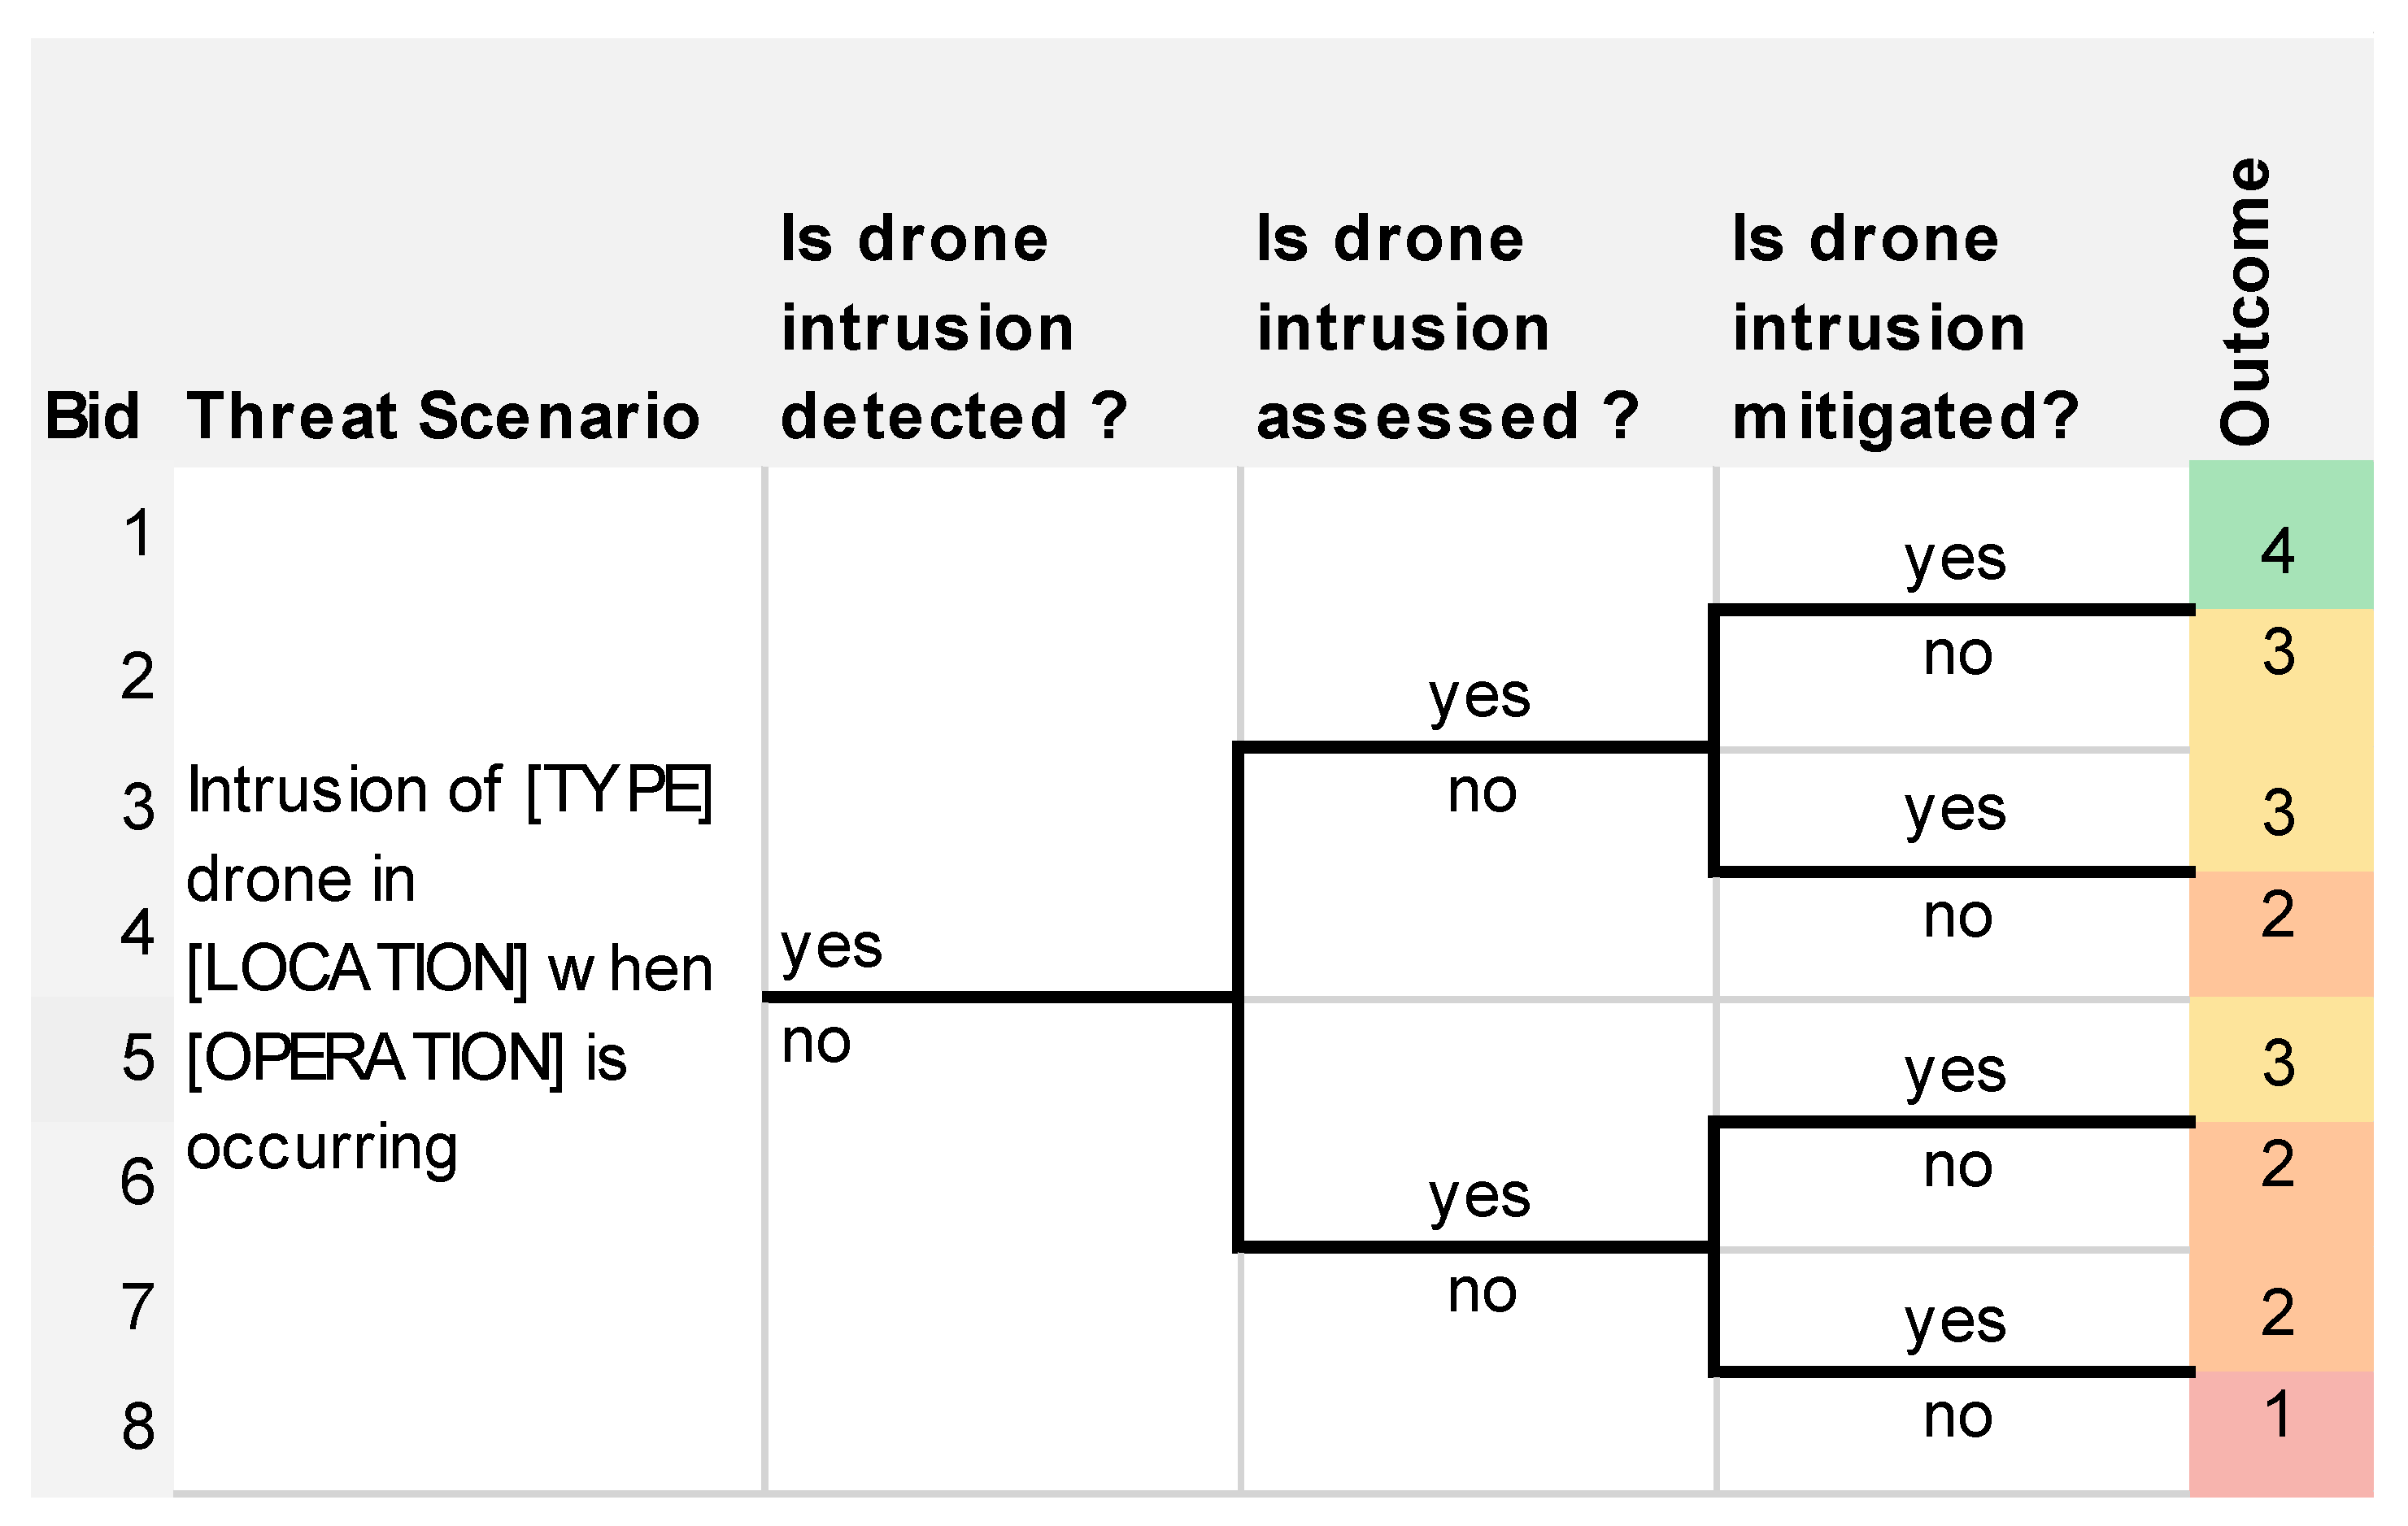
  • “Threat scenario”. The second column of the table describes the threat scenario that is analyzed: the TYPE of drones refers to authorized, off-nominal, or unauthorized drone operations; LOCATION refers to a specific place in or near the airport such as the runway, the taxiway, the departure, or arrival paths; and OPERATION refers to the affected airport operation by the intrusion such as aircraft landing, aircraft taxi, aircraft passenger boarding, etc.
  • “Is drone intrusion detected?”, “Is drone intrusion assessed?”, “Is drone intrusion mitigated?”. The three following columns describe the answers to questions about the efficiency of the three main technical capabilities of a system protecting airport against drones: the capability to detect, identify, and track a drone; the capability to assess whether a detected drone could cause a risk and decide the best mitigations to be undertaken; and the capability to mitigate a drone threat.
  • “Bid”. The first column provides branch identifiers. Branch 1 describes a best-case situation where all three technical capabilities efficiently manage the drone intrusion whereas branch 8 is the worst-case situation where none of three technical capabilities are working efficiently. In the latter case, only non-technical means could be used to protect the airport against drones.
  • “Outcome”. The last column describes the safety and operational outcome of the branch.
For the outcome, we use the following index ranging from one to five to describe the possible outcomes of a drone intrusion:
  • Outcome 1. The threat scenario causes a catastrophic safety effect or a severe interruption to airport operations.
  • Outcome 2. The threat scenario causes a hazardous safety effect as severe injuries or a major interruption to airport operations.
  • Outcome 3. The threat scenario causes a major safety effect as light injuries or a moderate interruption to airport operations.
  • Outcome 4. The threat scenario causes a minor safety effect as passenger discomfort or a small interruption to airport operations.
  • Outcome 5. The threat scenario does not affect safety or the airport operations.
Note that the aforementioned classification is just an example. The exact definition of the quantitative criteria for each outcome (e.g., the reference number of delayed or interrupted operations to classify the outcome as a severe, major, moderate, and small interruption) may depend on a local risk assessment of the specific airport.
In Figure 3, Branch 1 represents the best-case scenario where all technical means are efficient in that case we consider that its safety and operational outcome is minor. Partially-degraded situations in Branches 2, 3, and 5 include the loss of efficiency of only one capability. We consider that their safety and operational outcome is major (3). Branches 4, 6, and 7 represent more degraded scenarios, where two out of the three capabilities are not efficient. We consider that they have a hazardous outcome. Finally, branch 8 describes the worst-case situation having a catastrophic outcome.
Instead, Figure 4 illustrates the table for the quantitative view of the event tree. The last column, labelled “Branch Probability”, contains the probability of the 8 branches. The probability is computed using:
  • Pts 
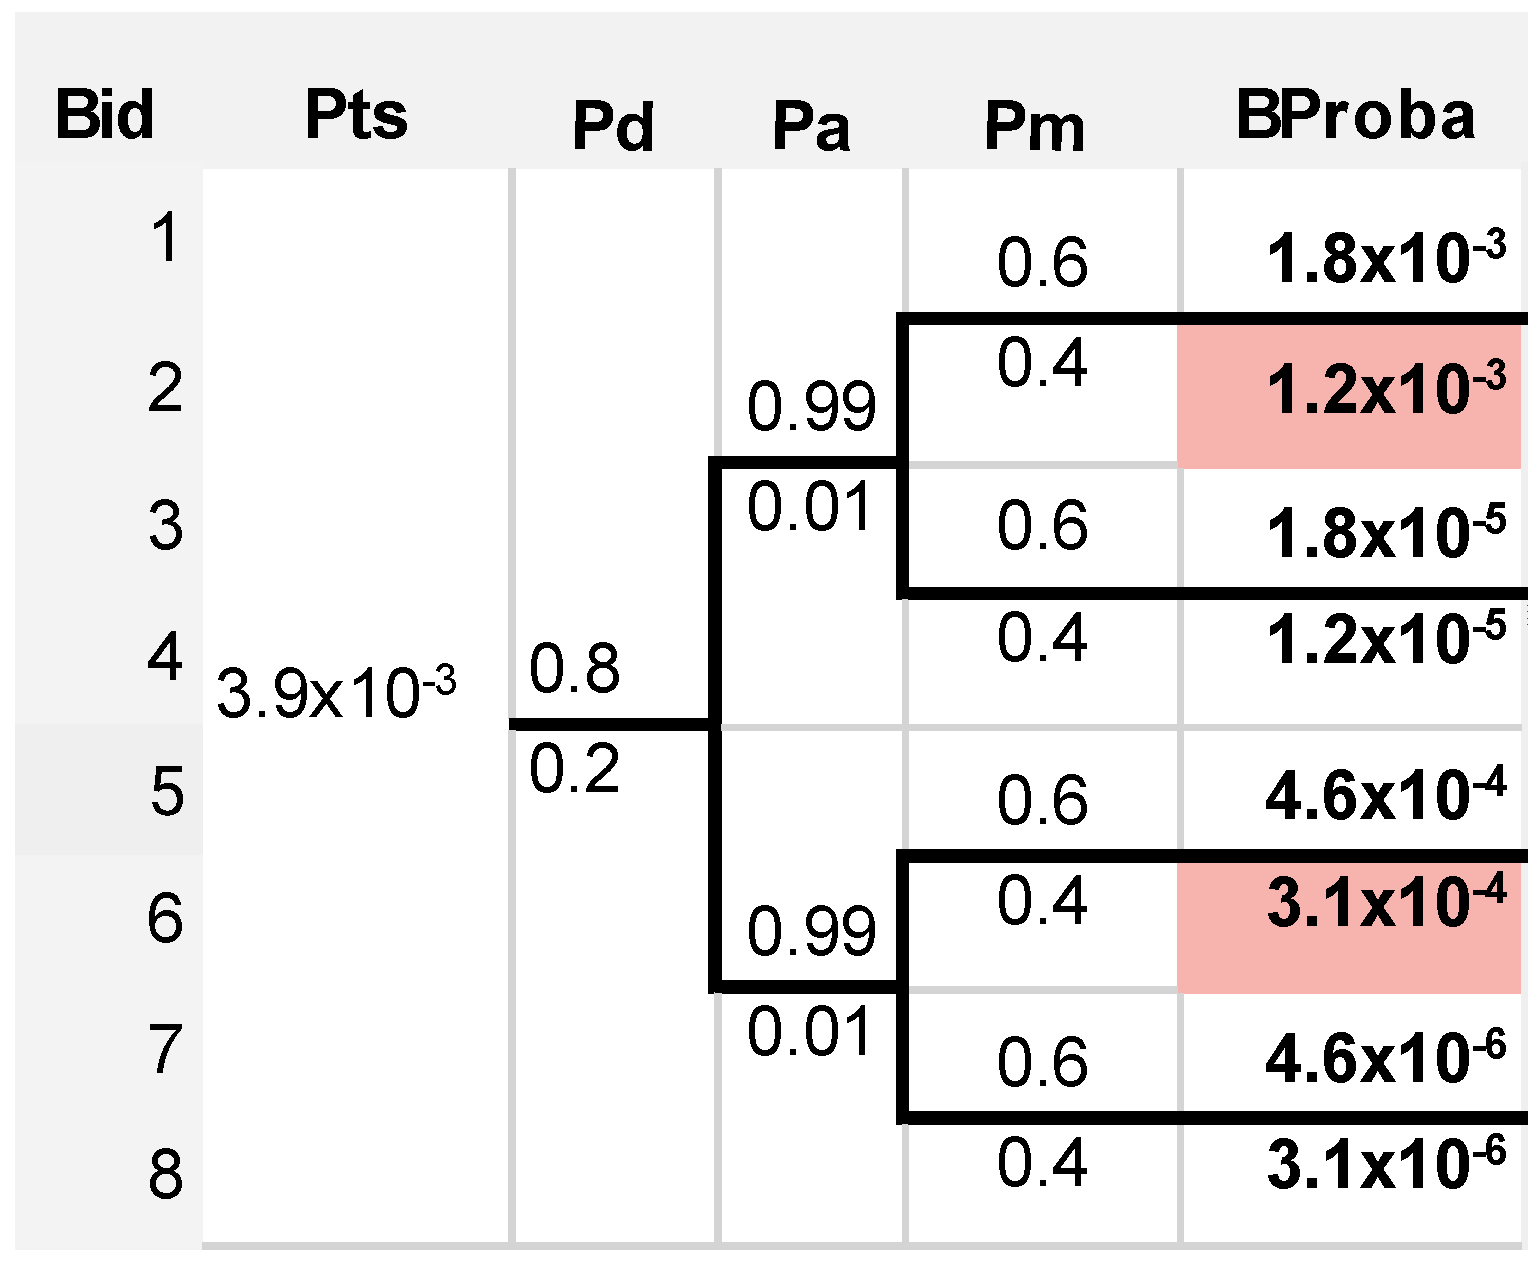
, the probability of the threat scenario;
  • Pd , the probability of efficient detection (or 1 Pd , the probability of non-efficient detection);
  • Pa , the probability of efficient assessment (or 1 Pa , the probability of non-efficient assessment);
  • Pm , the probability of efficient mitigation (or 1 Pm , the probability of non-efficient mitigation).
Once a branch probability is computed, it is compared with the target probability of its safety and operational outcome. The branch is considered to be unacceptable whenever its probability is greater than the target probability with respect to the safety and operational outcome.
In this paper, we have used the following target probabilities: 5 × 10⁻³ for a branch whose outcome is 4; 5 × 10⁻⁴ for a branch whose outcome is 3; 5 × 10⁻⁵ for a branch whose outcome is 2; and 5 × 10⁻⁶ for a branch whose outcome is 1. These values are the same of other typical feared events for airport operations, e.g., “thunderstorm close to the airport” [35].
Additionally, this approach enables a reverse reasoning to allocate the reliability to the technical means for detection, assessment, and mitigation.

6. Case Study

This section describes the achieved results of the case study about the proposed methodological framework for the risk assessment of airport drone intrusion.
In detail, Milan Malpensa airport has been chosen as the reference airport for the case study. The ICAO (International Civil Aviation Organization) airport code is LIMC. It has been considered a proper reference airport for this study because it is of medium complexity in the context of European airports.
The airport is located 49 km from central Milan, has two passenger terminals as well as a dedicated cargo terminal. It presents two runways in a parallel configuration with various taxiways connecting these with the aforementioned terminals and other airside areas, as shown in Figure 5.
Lastly, for the case study, the following threat scenario has been used as a reference for the risk assessment by means of the ETA: “intrusion of a drone in the departure path of the runways at LIMC”.

6.1. Available Data

This section describes the input data that have been used for the assessment within the case study. We have identified the available data sources and processing methods in order to compute the various elements that have to be detailed in order to: (i) evaluate the AVI of LIMC for a given timeframe; (ii) build the event trees for risk assessment with respect to the reference threat scenario.

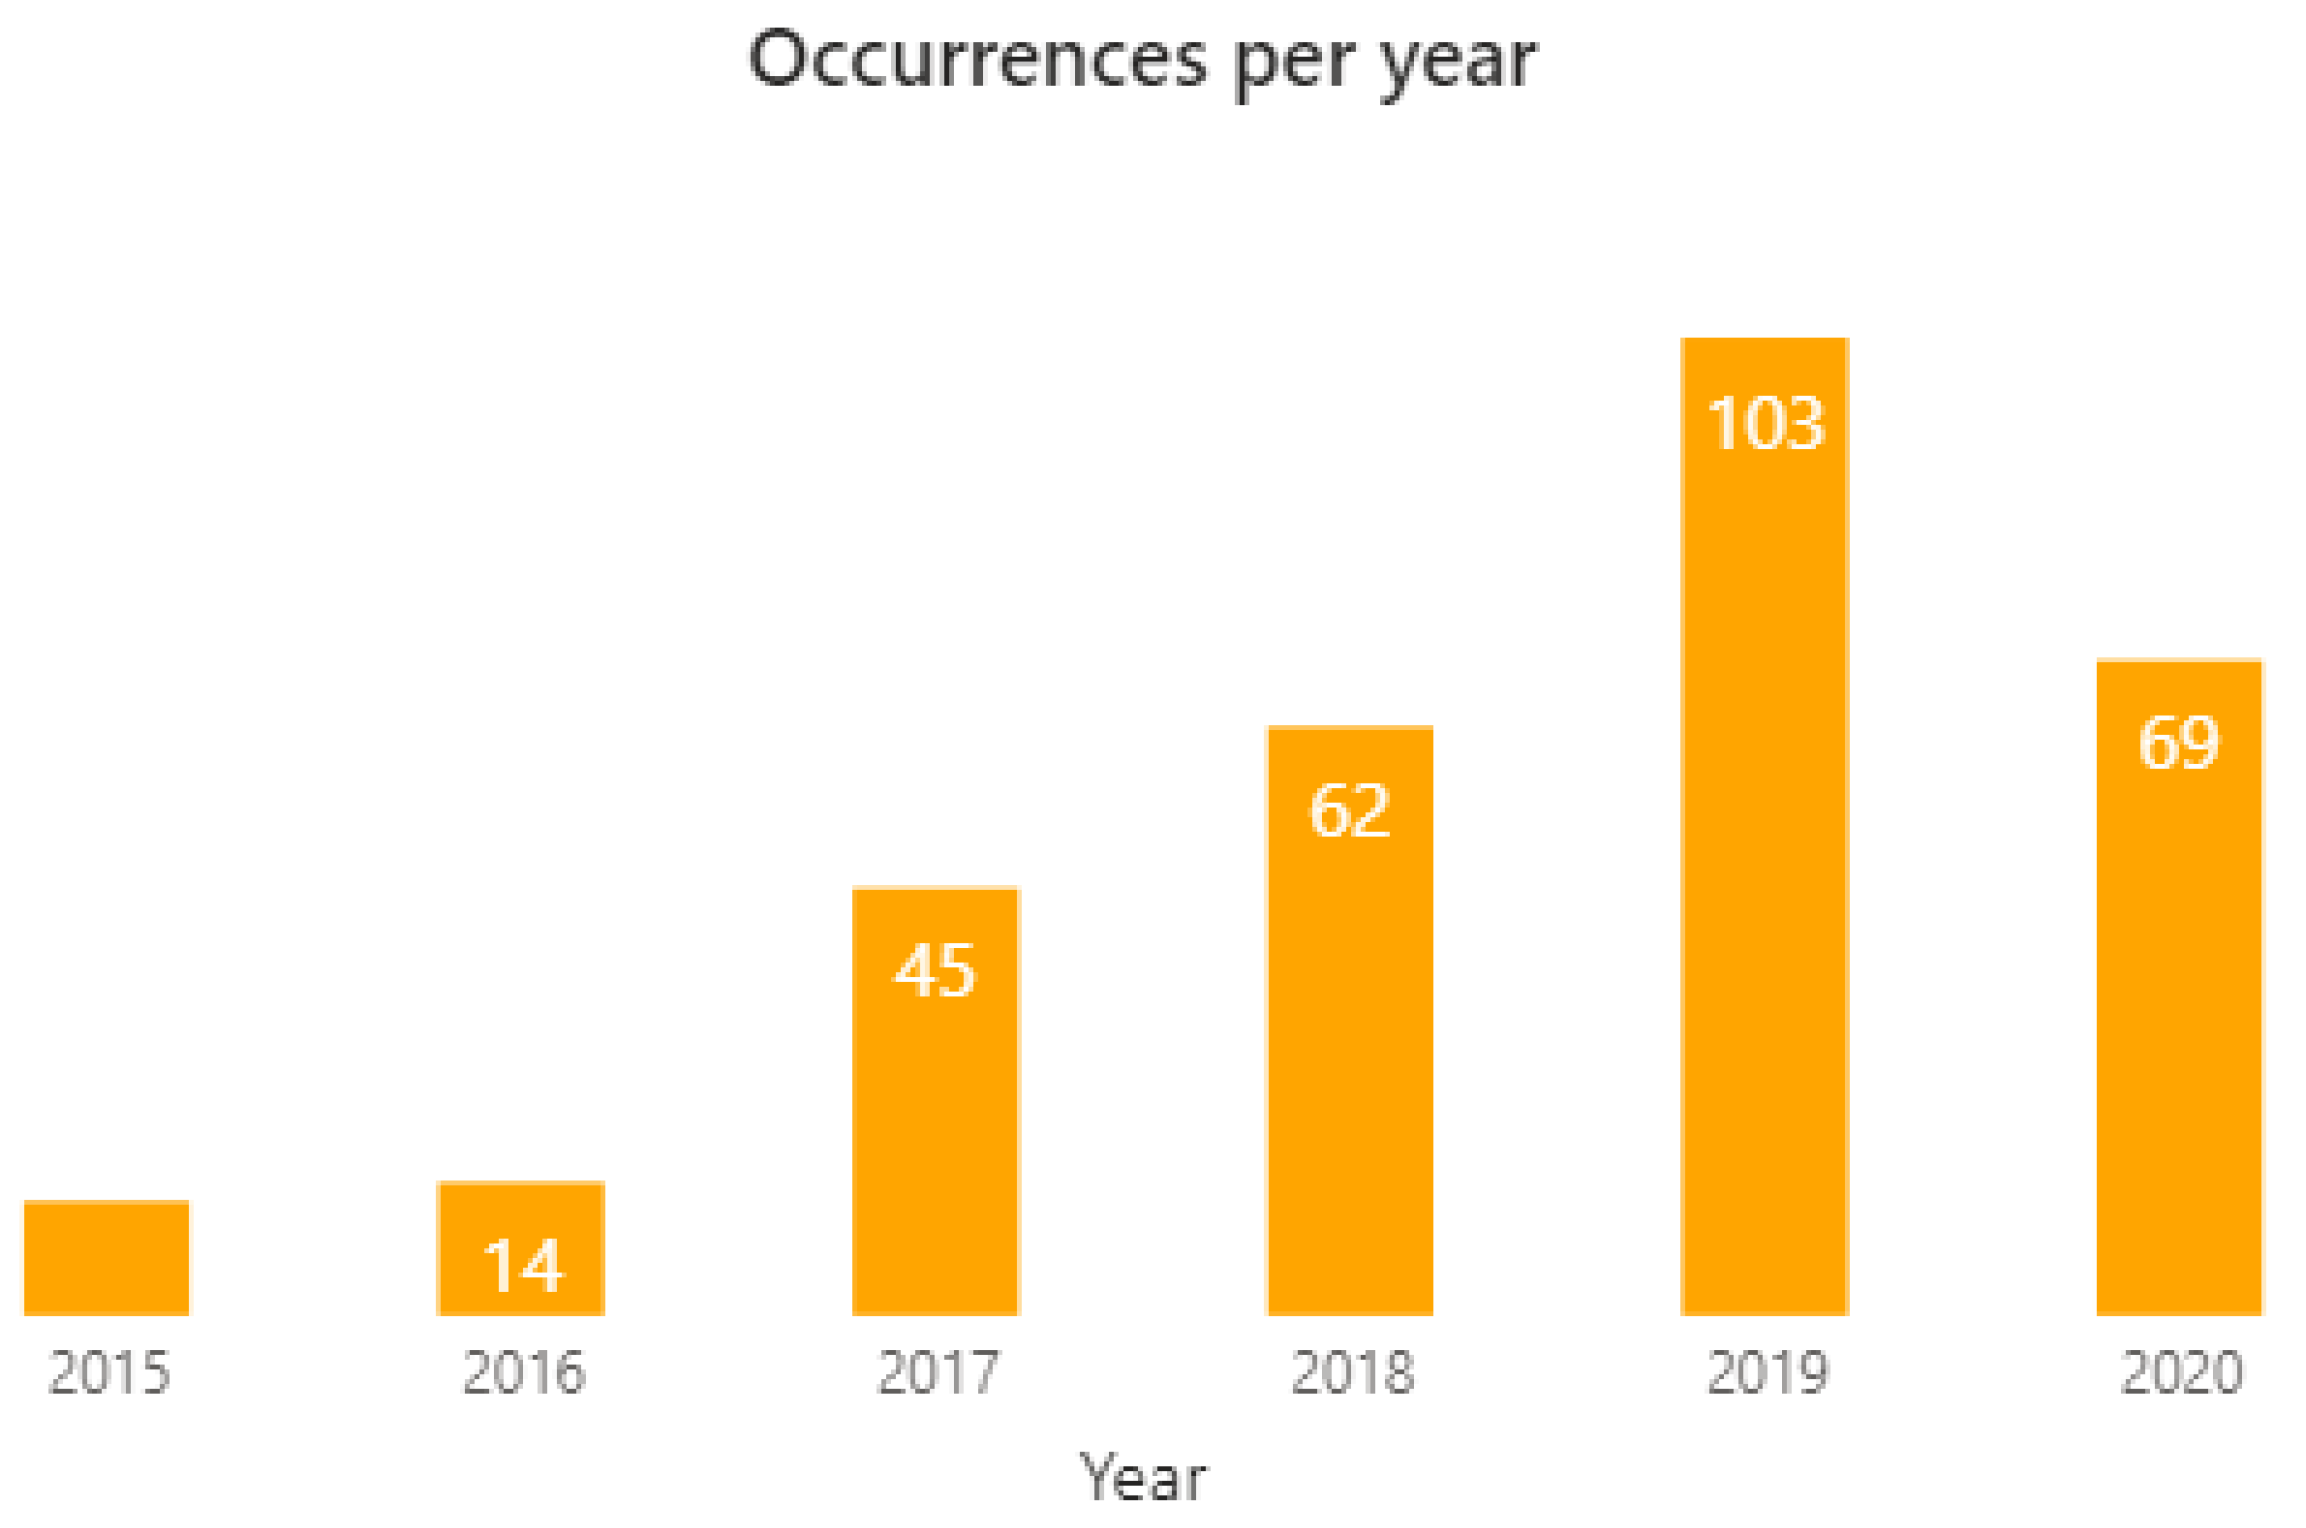
6.1.1. Drone Intrusion Data

The data presented in this section have been provided by courtesy of the Italian Aviation Authority, ENAC (Ente Nazionale per l’Aviazione Civile).
Drone intrusions in Italian airports are classified as “interferences of APR (Aeromobili a Pilotaggio Remoto, remotely piloted aircraft) with manned a/c during take-off or landing”. The following data have been made available in regard to drone-intrusion statistics in Italy:
  • yearly number of drone intrusions in Italian airports (Figure 6);
  • yearly number of airport movements in Italy (Figure 7);
  • frequency rate of the yearly number of drone intrusions in Italian airports, by normalizing such number with respect to 10,000 movements in Italian airports (Figure 8).
All the data are related to the period 2015–2020.
Moreover, the total number of registered drone operators in Italy was 50,587 in 2021. A qualitative adopted estimation for the number of APRs in Italy is achieved by multiplying the number of registered drone operators by 1.5 ÷ 2.

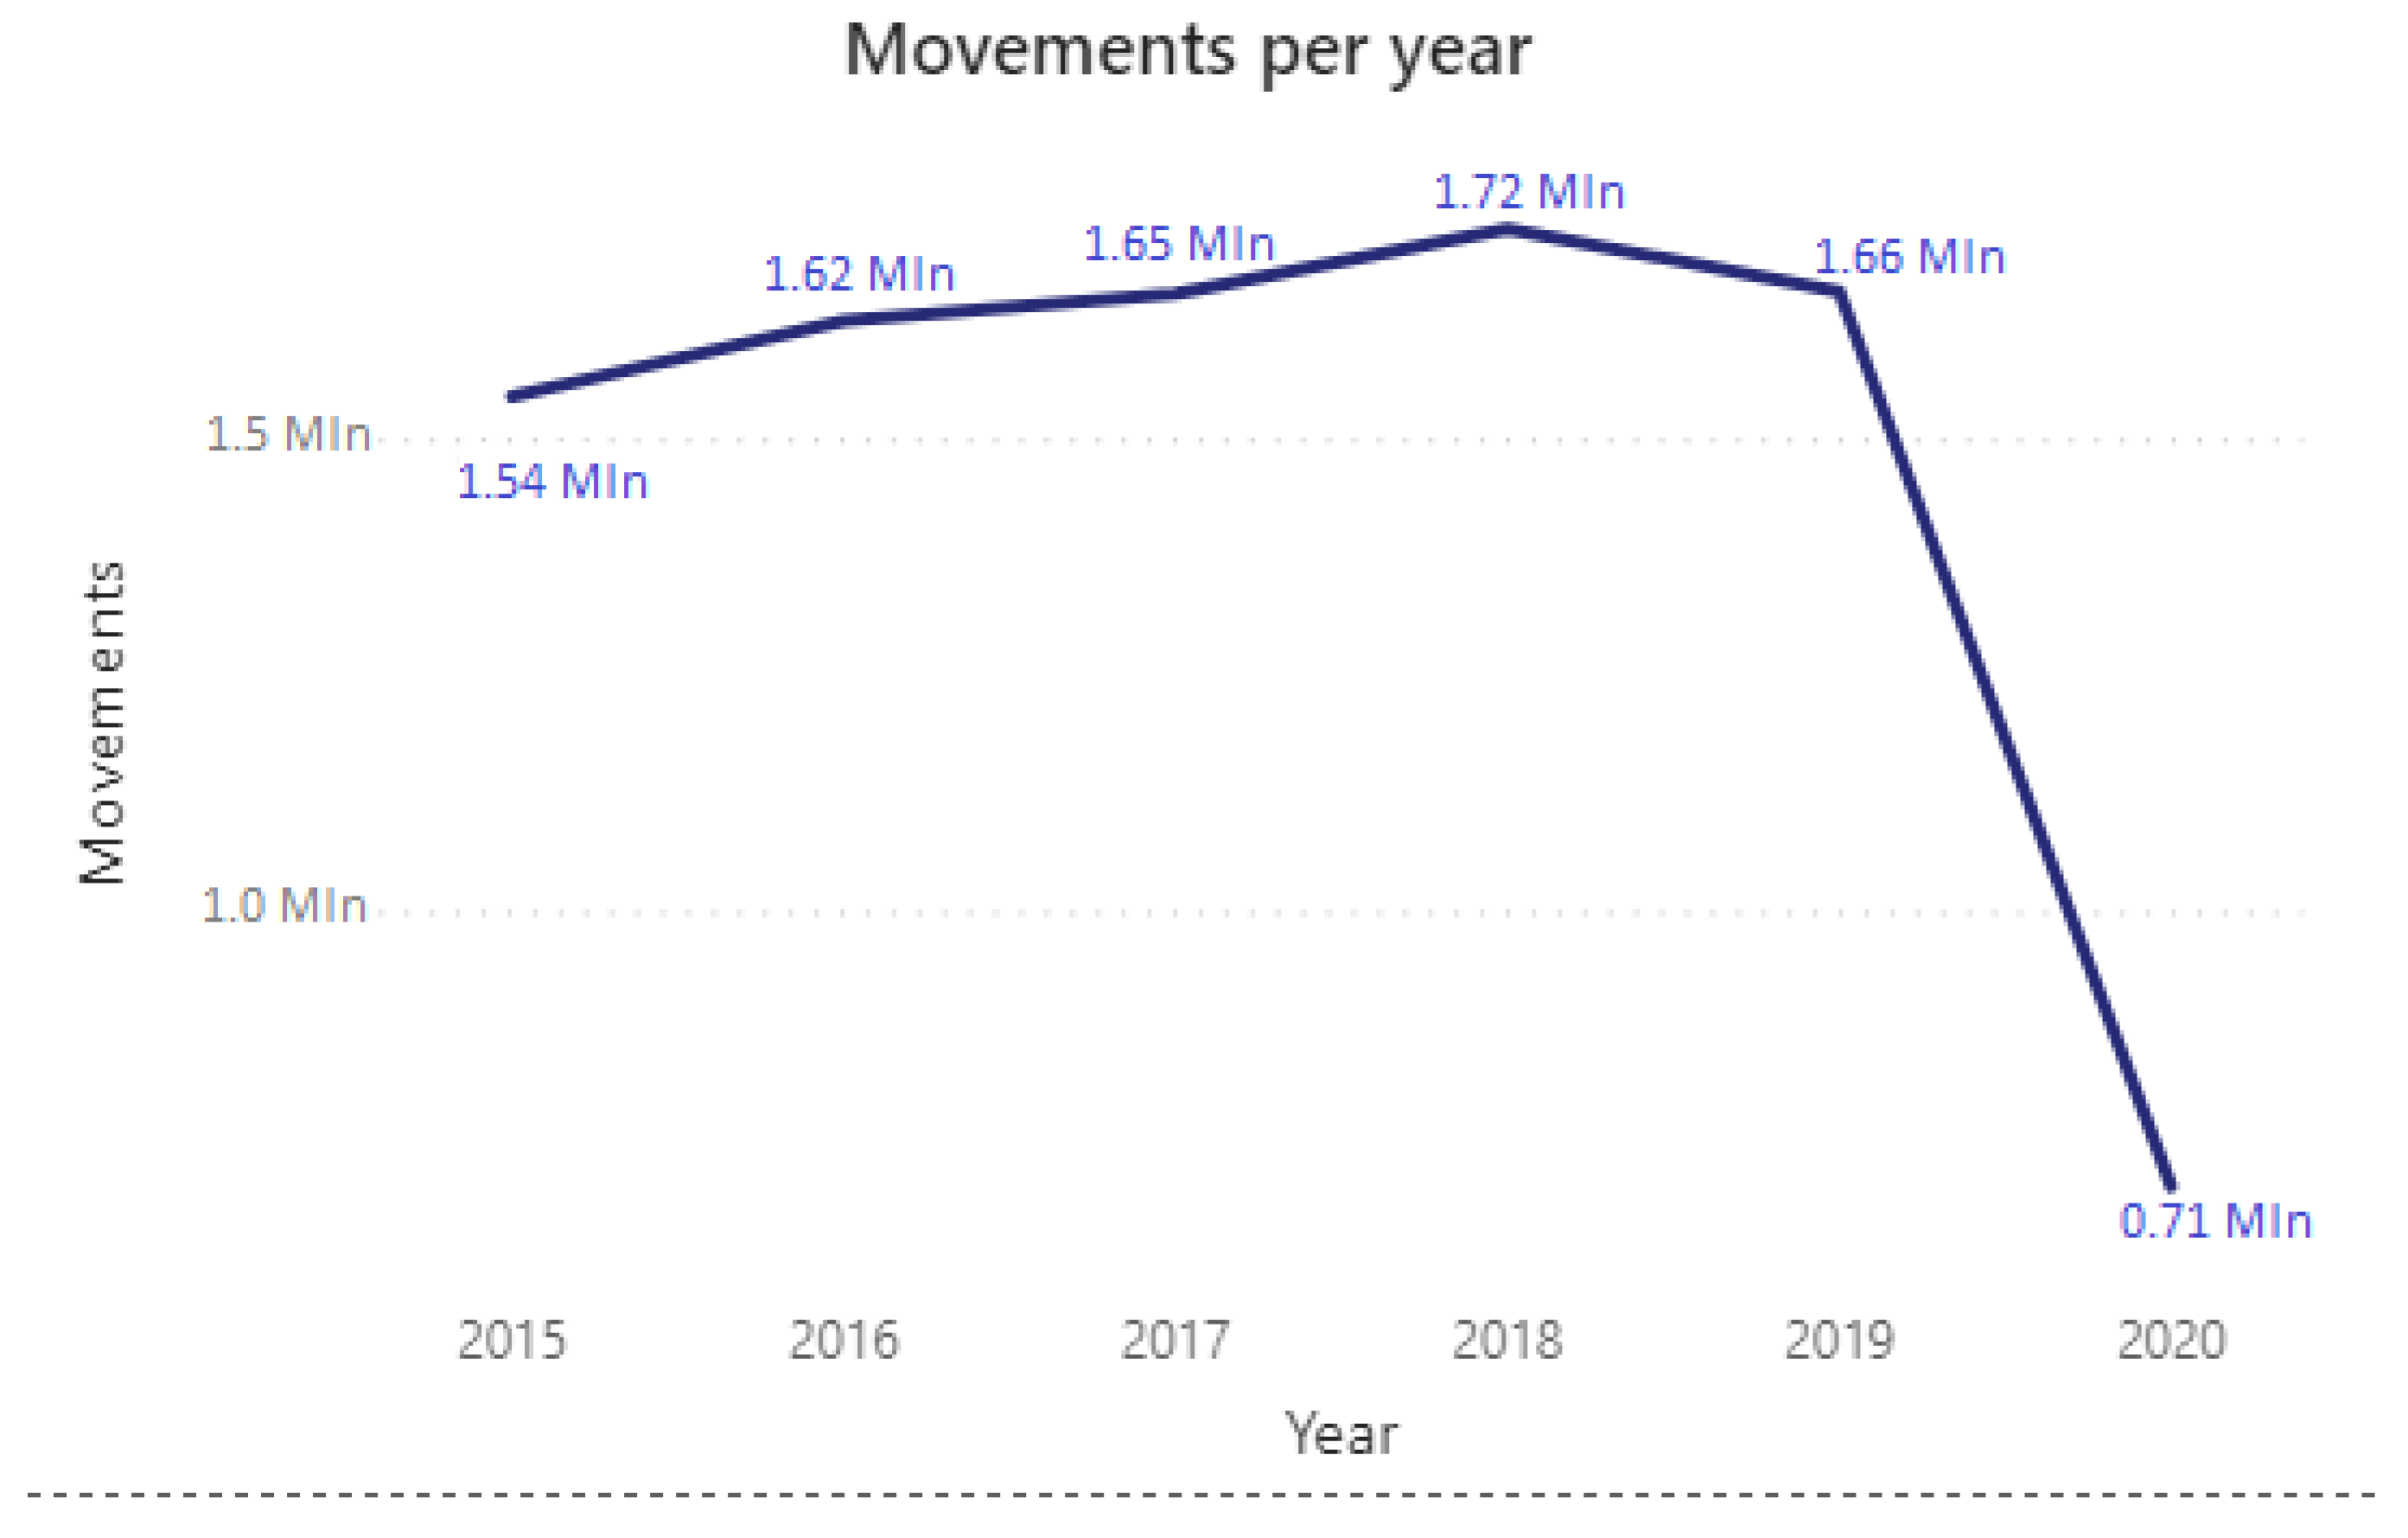
6.1.2. Airport Movement Data

The probability of the threat scenario used in the event tree is based on the AVI of LIMC, but it has to consider also the occupancy rate of the airport for the various departure paths.
The Airport Corner website of EUROCONTROL [36] provides data about airport movements and runway occupancy for European airports, including LIMC. Moreover, data refer to the frequency of runway configuration usage. At Malpensa, four runway configurations are used. Three configurations involving departures on runway 35L or 35R, which are used about 97% of the time. The remaining runway configuration with departures on runway 17R is used 3% of the time.
Consequently, we could specialize the event tree with two cases: one for intrusion in the 35L or 35R departure path, and the second one dealing with intrusion in the 17R or 17L departure path.

6.1.3. Data about the Efficiency of Technical Means

Data about the efficiency of technical means for threat detection, assessment, and mitigation are also needed in order to evaluate probabilities Pd , Pa , and Pm of the event tree. As noted in [32], there is little publicly available information on this topic. Recently, a public benchmark was proposed in [37] for the assessment of the efficiency of detection means. Reference [38] provides some figures for tested mitigation means.
During ASPRID project, we used the results of tests performed for some Spanish airports. These test results provided information about the efficiency of detection assessment and mitigation means. In this paper, we illustrate the proposed methodology with efficiency figures that are consistent with these tests.
In detail, the detection probability Pd depends on the location and the type of the drone. We suppose that the detection means are located in the airport, and the efficiency of detection decreases for drones that are distant from the airport. Consequently, we have considered Pd = 80 % when intrusion occurs at less than 1 km from the airport and Pd = 43 % for intrusion taking place at a larger distance. Furthermore, we also have considered the detection of drones whose operation are authorized in or near the airport, but they are intruding in the departure path due to a pilot error or a technical problem. Authorized drones should continuously broadcast their location, so the efficiency of the technical means for detection is expected to be very good. In that case, Pd = 95 % wherever the intrusion occurs because the drone could be detected by a U-space service provider that covers a very large area of the airspace.
Then, we have considered that the loss of efficiency of a threat assessment is mainly related with unavailability of information-technology (IT) equipment supporting this capability. Thus, Pa is independent from the drone location and type, and it is assumed Pa = 10 2 .
Lastly, we have considered that the mitigation means could be mobile and that they could be moved close to the intruding drone location. Consequently, we have assumed that their efficiency does not depend on the drone location. Moreover, the mitigation of the intrusion of an authorized drone might be more efficient than in the case of unauthorized drones, as there is the possibility to contact the drone’s pilot in order to ask for a trajectory correction. So, we have assumed that Pm = 60 % for non-authorized drones, whereas Pm = 95 % for authorized drones.

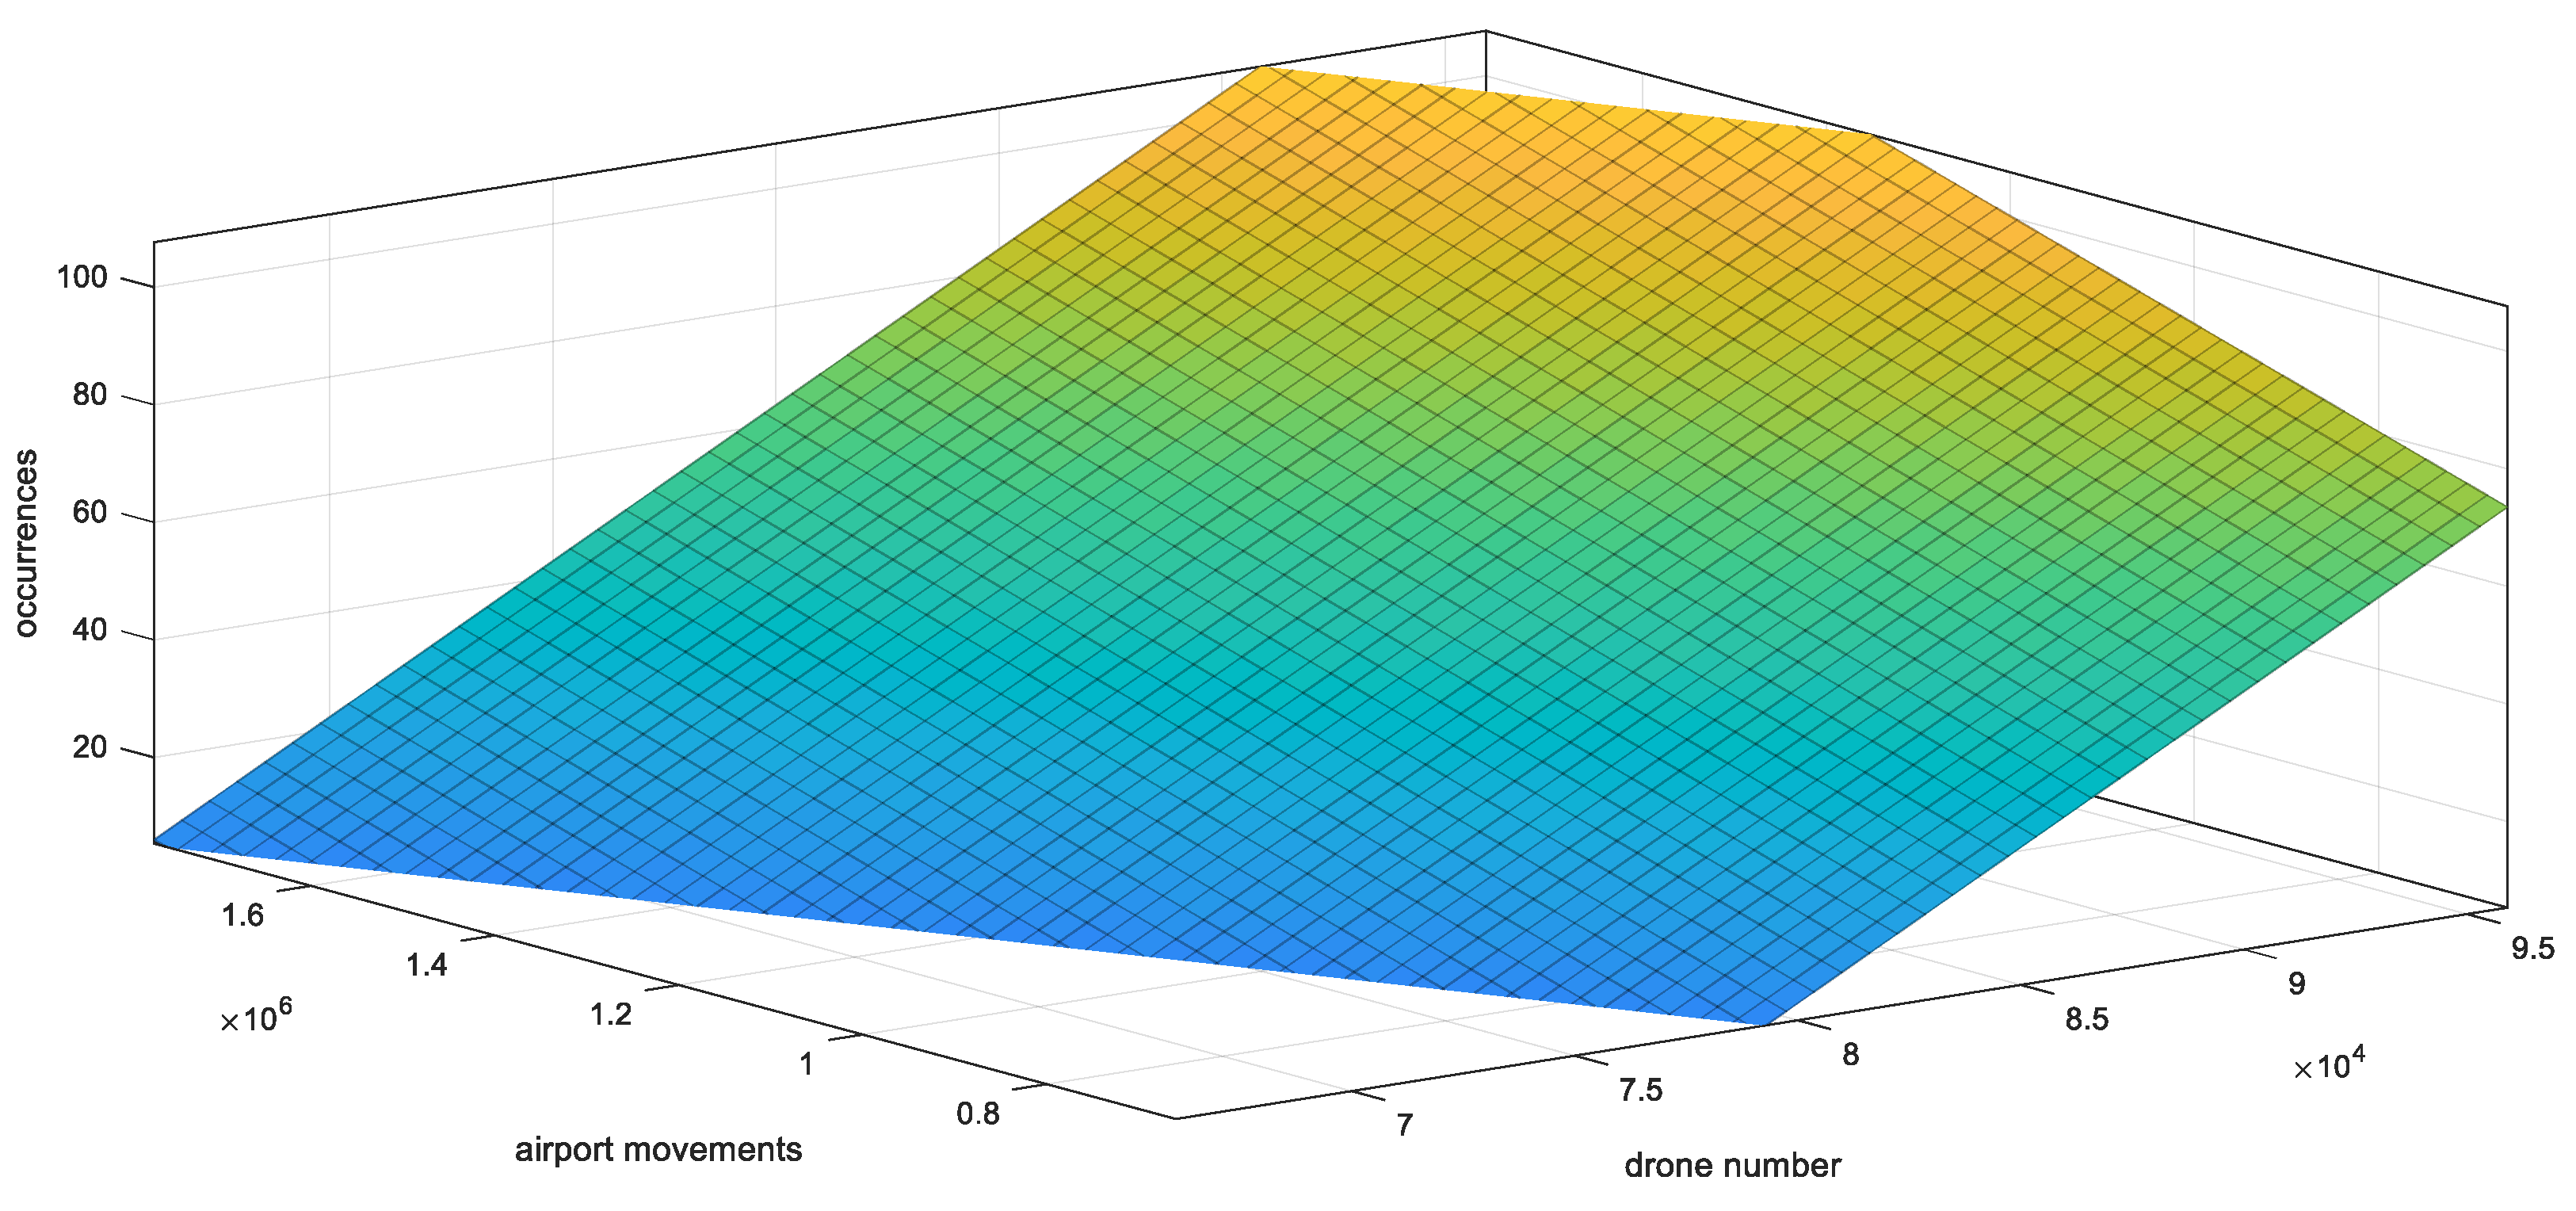
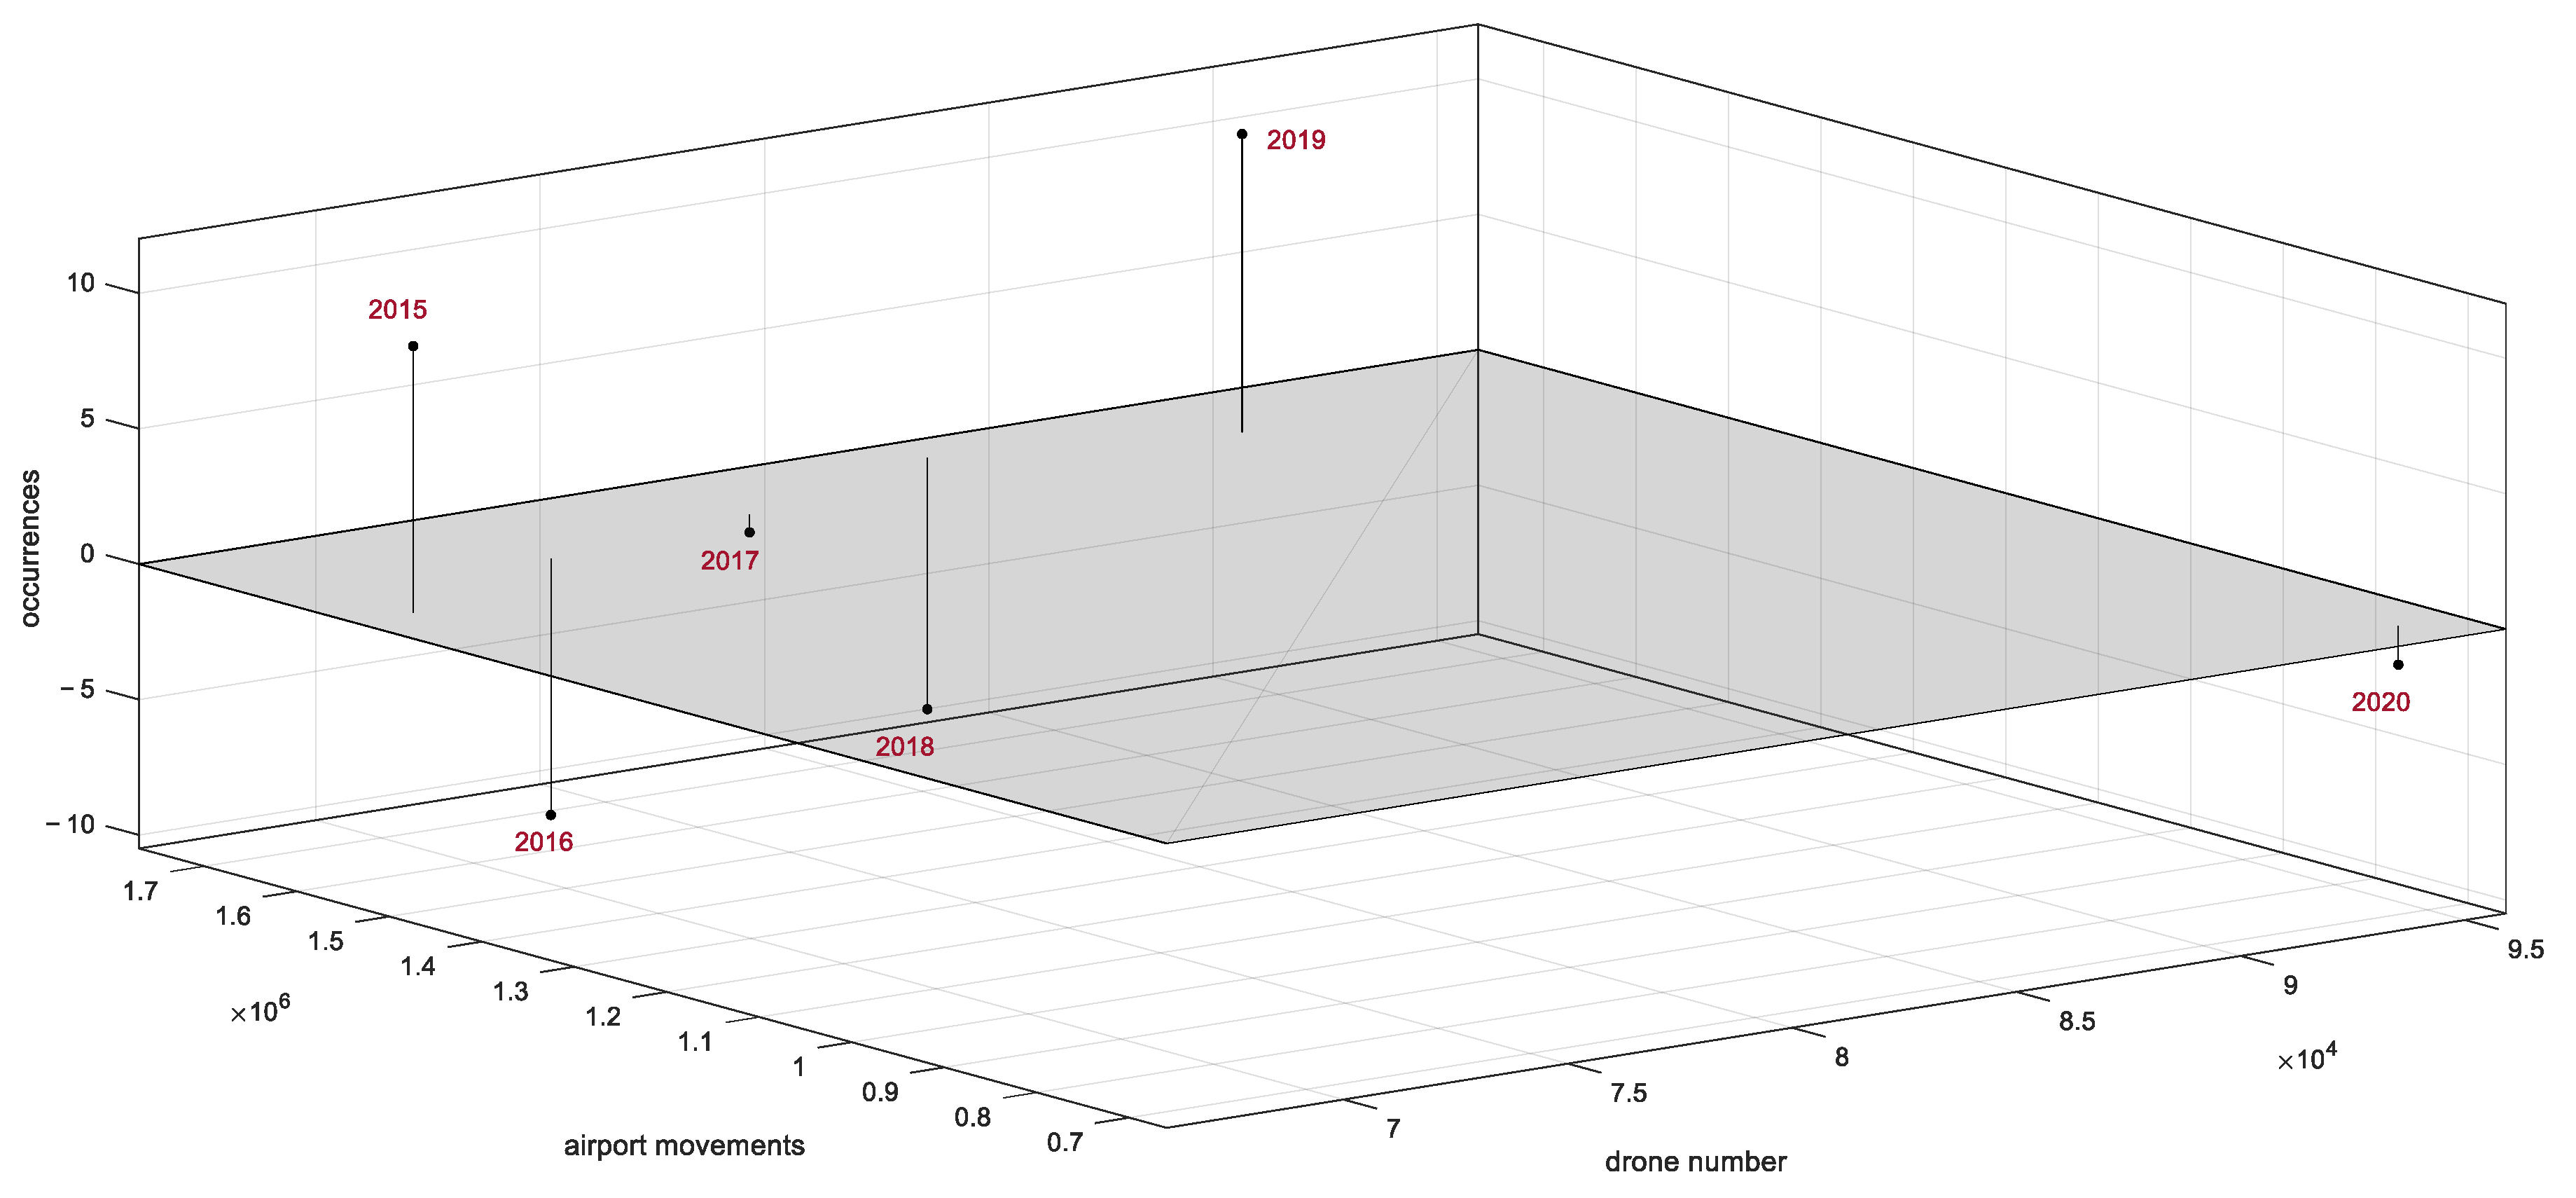
6.2. Results about Airport Vulnerability Index

A model has been set for the definition of the AVI of Italian airports, based on the modelling approach discussed in Section 4. Such model may be useful to estimate the drone-intrusion likelihood and to lead the ETA for the quantitative and coherent risk assessment of threat scenarios with the methodological framework shown in Figure 1.
Similar to the AVI modelling for FAA data described in Section 4, this work has aimed at defining an AVI in Italy as a function of socio-economic indicators. Thus, even here the addressed estimator is only for the part related to the drone-intrusion likelihood, whereas this work does not provide further details about the vulnerability in terms of drone-intrusion mitigation, for which no data are available.
Given the available inputs reported in Section 6.1.1, the proposed estimator seeks to evaluate the expected yearly number of drone intrusions in Italian airports as a function of the total number of drones and the yearly number of airport movements, i.e.:
P ^ drone y | Italy = g n drones | Italy ,   year = y , n movements | Italy ,   year = y ,
wherein:
  • P ^ drone y | Italy is the estimator of the number of drone intrusions in the Italian airports for the year y ;
  • n drones | Italy ,   year = y is the total number of drones in Italy for the year y ;
  • n movements | Italy ,   year = y is the number of airport movements in Italy for the year y .
Of course, the reference years for the definition of the model are the same of the available data about drone intrusions, i.e., 2015–2020. In regard to n drones | Italy ,   year = y , given that the official available data are about the number of registered drone operators in 2021, the number of drones for the period 2015–2020 has been estimated by applying the following assumptions:
  • the number of drones is evaluated by multiplying the number of drone operators by two;
  • the number of drones in the previous years is evaluated with the same approach in [10], i.e., by considering a linear incremental factor according to the market trends and by using a trend of +7% per year.
In detail, the following linear and two-dimensional structure has been applied for the modelling of P ^ drone y | Italy :
P ^ drone y | Italy = a 10 n drones | Italy ,   year = y + a 01 n movements | Italy ,   year = y + a 00 ,
wherein a 10 , a 01 , and a 00 are fitting real coefficients. Using the available data for the period 2015–2020, the following values of such coefficients have been determined by means of the curve fitting toolbox of MATLAB:
  • a 10 = 0.0041 ;
  • a 01 = 4.942 × 10 5 ;
  • a 00 = 352.4 .
Figure 9 shows the model in (8) and drawn with the aforementioned coefficients. Instead, Figure 10 illustrates the residual errors of the model with respect to the available observed outcomes, i.e., the real number of drone intrusions in the Italian airports for the period 2015–2020.
In detail, the effectiveness of the fitting results is demonstrated by the residual errors in Figure 10, which are included in the range 10 , 10 . Moreover, the root-mean-square error (RMSE) is 11.48 and the normalized RMSE (NRMSE) is about equal to 8%. The accuracy of the model is confirmed by its coefficient of determination R 2 , which is equal to 0.9365. Thus, the achieved estimator explains about the 93.7% of the variance in the correlation between the input variables (the yearly number of drones and the yearly number of airport movements in Italy) and the estimated variable (the yearly number of airport drone intrusions in Italy). This proves that the number of drones and the number of airport movements determines an effective airport socio-economic index to quantify vulnerabilities of Italian airports with respect to drone intrusions.
Note that an alternative model may be developed without considering the data of 2020, which may present anomalies due to the influence of COVID-19 pandemic. However, the magnitude order of the provided vulnerability estimations (as discussed below) should not change due to the normalization with respect to airport movement data. Moreover, the influence of the pandemic was still on-going also in 2021, which is the target year for our estimations.
Based on the aforementioned results for the definition of an AVI model in Italy, we have inferred an estimation of the drone-intrusion likelihood in 2021 for our case study (i.e., for Milan Malpensa airport) starting from the available data in the period 2015–2020. In other words, the model in (8) has been adapted as a one-step predictor. Firstly, the inputs of the model in (8) have been evaluated for the target year by computing the number of drones and the number of airport movements in Italy during 2021. For this purpose, the following assumptions have been adopted:
  • The number of drones in Italy in 2021. For this input, the value of has been computing with the previous approach, i.e., by considering a trend of +7% per year.
  • The number of movements of Italian airport in 202. This input has been evaluated by using the EUROCONTROL’s measurement of traffic variation between 2020 and 2021 [39]. Such measurement reports a variation of +29% in regard to the traffic level of Italy. Thus, the number of movements in 2021 has been predicted starting from the available data about the number of movements in 2020 (703,751) and by applying a growth factor of 29%.
With these assumptions, the following estimation has been achieved for the number of drone intrusions in Italy in 2021:
P ^ drone 2021 | Italy = a 10 n drones | Italy ,   2021 + a 01 n movements | Italy ,   2021 + a 00 107 .
This estimation has been refined for the reference case study of LIMC. In particular, the model inputs have been reshaped for a local characterization, i.e., to be referred to the local region of Milan Malpensa airport to quantify their influence and their contribution to the drone-intrusion exposure of the airport itself. For this purpose, the following further assumptions have been adopted:
  • The number of drones influencing LIMC in 2021. This input has been evaluated by assuming that the number of drone operators and the number of drones in a region are proportional to the population of the region. Thus, the percentage of the Italian population living in Lombardy (16.3%) has been applied to evaluate the number of drones in Lombardy in 2021, starting from the national number.
  • The number of movements of LIMC in 2021. This input has been evaluated by using the ratio between the number of movements of Milan Malpensa and the total number of airport movements in Italy in 2020, which is 13.13%.
Then, the fraction of P ^ drone 2021 | Italy related to LIMC has been computed by using the above percentages and by weighting them according to a 10 and a 01 coefficients, i.e.:
P ^ drone 2021 | LIMC = 1 100 a 10 16.3 + a 01 13.13 a 10 + a 01 P ^ drone 2021 | Italy 17.4 .
The value of P ^ drone 2021 | LIMC in (10) represents the estimation of the yearly number of drone intrusions for Milan Malpensa airport in the target year according to the proposed modelling framework. Thus, such estimation provides a possible prediction according to the model in (8) fed by the previous observed outcomes, i.e., the data in the period 2015–2020.
Moreover, the achieved result in (10) may be interpreted as an estimation of the drone-intrusion likelihood of the reference airport as part of the overall AVI (i.e., the drone-intrusion exposure) of the airport itself. Indeed, it does not consider the part related to the drone-intrusion mitigation of the reference airport. Clearly, the proposed estimation of the AVI may better exploit its potential by working also on other additional data for the identification of a complete “operational picture” underlying the processing of the AVI itself, as explained in Section 7.

6.3. Results about Event Tree Analysis

Several detailed event trees have been developed for the reference threat scenario of the case study, i.e., “intrusion of a drone in the departure path of the runways at LIMC”.
In detail, two event trees refer to intrusions in the departure path of runways 35R or 35L when a take-off is occurring: one for intrusion taking place at less from one km from the airport, and the second one for intrusion taking place at a larger distance. For both event trees, the probability of the threat scenario is computed using the AVI for LIMC, as provided in Equation (10), i.e., 17.4 intrusions/year. Such value is transformed into a probability of intrusion per hour (with the assumption of 12 h/day of operation), considering the frequency of the runway configurations with departures on runways 35R or 35L (97%). Figure 11 and Figure 12 show the event trees: the former for the intrusion taking place at less than 1 km from the airport, the latter for the intrusion taking place at a larger distance. They highlighting in pink the branches that represent an unacceptable risk. In particular, for the first event tree, the following two branches are unacceptable for the intrusion that occurs close to the airport: Branch 2 and Branch 6, which both involve the loss of efficiency of the mitigation capability. Instead, for the second event tree, the following three branches pose an unacceptable risk: Branch 5, Branch 6, and Branch 8. They are all related to a loss of efficiency of the detection mean. In addition to this condition, Branch 6 involves a loss of efficiency of the mitigation capability, whereas Branch 8 involves a loss of efficiency of all the technical means (including assessment).
The aforementioned considerations clearly show the influence of the efficiencies of the technical means on the results of the event trees and the related unacceptable branches. For example, in case of intrusions taking place in the departure path at a larger distance, the incidence of the detection capability is higher since its loss of efficiency has a significant value ( 1 Pd = 0.57 ). Instead, in case of intrusions taking place in the departure path at a shorter distance, the mitigation capability has a decisive role since its loss of efficiency ( 1 Pm = 0.4 ) which implies two unacceptable branches.
The event trees for intrusions in the runway 17 departure path are built in a similar way, but the smaller frequency of this runway configuration (3%) has to be considered when computing the probability of the threat scenario, jointly with the airport’s AVI. Figure 13 shows one of these event trees, concerning an intrusion taking place at less from one km from the airport. None of the branches of the event tree are deemed unacceptable. This is due to the very small frequency of this runway configuration, which helps to keep the probability of all the branches very low. The event tree for an intrusion further than 1 km provides similar results.
The last example of event tree deals with drones whose operation are authorized, as shown in Figure 14. In that case, only branch 2 is deemed unacceptable.

7. Discussion

This section provides a discussion of the achieved results for the proposed case study.
In regard to the AVI, it has been used to measure the susceptibility of airports with respect to drone intrusions, considering the relevant vulnerability dimensions, such as the socio-economic dimension. In detail, the analysis has shown significant and quantifiable correlations among the number of drone sightings, the total (estimated) number of drones and the number of airport movements. Such correlations have allowed to estimate the AVI, representing an effective indicator for the likelihood of threat scenarios in the risk assessment (i.e., in the ETA).
Note that the results described in Section 6.2 represent just preliminary considerations for the evaluation of a vulnerability index of airports against drone intrusions. Indeed, the estimation of the AVI may better exploit its potential by working also on other additional data for the identification of a complete “operational picture” underlying the processing of the AVI itself. Anyway, in order to arrange a comprehensive and sound model for the evaluation of the AVI, other correlations could be investigated, such as the influence of socio-cultural indicators related to the definition of a local clear regulatory framework, the promptness of intervention in case of intrusion, and the aptitude of rules observance. Such data would allow an increase in the confidence of the estimation and they may be related to:
  • the type of airport;
  • the airport’s traffic complexity;
  • the unmanned traffic (if any);
  • the meteorological conditions and the season;
  • the counter-drone solutions in the airport (if any);
  • the legal framework for drones in the country of the airport.
All the previous items are expected to influence an airport’s exposure to drone intrusions. Fine-grain data about these items would allow a tuning of an AVI (i.e., an estimator of the threat exposure and, especially, of the threat likelihood) for a specific airport. In this way, a systematic and periodic update of the AVI may be performed within the safety-related and security-related risk assessment of drone intrusions in the reference airport. Such updates would allow an estimation of the impact of important influence variables related to the airport context in regard to the risk of drone intrusions.
In regard to the ETA, the various event trees presented in Section 6.3 may help us to select critical risk scenarios. These scenarios are related to the branches of the event trees whose probability is unacceptable with respect to their safety and operational outcome, as shown in Figure 3. Indeed, the acceptability of the branches might be used to establish in which situations (i.e., threat scenarios) it is relevant to use new countermeasures or improve the current ones, coherently with the risk assessment objectives. In other words, the event trees elicit requirements (in terms of success likelihood or outcome in case of failure) for the different steps of the RIMS.
In particular, once critical (i.e., unacceptable) branches are identified, it is either possible:
  • to decrease the probability of the branch by decreasing the probability of its events (this means improving the efficiency of technical means); or
  • to reduce the safety and operational outcome of the branch, for instance by introducing specific operational procedures to mitigate the impact of the related risk scenario.
In the former case, if the branch probability is sufficiently reduced, then the branch becomes acceptable and it does not trigger a critical risk scenario anymore. In the latter case, if the safety and operational outcome is improved, then the target probability is increased and the branch probability might become acceptable after this change.
The proposed evaluation of risk scenarios (and the consequent elicitation of counter-measure requirements) may be extended to cover an entire asset (i.e., analyzing all the threat scenarios related to the asset, such as the runway) or to an entire airport.

8. Conclusions

This paper deals with the risk assessment of drone intrusions in airports. It proposes a unified methodological framework for such risk assessments, considering both safety-related and security-related causes. The framework is based on the combination of two model-based and data-driven specifications for a given airport: a vulnerability index, to quantitatively assess the susceptibility of the airport to drone intrusions, based on reference datasets; a set of event trees, to quantitatively assess the risks of the different threat scenarios related to drone intrusions, based on the airport’s vulnerability index. The proposed methodological framework is applied to a concrete case study, related to Milan Malpensa airport.
Future work will regard the extension of the framework to consider additional data types for the estimation of the vulnerability index, including other vulnerability dimensions, and additional threat scenarios related to drone cyber-intrusions in airports.

Author Contributions

Conceptualization, D.P., G.G., A.V., P.B., T.D. and E.M.; methodology, D.P., G.G., P.B. and T.D.; software, D.P. and G.G.; formal analysis, D.P., G.G., P.B. and T.D.; resources, A.V., E.M., G.B. and G.L.C.; funding acquisition, A.V., P.B. and E.M.; writing—original draft, D.P., G.G., A.V., P.B. and T.D.; writing—review & editing, D.P., G.G., A.V., P.B., T.D., E.M., G.B. and G.L.C. All authors have read and agreed to the published version of the manuscript.

Funding

This research was funded by the SESAR Joint Undertaking, grant agreement No 892036, ASPRID project (Airport System PRotection from Intruding Drones).

Data Availability Statement

Not applicable.

Acknowledgments

This research has been started within GARTEUR Aviation Security Group of Responsables.

Conflicts of Interest

The authors declare no conflict of interest. The funders had no role in the design of the study; in the collection, analyses, or interpretation of data; in the writing of the manuscript, or in the decision to publish the results.

References

  1. European Commission (EC). Consolidated text: COMMISSION IMPLEMENTING REGULATION (EU) 2019/947 of 24 May 2019 on the rules and procedures for the operation of unmanned aircraft. Off. J. Eur. Union 2019, L152, 45–71. [Google Scholar]
  2. European Commission (EC). COMMISSION DELEGATED REGULATION (EU) 2019/945 of 12 March 2019 on unmanned aircraft systems and on third-country operators of unmanned aircraft systems. Off. J. Eur. Union 2019, L152, 1–40. [Google Scholar]
  3. European Commission (EC). COMMISSION IMPLEMENTING REGULATION (EU) 2021/664 of 22 April 2021 on a regulatory framework for the U-space. Off. J. Eur. Union 2021, L139, 161–183. [Google Scholar]
  4. CORUS Consortium. U-Space Concept of Operations; CORUS Project, EU Contract No 763551, Deliverable D6.3, Edition 03.00.02; SESAR Joint Undertaking: Brussels, Belgium, 2019. [Google Scholar]
  5. European Union Aviation Safety Agency (EASA). Drone Incident Management at Aerodromes. Part 1: The Challenge of Unauthorised Drones in the Surroundings of Aerodromes; EASA: Cologne, Germany, 2021.
  6. European Union Aviation Safety Agency (EASA). Drone Incident Management at Aerodromes. Part 2: Guidance and Recommendations; EASA: Cologne, Germany, 2021.
  7. European Union Aviation Safety Agency (EASA). Drone Incident Management at Aerodromes. Part 3: Resources and Practical Tools; EASA: Cologne, Germany, 2021.
  8. Shelley, A. Drone Registration Will Not Prevent Another Gatwick. SSRN 2019. [Google Scholar] [CrossRef]
  9. Wendt, P.; Voltes-Dorta, A.; Suau-Sanchez, P. Estimating the costs for the airport operator and airlines of a drone-related shutdown: An application to Frankfurt international airport. J. Transp. Secur. 2020, 13, 93–116. [Google Scholar] [CrossRef]
  10. Pascarella, D.; Gigante, G.; Nebula, F.; Vozella, A.; Redondo de la Mata, E.; Jiménez Roncero, F.J.; Martinavarro, E. Historical Data Analysis and Modelling for Drone Intrusions in Airports. In Proceedings of the 2021 13th International Conference on Electronics, Computers and Artificial Intelligence (ECAI), Pitesti, Romania, 1–3 July 2021; pp. 1–8. [Google Scholar] [CrossRef]
  11. European Union Aviation Safety Agency (EASA). The European Plan for Aviation Safety (EPAS 2021-2025), Volume I: Introduction and Strategy; EASA: Cologne, Germany, 2020.
  12. ASPRID (Airport System PRotection from Intruding Drones) Project. Available online: https://www.asprid.eu/ (accessed on 9 September 2022).
  13. Ericson II, C.A. Concise Encyclopedia of System Safety: Definition of Terms and Concepts; John Wiley & Sons, Inc.: Hoboken, NJ, USA, 2011. [Google Scholar]
  14. Kumpulainen, S. Vulnerability concepts in hazard and risk assessment. Natural and Technological Hazards and Risks Affecting the Spatial Development of European Regions. Geol. Surv. Finl. 2006, 42, 65–74. [Google Scholar]
  15. Maragakis, I.; Clark, S.; Piers, M.; Prior, D.; Tripaldi, C.; Masson, M.; Audard, C. European Civil Aviation Safety Team (ECAST)—Safety Management System and Safety Culture Working Group (SMS WG)—Guidance on Hazards Identification. March 2009. Available online: https://www.easa.europa.eu/sites/default/files/dfu/WP1-ECASTSMSWG-SafetyCultureframework1.pdf (accessed on 15 October 2022).
  16. European Union Agency for Cybersecurity (ENISA)—Glossary Published under Risk Management. Available online: https://www.enisa.europa.eu/topics/threat-risk-management/risk-management/current-risk/risk-management-inventory/glossary (accessed on 9 September 2022).
  17. le Fevre, M.; Gölz, B.; Flohr, R.; Stelkens-Kobsch, T.; Verhoogt, T. SecRAM 2.0 Security Risk Assessment Methodology for SESAR 2020; 02.00.00; SESAR Joint Undertaking: Brussels, Belgium, 2017. [Google Scholar]
  18. Kriaa, S.; Pietre-Cambacedes, L.; Bouissou, M.; Halgand, Y. A survey of approaches combining safety and security for industrial control systems. Reliab. Eng. Syst. Saf. 2015, 139, 156–178. [Google Scholar] [CrossRef]
  19. Abdo, H.; Kaouk, M.; Flaus, J.-M.; Masse, F. A safety/security risk analysis approach of industrial control systems: A cyber bowtie—Combining new version of attack tree with bowtie analysis. Comput. Secur. 2017, 72, 175–195. [Google Scholar] [CrossRef] [Green Version]
  20. ISO 31000:2018; Risk Management—Guidelines. International Organization for Standardization (ISO): Geneva, Switzerland, 2018.
  21. ISO/IEC 27005:2018; Information Technology—Security Techniques—Information Security Risk Management. International Organization for Standardization (ISO)/International Electrotechnical Commission (IEC): Geneva, Switzerland, 2018.
  22. International Civil Aviation Organization (ICAO). Doc 9859—Safety Management Manual (SMM), 4th ed.; ICAO: Montreal, QC, Canada, 2018. [Google Scholar]
  23. International Civil Aviation Organization (ICAO). Doc 8973—Restricted—Aviation Security Manual, 12th ed.; ICAO: Montreal, QC, Canada, 2020. [Google Scholar]
  24. Rabiller, B.; Fota, N.; Carbo, L. SESAR Safety Reference Material; 00.04.01; EUROCONTROL: Brussels, Belgium, 2018.
  25. National Safe Skies Alliance. Recommended Security Guidelines for Airport Planning, Design, and Construction; Program for Applied Research in Airport Security (PARAS). PARAS 0004; Transportation Security Administration: Springfield, VA, USA, 2017.
  26. U.S. Department of Homeland Security. Security Guidelines for General Aviation Airport Operators and Users; U.S. Department of Homeland Security: Washington, DC, USA, 2021.
  27. SATIE (Security of Air Transport Infrastructure of Europe) Project. Available online: https://satie-h2020.eu/ (accessed on 9 September 2022).
  28. Borener, S.S.; Guzhva, V.S.; Crook, I.; Fraga, R. Safety Assessment of Implemented NextGen Operational Improvements. Transp. Res. Procedia 2016, 14, 3731–3740. [Google Scholar] [CrossRef] [Green Version]
  29. Pyrgies, J. The UAVs threat to airport security: Risk analysis and mitigation. J. Airl. Airpt. Manag. 2019, 9, 63–96. [Google Scholar] [CrossRef] [Green Version]
  30. Lykou, G.; Moustakas, D.; Gritzalis, D. Defending Airports from UAS: A Survey on Cyber-Attacks and Counter-Drone Sensing Technologies. Sensors 2020, 20, 3537. [Google Scholar] [CrossRef] [PubMed]
  31. Castrillo, V.U.; Manco, A.; Pascarella, D.; Gigante, G. A Review of Counter-UAS Technologies for Cooperative Defensive Teams of Drones. Drones 2022, 6, 65. [Google Scholar] [CrossRef]
  32. Kang, H.; Joung, J.; Kim, J.; Kang, J.; Cho, Y.S. Protect Your Sky: A Survey of Counter Unmanned Aerial Vehicle Systems. IEEE Access 2020, 8, 168671–168710. [Google Scholar] [CrossRef]
  33. Sampigethaya, K.; Kopardekar, P.; Davis, J. Cyber security of unmanned aircraft system traffic management (UTM). In Proceedings of the 2018 Integrated Communications, Navigation, Surveillance Conference (ICNS), Herndon, VA, USA, 10–12 April 2018; pp. 1C1-1–1C1-15. [Google Scholar] [CrossRef]
  34. Federal Aviation Administration (FAA)—UAS Sightings Report. Available online: https://www.faa.gov/uas/resources/public_records/uas_sightings_report (accessed on 9 September 2022).
  35. Steiner, M.; Deierling, W.; Johnson, D. Lightning safety at airports—Material for thunder. In Proceedings of the 3rd WMO/WWRP International Symposium on Nowcasting and Very Short Range Forecasting, Rio de Janeiro, Brazil, 6–10 August 2012. [Google Scholar]
  36. EUROCONTROL—Public Airport Corner. Available online: https://ext.eurocontrol.int/airport_corner_public/ (accessed on 9 September 2022).
  37. Svanström, F.; Englund, C.; Alonso-Fernandez, F. Real-Time Drone Detection and Tracking With Visible, Thermal and Acoustic Sensors. In Proceedings of the 25th International Conference on Pattern Recognition (ICPR), Milan, Italy, 10–15 January 2021; pp. 7265–7272. [Google Scholar] [CrossRef]
  38. Kouhestani, C.; Woo, B.; Birch, G. Counter unmanned aerial system testing and evaluation methodology. In Proceedings of the SPIE 10184, Sensors, and Command, Control, Communications, and Intelligence (C3I) Technologies for Homeland Security, Defense, and Law Enforcement Applications XVI, Anaheim, CA, USA, 9–13 April 2017; Volume 1018408. [Google Scholar] [CrossRef]
  39. EUROCONTROL—EUROCONTROL Comprehensive Assessment, COVID 19 Impact on European Aviation. Available online: https://www.eurocontrol.int/sites/default/files/2021-07/covid19-eurocontrol-comprehensive-air-traffic-assessment-08072021.pdf (accessed on 9 September 2022).
Figure 1. Proposed methodological framework for the risk assessment of airport drone intrusions.
Aerospace 09 00747 g001
Figure 2. Correlation-fitting model between the population and the number of drone sightings for by State FAA airports in 2020.
Aerospace 09 00747 g002
Figure 3. Qualitative view of the even tree for the assessment of threat scenarios related to drone intrusions in airports.
Aerospace 09 00747 g003
Figure 4. Quantitative view of the even tree for the assessment of threat scenarios related to drone intrusions in airports.
Aerospace 09 00747 g004
Figure 5. Runways and departure paths of Milan Malpensa airport (LIMC).
Aerospace 09 00747 g005
Figure 6. Yearly number of drone intrusions in Italian airports (2015–2020).
Aerospace 09 00747 g006
Figure 7. Yearly number of airport movements in Italy (2015–2020).
Aerospace 09 00747 g007
Figure 8. Yearly number of drone intrusion in Italian airports per 10,000 airport movements (2015–2020).
Aerospace 09 00747 g008
Figure 9. AVI model for the Italian the yearly number of drone intrusions as a function of the total number of drones and the yearly number of airport movements.
Aerospace 09 00747 g009
Figure 10. Residuals of AVI model for the Italian the yearly number of drone intrusions in the period 2015–2020.
Aerospace 09 00747 g010
Figure 11. Event tree for the intrusion of an unauthorized drone in LIMC 35 departure path (<1 km from runway) when take-off is occurring.
Aerospace 09 00747 g011
Figure 12. Event tree for the intrusion of an unauthorized drone in LIMC 35 departure path (>1 km from runway) when take-off is occurring.
Aerospace 09 00747 g012
Figure 13. Event tree for the intrusion of an unauthorized drone in LIMC 17 departure path (<1 km from runway) when take-off is occurring.
Aerospace 09 00747 g013
Figure 14. Event tree for the intrusion of an authorized off-nominal cooperative drone in LIMC 35 departure path when take-off is occurring.
Aerospace 09 00747 g014
Table 1. Key terms for risk assessment.
TermDescriptionReference
VulnerabilityA weakness of a reference system (i.e., an infrastructure, an asset, a group of assets, an organization, etc.) that may result in a temporary or permanent interruption of the system’s operations. Thus, vulnerability is the susceptibility of a system to mishap risks.[13]
Threat or hazardAnything that might exploit a vulnerability for the temporary or permanent interruption of the system’s operations. In general, a threat may be: (i) accidental, i.e., unintentional; (ii) malicious, i.e., hostile and deliberate.[13]
Vulnerability indexA measure of the susceptibility of people, communities, or regions to natural or technological hazards. A vulnerability index represents a measure of the exposure of the system or the community under study with respect to the reference hazards.[14]
Safety threatA threat that refers to any accidental cause of the interruption of system’s operations, in the case that such interruption operation exhibits a safety impact for the outcome, i.e., if the reference system is safety-critical. This type of threat is also named just hazard, which is “a dormant potential for harm which is present in one form or another within the aviation system or its environment”.[15]
Security threatA threat that refers to any malicious (intentional) cause of the interruption of system’s operations. It is often named just threat and it is the equivalent to hazard in safety. According to the European Union Agency for Cybersecurity (ENISA), a threat is “any circumstance or event with the potential to adversely impact an asset through unauthorized access, destruction, disclosure, modification of data, and/or denial of service”. Clearly, a security threat may also have a safety impact if the reference system is safety-critical.[16]
Threat agent or attackerIn case of a security threat, a threat agent or attacker is an entity (i.e., person, organization, system, etc.) that has the power to act, cause, carry, transmit, or support the reference threat. Thus, a threat agent is the entity which has the intention, the capacity, and the opportunity to exploit the vulnerabilities of the system.[17]
Threat scenario or hazard scenarioThe description of how a threat or hazard might materialize and represents a logic sequence from a hazard to its consequence[7]
RiskA vector value combining event likelihood with event outcome related to a threat scenario.[13]
Risk assessmentA process to identify plausible threat scenarios and quantifies their level of risk, i.e., by analyzing their likelihood, reasonable worst-case consequences, the current mitigating measures, and the remaining vulnerabilities. Risk assessment may contain safety elements or security elements, or both. For example, a security-based risk assessment or security risk assessment evaluates the security-related vulnerabilities of the reference system, and the occurrence probability and the potential impact of security incidents.[5]
Security incidentOff-nominal events in the system’s operations that are caused by an attack of a threat agent and that have an actual or potentially adverse effect on the security or performance of the system.[16]
Publisher’s Note: MDPI stays neutral with regard to jurisdictional claims in published maps and institutional affiliations.

