
Air Traffic Complexity Assessment Based on Ordered Deep Metric


1
College of Computer Science and Technology, Nanjing University of Aeronautics and Astronautics, Nanjing 211106, China
2
College of Civil Aviation, Nanjing University of Aeronautics and Astronautics, Nanjing 211106, China
*
Author to whom correspondence should be addressed.
Aerospace 2022, 9(12), 758; https://doi.org/10.3390/aerospace9120758
Submission received: 16 October 2022
/
Revised: 18 November 2022
/
Accepted: 20 November 2022
/
Published: 26 November 2022
(This article belongs to the Collection Air Transportation—Operations and Management)
Abstract
:Since air traffic complexity determines the workload of controllers, it is a popular topic in the research field. Benefiting from deep learning, this paper proposes an air traffic complexity assessment method based on the deep metric of air traffic images. An Ordered Deep Metric (ODM) is proposed to measure the similarity of the ordered samples. For each sample, its interclass loss is calculated to keep it close to the mean of the same class and far from the difference. Then, consecutive samples of the same class are considered as a cluster, and the intracluster loss is calculated to make the samples close to the samples within the same cluster and far from the difference. Finally, we present the ODM-based air traffic complexity assessment method (ATCA-ODM), which uses the ODM results as the input of the classification algorithm to improve the assessment accuracy. We verify our ODM algorithm and ATCA-ODM method on the real traffic dataset of south-central airspace of China. The experimental results demonstrate that the assessment accuracy of the proposed ATCA-ODM method is significantly higher than that of the existing similar methods, which also proves that the proposed ODM algorithm can effectively extract high-dimensional features of the air traffic images.
1. Introduction
It is well known that safety is the primary goal of air transportation. The whole flight operation in the airspace is monitored by the air traffic controllers on the ground. Pilots need to follow the controller’s instructions to adjust their flight trajectory to avoid potential conflicts between aircrafts. However, in recent years, the rapid growth of air traffic and limited airspace capacity have made air traffic control more and more complex. It is important to note that there is no necessary relationship between the airspace capacity and the controller’s workload. In general, the more aircraft in the airspace and the more potential conflicts, the higher the controller’s workload will be. The aggravation of route congestion and aircraft conflict problems directly leads to a dramatic increase in controller workload. The overload of controllers will inevitably lead to inappropriate control decisions, which will bring safety risks to air traffic control [1,2,3]. Therefore, scientific and accurate evaluation of air traffic complexity in the airspace sector can keep the traffic complexity in the sector within the controller’s tolerance range, that is, it can make the controller’s control ability match the traffic complexity in the sector, so as to ensure that the air traffic flow in each sector of the airspace can operate safely and efficiently, and finally achieve the purpose of improving the operation quality of the ATC system. Accurate assessment of air traffic complexity can help us to reasonably divide the airspace into several sectors so as to ensure that controllers can safely control all flights within a tolerable workload [4].
Air traffic complexity depends on the real-time traffic flow in a certain airspace, including the number of aircrafts and their relative positions to each other [5,6]. Due to the limitations of the airspace structure, aircraft must adapt to the airspace structure by changing their trajectories, which in turn causes dynamic changes in air traffic complexity. Therefore, accurately assessing the dynamic complexity of air traffic is a daunting task. In the past two decades, researchers have studied the air traffic complexity problem from two main aspects: static airspace structure and characteristics of dynamic traffic flow. With the development of machine learning techniques, in recent years, some researchers have also tried to apply some advanced machine learning algorithms to assess air traffic complexity [7,8,9]. In 2016, Xiao et al. [7] presents an air traffic complexity evaluation model with integrated classification using computational intelligence. In 2019, Andraši et al. [8] proposed a novel approach, which used multilayer perceptron to handle the air traffic complexity estimation problem. In 2021, Xie et al. [9] first proposed an image representation of air traffic status, and then used the convolutional neural network (CNN) to predict air traffic complexity, which significantly improves the assessment accuracy.
The image representation of the air traffic status breaks through the limitations of structured data representation used in previous methods and can express more complex dynamic traffic features. Then, hidden features in the traffic images can be extracted using deep learning techniques to greatly improve the assessing performance. Benefiting from the image representation of air traffic and the wide application of deep metric techniques, this paper proposes an ordered deep metric-based air traffic complexity assessment method, ATCA-ODM, which takes air traffic images as input and uses DCNN to extract the deep traffic flow features contained in the images. Then, a deep metric learning algorithm considering the sample order are designed to calculate the distances between the extracted samples and the mean vector in the embedding space. Finally, the obtained metric matrix is used as the input of the KNN algorithm to assess the air traffic complexity. We validate the performance of ATCA-ODM on the real traffic data of south-central airspace of China. The main contributions of this paper are listed, as follows:
- (1)
- We design a new loss function which considers the sample order, and propose an ordered deep metric algorithm ODM.
- (2)
- A new air traffic complexity assessment method ATCA-ODM is proposed based on ODM to improve the accuracy of the complexity assessment.
- (3)
- The effectiveness of the proposed ODM algorithm and the performance of our complexity assessment method ATCA-ODM are verified on historical air traffic data.
2. Related Works
In 2010, Gianazza et al. [10] studied the relationship between the traffic complexity and controller workload using the back propagation neural network (BPNN) to extract nonlinear features and analyzed the reasons for the increase in controller workload. They concluded their study by suggesting traffic complexity as an indicator of airspace sectorization. In 2010, Djokic et al. [5] redefines traffic control behavior based on the components of air traffic complexity. Furthermore, they explored the interrelationship between traffic complexity and control workload by regression analysis, cluster analysis and other mathematical method. They also predicted the changes of the controller’s workload in the future scenario based on traffic complexity. In 2011, Netjasov et al. [11] studied the traffic complexity in the terminal area and found that the airspace structure and its internal traffic flow also have impacts on traffic complexity. The airspace structure contains spatial structure of the routes, connectivity of waypoints, number of waypoints, etc., and the influence of traffic flow contains distribution of traffic flow in the flight segment, changes of aircraft altitude, etc. In 2014, Delahaye et al. [12] tried to find the interconnection between dynamic factors such as the actual coordinates of the aircraft, the speed of the aircraft and the traffic complexity, and then developed a traffic complexity calculation model. In 2016, Xiao et al. [7] used genetic algorithms to select key factors of air traffic complexity and then introduced an adaptive ensemble learning algorithm Adaboost to train classification models to calculate air traffic complexity. Due to the full use of sample information, the model obtains a high classification accuracy. In 2017, Zhu et al. [13] proposed a complexity computation model based on ensemble learning for small sample scenarios with few labeled samples. In the following two years, Cao et al. [4] gradually introduced the semi-supervised learning and migration methods to air traffic complexity assessment to maximize the information contained in unlabeled and labeled data to further improve the accuracy of the air traffic complexity assessment. In 2019, Andraši et al. [8] want to make a method for complexity estimation, which can be used without the constant controller input. They using artificial neural networks for complexity estimation and the result is that the performance of ANN is similar to the linear estimation model, which proves that the issues with model accuracy could not be improved with non-linear methods, as previously proposed. In 2021, for the first time, Xie et al. [9] proposed an image representation method of air traffic situation, which first divides the target airspace into a grid, then maps the aircraft positions into the grid and puts dynamic information such as aircraft altitude, speed, and heading into the grid to generate an image to represent the traffic status of the target airspace. In addition, they use CNN to extract features from images for evaluating airspace traffic complexity. This image-based approach is able to extract more feature information than traditional machine learning methods based on numerical data, thus achieving higher classification accuracy. The most significant contribution of Xie’s work is the proposed image representation of air traffic status, which allows more deep learning techniques to be used to solve problems in air traffic.
As an important issue of deep learning, the goal of deep metric learning is to seek a mapping so that the embedding vectors of semantically similar samples in the embedding space are closer to each other, while the embedding vectors of semantically different samples are separated from each other. Specifically, what deep metric learning changes is the position of samples in the embedding space. With the model training, samples of the same class will gradually approach and samples of different class will gradually move away. The samples in the embedding space are constrained by using the deep metric learning loss function, and when the samples of the same class are far away, the loss is larger. The model changes the embedding space according to the loss, which can make the samples of the same class closer, and a similar operation is performed for the samples of different classes. In other words, deep metric learning will allow the algorithm to get more accurate prediction results. Deep metric learning has a wide range of applications in computer vision, such as image retrieval [14] and visual tracking [15]. Therefore, we can use deep metric learning to extract more embedded spatial features of air traffic images to improve the accuracy of air traffic complexity assessment. In deep metric learning, loss function plays a decisive role. Depending on the design principles, there are mainly two types of computational strategies for deep metric learning loss. The first type is pair-based loss, such as Contrastive loss [16] and Triplet loss [17], which use pairwise distances to represent the relationships between samples. The second type is proxy-based loss, such as Proxy-NCA++ [18] and PAL [19], which replaces the large-scale original samples with small-scale proxy samples, and each sample only needs to calculate its distance with the learned proxy of each class, so as to reduce the computational complexity.
Inspired by the above works, we try to design a new loss function and deep metric learning algorithm based on the characteristics of air traffic image datas, and the proposed deep metric learning algorithm will be applied to air traffic complexity assessment, and its effectiveness will be verified on real air traffic data.
3. Method
3.1. Motivation
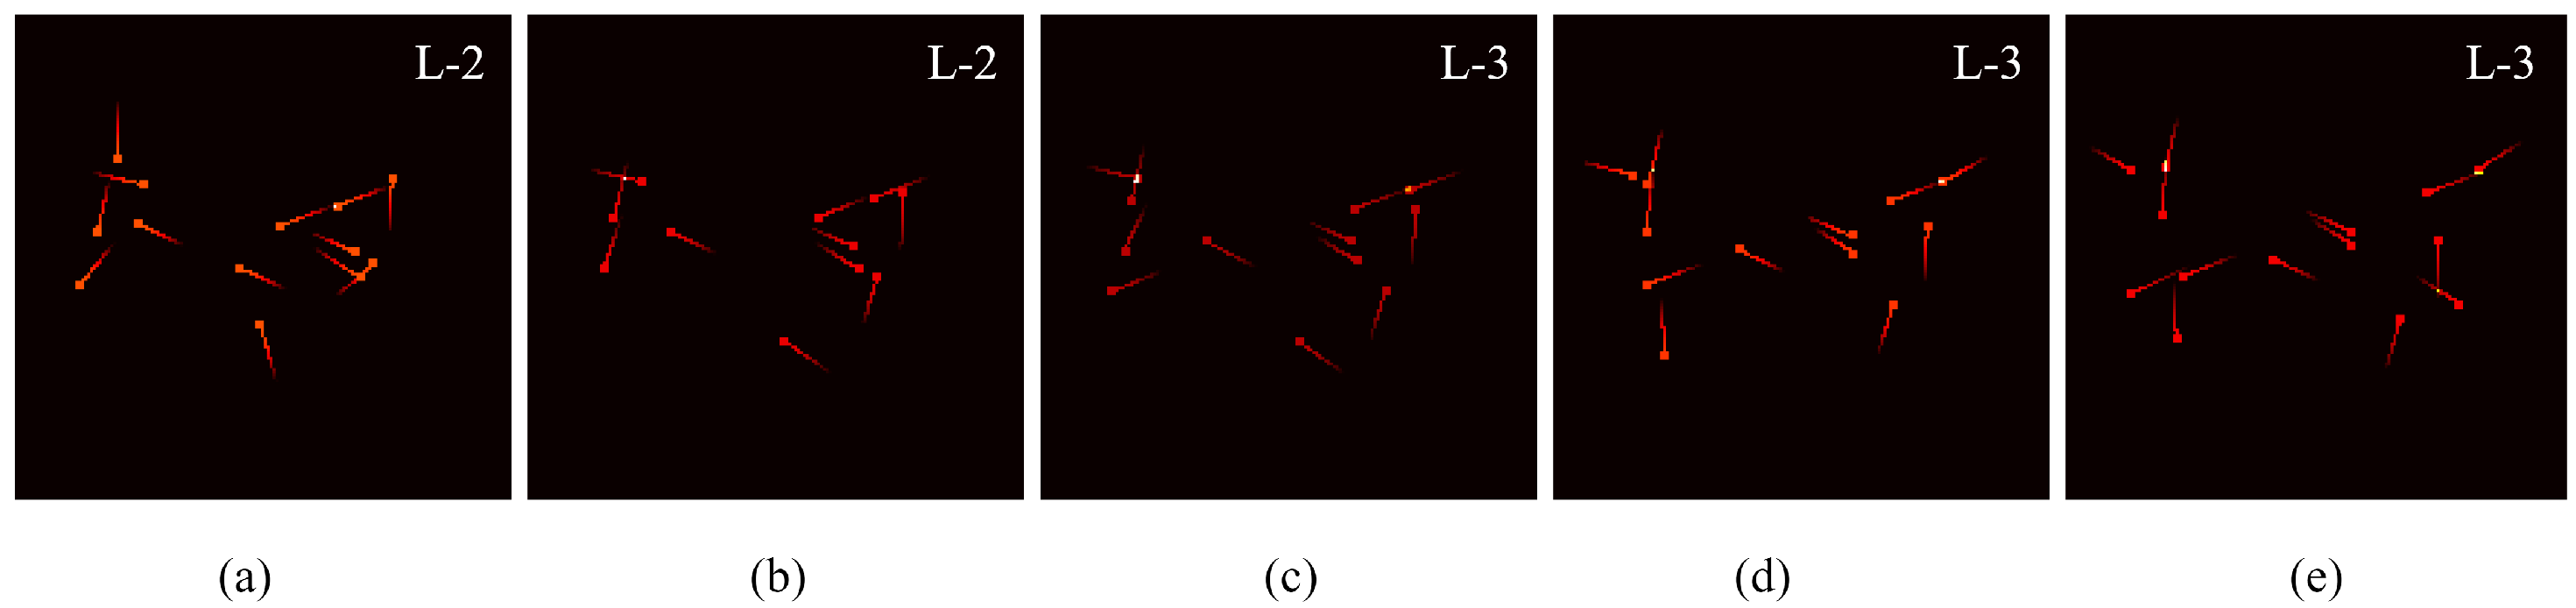
In the field of civil aviation, all kinds of the flight operation data are mostly collected in a temporal order. Therefore, adjacent samples tend to have high similarity, yet they may not belong to the same class. Figure 1 shows five consecutive images of air traffic status in a certain airspace with their complexity labels marked by a senior controller. The first two images have the same label L-2, which means they belong to the class and the last three have the same label L-3. From the figure, we can see that Figure 1b,c are adjacent samples, which are similar but do not belong to the same class.
For machine learning algorithms, such samples are difficult to be classified. To address the common problem in flight operation data, we try to design a loss function that focuses on the metric between samples in the same class, with the aim of making them as close as possible to each other.
3.2. Definition of Ordered Loss
In fact, the data are collected in several time periods, and the collection times may vary by several hours for consecutive samples; thus, the data are not completely ordered, but partially ordered. Considering this characteristic, we propose a new loss function, named ordered loss, which contains interclass loss and intracluster loss to measure the distances of samples in terms of classes and clusters.
3.2.1. Interclass Loss
We define interclass loss to measure the distance between samples with the same label. To reduce the computational complexity, we calculate the mean vector of each class. To calculate the interclass loss, only the distance between a sample and the mean vector of its class is calculated. The definition of interclass loss of a sample is as follows.
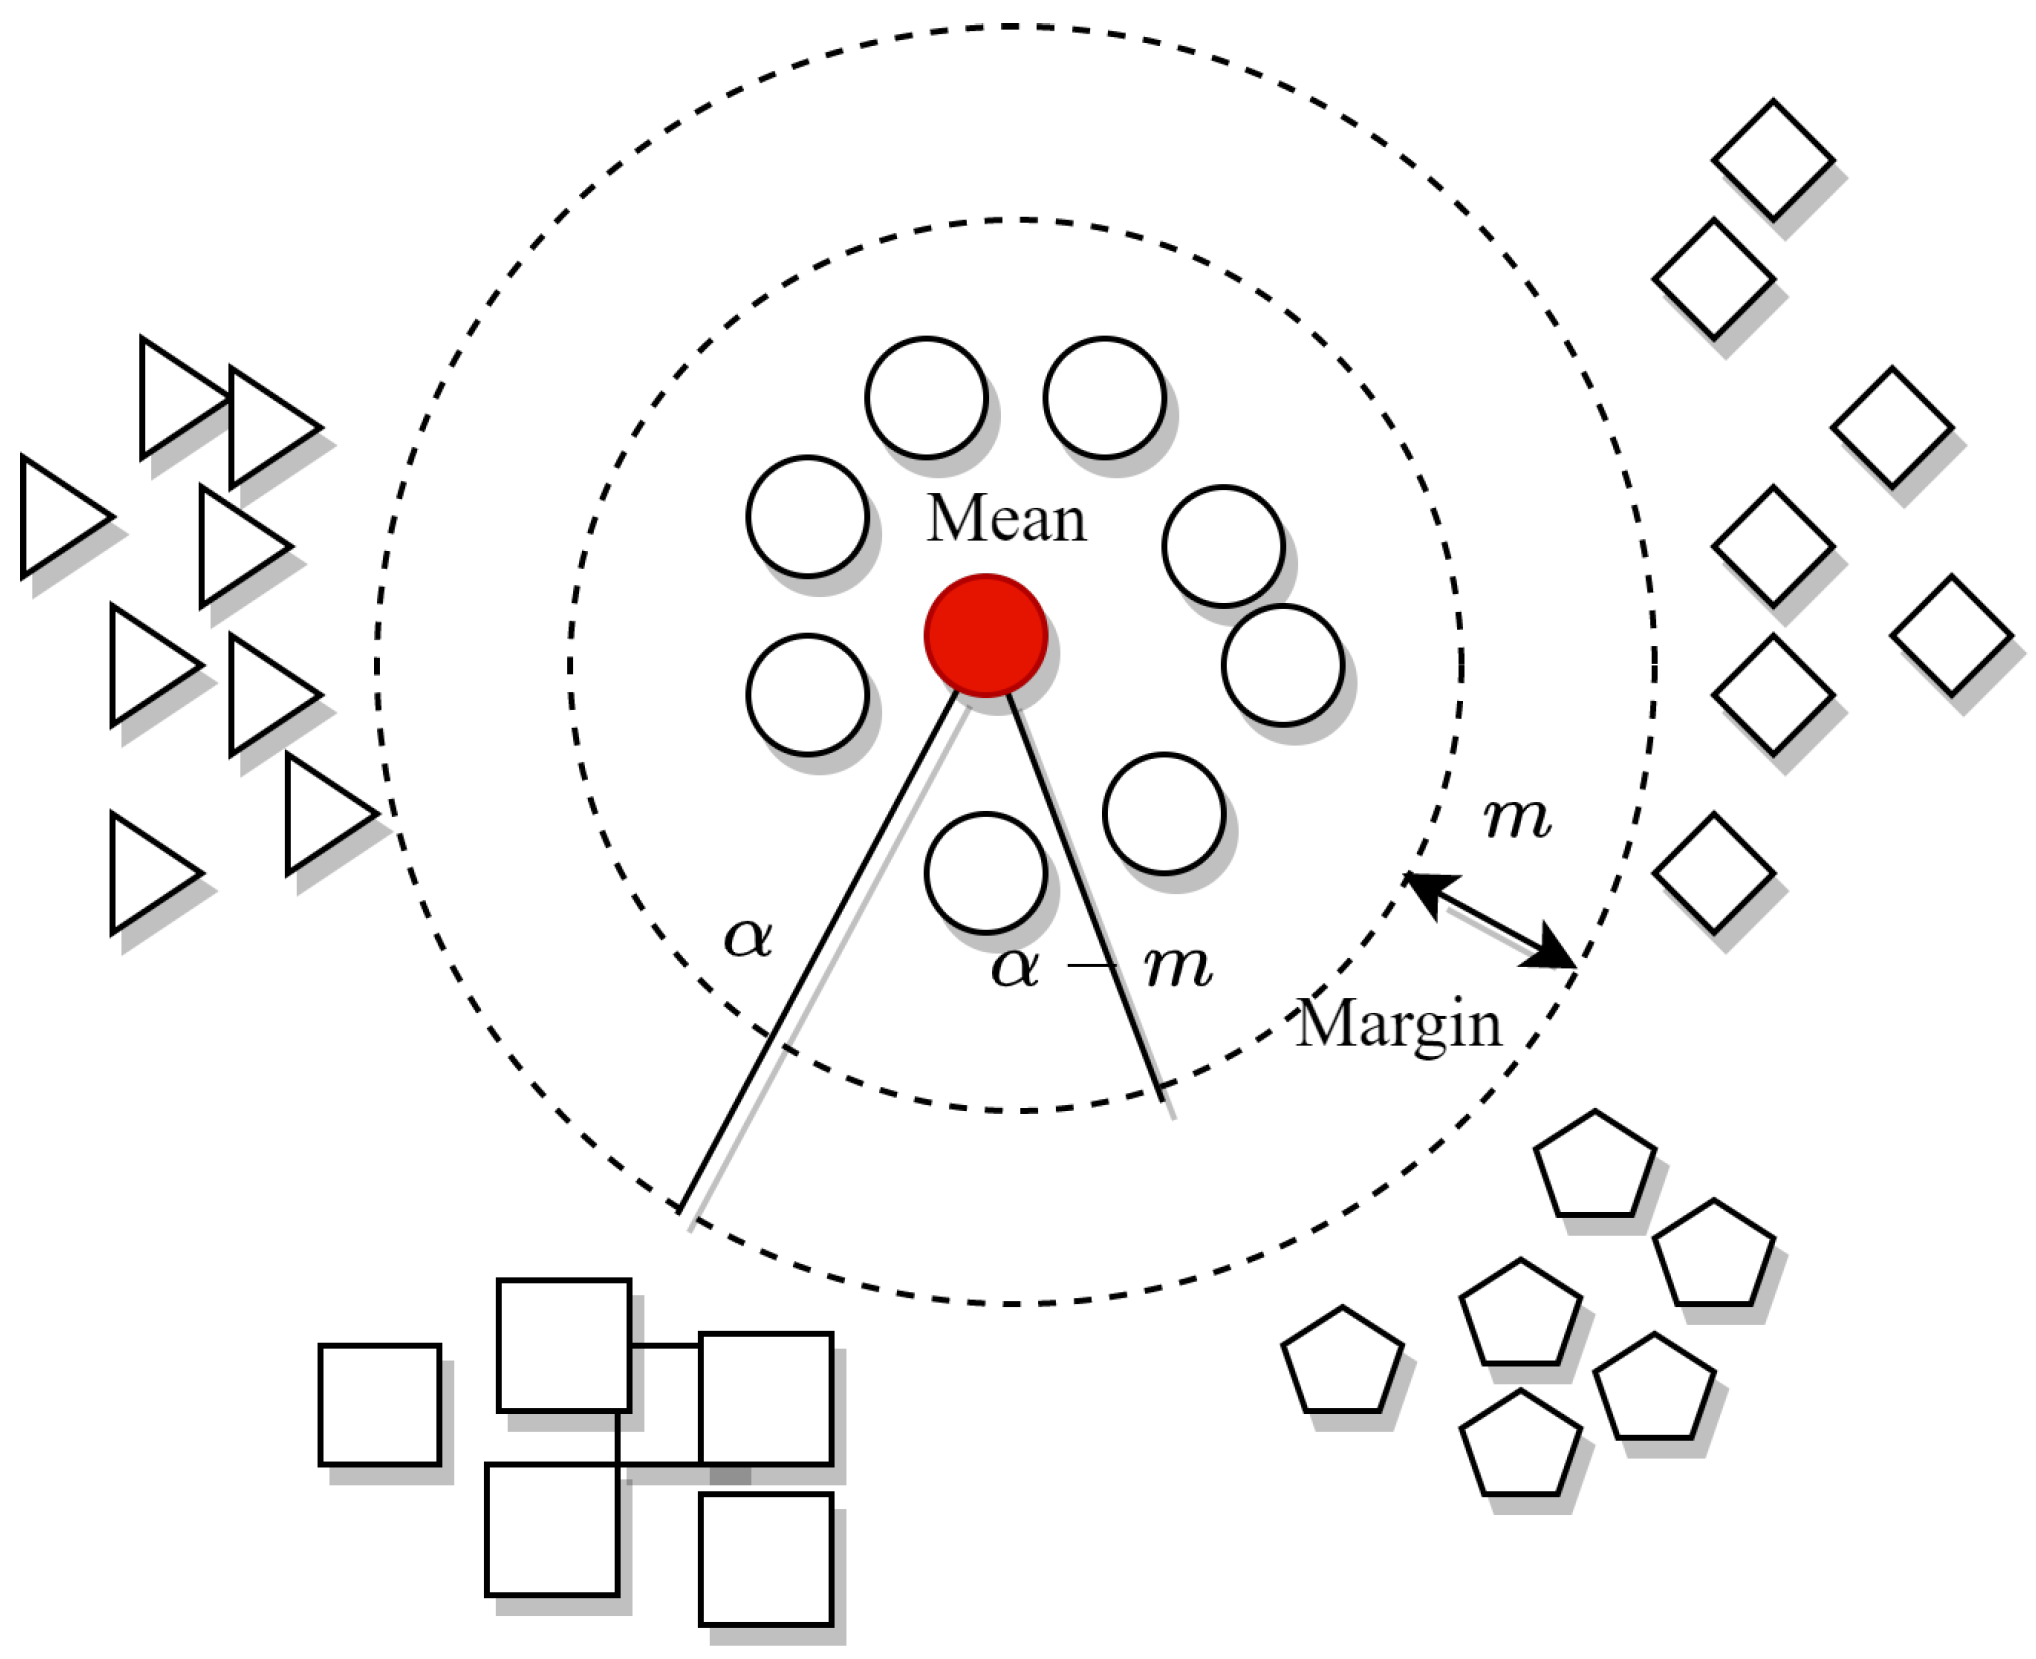
where x is an embedding vector extracted by deep convolutional neural network (DCNN) from the air traffic images, and g is the mean vector of one class. If x belongs to the same class as g, then , otherwise . . The distance between vector x and g is calculated by cosine distance , where . and m (m < ) are the hyperparameters and their roles are shown in Figure 2.
We set a boundary and a margin m (m < ) for each class. Samples from the same class should stay within a circle of radius centered on the mean vector. At the same time, there should be a margin of m between the boundaries of the two classes. So that, we only need to handle those samples that are outside the circles to make they enter the circle of their classes, which can keep the original distribution of the training data as much as possible. It can be concluded that interclass loss makes samples of the same class to be as close as possible, and it has low computational complexity.
Furthermore, to better classify the hard negative samples, we added weights to the negative samples when calculating the total interclass loss. The formula for calculating the interclass loss for all samples is as follows.
where is the mean vector, which is the same class as x. is the set of the mean vectors of the classes different from x. is the number of elements in . T is the parameter that controls the weights of the negative samples. When , all negative samples are treated equally, and if , the sample will be the hardest sample to be classified.
3.2.2. Intracluster Loss
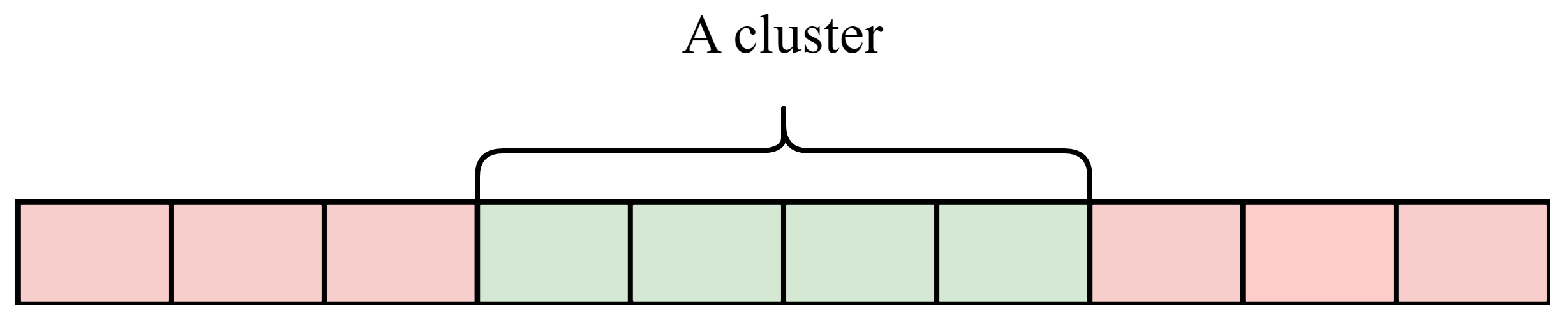
We define the intracluster loss to measure the distance between samples of different labels. First, we scan the label set and take the consecutive samples with same the label as a cluster, which is shown in Figure 3. Different colors represent different classes, so that the image set is divided into several clusters.
Samples from the same class are grouped into different clusters in the order of collection. The definition of intracluster loss of a sample and all the samples are as follows.
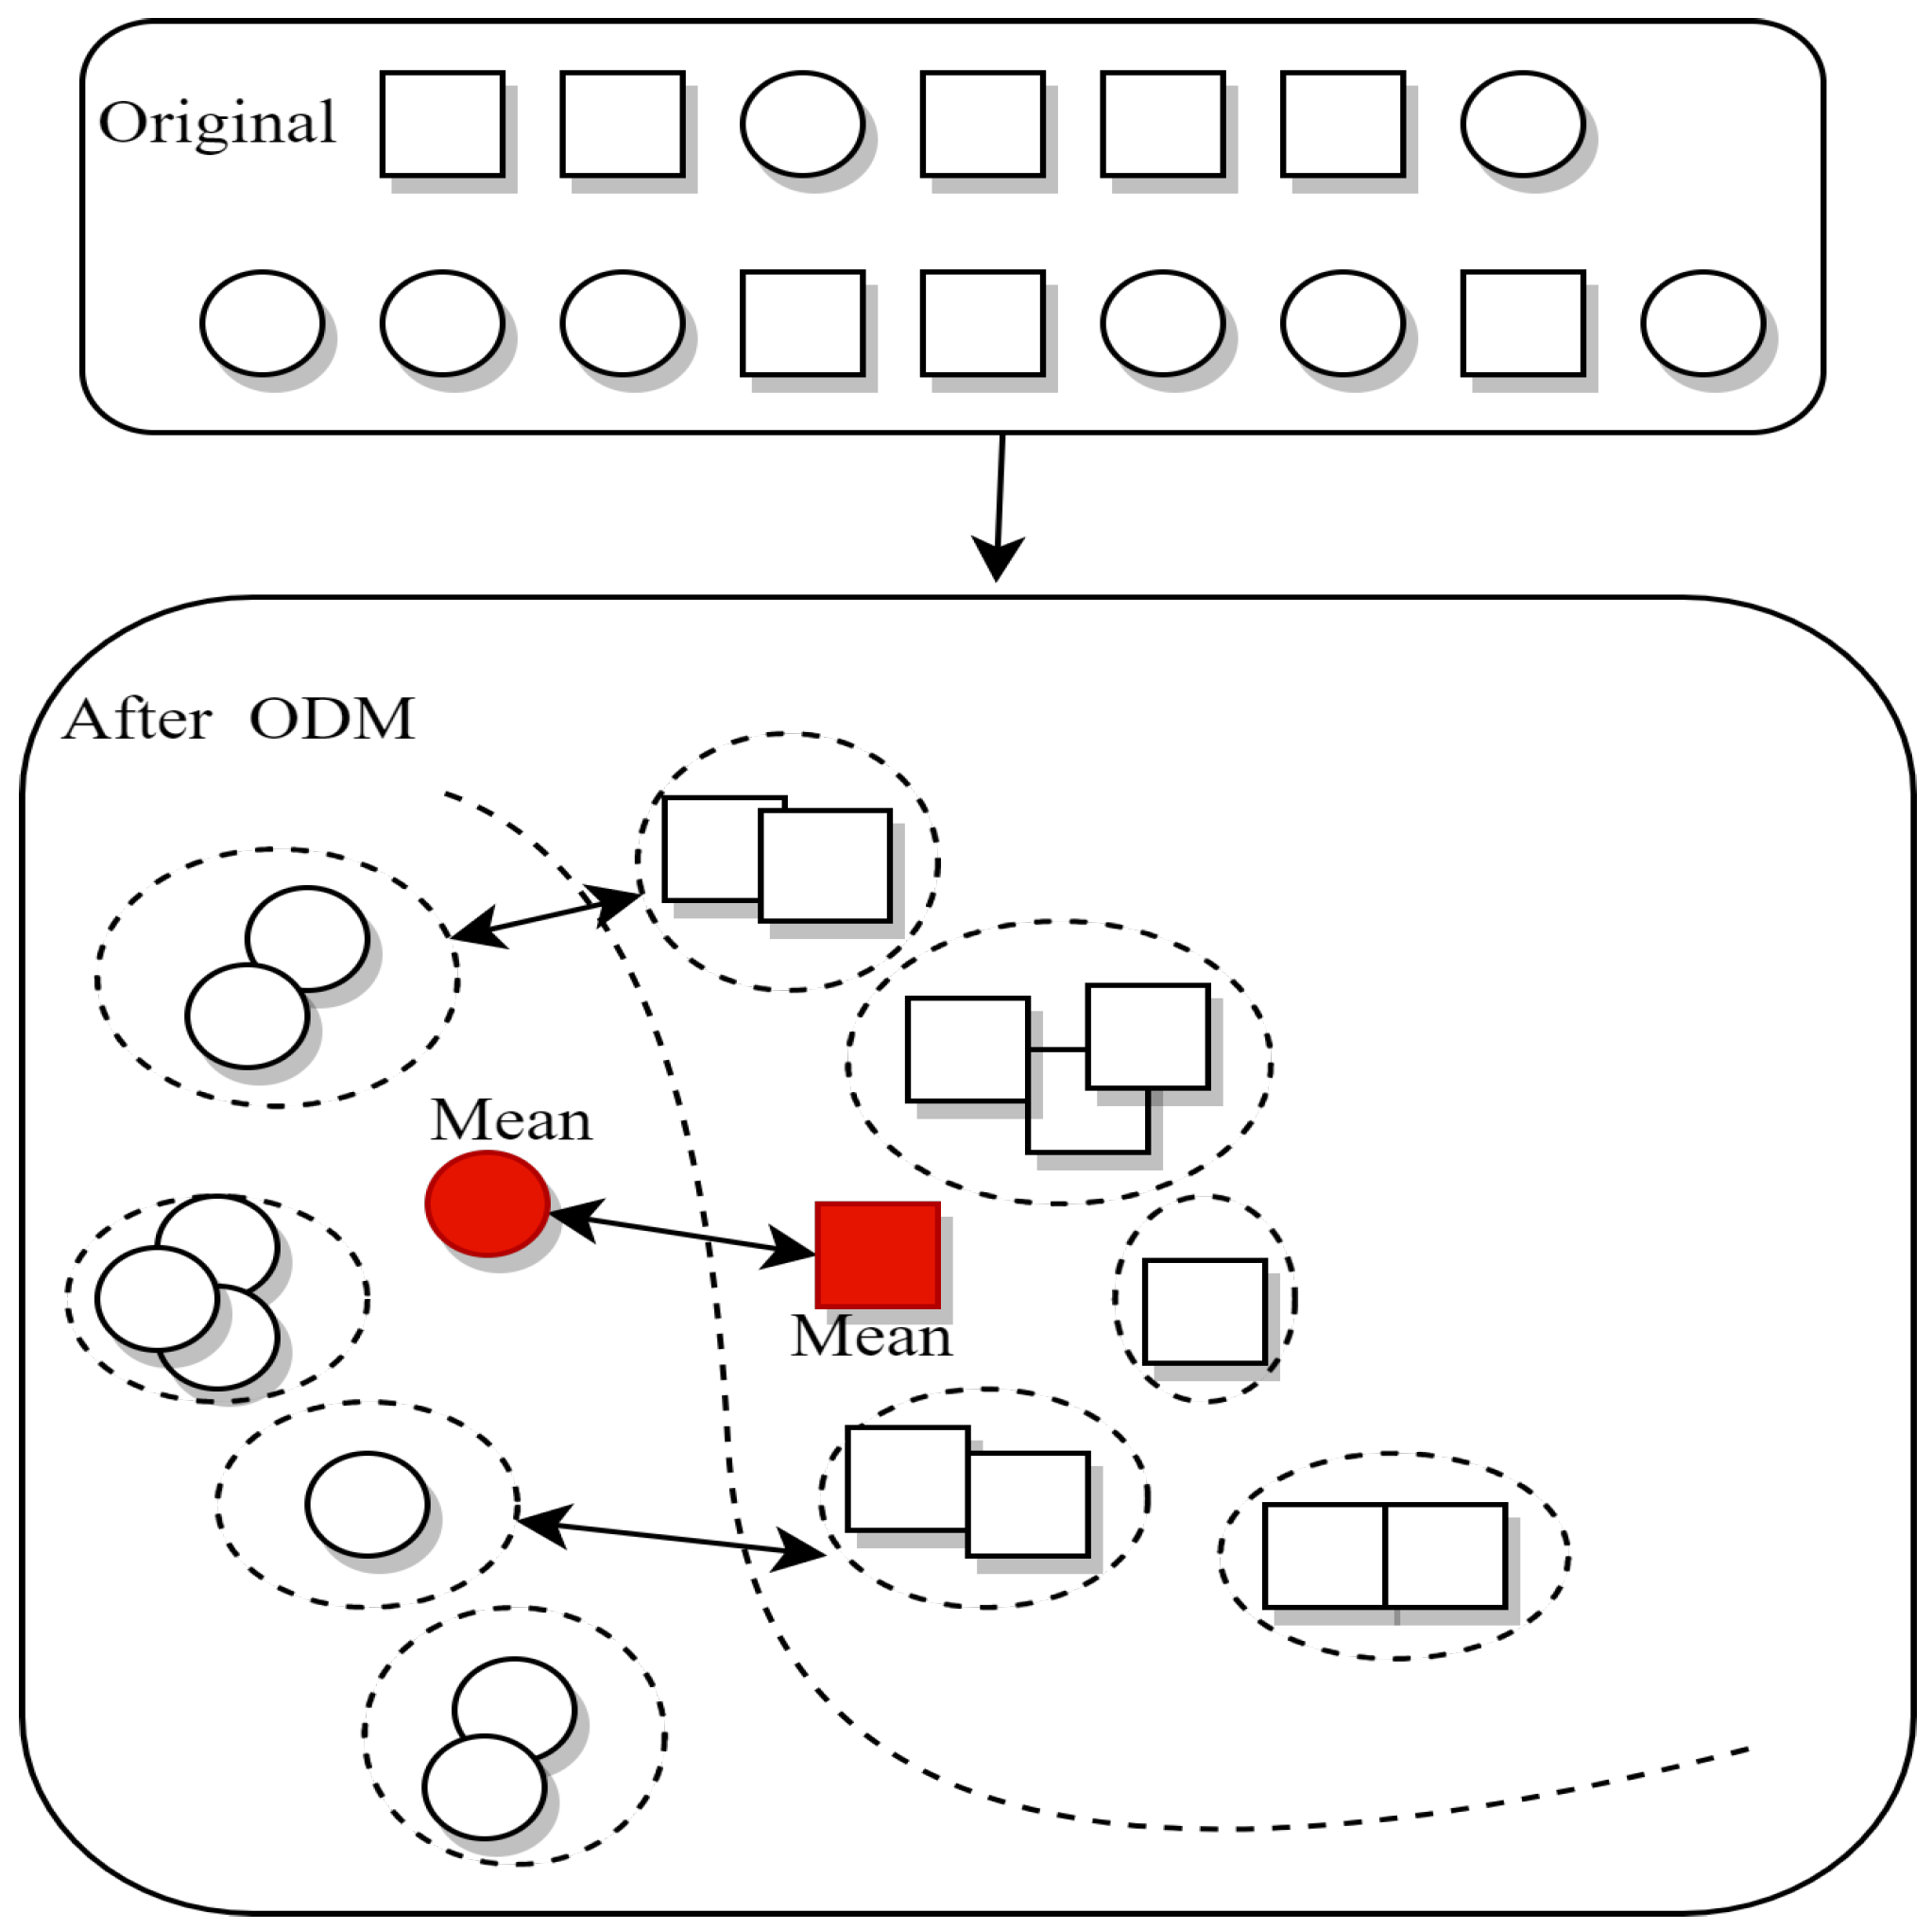
where x is an embedding vector and is the set of samples from the same cluster of x. The intuitive meaning of intracluster loss is shown in Figure 4.
In the figure, the square samples are sequentially divided into four clusters, and the circle samples are divided into four clusters too. We believe that samples in a cluster should be as close as possible in the embedding space, while clusters of different classes should be as far away as possible. The samples in the same cluster are not broken up. In this way, samples that are adjacent and similar but belong to different classes can be separated.
3.2.3. Ordered Loss
Finally, we can obtain the total loss function of ordered loss as follows.
This loss function considers both the metric between samples of different classes and the metric between samples in a cluster. The illustration of the final result combining the two part of loss is as Figure 5.
3.3. ODM Algorithm and Its Complexity
Based on the ordered loss proposed above, we can construct a deep metric learning algorithm ODM, as Algorithm 1. It is need to note that once the loss is computed, the model will use AdamW [20] to update the network parameters.
| Algorithm 1 ODM |
| Input: Air traffic images, ; |
Output: Trained GoogleNet model.
|
Since the loss function of ODM algorithm consists of the interclass loss and the intracluster loss, the complexity of ODM depends mainly on the calculation of these two losses. Let N denote the number of training samples, C denote the number of classes and n denote the average number of samples in a class. Interclass loss calculates the distances between the samples and the mean vectors, so it has a complexity of . Intracluster loss calculates the distances between samples of the same class, so it has a complexity of . Therefore, the total computational complexity of ODM algorithm is .
3.4. Assessing Air Traffic Complexity Based on ODM
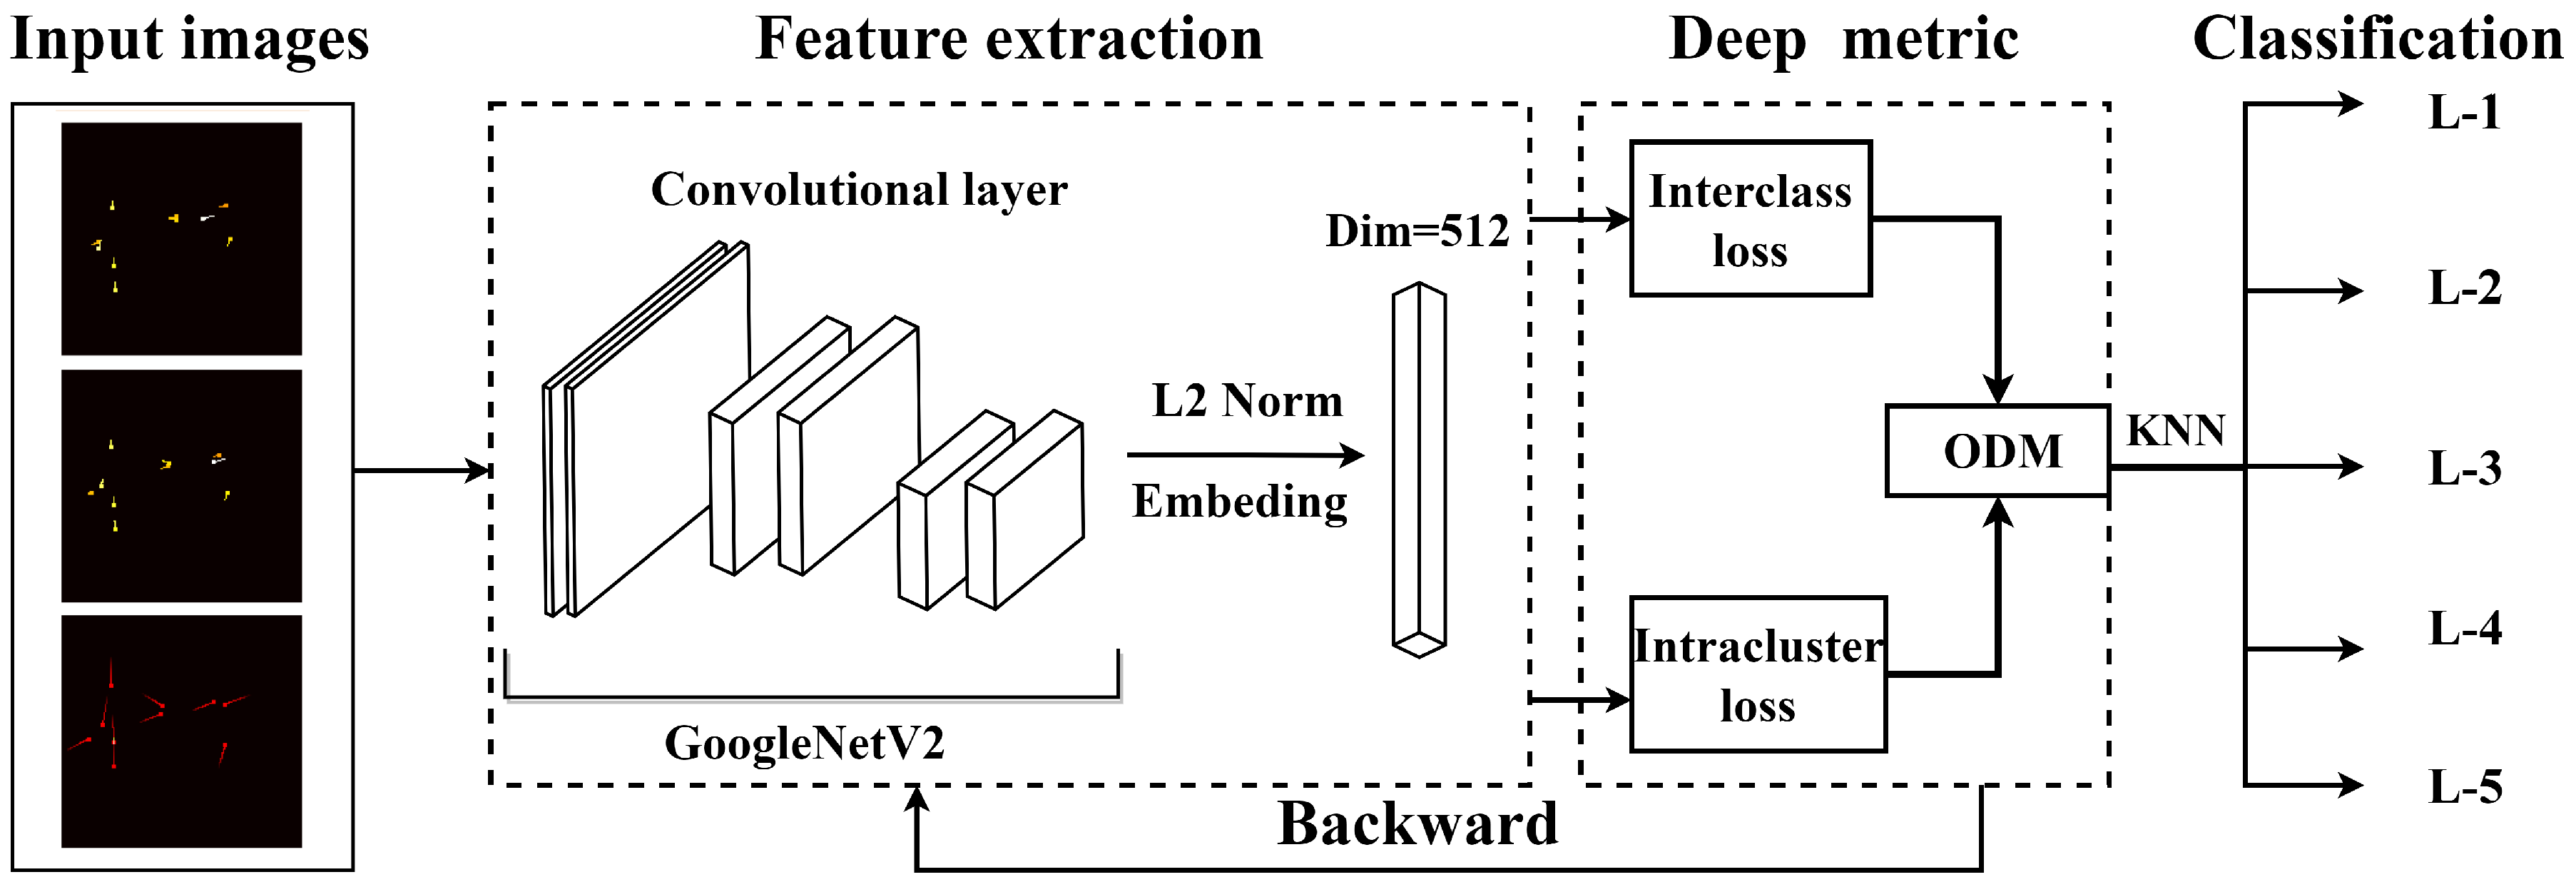
Based on ODM and DCNN, we propose a new air traffic complexity assessment method ATCA-ODM with its framework shown in Figure 6.
ATCA-ODM uses the air traffic images from reference [9] as input, which contain information on the number of aircrafts in the target airspace at a moment, the direction, speed and altitude of each aircraft, and so on. As can be observed in Figure 6, ATCA-ODM first extracts the deep features from the input images using DCNN, and obtains the feature vectors of the images in the embedding space by the embedding layer. Then, their interclass and intracluster loss are calculated for each batch of embedded feature vectors and are back-propagated for the model update. After several iterations of the above steps, the similar vectors in the embedding space are closer together and the dissimilar vectors are further away. Finally, these trained embedding feature vectors are used as input to the KNN classifier for assessing the air traffic complexity.
4. Experiments
4.1. Experimental Setup
Design of Experiments: In the first experiment, we investigate the effect of hyperparameters on model performance to find the best combination of parameters. In the second experiment, we compare the performance of the proposed ATCA-ODM method with other methods to demonstrate the effectiveness and superiority of the proposed deep metric learning algorithm ODM and ATCA-ODM method. In the third experiment, we demonstrate the impact of the loss function on the assessment performance using ablation experiments.
Implementation: The original GoogleNet network has the advantages of light weight and high classification accuracy, so we empirically choose to use GoogleNet as the feature extraction network for the model in our experiments. Without many modifications, we use it to extract 512-dimensional deep features for the input image. AdamW is used as the optimizer with an initial learning rate of 10−4. We take 80 epochs on the image set and the decay rate is 50% every 10 generations. The final output is normalized with L2 normalization.
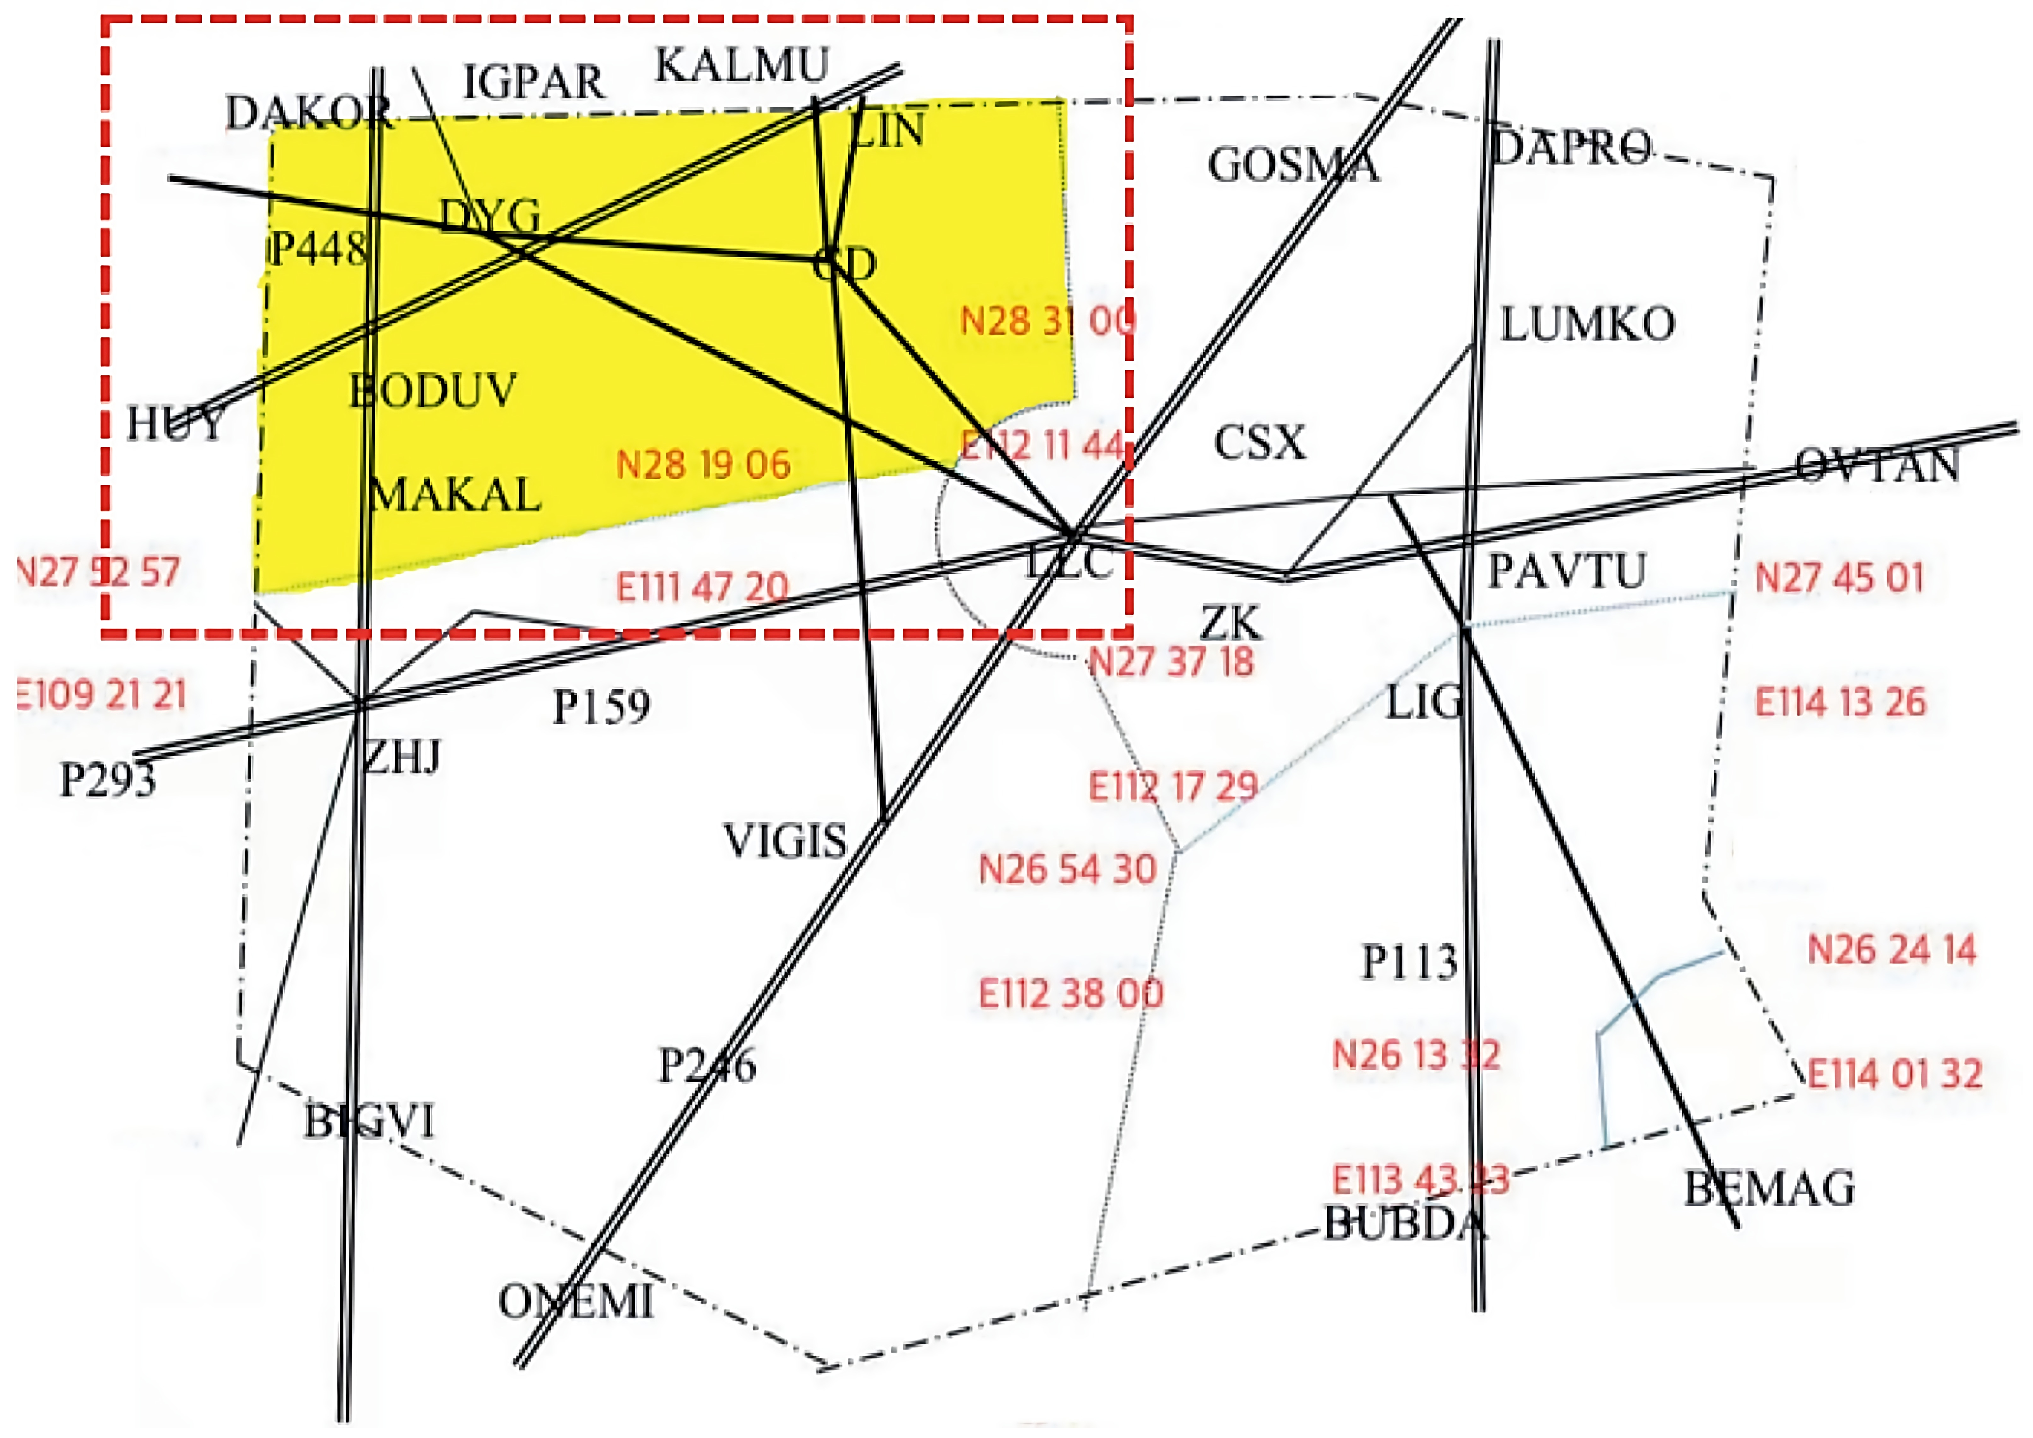
Image set: In all experiments, we use the traffic image set of the south-central airspace [9], whose airspace structure is demonstrated as the highlighted part of Figure 7. There are five classes of labels: L-1, L-2, L-3, L-4, and L-5, representing five levels of traffic complexity (Low/Lower/Medium/Higher/High). Multiple controllers rate air traffic complexity level for image set based on their experience by watching the control video. Lastly, the label of the image is the ratings with the most votes. The image set contains 3605 images of the target airspace between 1 December and 15 December 2019, with the size of 224 × 224 × 3. We use 70% of the samples to train the model and the rest for testing, and, actually, we only need to select the first 70% of the data as training data and the last 30% as test data, because the data in the dataset is ordered.
4.2. Results and Discussions
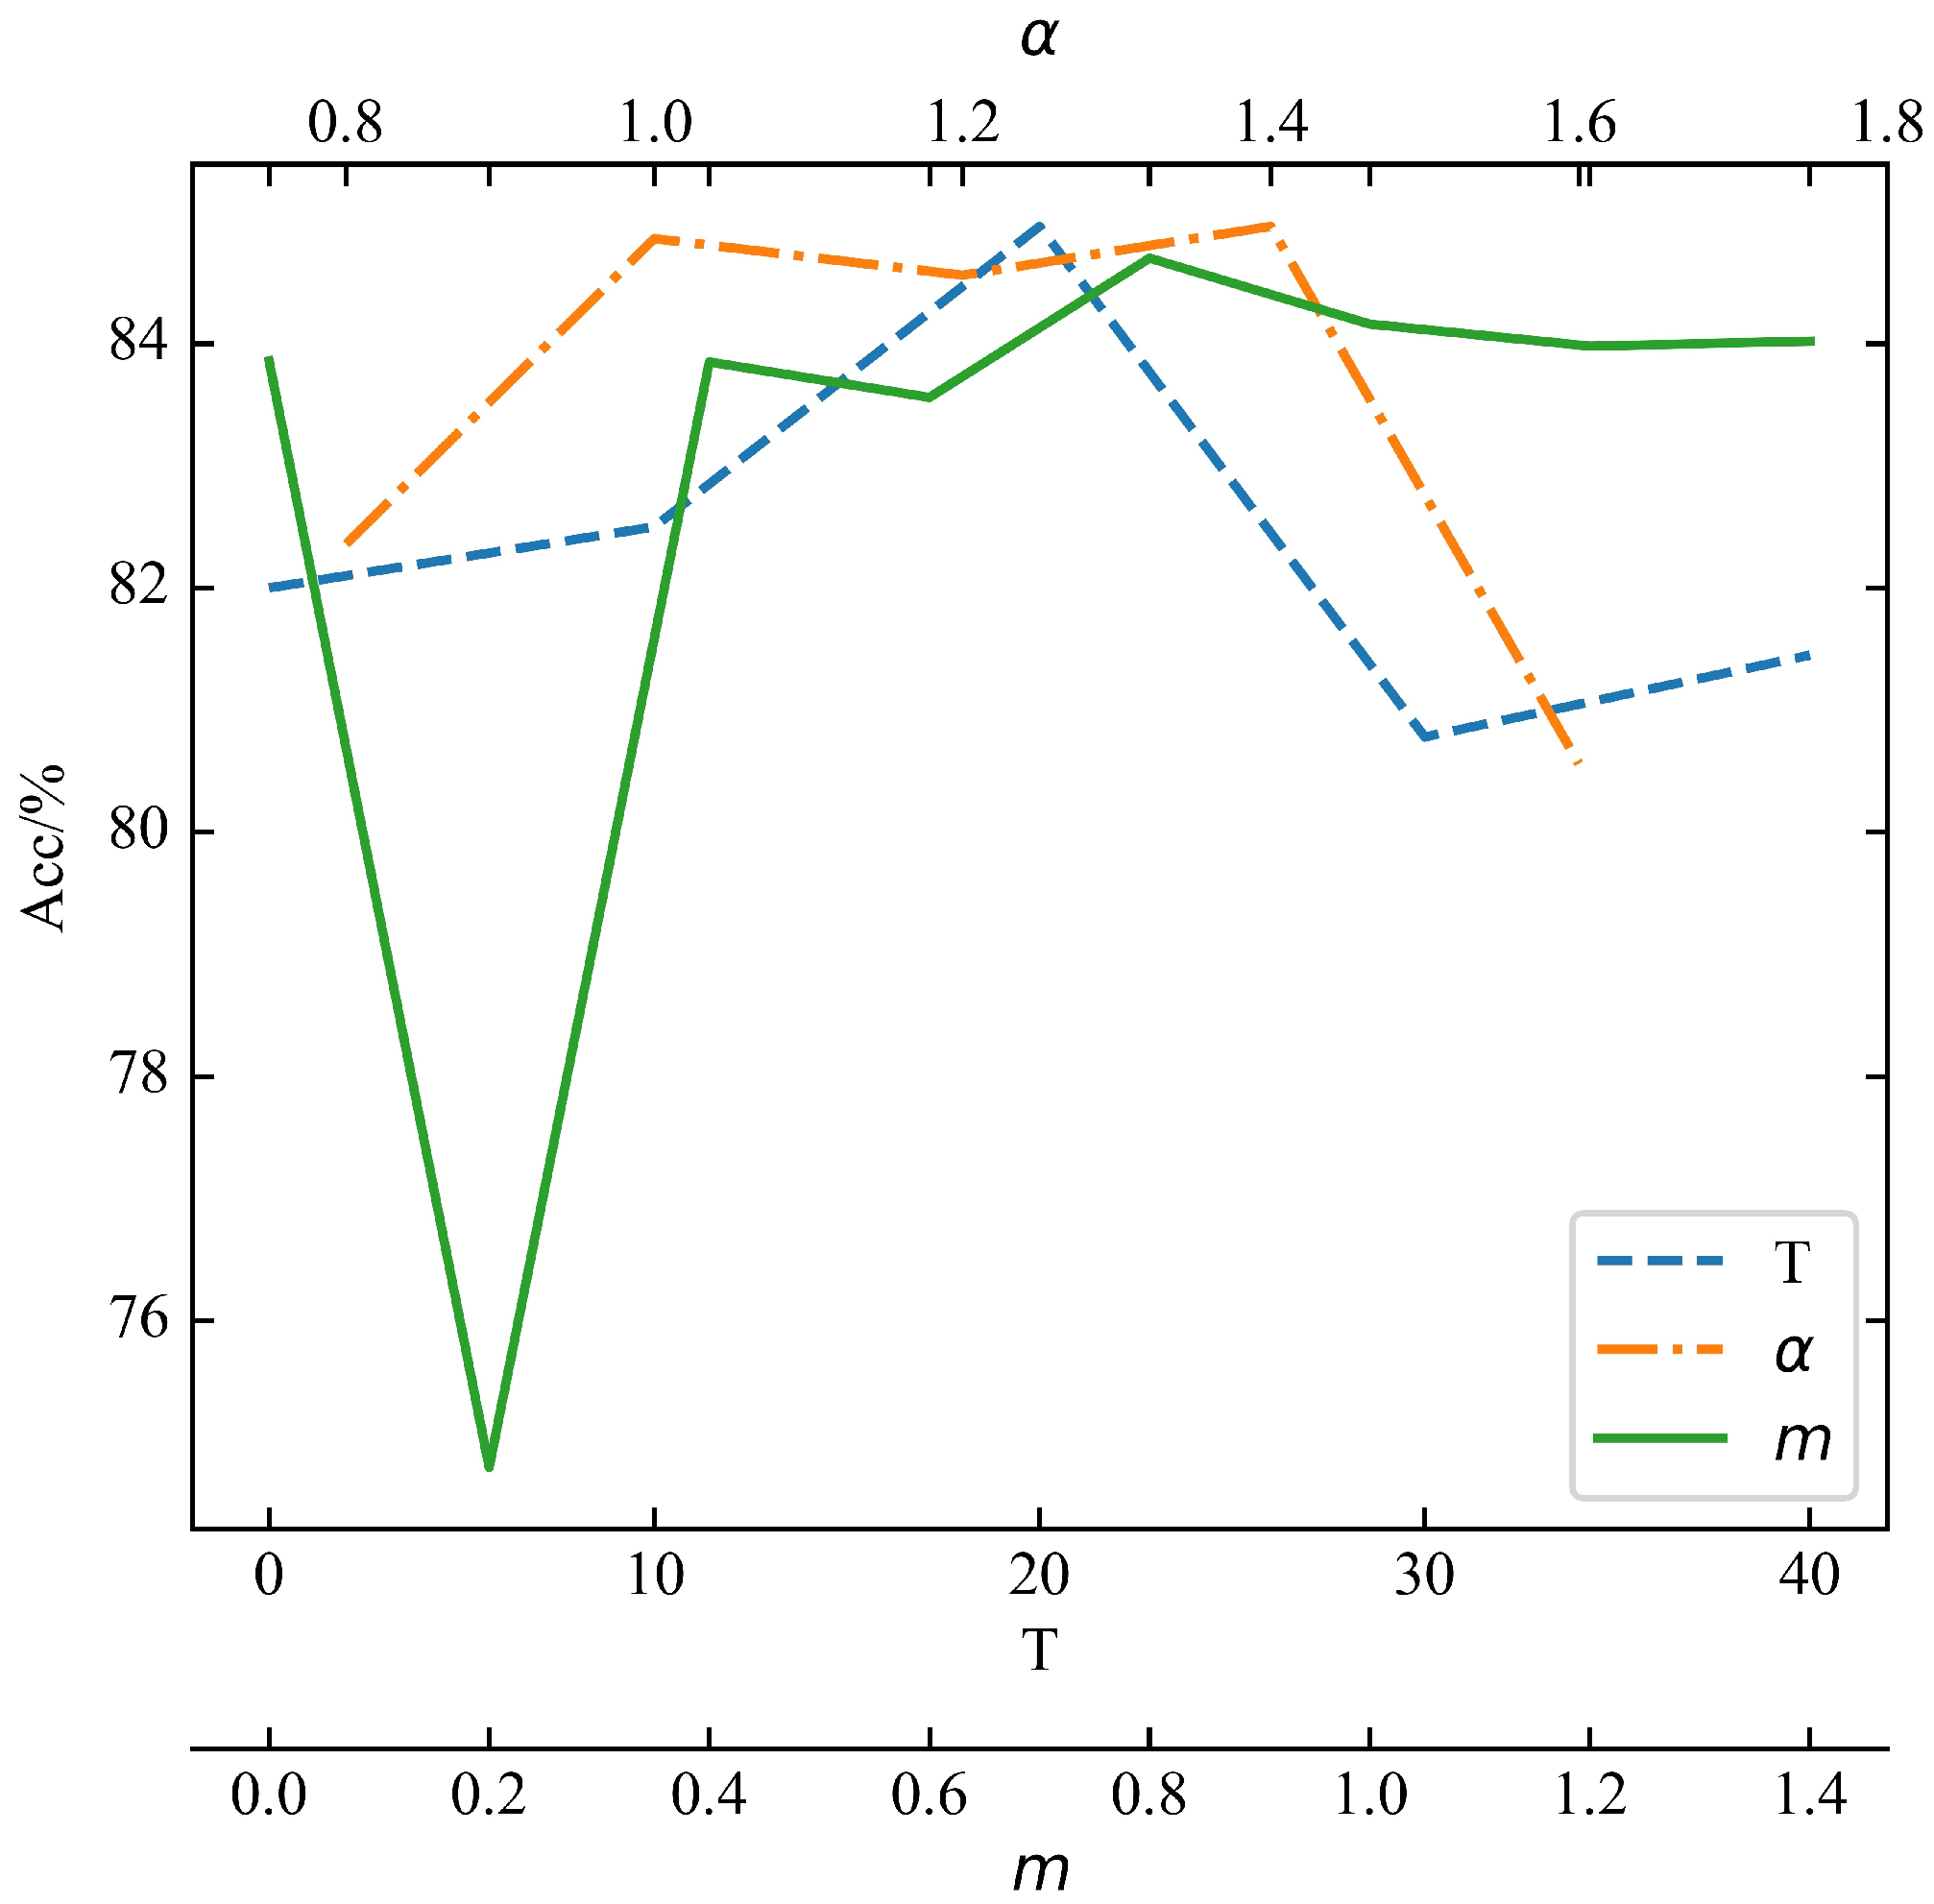
4.2.1. Hyperparameters’ Searching
To find the optimal hyperparameters for ATCA-ODM model, we investigated the effect of the parameters , m and T on the model performance. When focusing on one parameter, only the value of that parameter changes, and the other two parameters have fixed values. The results of the experimental results are shown in Figure 8. It can be observed from Figure 8 that ATCA-ODM model can achieve satisfactory accuracy with , so we set in all experiments.
4.2.2. Performance Verification
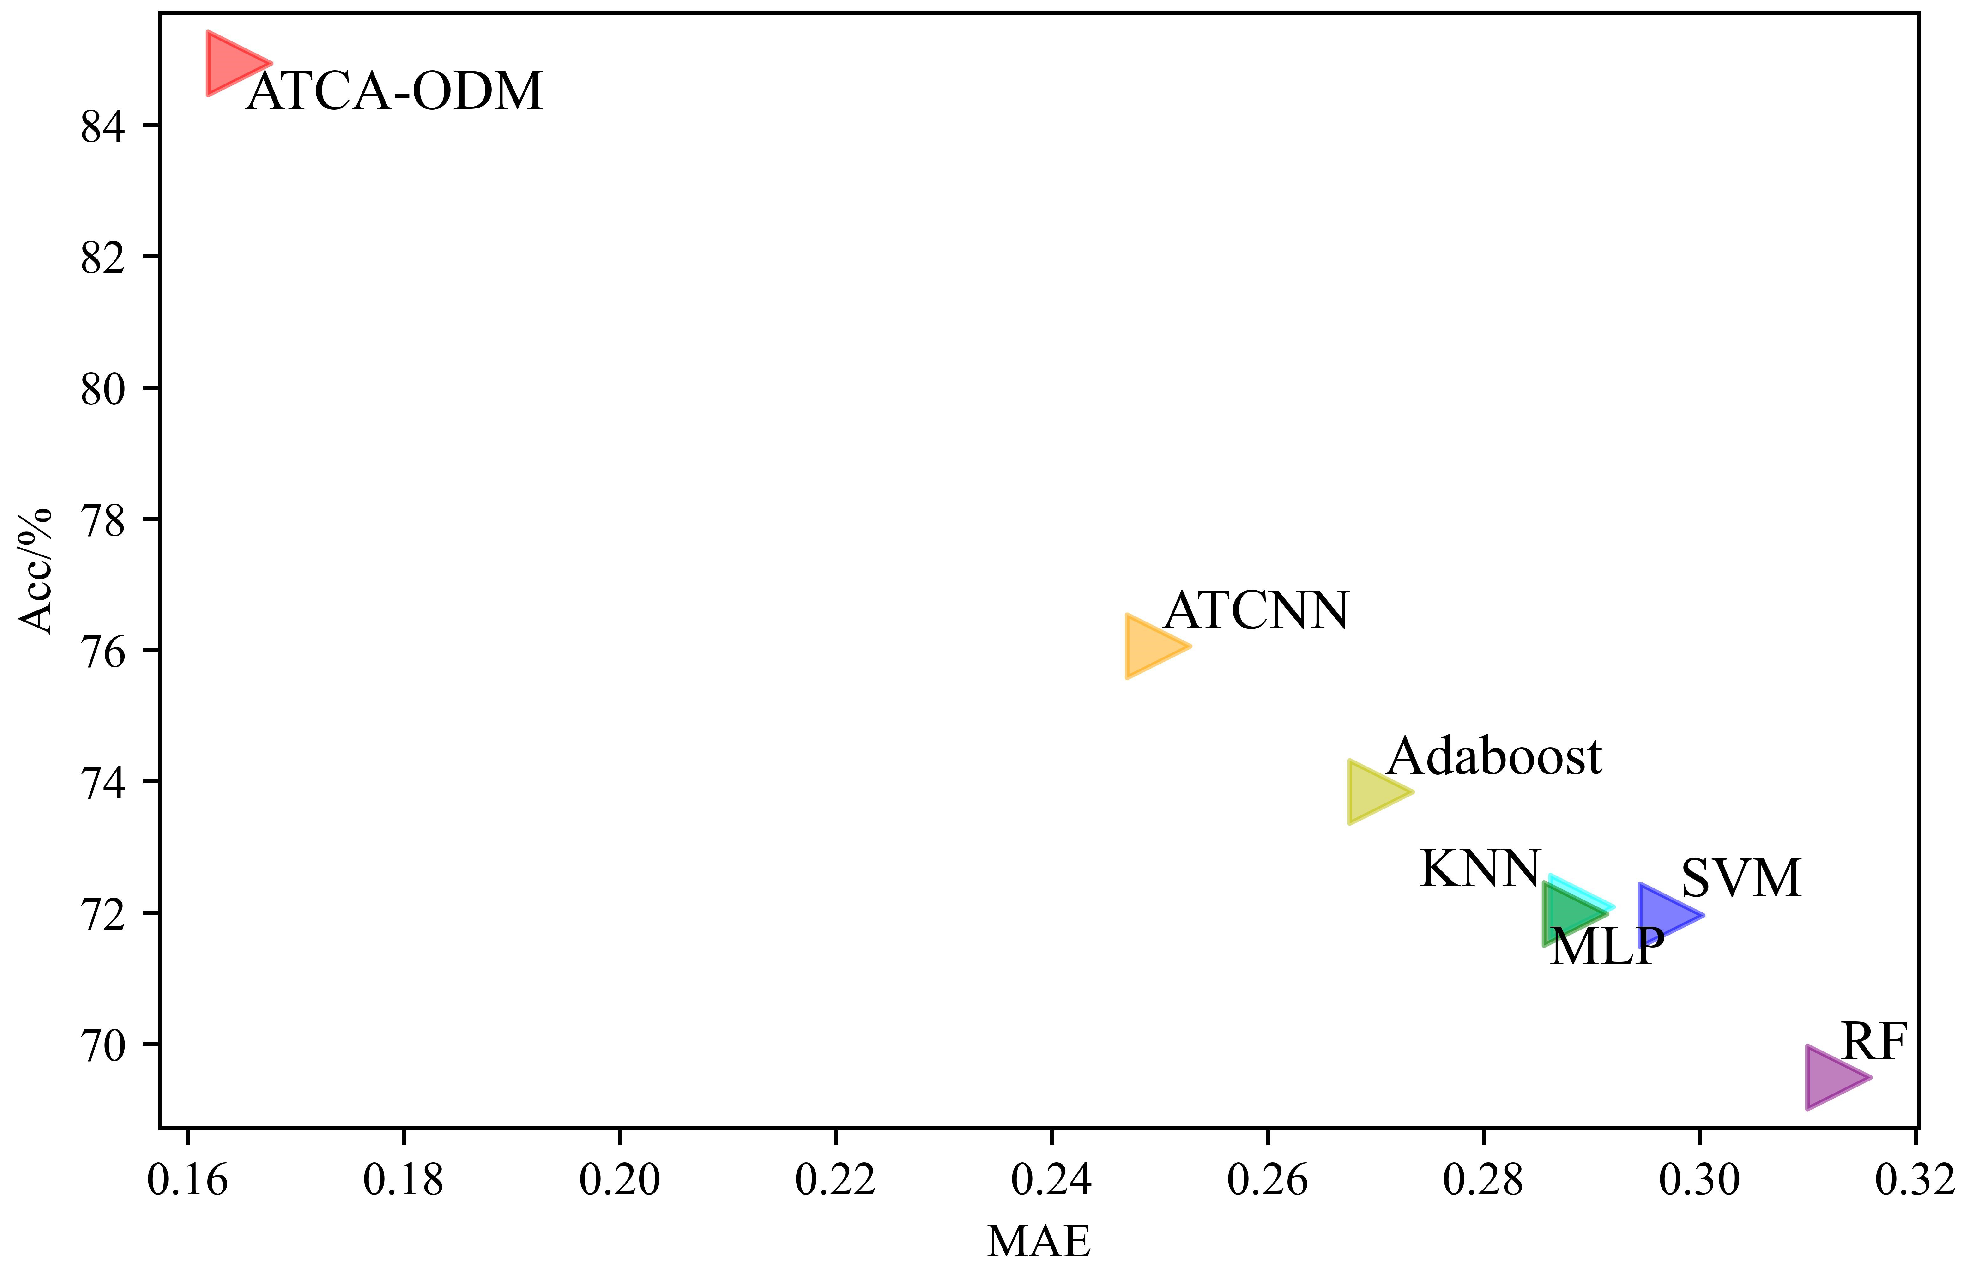
To verify the performance of ATCA-ODM method, we compared its assessment accuracy with that of the other six methods. The results are shown in Figure 9. ATCNN [9] is the first image-based air traffic complexity assessment method and can be regarded as the baseline of our method. Meanwhile, the other five methods, Adaboost [21], KNN [22], MLP [23], SVM [24] and RF [25] are traditional machine learning algorithms which can only use the numerical type datasets corresponding to the air traffic images used by ATCA-ODM and ATCNN.
As can be observed in Figure 9, two image-based methods achieve better accuracy and mean absolute error (MAE) compared to the five traditional machine learning algorithms, which indicates that deep learning is able to extract more valuable deep features from images. ATCA-ODM has better performance than ATCNN with an accuracy improvement of more than 10%, which indicates that ATCA-ODM better measures the distances between images, so that samples of different classes in the embedding space can be separated more accurately.
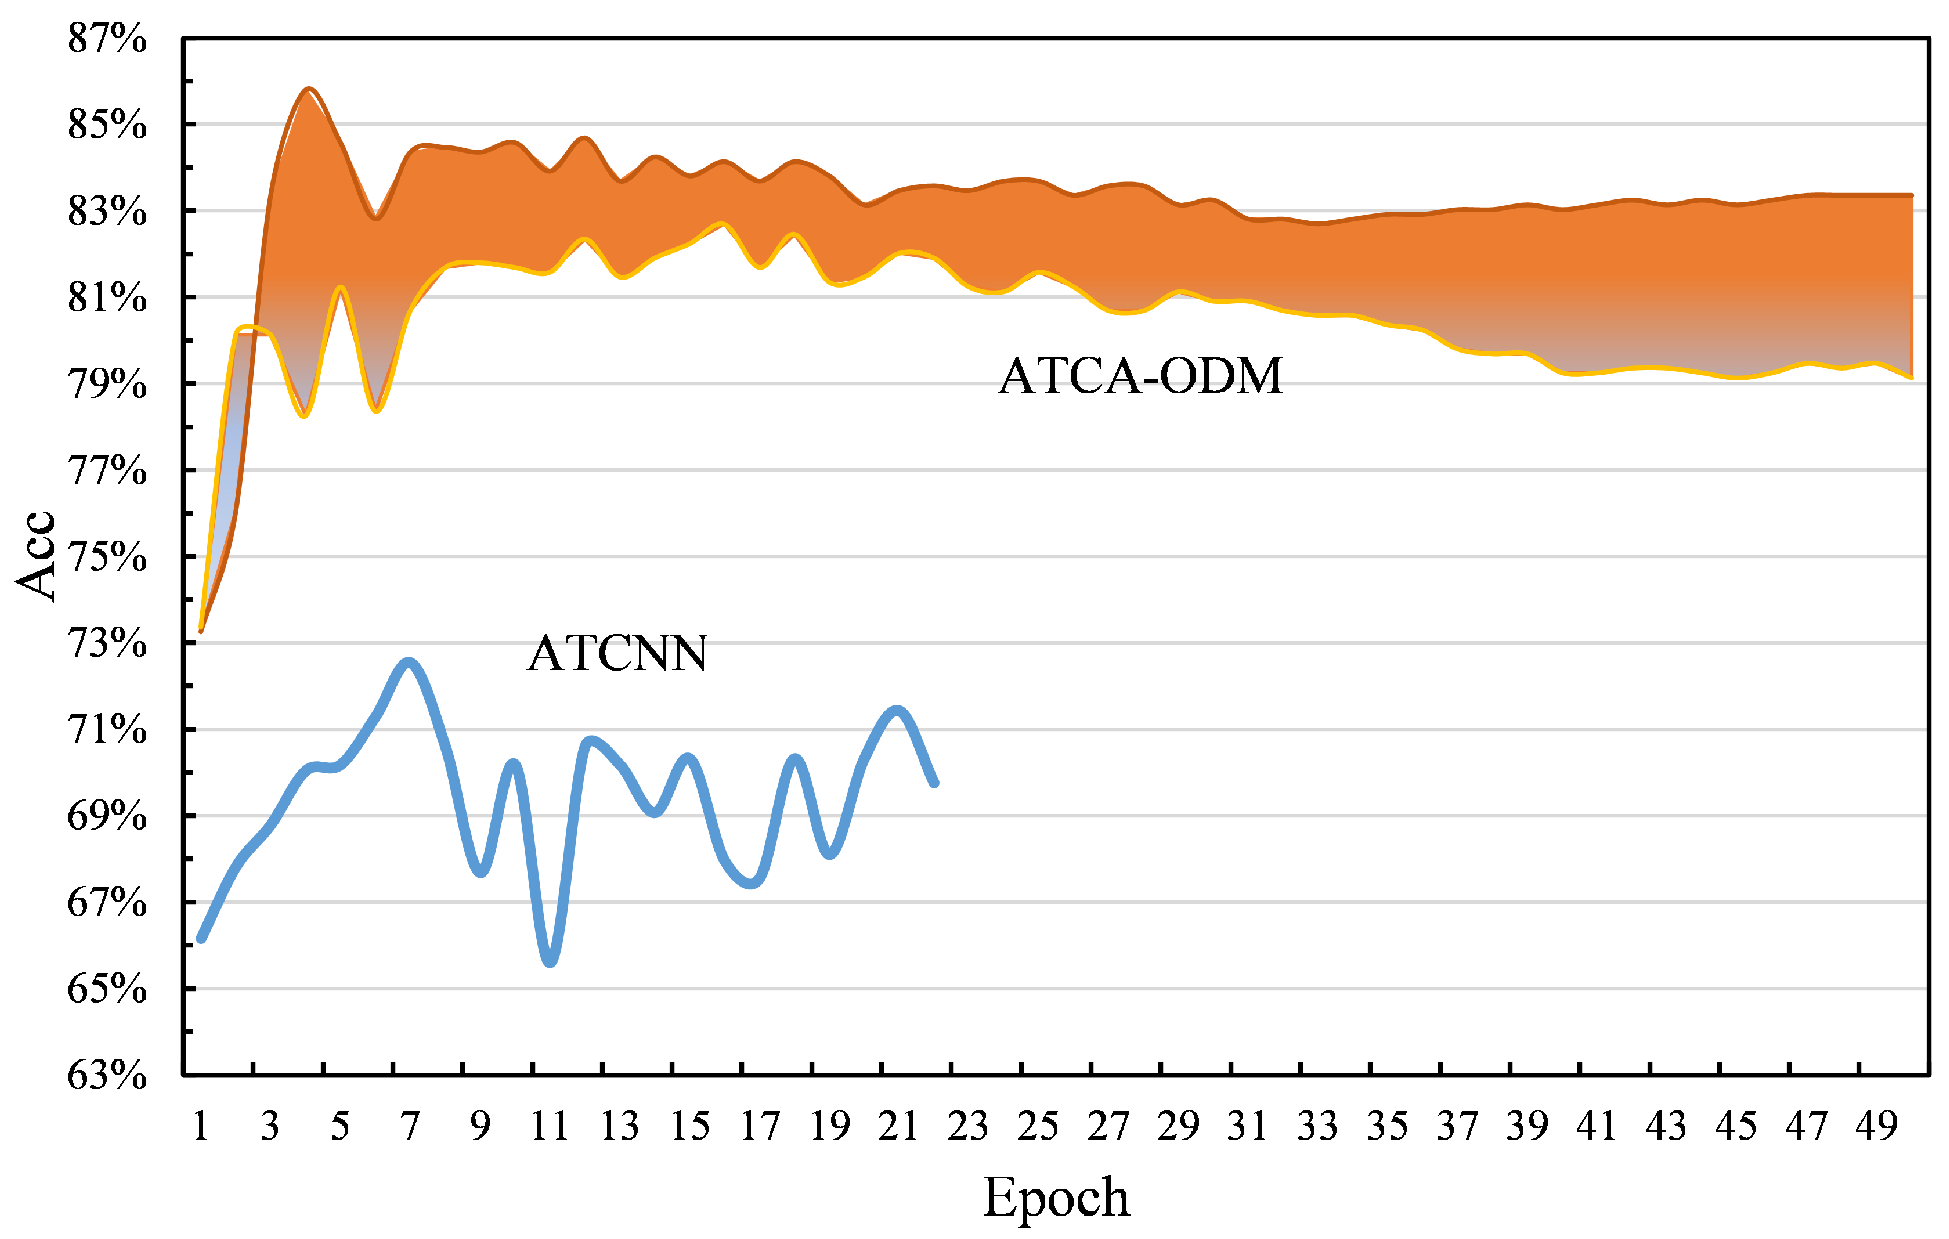
Furthermore, we compared ATCA-ODM method with ATCNN method, and the results are shown in Figure 10. The orange area in the figure is the variation range of the assessment accuracy of ATCA-ODM method, and its upper curve is the best accuracy and the lower curve is the general accuracy. The blue curve in the figure is the accuracy of the ATCNN method.
As can be observed from Figure 10, although the ATCNN method can obtain its highest accuracy of about 72%, the accuracy is unstable, which indicates that it may be difficult to achieve satisfactory recognition results on the air traffic images by simply using a model such as CNN, and the addition of deep metric can dramatically improve its performance.
4.2.3. Ablation Experiments
We investigated the effects of interclass and intracluster losses on the assessment accuracy of ATCA-ODM using an ablation experiment, and the results are shown in Table 1.
As can be observed from Table 1, both intracluster and interclass loss can improve the assessment accuracy of our method, with the latter having a more significant effect. The best results are achieved when both are used in the model. This indicates that the loss function defined in this paper based on the characteristics of air traffic images can effectively improve the performance of the deep metric learning algorithm.
5. Conclusions
In this paper, we propose a deep metric learning-based air traffic complexity assessment method, ATCA-ODM. We designed a loss function that considers the local orderliness of air traffic images to construct a deep metric learning algorithm. This loss function distinguishes more accurately between samples of the same class and samples of different classes by calculating the intracluster and interclass losses of the samples. We conducted several experiments on historical traffic images of the south-central airspace of China to verify the effectiveness of the proposed loss function and assessment method. The experimental results demonstrate that our proposed ATCA-ODM method outperforms other methods and can significantly improve the accuracy of air traffic complexity assessment. In the future, we we hope to verify our method on more real air traffic data.
Author Contributions
Conceptualization, H.C.; methodology, H.C., L.Z. and W.Z.; software, L.L.; formal analysis, L.Z. and L.L.; investigation, H.C. and L.Y.; resources, H.C. and W.Z.; data curation, L.L.; writing—original draft preparation, L.Z. and L.L.; writing—review and editing, H.C., L.Z. and L.Y.; supervision, H.C. and L.Y.; project administration, H.C.; funding acquisition, L.Y. All authors have read and agreed to the published version of the manuscript.
Funding
This paper is supported by Postgraduate Research & Practice Innovation Program of NUAA (xcxjh20221618).
Institutional Review Board Statement
Not applicable.
Informed Consent Statement
Not applicable.
Data Availability Statement
Not applicable.
Acknowledgments
We would like to thank the National Air Traffic Control Flight Flow Management Technology Key Laboratory of Nanjing University of Aeronautics and Astronautics for providing the data used in the model tests described in this paper.
Conflicts of Interest
The authors declare no conflict of interest.
References
- Orasanu, J.; Parke, B.; Kraft, N.; Tada, Y.; Hobbs, A.; Anderson, B.; Dulchinos, V. Evaluating the Effectiveness of Schedule Changes for Air Traffic Secrvice (Ats) Providers: Controller Alertness and Fatigue Monitoring Study; Technical Report; US Department of Transportation, Federal Aviation Administration: Washington, DC, USA, 2012.
- Delahaye, D.; García, A.; Lavandier, J.; Chaimatanan, S.; Soler, M. Air traffic complexity map based on linear dynamical systems. Aerospace 2022, 9, 230. [Google Scholar] [CrossRef]
- Gutiérrez Teuler, G.; Arnaldo Valdés, R.M.; Gómez Comendador, V.F.; López de Frutos, P.M.; Rodríguez Rodríguez, R. Study of the impact of traffic flows on the atc actions. Aerospace 2022, 9, 467. [Google Scholar] [CrossRef]
- Cao, X.; Zhu, X.; Tian, Z.; Chen, J.; Wu, D.; Du, W. A knowledge-transfer-based learning framework for airspace operation complexity evaluation. Transp. Res. Part C Emerg. Technol. 2018, 95, 61–81. [Google Scholar] [CrossRef]
- Djokic, J.; Lorenz, B.; Fricke, H. Air traffic control complexity as workload driver. Transp. Res. Part C Emerg. Technol. 2010, 18, 930–936. [Google Scholar] [CrossRef]
- Delgado-Aguilera Jurado, R.; Gómez Comendador, V.F.; Zamarreño Suárez, M.; Pérez Moreno, F.; Verdonk Gallego, C.E.; Arnaldo Valdés, R.M. Assessment of potential conflict detection by the atco. Aerospace 2022, 9, 522. [Google Scholar] [CrossRef]
- Xiao, M.; Zhang, J.; Cai, K.; Cao, X. Atcem: A synthetic model for evaluating air traffic complexity. J. Adv. Transp. 2016, 50, 315–325. [Google Scholar] [CrossRef] [Green Version]
- Andraši, P.; Radišić, T.; Novak, D.; Juričić, B. Subjective air traffic complexity estimation using artificial neural networks. Promet-Traffic Transp. 2019, 31, 377–386. [Google Scholar] [CrossRef] [Green Version]
- Xie, H.; Zhang, M.; Ge, J.; Dong, X.; Chen, H. Learning air traffic as images: A deep convolutional neural network for airspace operation complexity evaluation. Complexity 2021, 2021, 6457246. [Google Scholar] [CrossRef]
- Gianazza, D. Forecasting workload and airspace configuration with neural networks and tree search methods. Artif. Intell. 2010, 174, 530–549. [Google Scholar] [CrossRef] [Green Version]
- Netjasov, F.; Janić, M.; Tošić, V. Developing a generic metric of terminal airspace traffic complexity. Transportmetrica 2011, 7, 369–394. [Google Scholar] [CrossRef]
- Delahaye, D.; Puechmorel, S. Air traffic complexity based on dynamical systems. In Proceedings of the 49th IEEE Conference on Decision and Control (CDC), Atlanta, GA, USA, 15–17 December 2010; pp. 2069–2074. [Google Scholar]
- Zhu, X.; Cao, X.; Cai, K. Measuring air traffic complexity based on small samples. Chin. J. Aeronaut. 2017, 30, 1493–1505. [Google Scholar]
- Kim, S.; Seo, M.; Laptev, I.; Cho, M.; Kwak, S. Deep metric learning beyond binary supervision. In Proceedings of the IEEE/CVF Conference on Computer Vision and Pattern Recognition, Long Beach, CA, USA, 15–20 June 2019; pp. 2288–2297. [Google Scholar]
- Dubey, A.; Santra, A.; Fuchs, J.; Lübke, M.; Weigel, R.; Lurz, F. A bayesian framework for integrated deep metric learning and tracking of vulnerable road users using automotive radars. IEEE Access 2021, 9, 68758–68777. [Google Scholar] [CrossRef]
- Wang, F.; Liu, H. Understanding the behaviour of contrastive loss. In Proceedings of the IEEE/CVF Conference on Computer Vision and Pattern Recognition, Nashville, TN, USA, 19–25 June 2021; pp. 2495–2504. [Google Scholar]
- Zhang, M.; Cheng, Q.; Luo, F.; Ye, L. A triplet nonlocal neural network with dual-anchor triplet loss for high-resolution remote sensing image retrieval. IEEE J. Sel. Top. Appl. Earth Obs. Remote Sens. 2021, 14, 2711–2723. [Google Scholar] [CrossRef]
- Teh, E.W.; DeVries, T.; Taylor, G.W. Proxynca++: Revisiting and revitalizing proxy neighborhood component analysis. In Proceedings of the European Conference on Computer Vision, Glasgow, UK, 23–28 August 2020; Springer: Cham, Switzerland, 2020; pp. 448–464. [Google Scholar]
- Kim, S.; Kim, D.; Cho, M.; Kwak, S. Proxy anchor loss for deep metric learning. In Proceedings of the IEEE/CVF Conference on Computer Vision and Pattern Recognition, Seattle, WA, USA, 14–19 June 2020; pp. 3238–3247. [Google Scholar]
- Loshchilov, I.; Hutter, F. Decoupled weight decay regularization. In Proceedings of the International Conference on Learning Representations, Vancouver, BC, Canada, 30 April–3 May 2018. [Google Scholar]
- Hastie, T.; Rosset, S.; Zhu, J.; Zou, H. Multi-class adaboost. Stat. Its Interface 2009, 2, 349–360. [Google Scholar] [CrossRef] [Green Version]
- Zhang, S.; Li, X.; Zong, M.; Zhu, X.; Cheng, D. Learning k for knn classification. ACM Trans. Intell. Syst. Technol. (TIST) 2017, 8, 1–19. [Google Scholar] [CrossRef] [Green Version]
- Taud, H.; Mas, J. Multilayer perceptron (mlp). In Geomatic Approaches for Modeling Land Change Scenarios; Springer: Berlin/Heidelberg, Germany, 2018; pp. 451–455. [Google Scholar]
- Noble, W.S. What is a support vector machine? Nat. Biotechnol. 2006, 24, 1565–1567. [Google Scholar] [CrossRef]
- Breiman, L. Random forests. Mach. Learn. 2001, 45, 5–32. [Google Scholar] [CrossRef]
Figure 1.
Illustration of single channel air traffic images. Five consecutive images from two classes. Among them, (a,b) are the same class, (c–e) are the same class.
Figure 1.
Illustration of single channel air traffic images. Five consecutive images from two classes. Among them, (a,b) are the same class, (c–e) are the same class.

Figure 2.
Illustration of interclass loss.

Figure 3.
Illustration of division of clusters.

Figure 4.
Illustration of intracluster loss.

Figure 5.
Illustration of the effect of ordered loss.

Figure 6.
Framework of ATCA-ODM.

Figure 7.
Structure of the target airspace.

Figure 8.
Result of hyperparameters’ searching.

Figure 9.
Acc and MAE of 7 different methods.

Figure 10.
Acc comparison between ATCA-ODM and ATCNN.


Table 1.
Ablation experiment results.
| Model | Acc | MAE | F1 |
|---|---|---|---|
| GoogleNet | 72.06% | 0.3328 | 70.23% |
| GoogleNet + Intracluster loss | 74.47% | 0.2874 | 74.60% |
| GoogleNet + Interclass loss | 84.54% | 0.1648 | 84.44% |
| GoogleNet + ODM | 85.34% | 0.1631 | 85.40% |
Publisher’s Note: MDPI stays neutral with regard to jurisdictional claims in published maps and institutional affiliations. |
© 2022 by the authors. Licensee MDPI, Basel, Switzerland. This article is an open access article distributed under the terms and conditions of the Creative Commons Attribution (CC BY) license (https://creativecommons.org/licenses/by/4.0/).
Share and Cite
MDPI and ACS Style
Chen, H.; Zhang, L.; Yuan, L.; Zhu, W.; Liu, L. Air Traffic Complexity Assessment Based on Ordered Deep Metric. Aerospace 2022, 9, 758. https://doi.org/10.3390/aerospace9120758
AMA Style
Chen H, Zhang L, Yuan L, Zhu W, Liu L. Air Traffic Complexity Assessment Based on Ordered Deep Metric. Aerospace. 2022; 9(12):758. https://doi.org/10.3390/aerospace9120758
Chicago/Turabian StyleChen, Haiyan, Linghui Zhang, Ligang Yuan, Weiqi Zhu, and Li Liu. 2022. "Air Traffic Complexity Assessment Based on Ordered Deep Metric" Aerospace 9, no. 12: 758. https://doi.org/10.3390/aerospace9120758
Note that from the first issue of 2016, this journal uses article numbers instead of page numbers. See further details here.