1. Introduction
It is well known that second language (L2) learners struggle to produce the sounds of their L2 in a native-like manner and research shows that this is largely due to the influence of their native language (L1) on the L2. In fact, a number of theoretical models of speech perception such as the Perceptual Assimilation Model (PAM;
Best 1995) and the Second Language Linguistic Perception model (L2LP;
Escudero 2005) claim that a learner’s ability to produce L2 sounds faithfully is largely dependent on their ability to perceive differences between the target sounds. In other words, a listener speaks with a foreign accent because they are listening with a foreign accent.
Given that learners rely on their L1 knowledge in order to perceive and acquire L2 sounds, cross-linguistic difficulty is not uniform across speakers of different language and dialect backgrounds. Thus, speakers with differing L1 backgrounds will differ in their perception of the same L2 speech sounds. In fact, according to the L2LP model (
Escudero 2005;
van Leussen and Escudero 2015), a learner’s L2 perceptual patterns and difficulties are dependent on the cross-linguistic acoustic similarity between both the L1 dialect and the target L2. This suggests that difficulties in L2 speech perception are not necessarily language specific, but rather, dialectally specific. This claim that L2 perceptual patterns differ according to the native dialect is supported in a number of studies. For example, Moravian and Bohemian Czech listeners showed differential perceptual assimilation patterns of Dutch which seemed to correspond to differences in the acoustic realizations of their vowels in their native dialect (
Chládková and Podlipský 2011). Likewise,
Escudero and Williams (
2012) showed that differences in the acoustic realizations of Iberian and Peruvian Spanish vowels led to differences in their discrimination accuracy of some Dutch vowel contrasts. In particular, Iberian Spanish learners had higher accuracy scores when perceiving differences in the Dutch /a/–/ɑ/ contrast. The authors explain that this finding is due to the fact that both vowels in the Dutch contrast are acoustically similar to one single native category in Peruvian Spanish, making them difficult to distinguish. However, these same two Dutch vowels were acoustically similar to two separate vowel categories in Iberian Spanish, which is likely to have influenced their overall higher accuracy when discriminating the vowels in this contrast.
Since differences in L2 speech perception are found in speakers of the same language but from different dialects, it should likewise be expected that speakers will differ in their perception of a language spoken in two different dialects. For example,
Escudero and Boersma (
2004) showed that Spanish listeners acquire the English /i/–/ɪ/ in different ways, depending on the target dialect they were learning, specifically, Scottish English and Southern-British English. Furthermore,
Escudero and Chládková (
2010) investigated Peruvian Spanish listeners’ categorization of American English (AmE) and Standard Southern-British English (SSBE) vowels. The authors successfully predicted that the Peruvian listeners would categorize some AmE and SSBE vowels differently based on how those vowels compared acoustically to Peruvian Spanish. The authors concluded that based on the perceptual differences between the two English dialects, their perceptual development in each variety would likely differ. In another study,
Baker and Smith (
2010) investigated the differences between the perception and production of French vowels by learners of European (EF) and Quebec French (QF). The authors noted that there was an additional acoustic cue in QF for the distinction of the /i/–/y/–/u/ vowel contrast and they were interested to see whether learners of QF would better distinguish between these vowels than EF learners for both dialects. The authors indeed found that the QF learners distinguished these three vowels better than EF learners and concluded that the L2 dialect that one is exposed to does affect how well a learner will perceive and produce certain vowels.
To contribute to the emerging body of findings showing that learning of an L2
1 is affected by the dialect to which one is exposed, we investigated whether Californian English (CE) monolinguals and Spanish–English (SpE) bilinguals showed differences in their perception of Brazilian (BP) and European (EP) Portuguese vowels. BP and EP share a vowel system that contains seven oral vowels produced in a stressed position, namely /i, e, ɛ, a, ɔ, o, u/, which are described acoustically in
Escudero et al. (
2009a). Californian English is said to have 10 steady-state vowels, namely, /i, ɪ, e, ɛ, æ, ʌ, ɑ, o ʊ, u/ (
Ladefoged 1999), while Mexican Spanish consists of only five steady-state vowels, /i, e, a, o, u/ (
Díaz Granado 2011). We chose Portuguese as the target language, because it is relatively understudied in the field of cross-linguistic speech perception. Although the authors of the study previously contributed to this field with regards to the investigation of Brazilian Portuguese, there remains a gap in the investigation of cross-linguistic influences on the perception of European Portuguese. Our choice to include bilingual participants is motivated by the fact that many studies show differences in bilingual versus monolingual language processing, including speech processing (see (
Kroll and Bialystok 2013) for a review). Therefore, examining the differences in bilingual vs. monolingual speech perception and processing in the scope of the L2LP model not only adds information to the model itself, but also to the research on the bilingual advantage. We also chose these specific languages because Portuguese presents an interesting scenario for our language groups in that its vowel inventory falls in between Californian English and Mexican Spanish in regards to its size. Studies such as Iverson and
Evans (
2007,
2009) claim that learners with a larger vowel inventory than the target language should be better able to perceive the L2 contrasts than those whose native vowel inventory is smaller than the target language. However, some studies (e.g.,
Elvin et al. 2014;
Elvin 2016;
Alispahic et al. 2017) found that this is not always the case. Therefore, we are interested in investigating the effect of the two vowel systems of differing sizes on bilinguals’ vowel perception in addition to determining whether their results are comparable to those of monolinguals.
In order to predict CE and SpE listeners’ perception of BP and EP, the L2LP model recommends a thorough cross-linguistic acoustic analysis of how the vowels in each L2 dialect compare to the vowels produced in the listeners’ native dialect. All of the participants in this study were either Californian English monolingual or Mexican Spanish–English bilingual speakers from the Central Valley (California, USA). Ideally, acoustic comparisons should be based on the listener’s own native productions to ensure the most accurate predictions (
Escudero 2005;
Elvin et al. 2016a); however, in the absence of such data, researchers can turn to acoustic studies of the native and target dialects with published formant values to make preliminary predictions. Given that there are no published studies with formant values for Californian English from the Central Valley, we used the published formant values of Southern-Californian English vowels presented in
Hagiwara (
1997). We also refer to a study conducted by
Grijalva et al. (
2013) which, in addition to describing the acoustic space of Southern-Californian English and Mexican Spanish, also provides formant values for Mexican Spanish spoken by bilingual Spanish–English speaker
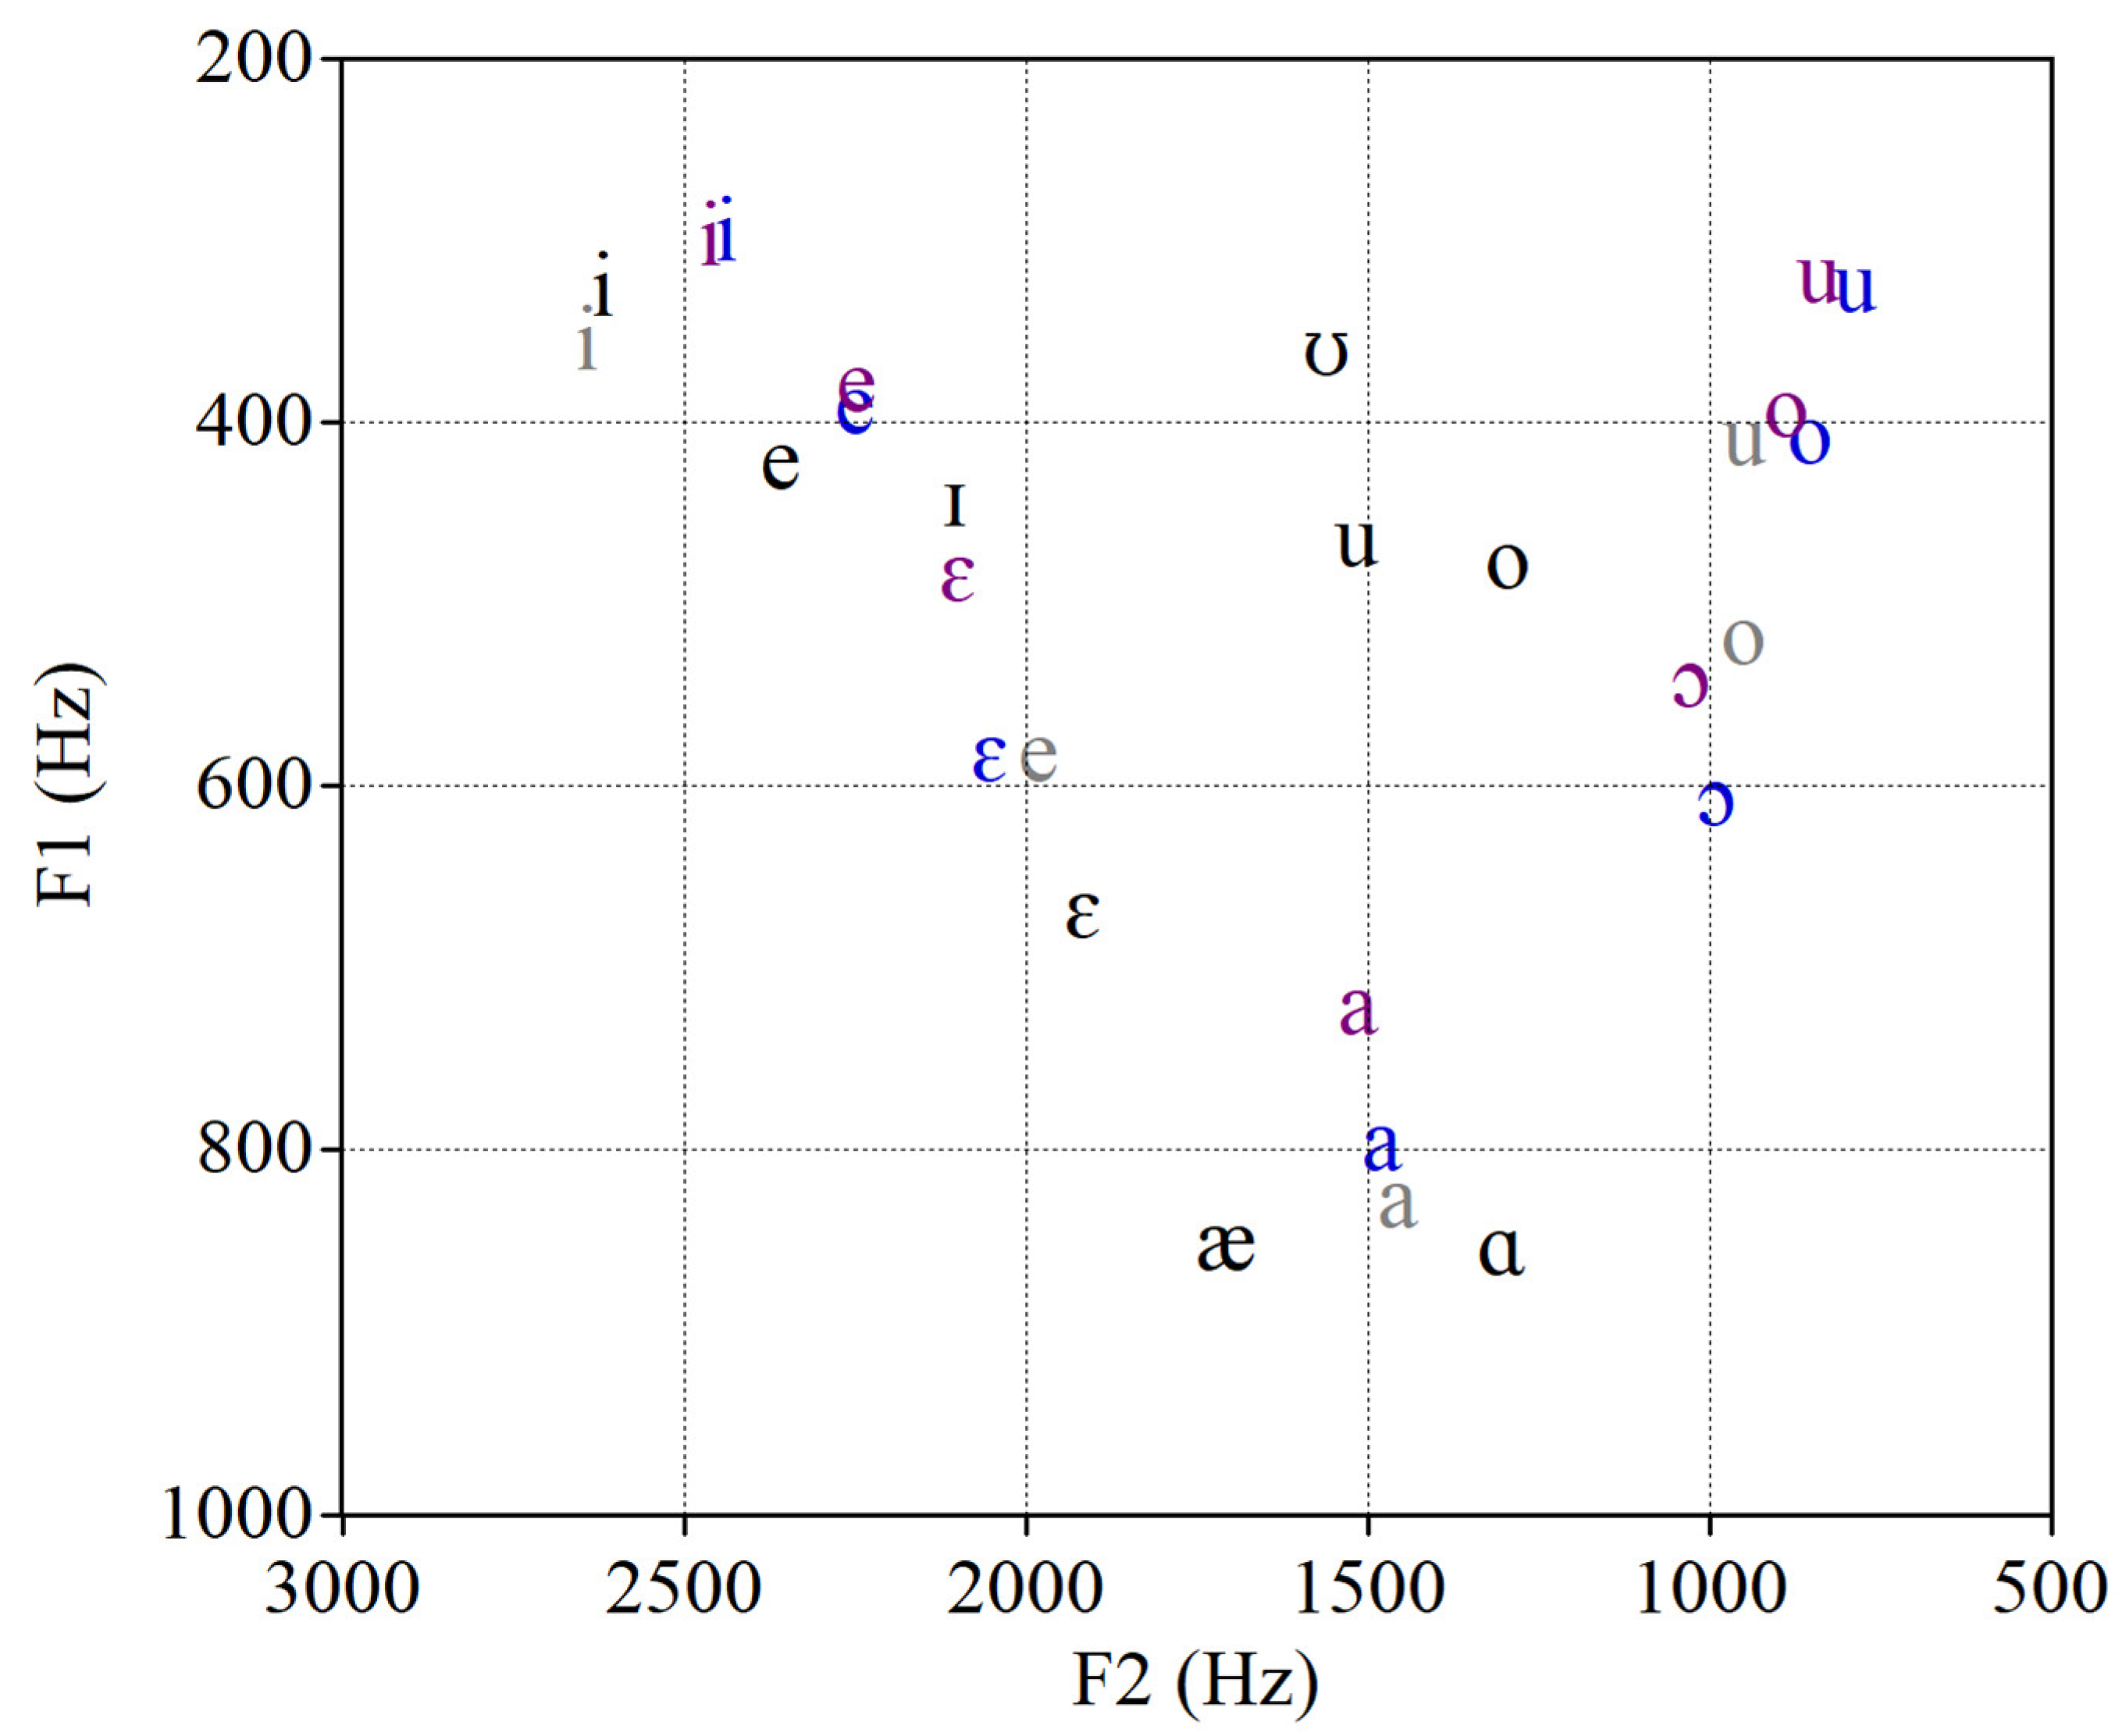
2. A visual plot of vowels produced in Southern-Californian English (
Hagiwara 1997), Mexican Spanish produced by Spanish–English bilinguals (
Grijalva et al. 2013), and Brazilian and European Portuguese (
Escudero et al. 2009a) is shown in
Figure 1. The speakers in
Hagiwara’s (
1997) study were 15 (six male) Southern-Californian English speaking monolinguals aged between 18 and 26. The vowels were extracted from words produced in the /bVt/, /tVk/, and /hVd/ consonantal contexts produced in a carrier phrase. The Spanish vowels from the
Grijalva et al. (
2013) study were extracted from words in a pVso context produced in a carrier phrase by 11 (three male) Mexican Spanish–English bilingual students from the University of California, San Diego. Finally, we refer to the formant values of BP and EP reported in (
Escudero et al. 2009a), from which the stimuli for the present perception study were selected. The vowels were produced in a disyllabic CVCV, surrounded by two identical voiceless stops or fricatives (/p, t, k, f, s/), in a carrier phrase. These tokens were produced by 20 BP speakers from São Paulo and 20 EP speakers from Lisbon.
Visual inspection of the vowels plotted in
Figure 1 shows that, as reported in
Escudero et al. (
2009a), many of the vowels in BP and EP are acoustically similar to each other. However, we do observe that EP /a/ and /ɔ/ are acoustically higher than their BP counterparts. We further observe that the lower-mid vowel /ɛ/ is higher in EP than it is in BP, and it is, in fact, closer to EP /e/ than what was observed in BP as previously reported by
Escudero et al. (
2009a). The authors suggested that this may indicate a future merger of EP /e/ and /ɛ/. The fact that the vowels in the EP /e/–/ɛ/ contrast are acoustically closer than their BP counterpart may make this contrast more difficult to perceive in EP. A visual inspection of the acoustic plotting of the vowel space in BP and EP also shows that /o/ and /u/ in both dialects are produced in close proximity to one another which may make this contrast difficult to discriminate in both dialects. Escudero and colleagues further claim that, on average, BP vowels were produced with longer duration than EP vowels and this may make BP contrasts easier than EP contrasts to discriminate.
Turning to the cross-linguistic comparison of Southern-Californian-English vowels and Mexican-Spanish vowels to BP and EP, we can visually observe that, for the most part, Mexican-Spanish vowels are acoustically closer to both BP and EP than the Southern-Californian-English vowels. Our cross-linguistic comparison of the vowels seems to indicate that /i/ in both BP and EP is acoustically similar to the Southern-Californian-English /i/, whereas BP and EP /e/ seems to be acoustically similar to the Southern-Californian-English /ɪ/ and /e/ vowels. We can also observe that the Mexican-Spanish /i/ seems to fall between the BP and EP /i/ and /e/ vowels, which may make this contrast difficult for bilinguals to perceive if Spanish is activated. The same seems to be true for BP and EP /o/ and /u/ where there is a corresponding vowel that is acoustically similar in English, but the Mexican-Spanish /u/ is acoustically similar to BP and EP /o/ and is also the closest vowel to BP and EP /u/. For the BP and EP /ɛ/, the closest Southern-Californian-English vowel is /ɛ/ and the closest Mexican-Spanish vowel is /e/. However, it is worth noting that the Southern-Californian /ɛ/ and Mexican-Spanish /e/ vowels are acoustically closer to BP /ɛ/ than EP, and that may result in more consistent categorization of this vowel in BP than in EP. Furthermore, the Mexican-Spanish /a/ is acoustically closer to BP /a/ than it is to EP, and we also observe that the Mexican-Spanish /o/ is acoustically closer to EP /ɔ/ than BP. Interestingly, there appear to be no Southern-Californian-English vowels that are acoustically similar to either BP or EP /ɔ/, and therefore, monolinguals may be more inconsistent with their categorization of this vowel in both dialects.
In sum, our preliminary cross-linguistic acoustic comparison seems to indicate that the Mexican-Spanish vowels as produced by Spanish–English bilinguals are acoustically more similar to the target BP and EP vowels. If the Spanish–English bilinguals in our study activate Spanish to perceive the BP and EP vowels, they may be more consistent in their categorization of vowels in both dialects compared to the English monolinguals. As a result, they may also outperform the monolinguals in their discrimination of the two dialects. However, activation of Spanish may also lead to more difficulty, in particular with the Portuguese /i/–/e/ and /o/–/u/ contrasts, given that both vowels in each contrast appear acoustically similar to a single Mexican-Spanish vowel. Furthermore, some vowel contrasts may be easier to perceive in BP than EP (e.g., /e/–/ɛ/) because BP vowels are longer than EP and some Southern-Californian-English and Mexican-Spanish vowels are acoustically more similar to BP than EP vowels.
Differences in acoustic measurements across dialects of the same language should impact how learners perceive and produce words in those languages. However, another factor which may influence how listeners perceive differences in speech may be linked to their language background. Specifically, bilinguals were shown to display advantages in the linguistic domain, including better learning of novel word forms (
Kaushanskaya and Marian 2009;
Kaushanskaya 2012;
Escudero et al. 2016). This may be the result of enhanced phonological short-term memory, allowing bilinguals greater flexibility in accessing and manipulating sound forms (e.g.,
Kaushanskaya 2012). However, bilinguals are also required to manipulate two languages, which may lead to competition between them and slower processing as that competition is resolved (e.g.,
Norris and McQueen 2008).
In phonemic perception, there is conflicting evidence about how bilinguals perform relative to monolinguals. Some studies show that bilinguals perform similarly to monolinguals in non-native vowel perception and production. French–English bilinguals performed similarly to English monolinguals in a vowel perception and production task, where they were asked to discriminate the English vowels /i/–/ɪ/ in an 11-step continuum (
Mack 1989). Because isolated vowels require less memory and have no semantic associations, they may behave similarly between monolinguals and bilinguals, even though bilinguals show advantages in linguistic processing tasks.
Werker (
1986) showed no difference between monolingual, bilingual, and trilingual listeners when they were tasked with discriminating non-native phonetic contrasts, suggesting that broad linguistic experience (e.g., being bilingual/trilingual vs. monolingual) does not confer an advantage when it comes to discriminating novel language contrasts. Instead, specific language experience helps; that is, participants with exposure and experience to the tested language performed better than bilinguals and trilinguals (
Werker 1986). Similarly, school-age French–English bilingual and English monolingual children showed no difference in discriminating non-native Russian phonemes (
Lambert and MacNamara 1969) even though this same task was used in
Rabinovitch and Parver (
1966) and their results showed that bilingual university students performed better than monolingual university students.
Gallardo del Puerto (
2007) showed that the degree of bilingualism (high vs. low use of both languages) does not affect non-native phoneme discrimination, and the author concludes that bilingualism does not affect non-native phonetic discrimination even though there was no comparison to monolingual data.
Other studies also show that broad linguistic experience does seem to play an important role in perceiving differences in non-native contrasts. For example, English monolingual adults compared with multilingual speakers on their discrimination of Japanese geminate consonants showed poorer performance
Enomoto (
1994). Additionally, there were two groups of multilingual speakers tested—one group had language-specific experience (i.e., spoke a language with gemination, such as Italian) and the other group did not. No differences in performance were found between these groups, suggesting that broad language experience helped more than specific-language experience. Similarly, French–English bilinguals performed better overall compared to English monolinguals when asked to discriminate contrasts native to French and non-native contrasts (not present in French or English) (
Cohen et al. 1967). A similar study examined school-aged children learning French and found that bilingually-instructed children tended to perform better than monolingually-instructed children on discrimination of native and non-native phonetic sequences, but this was not at the level seen in
Cohen et al. 1967) and
Davine et al. (
1971).
A recent study examined the difference in non-native phonetic perception and learning between bilingual and monolingual participants, specifically focusing on the ideas that bilinguals may have an easier time learning a third language due to cognitive advantages (see
Cenoz 2003) and that similarity between the already-known languages and the language to be learned may influence the perception and acquisition of non-native contrasts (
Antoniou et al. 2015). Mandarin–English bilingual and English monolinguals learned non-native contrasts that were similar to contrasts in either Mandarin or English (though none of them actually existed in either of those languages). The bilingual group was found to be more accurate in their learning compared to the monolinguals, giving support for the idea that bilinguals have a cognitive advantage in processing new language information. Importantly, this held up even when testing another bilingual group (Korean–English), but these results are also qualified by the similarity of the learned contrasts to the experimental groups’ native language (e.g., Korean–English bilinguals were better at learning the Korean-like contrasts) and by the overall difficulty of the contrast itself regardless of language background. Therefore, the bilingual advantage interacts with phonetic similarity and universal difficulty (
Antoniou et al. 2015).
It is commonly accepted that bilinguals and L2 speakers will process their second language or a new language through the lens of their L1 (e.g.,
Best and Tyler 2007;
Escudero 2005). The mechanisms and factors that underlie and influence this processing are outlined and debated in various models, including the PAM and L2LP. Here, we focus on the L2LP which explicitly outlines how the acoustic and perceptual similarities between the first and second (or foreign) languages shape how listeners will perceive phones in those languages. Additionally, the model claims that listeners’ perception of those phones will differ depending on the dialect to which they are exposed. This model is particularly useful for the current study because we expect that these naïve listeners’ perceptual assimilation of the non-native phones to their native language(s) will be influenced by the acoustic distance between the sounds in both target dialects and their native inventory. We expect to observe differences in the perceptual assimilation patterns of each dialect and will use these results to predict our listeners’ performance in the non-native discrimination task. Given that we are examining SpE bilinguals and CE monolinguals, we expect that the bilinguals may be better able to discriminate Portuguese phonemes because, according to the L2LP model, they have two separate vowel systems that could be activated to aid vowel perception. In particular, Spanish and Portuguese show a smaller acoustic distance between their vowel spaces (see
Elvin et al. 2014), and the Spanish–English bilinguals may rely on the Spanish vowel system when discriminating BP and EP vowels. However, we are also specifically interested in a perceptual difference between dialects, which has not yet been tested with bilinguals and monolinguals.
Thus, our study investigates the perception of BP and EP vowels by CE monolinguals and SpE bilinguals. Based on the acoustic differences shown in
Escudero et al. (
2009a) and, in particular, their finding that, on average, BP vowels show longer duration than EP vowels, we may see differences in categorization and discrimination between the dialects, such that participants are better at BP than EP vowels. Alternatively, if duration differences between the dialects do not affect categorization and discrimination, no dialect difference is expected. However, we do expect an interaction between dialect and vowel contrast because we also see some differences in vowel quality across the two dialects. This was most apparent with certain vowel contrasts (e.g., /e/–/ɛ/), and therefore, certain vowel contrasts may be perceived more accurately in BP compared to EP. Finally, we expect a bilingual advantage for the bilinguals given that Spanish vowels are acoustically closer to Portuguese vowels than English, as observed in
Figure 1, which may facilitate their discrimination of Portuguese vowels.
3. Results
3.1. Non-Native Categorization
In order to investigate whether listeners perceptually assimilate BP and EP vowels to different L1 categories, we conducted a non-native discrimination task. We used the results of the non-native categorization task to predict performance in the non-native discrimination task. The percentage of times each BP and EP vowel was categorized as a CE vowel is presented in
Table 2 for the monolinguals and
Table 3 for the bilinguals.
As can be observed in
Table 2, the CE monolingual participants categorized the majority of BP and EP vowels as more than one native CE vowel. In particular, monolingual listeners categorized both BP and EP /i/ as CE /i/ 60% and 66% of the times, with CE /ɪ/ as the second most commonly selected vowel (23% and 20%). Their categorization of BP and EP /e/ was spread across four CE vowels namely, /i/, /ɪ/, /e/, and /ɛ/. BP and EP /ɛ/ was predominately categorized as CE /ɛ/ (67% in BP and 63% in EP), with a smaller percentage categorized as CE /e/ (19% in BP and 16% in EP). Categorization of BP and EP /a/ was spread across CE /æ/, /ʌ/, and /ɑ/, with /æ/ being the most popular choice (54% in BP and 34% in EP). EP /o/ was most commonly categorized as CE / u/ (39%), followed by CE /o/ and / ʊ /. For BP /o/, categorization was spread across four categories, namely, /ɑ/, /o/, /ʊ/, and /u/, with CE /o/ having the higher percentage of categorization. BP and EP /ɔ/ were largely categorized as CE /ɑ/ (72% in BP and 53% in EP), followed by CE /o/, as well as CE /ʌ/ for EP. Finally, BP and EP /u/ was consistently categorized as CE /u/ (73% in BP and 81% in EP).
Turning to the bilingual participants, in
Table 3, we also observe similar patterns of categorization across the two dialects. Specifically, the categorization of BP /i/ equally spread across CE /i/ and /ɪ/ (each with 41% categorization). EP /i/ was also categorized to the same two vowels; however, CE /ɪ/ was chosen more often than CE /i/ (44% vs. 36%). Similar to the monolinguals, SpE bilinguals categorized BP and EP /e/ across four categories, namely, /i/, /ɪ/, /e/, and /ɛ/, with CE /ɪ/ as the vowel most commonly chosen, followed by CE /ɛ/ (24% categorization in BP and 16% in EP). The SpE bilinguals consistently chose CE /ɛ/ when they heard tokens of BP and EP /ɛ/ (64% in BP and 49% in EP); however, they also chose CE /e/ and, in the case of EP, /ɛ/ was also perceived as CE /ɪ/. The SpE bilinguals did not differ from the monolinguals in that their categorization of BP and EP /a/ was spread across CE /æ/, /ʌ/, and /ɑ/, with /æ/ being the most popular choice (62% for BP and 52% for EP). The majority of the BP /o/ tokens were categorized as CE /ɑ/ (54% of the time), followed by CE /o/ (23% of the time). The categorization of EP /o/ was spread across four vowel categories, specifically, CE /ɑ/ (26%), /u/ (25%), /o/ (23%) and /ʌ/ (14%). Additionally, most of the BP and EP /ɔ/ tokens were categorized as CE /ɑ/ (58% in BP vs. 53% in EP), with a smaller percentage categorized as CE /ʌ/ and /o/ and, in the case of BP, /æ/. Finally, BP and EP /u/ was consistently categorized as CE /u/ (56% in BP and 60% in EP), with a small percentage of tokens categorized as /ʌ/ and /o/.
Based on these categorization percentages, we would not predict any overall differences across the two dialects, which suggests that the overall difference in vowel duration does not play a role in non-native perception. However, there are some instances where the amount of categorization per vowel differs across the two dialects. For example, CE monolinguals categorized BP /a/ as CE /æ/ 54% of the time, yet only 34% of the time in EP. Likewise, they classified BP /ɔ/ as CE /ɑ/ 72% of the time, but only 53% of the time in EP. Additionally, EP /u/ was categorized 81% of the time as CE /u/ and 73% of the time for BP. Similar differences are observed among the SpE bilinguals. Specifically, EP /e/ was categorized as CE /ɪ/ 62% of the time, and BP /e/ was categorized as that same vowel 45% of the time. BP /ɛ/ was categorized as CE /ɛ/ 64% of the time and 49% of the time in EP. There was a 10% difference in categorization of BP and EP /a/ to CE /æ/, with 62% categorization for the former and 52% for the latter. Finally, BP /o/ was categorized as CE /ɑ/ 54% of the time, yet, in EP, it was only categorized as /ɑ/ 26% of the time. Given the qualitative differences in classification percentages across the two dialects, we may find that there will be an interaction between the dialect that participants heard and the specific contrast that they were discriminating.
We conducted a repeated-measures analysis of variance on the categorization scores to examine the possibility of these interactions more closely. The classification percentage served as the dependent measure, and the within-participant factors were dialect (2: European, Brazilian), Portuguese vowel heard (7: i, e, ɛ, a, o, ɔ, u), and English response vowel (10: i, ɪ, e, ɛ. æ, ʌ, ɑ, o ʊ, u). We included language background (bilingual or monolingual) as a between-participants factor. The results showed a significant three-way interaction between dialect, Portuguese word heard, and English response vowel, F (54, 1296) = 4.61, p < 0.001. This suggests that, as predicted, participants did show differences in how they classified Portuguese vowels depending on the dialect they heard. A second three-way interaction between Portuguese vowel, English response, and language background, F (54, 1296) = 2.89, p < 0.001, suggests that being a bilingual or monolingual also affected how those vowels were classified into English categories. Spanish–English bilinguals may categorize some Portuguese vowels differently because their knowledge of Spanish would influence their perception of those vowels. There was no four-way interaction (F < 1).
Recall that PAM and the L2LP model both claim that discrimination difficulty is caused by perceptual similarity. Therefore, even if one observes instances where a non-native sound is perceived as two or more native categories, difficulty in discriminating vowel contrasts should only occur when each vowel in the contrast is perceived as the same multiple native categories. Following the method described in
Levy (
2009) and
Vasiliev (
2013), we calculated the amount of perceptual overlap in a given contrast in order to obtain a quantifiable prediction of the cross-linguistic influences that lead to discrimination difficulty. As mentioned above, a perceptual overlap occurs when two members of a non-native contrast are perceived (or categorized) as the same native vowel(s). The higher the perceptual overlap, the more likely that this contrast will be poorly discriminated. If no perceptual overlap occurs (i.e., the two vowels in the target contrast are mapped onto different native categories), then there should be no challenge for listeners when distinguishing between the vowels in that contrast. The percentage of perceptual overlap in each contrast across each dialect for monolinguals and bilinguals is shown in
Table 4. We obtained a perceptual overlap score by adding together the smaller percentage of the overlapping response categories. For example, for the BP contrast /i/–/e/, the CE monolinguals classified /i/ as CE /i/ 60 % of the time and as CE /ɪ/ 23% of the time. BP /e/ was also classified as CE /i/ 17% of the time and as /ɪ/ 34% of the time. Thus, by adding together the smaller percentage of the overlapping categories, the calculation of the perceptual overlap score would be as follows: 17 + 23 = 40% perceptual overlap. The perceptual overlap calculations are presented in
Table 4.
The results in
Table 4 clearly show no evidence of perceptual overlapping for the /a/–/ɛ/ contrast for either group in either dialect. Therefore, we predict that this contrast should be the easiest for both groups to perceive. For the bilingual participants, we predict that /o/–/ɔ/ and /i/–/e/ should be the most difficult to perceive in both dialects, whereas for our CE monolingual participants, BP /o/–/ɔ/ and /e/–/ɛ/ should be most difficult, while they should have most difficulty with /o/–/u/ and /i/–/e/ in EP.
Interestingly, from the perceptual overlap table, we can also observe that, for some contrasts, the perceptual overlap score is higher in one dialect than the other. In order to determine whether there was a difference in perceptual overlapping between dialects, we set a 5% difference as a threshold. For example, there is a higher percentage of perceptual overlap for EP /a/–/ɔ/ and /o/–/u/ than in BP for the monolingual participants, whereas the perceptual overlap scores for the /e/–/ɛ/ and /o/–/ɔ/ contrasts are much higher in BP than in EP. A similar observation can be made among the bilinguals, where BP /a/–/ɔ/ has a higher perceptual overlap score than EP and the perceptual overlap is greater in EP /o/–/u/ than BP. Duration differences between BP and EP do not seem to play a role in non-native categorization or perceptual overlap, perhaps because all vowels in American English have intermediate durations between long and short vowels. Interestingly, the perceptual overlap scores for /i/–/e/ are actually higher than /e/–/ɛ/ for the bilinguals across both dialects and for the monolinguals in EP—this does not confirm the prediction from
Escudero et al. (
2009a), which suggests that EP /e/–/ɛ/ may show a merger in the near future due to their acoustic proximity. Had this prediction been borne out, we would see higher overlap scores for EP /e/–/ɛ/ compared to /i/–/e/ and BP /i/–/e/ and /e/–/ɛ/. This may be explained by the fact that American English does not use duration as a cue (compared to, e.g., Australian English; see
Elvin et al. 2016b), and therefore, the vowel duration and quality difference are not as salient for these listeners. Based on the above perceptual overlap scores and following previous studies (
Levy 2009;
Vasiliev 2013;
Elvin 2016), we can qualitatively predict an ordering of discrimination accuracy from the least to most difficult (with ~ referring to equal or comparable difficulty), which is shown in Example (1) below.
| 1. | Least difficult → Most difficult |
| | a. | Monolinguals |
| | | BP |
| | | /a/–/ɛ/ > /o/–/u/ ~ /a/–/ɔ/ > /i/–/e/ ~ /o/–/ɔ/ > /e/– /ɛ/ |
| | | EP |
| | | /a/–/ɛ/ > /o/–/ɔ/ > /e/–/ɛ/ ~ /a/–/ɔ/ ~ /o/–/u/ ~ /i/–/e/ |
| | | |
| | b. | Bilinguals |
| | | BP |
| | | /a/–/ɛ/ > /o/–/u/ > /e/–/ɛ/ ~ /a/–/ɔ/ > /i/–/e/ > /o/–/ɔ/ |
| | | EP |
| | | /a/–/ɛ/ > / a/–/ɔ/ > /o/–/u/ ~ /e/–/ɛ/ > /i/–/e/ ~ /o/–/ɔ/ |
In sum, for the discrimination of BP and EP vowels, we predict an effect of contrast that may vary across listener groups, as suggested by the perceptual overlap scores. Alternatively, given that there were some instances where categorization was more consistent in one dialect than in the other, and that some perceptual overlap scores for certain contrasts were much higher in one of the two dialects, we may find an interaction between dialect and vowel contrast that may extend to both language groups. That is, some contrasts may be easier to perceive in one of the two dialects for all listeners.
3.2. Non-Native Discrimination
Participants’ accuracy was measured in SPSS using a mixed-effects binary logistic regression model that included the participant, X stimulus, and trial number as random effects, with dialect, vowel contrast, and language background included as fixed effects. In addition to testing for a main effect of our fixed effects, we also tested for an interaction between vowel contrast and language background, vowel contrast and dialect, and dialect and language background, and a three-way interaction between language background, dialect, and contrast. The model revealed a main effect of vowel contrast (χ2 (5, N = 12,480) = 341.612, p ≤ 0.001), but no main effect of dialect (χ2 (1, N = 12,480) = 1.555, p = 0.206), and no overall effect of language background (χ2 (1, N = 12,480) = 2.586, p = 0.097). Additionally, the model revealed no interaction between dialect and language background (χ2 (1, N = 12,480) = 0.151, p = 0.743). However, there was an interaction between vowel contrast and dialect (χ2 (5, N= 12,480) = 23.768, p = 0.003), as well as a trend toward an interaction between vowel contrast and language background (χ2 (5, N = 12,480) = 10.116, p ≤ 0.065). We found no evidence of a three-way interaction between language background, dialect, and contrast (χ2 (5, N = 12,480) = 4.670, p = 0.457).
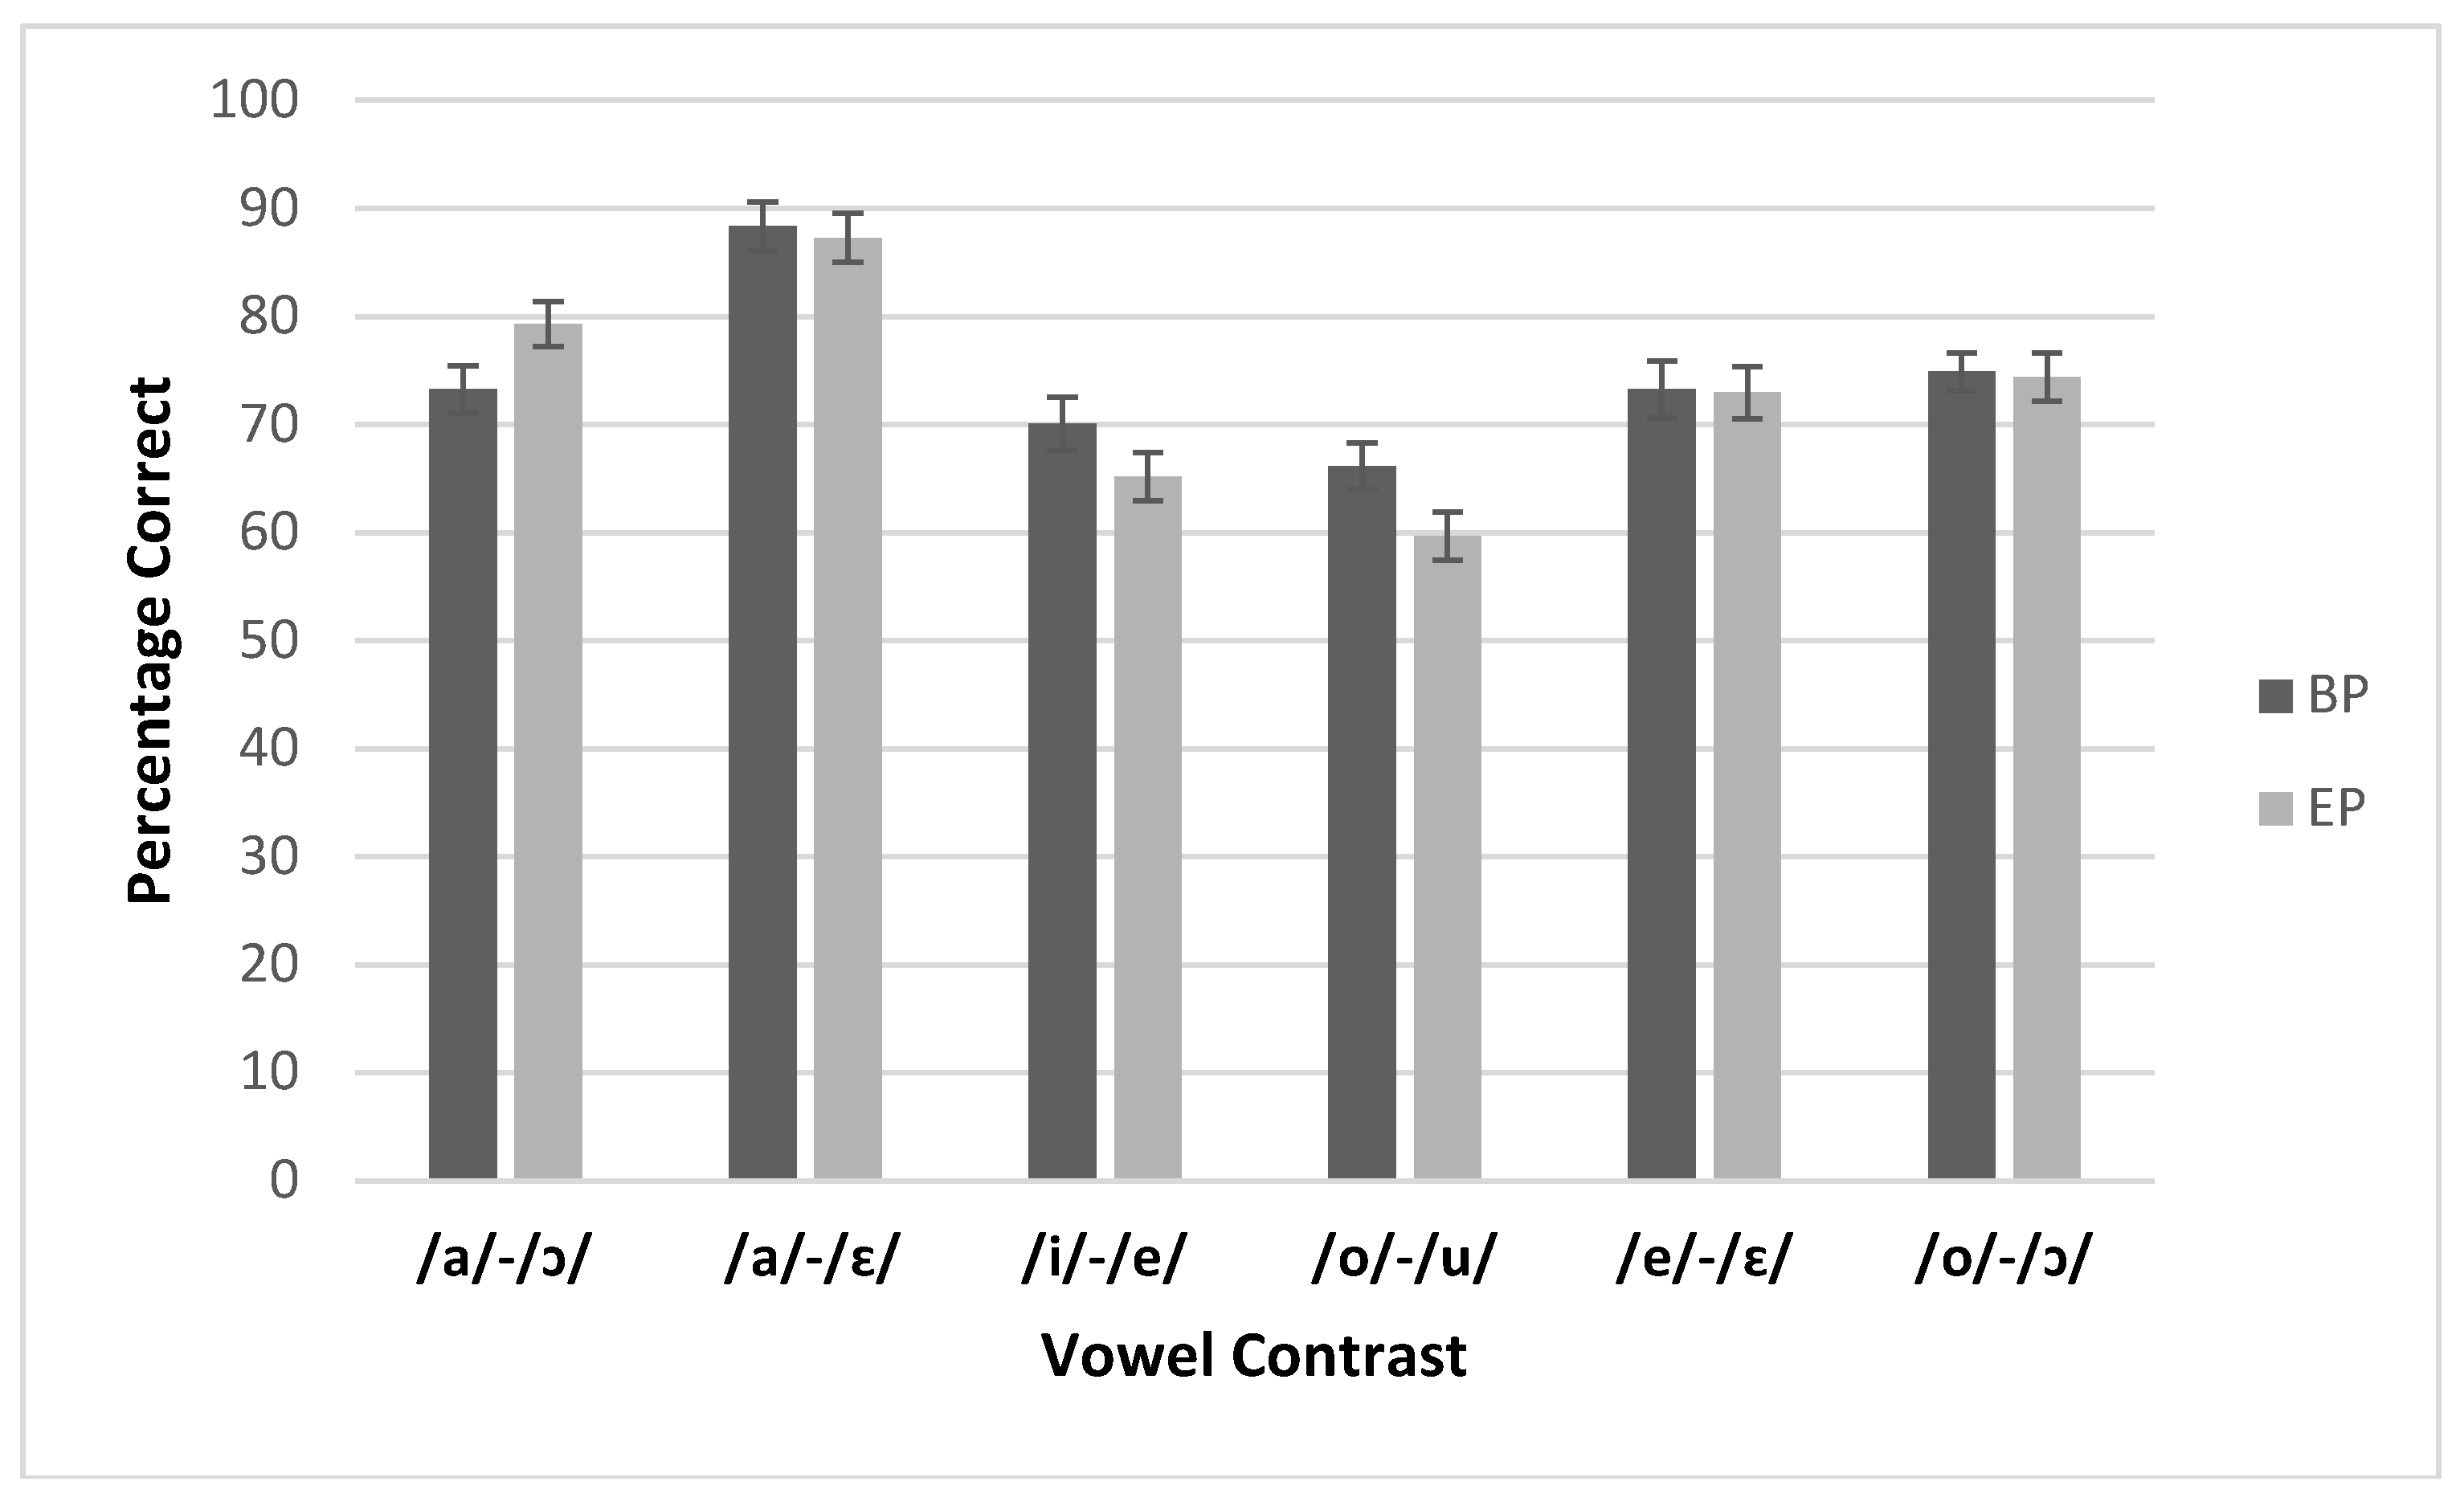
To explore the main effect of vowel contrast, participants and dialects were pooled together and Fisher’s Least Significant Difference (LSD)-corrected post-hoc pairwise comparisons were conducted to investigate the level of difficulty across the six Portuguese contrasts.
Figure 2 shows the percentage correct across the BP and EP contrasts for all participants pooled together. The comparisons indicate that participants had higher overall accuracy for /a–ɛ/ than all the remaining contrasts (
p ≤ 0.001), and /o/–/u/ had significantly lower accuracy when compared to the other contrasts (
p ≤ 0.001). No difference was found for /a/–/ɔ/, /e/–/ɛ/, and /o/–/ɔ/ (
p ≥ 0.070), which were all significantly higher than /i/–/e/ (
p ≤ 0.001). This order of difficulty from easiest to most difficult for both groups, across both dialects, is shown in Example (2) (where ~ indicates comparable accuracy). However, this main effect was qualified by an interaction with dialect, which was predicted based on previous results showing a difference between EP and BP for certain vowel contrasts.
| 2. | Least difficult → Most difficult |
| | Monolinguals and Bilinguals (BP and EP) |
| | /a/–/ɛ/ > /a/–/ɔ/ ~ /e/–/ɛ/ ~ /o/–/ɔ/ > /i/–/e/ > /o/–/u/ |
To explore the interaction between vowel contrast and dialect and to test our predictions for level of accuracy within each dialect, participants were pooled together and Fisher’s LSD-corrected post-hoc pairwise comparisons were conducted. These comparisons indicated that participants had higher overall accuracy for BP /a/–/ɛ/ than all the remaining BP contrasts (p ≤ 0.001) and /o/–/u/ had significantly lower accuracy than the other BP contrasts (p ≤ 0.049). No difference was found between BP /a/–/ɔ/, /e/–/ɛ/, and /o–ɔ/ (p ≥ 0.232), while /e/–/ɛ/ and /o/–/ɔ/ had significantly higher accuracy scores than BP /i/–/e/ (p ≤ 0.032), and /a/–/ɔ/ had marginally higher accuracy than BP /i/–/e/ (p = 0.075).
For EP, the participants had higher overall accuracy for /a/–/ɛ/ than all the remaining contrasts (p ≤ 0.001), and /o/–/u/ had significantly lower accuracy when compared to the other contrasts (p ≤ 0.005), which mirrors the BP results. In EP, /e/–/ɛ/ and /o/–/ɔ/ did not differ in accuracy (p = 0.522) and had significantly higher accuracy than /i/–/e/ (p ≤ 0.001); however, unlike in BP, EP /a–ɔ/ had significantly higher accuracy scores than all other EP contrasts (p ≤ 0.025) except /a–ɛ/. Based on these results, our order of difficulty only partially matches the predictions based on acoustic and perceptual overlap from categorization data. The order of difficulty for BP and EP can be seen in Example (3) below.
| 3. | Least difficult → Most difficult |
| | Monolinguals and Bilinguals |
| | a. | BP |
| | | /a/–/ɛ/ > /a/–/ɔ/ ~ /i/–/e/ ~ /e/–/ɛ/ ~ /o/–/ɔ/ > /i/–/e/ > /o/–/u/ |
| | |
| | b. | EP |
| | | /a/–/ɛ/ > /a/–/ɔ/ > /e/–/ɛ/ ~ /o/–/ɔ/ > /i/–/e/ > /o/–/u/ |
Fisher’s LSD-corrected post-hoc pairwise comparisons were also used to examine the difference in accuracy for each Portuguese contrast across dialects. Results indicated that participants had higher accuracy in the /a/–/ɔ/ contrast when it was presented in EP (p = 0.004), which was not predicted. Participants found both /i/–/e/ and /o/–/u/ easier to perceive when presented in BP (p ≤ 0.048), in line with the predictions based on perceived overlap scores.
Turning to the possibility of an interaction between language background and vowel contrast, the results of the pairwise comparisons indicated that there was only one instance where the results differed significantly across language groups. Specifically, bilinguals had significantly more correct responses than monolinguals for the /o/–/u/ contrast (
p = 0.007), which may have been driven by the fact that monolinguals were predicted to show more difficulty with EP /o/–/u/ compared to the bilinguals.
Table 5 shows both groups’ accuracy scores for each of the six Portuguese contrasts across the two dialects.
Recall that we predicted the degree of perceptual overlap in a given contrast would influence the discrimination difficulties listeners may have with certain contrasts. In other words, when there is high perceptual overlap, listeners may perceive both sounds in the contrast as the same single or multiple categories resulting in discrimination difficulties. When there is little to no overlap it should be easy. Therefore, we ran Spearman’s rank correlations to confirm that discrimination difficulty increases when a greater amount of perceptual overlap is present in the contrast. For BP, we found a significant negative correlation between the amount of perceptual overlapping and the number of correct responses for the bilingual listeners (r = −0.067, p (two-tailed) ≤ 0.001), but not for monolinguals (r = −0.013, p (two-tailed) = 0.512). In the case of EP, we found significant negative correlations for both bilinguals (r = −0.099, p (two-tailed) ≤ 0.001) and monolinguals (r = −0.054, p (two-tailed) ≤ 0.001). We interpret a negative correlation as an indication that a greater amount of perceptual overlap results in lower overall accuracy. However, although significant, these correlations are fairly low (i.e., less than one in all cases), suggesting that the relationship between perceptual overlap and discrimination difficulty may also be mediated by other factors.
4. Discussion and Conclusions
We investigated CE monolingual and SpE bilingual listeners’ perception of Brazilian and European Portuguese. According to the L2LP model and previous research (e.g.,
Escudero and Chládková 2010) and given the duration and acoustic differences in the realizations of the BP and EP vowels, there should be differences in how these vowels are filtered and categorized in the native language. We also investigated whether or not bilinguals have overall higher accuracy when perceiving the Portuguese contrasts in the two dialects. Overall, there seemed to be very little difference between the CE monolingual and bilingual participants in their categorization of the BP and EP vowels, and, for the most part, the participants systematically chose the same native CE categories for vowels in both dialects, with the exception of a few. Perhaps the most striking differences found between the categorization of the two dialects were the cases where categorization to one particular vowel was more consistent in one dialect than the other. Furthermore, the results from the perceptual overlap calculations indicated that, for both groups, /a/–/ɛ/ should be the easiest to discriminate in both dialects. The fact that the categorization was more consistent in one dialect led to the prediction that there may be an interaction for accuracy scores between a particular contrast and the dialect in which it was heard.
We found a main effect of contrast as predicted; however, we did not find a main effect of dialect or language background, indicating that, overall, there were comparable accuracy scores across the two groups and two dialects. The main effect of contrast indicated that some contrasts were easier to discriminate than others. Specifically, both groups found /a/–/ɛ/ to be the easiest to perceive and /o/–/u/ the most difficult. The fact that both groups found /o/–/u/ difficult to discriminate in both dialects is not surprising, as these two vowels are acoustically similar and were difficult to perceive in other studies of Portuguese vowel perception (
Vasiliev 2013;
Elvin et al. 2014;
Elvin 2016). In particular, the fact that native Mexican-Spanish bilingual speakers also had trouble with the /o/–/u/ contrast here replicated
Elvin et al. (
2014) showing that Iberian-Spanish listeners also had trouble discriminating that contrast. As predicted, the main effect was qualified by an interaction between the dialect and vowel contrast. That is, we found that there was overall higher accuracy for specific vowel contrasts differentially in the two dialects, which was expected because the perceptual overlap scores differed across both dialects. Although BP had longer vowel duration overall (
Escudero et al. 2009a), this difference did not play a significant role in categorization or discrimination. The results also indicate that /o/–/u/ was easier to discriminate when produced in BP than in EP. Although there was little difference in perceptual overlap scores of BP and EP /i/–/e/ for both groups, the results suggest that both groups did in fact find this contrast easier to perceive when produced in the BP dialect. Interestingly, our perceptual ranking from the categorization task predicted lower accuracy for /o/–/ɔ/ than /o–u/ for bilinguals in both dialects and for monolinguals in BP—
Elvin et al. (
2014) showed that both Iberian-Spanish and Australian-English listeners ranked /o/–/u/ as the most difficult and /o/–/ɔ/ was ranked in the middle (with /a/–/ɛ/ as the easiest). However, our participants performed worse with /o/–/u/ compared to /o/–/ɔ/ during the discrimination task. This is most likely due to the addition of EP as a dialect of interest, but may also be due to acoustic differences between the target and native dialects. In particular, our cross-linguistic acoustic comparison showed that /o/ and /ɔ/ in BP and EP were acoustically similar to two separate Mexican-Spanish vowels produced by bilingual speakers. It may be the case that bilingual speakers activated Spanish to help discriminate this contrast. This contrast may also have been easier for monolingual speakers to perceive given that the English /o/ was acoustically similar to BP and EP /o/, with no English vowels being acoustically similar to BP or EP /ɔ/. It is possible that the lack of an acoustically similar vowel to /ɔ/ made it easier for monolinguals to perceive a difference between the two vowels in this contrast. Further analyses, with more detailed acoustic analyses than those presented here should, therefore, be considered in future work examining non-native vowel perception.
Furthermore, we predicted that bilinguals would find EP /a/–/ɔ/ easier to perceive than BP, where the monolinguals would find it more difficult. Our results indicate that, in fact, both groups found this contrast easier to perceive when produced in EP. Finally, although it was a trend, we found that, overall, the bilinguals had higher accuracy than monolinguals for /o/–/u/, which is, in fact, supported by the amount of perceptual overlap in that contrast. Indeed, we found that, with the exception of BP for the CE monolinguals, there was a significant correlation between the amount of perceptual overlap and discrimination accuracy for all other participants. Thus, it seems that, despite some discrepancies, our predictions based on the amount of perceptual overlap are largely supported.
Our prediction that bilinguals would perform better than monolinguals was not supported in this study. Indeed, both groups showed similar discrimination scores and categorization patterns. While there was a trend toward an interaction between vowel contrast and language background, further investigation showed that this was due to a single contrast, namely /o/–/u/, which had higher accuracy for bilinguals. The finding of little or no advantage for bilinguals in this study patterns with previous work showing that language background does not affect how listeners perceive non-native contrasts (
Mack 1989;
Werker 1986). Importantly, this effect exists regardless of the languages spoken by the bilinguals: in our study, Spanish–English bilinguals did not perform better than English monolinguals even though Spanish and Portuguese share more similar vowels. We would expect that speakers of Spanish would have an advantage as they would presumably map the incoming speech signal to Spanish and show better discrimination. Importantly, this was the case in
Antoniou et al. (
2015), wherein the Mandarin–English bilinguals performed better than a monolingual group when learning Mandarin-like contrasts, and Korean–English bilinguals learned Korean-like contrasts better. Here, even though Spanish and Portuguese are similar languages, the addition of Spanish as a native language did not help in discrimination or categorization. The only advantage Spanish–English bilinguals had was when discrimination of the /o–u/ contrast occurred across both dialects. This may be because the production of that contrast across both dialects was the most similar to Spanish. Future acoustic analyses should investigate the distance between the Spanish and Portuguese instances of these vowels for a more comprehensive analysis. Importantly, the categorization task was completed with English words—the native Spanish speakers may have performed differently had they been presented with Spanish words to select instead.
However, our overall results suggest that, at the level of perceiving non-native vowel contrasts, the discrimination between vowel contrasts may be led exclusively by the acoustic distance between the heard vowels. Because our stimuli are very short in duration, these tasks may not tap into the heightened linguistic and non-linguistic abilities that bilinguals seem to have in other tasks (e.g.,
Kaushanskaya 2012). That is, it may be the case that the task demands here were such that they did not engender differences in how monolinguals and bilinguals performed because they were very simple and did not require phonological memory or higher-order cognitive functioning. Indeed, other tasks that show a bilingual advantage tend to happen at the lexical level (e.g., word learning;
Escudero et al. 2016). Therefore, while bilingualism may result in advantages in certain tasks, the present study did not show any significant differences between groups. Furthermore, bilingualism cannot be solely identified as the factor mediating the relationship between perceptual overlap and discrimination difficulty because no significant effect of language background or dialect was found in the correlations between the tasks. In general, our results do not support the idea that bilingualism heightens non-native phonetic perception across dialects, an important contribution to the literature on bilingual advantage in non-native phonetic perception.
In conclusion, our study finds that listeners do indeed filter, categorize, and discriminate the vowels of two dialectal varieties differently. Importantly, this does not vary based on language background. Furthermore, our non-native discrimination task indicates discrimination accuracy differs depending on the specific vowel contrast that they heard and that dialectal differences were only evident in a select number of vowel contrasts. Therefore, although there will be differences in the developmental trajectories of specific vowel contrasts, these differences will not carry over at a dialectal level. Language teachers may, however, choose to spend more time training vowel perception of a given vowel contrast in the specific dialect that was more difficult to perceive (e.g., /a/–/ɔ/ in BP will be more difficult than in EP and /i/–/e/ and /o/–/u/ will be more difficult in EP). We do acknowledge that our pool of data for the monolingual group was limited, and therefore, future studies should further investigate whether there are differences between bilinguals and monolinguals in their initial perception of Portuguese vowels. Furthermore, we acknowledge that our study was limited in the fact that we were unable to include Mexican-Spanish-speaking monolinguals. It would be beneficial in future studies to compare the performance of Mexican-Spanish monolinguals to the present study, as well as the Iberian-Spanish participants in
Elvin et al. (
2014). Finally, given that we found a difference in the listeners’ difficulty levels for the perception of EP and BP, we would expect these differences to carry over into the domains of spoken word recognition and non-native productions. Future studies should be carried out to test whether or not that is indeed the case.


