1. Introduction
The scarcity of raw materials and the resulting rising prices are putting an increasing focus on lightweight construction. This also applies to electromobility, where every saved mass is synonymous with extended range. In the past, there have been many approaches and research activities to combine a wide variety of materials by exploiting their respective specific properties. The resulting composites are often referred to as hybrid composites. For structural components made of flat, semi-finished products, the best known hybrid laminates are GLARE (glass laminate aluminium-reinforced epoxy) and ARALL (aramid-fibre-reinforced epoxy resin aluminium foil laminate) which are used in aircraft construction [
1]. However, the efficient use of materials in the right place with their specific properties is not the only way to reduce weight. With the growing safety and comfort requirements in the automotive domain, the number of sensors and cables is constantly increasing. For this reason, it makes sense to integrate functions, such as sensors, directly into the component and to connect these elements during the production process. There are different approaches for integrating functions directly into the semi-finished product and these can be differentiated according to the type of semi-finished product. On the one hand, functions can be integrated into sheet metal structures by printing strain gauges onto a tube as described by Ibis and Groche [
2] or by joining a piezoceramic ring into a metal tube using forming technology as reported by Brenneis et al. [
3]. On the other hand, sensor integration can be realized through direct integration of macro-fibre composites (MFCs) into a sheet metal structure as shown by Müller et al. [
4]. Furukawa et al. [
5] have made similar developments for semi-finished plastics, exploiting the direct piezoelectric effect by adding PZT (lead zirconate titanate) particles to an epoxy resin matrix. Of course, this also works for thermoplastics, where CNTs (carbon nanotubes) are added to the PZT particles for improved electric field coupling as reported by Hardt et al. [
6]. In previous work, both semi-finished products were combined to form a sensory hybrid composite suitable for large-scale production. Depending on the application, this can be used as an input system inside a car as reported by Schmidt et al. [
7] or for monitoring the condition of safety-relevant components as reported by Schmidt et al. [
8] in 2020.
This article is structured as follows. First, an overview of the relevant research is given. Then, the materials used and the methods for data collection are described. Building on this, an initial impact detection study is presented, from which the primary study is developed, described and analyzed based on its findings. Finally, the concluding results are discussed and summarized and directions for future research are outlined.
2. Related Work
Research in the field of impact localization on surfaces has a history of more than 20 years [
9]. In recent years, there has been an increasing use of lightweight composites, which offer a high stability despite their low weight. Impacts on such composites can lead to structural changes, which can also affect the stability and thus become a safety risk [
10]. Hence, the use of machine learning techniques for impact localization and health monitoring has increased in recent years. While conventional methods are based on the use of the wavelet transform and the extreme learning machine as presented by Fu et al. [
11], other approaches using a Least Square Support Vector Regression approach, such as that described by Datta et al. [
12], or the Least Squares Support Vector Machine (SVM), as shown by Lu et al. [
13], have been proposed.
Furthermore, artificial neural networks are widely used in this field of research. Sung et al. [
14], for instance, present a localization approach based on the wavelet transform and subsequent usage of the Levenberg–Marquardt algorithm. In this study, a square specimen with PZT sensors has been used. Haywood et al. [
15] present an approach based on Multilayer Perceptron (MLP) and an approach using an adaption of a generic algorithm for triangulation of a composite rectangular panel with piezoelectric sensors. For training, standard signal-processing features have been used, like the arrival time, maximum and minimum amplitude. A comparable approach is presented by Park et al. [
16] for a composite laminate fabricated with graphite/epoxy and four multiplexed FBG sensors. This approach uses an MLP as well as the arrival time of the waves as features, resulting in an average localization error of 9.17 mm.
A realistic specimen has been used by LeClerc et al. [
17]. They analyze the feasibility of MLPs for a full-scale aircraft component, with ribs, spars and stringers equipped with nine piezoceramic patches as sensors. LeClerc et al. [
17] present a regression, a classification and a hybrid approach representing a combination of both methods. The results show the feasibility of MLPs in the case of regression, with a validation error of 1.76%, and classification, with a validation error of 2.5%. The hybrid approach results in a validation error of 1.26%, showing the potential of combining both methodologies.
An alternative deep learning methodology, Convolution Neural Networks (CNNs), is evaluated by Damm et al. [
18] for impact localization. The specimen used is a carbon-fibre-reinforced plate with PZT sensors. As a feature, the sensor signal has been transformed using the short-time Fourier transformation. This study confirms the applicability of this approach, with a high classification accuracy of over 97%. A comparable approach is presented by Tabian et al. [
19] using a CNN on a complex composite structure. The authors use a composite part containing a fuselage section with stiffeners and frames. As sensors, 12 DuraAct PZT sensors are attached on the inside. The localization and energy estimation results reach a more than 94% accuracy. However, it has to be noted that only three classes have been used for the localization and two, respectively, four classes for the energy classification.
Chen et al. [
20] combine a CNN with deep recurrent neural network (RNN) layers. Specifically, two bidirectional long short-term memory (LSTM) layers are included as RNN representatives. The authors use five accelerometer sensors and the respective sensor signals as features. The localization evaluation results in a mean absolute error of 11.82 mm and a misjudgment rate of 2.51%.
In summary, it is evident that deep learning technologies present the current state of the art in impact localization. Even simple MLPs achieve a high accuracy. Furthermore, CNNs also show very good results, which have already been proven in other domains, such as image processing. In the most recent work of Chen et al. [
20], the applicability of RNNs, in particular LSTM networks, is shown. Additionally, piezoelectric sensors like PZT are widely used to measure acoustic waves for propagation as a basis for feature extraction. However, only Tabian et al. [
19] and LeClerc et al. [
17] use a complex specimen, while most of the presented scientific work focuses on standard plates without forming operation. According to this, the analysis of formed specimens or components is currently under-represented.
In previous investigations, a novel active material for hybrid laminates was developed by Hardt et al. [
6]. This piezoelectric compound material consists of polypropylene (PP) which is highly filled with PZT. In addition, a small amount of carbon nanotubes (CNTs) is admixed to improve the electrical properties of the matrix material and the field coupling into the piezoceramic particles [
6]. The optimal material composition and processing properties for foil extrusion and the continuous joining of the hybrid laminates were also determined in previous investigations [
6]. Based on this, hybrid structures with sensor functions can be produced. The functional layer in piezo-active fibre metal laminates (PFMLs) can be used for structural health monitoring in fibre-reinforced hybrid metal structures. Schmidt et al. [
8] reported the possibility of using the sensor signals of the piezoelectric foil layer to detect the time of failure of the PFML in static and dynamic load tests. In addition, it was shown that the damage index can identify damage in the PFML that would lead to a complete failure of the structure in the future. Furthermore, piezoelectric foil enables the use of PFMLs as well as hybrid metal laminates without fibre reinforcement (piezo-active metal laminates, PMLs) as input devices, as shown by Schmidt et al. [
7]. Based on the described PMLs, Schmidt et al. [
7] propose a full haptic input device system with real-time capabilities using a center console as specimen. The center console does not represent a standard plate. Instead, it is a formed and realistic specimen. For impact localization, a conventional machine learning approach has been used utilizing an SVM. As a training feature, a gradient-based approach is used. The best classification accuracy achieved is 84.28% on the validation dataset using a polynomial kernel with 20 classes representing a five by four grid. The work has proven the feasibility of PMLs for impact localization. The achieved SVM classification accuracy is a promising result, but for practical use, a higher classification accuracy would be desirable. For this reason, the current work analyzes the feasibility of deep learning methods to localize impacts on a center console using the described PML.
3. Material and Methodology
3.1. Material and Specimen Preparation
The sensoric hybrid laminate consists of three components: the first electrode is an aluminium sheet made of the alloy EN AW 6082 T4; a thermoplastic piezoceramic foil, which determines the sensoric properties; and copper patches, which act as the second electrode. For the large-scale production capability of the laminate, it was crucial that the thermoplastic piezoceramic foil could be produced in a foil extrusion process. During the process, the maximum piezoelectric effect had to be exploited by using the highest possible filler content of piezoceramic particles (NCE55 (CTS Corporation, Lisle, IL, USA)) in the polymer component. Furthermore, the electric field coupling in the stochastically distributed PZT particles was increased by adding CNTs. These active components were embedded in a polyproylene matrix (Moplen HP501H (LyondellBasell Industries N.V., Rotterdam, The Netherlands)). The optimum balance between processability and signal strength is the composition of 70 wt.% PZT and 0.5 wt.% CNTs as reported by Hardt et al. [
6]. The next step in the process chain was the pre-treatment of the aluminium sheet and the subsequent continuous joining process in an adapted rolling mill that was described by Hardt et al. [
6]. Finally, the component (cover of the center console of the “VW up!”) was cut to size before forming and the laminate was molded to its final shape using a variothermal tool. For understanding the forming process, several investigations regarding limits, failure and springback have been performed and reported by Hardt et al. [
6] and Schmidt et al. [
7]. Before contacting the embedded system, the polarization and thus the alignment of the domains of the piezoceramic particles in the sheet thickness direction was carried out. For this purpose, the cover of the center console of a “VW up!” was polarized in an oil bath at 125 °C for 5 min with an electric field strength of 4.5
[
8].
Figure 1 shows the structure of the resulting material and a possible application example.
3.2. Data Generation
For data generation, the described center console was divided into 16 areas of approximately equal size, resulting in a grid of 4 × 4 fields. Afterwards, seven test persons tapped 60 times on each of the 16 generated fields. There was no explanation as to how the tapping has to be executed in order to ensure heterogeneous and intuitive behavior of the test persons. The measurements were performed with the same technology as used by Schmidt et al. [
7]. Thus, data acquisition was achieved by using the built-in ADC of the Zybo Zynq-SoC board with a sampling rate of 500 kHz. One second was recorded for each field and tapping per sensor. It was ensured that in every recorded signal a tapping signal was recorded by manual evaluation after the recording. In total, 6720 samples were created.
3.3. Research Methodology
Based on the generated data, two studies were carried out to evaluate the feasibility of deep learning technologies for impact localization using the described center console. A preliminary study was conducted to analyze the general applicability of deep learning technologies for the use of impact localization on the hybrid laminates with piezoceramic sensors, as well as the identification of the necessary data preprocessing steps. Based on the preliminary study results, a second study was conducted, evaluating the feasibility of various deep learning methods for impact localization on the described center console. In the following, the preliminary study is described and the results are presented, followed by the main study’s description.
4. Preliminary Study
4.1. Preliminary Study Design
The preliminary study serves to identify necessary methods for data preparation and to identify input formats for the deep learning technologies. For this purpose, the sensor data were divided into measurement windows with the size of 16,384 samples while ensuring that the impact signal is exactly in one of the measuring windows. The sample count of the measurement window was decided by the supported sample size from common FFT IP-Cores of FPGAs, since the final realization should be performed using embedded devices like FPGAs as designed by Schmidt et al. [
7]. Furthermore, 16,384 is a power of two, leading to the possibility of efficient FFT implementation in both the FPGAs and microprocessors. For the implementation of this behavior, the average amplitude of the noise on each channel was determined. Subsequently, the signals were filtered using a Butterworth filter. On this basis, the average channel noise was subtracted, resulting in a representation of the deviation of the impact signal from the background noise. Using a threshold, the first sample index with a significant deviation from the baseline was detected on all channels. Subsequently, the minimum of the determined indexes was used to define the start of the impact signal. Starting from the start index, a minimal shift of the start index by 10% (1638 samples) was executed to ensure a quiet phase at the beginning of the measurement window and to prevent possible fluctuations in the start index determination.
The 16,384 samples before the impact were stored as a basis for training and can be interpreted as an additional class representing no impact. The samples for which no start index was identified by the described function were excluded. In consequence, 5823 of 6720 samples could be used for the training process. The reduction is determined by the test persons lightly tapping on the center console, leading to a too low impact for the static defined threshold. In order to generate an evenly distributed dataset, 330 samples were randomly selected for each class. The 330 samples represent the smallest possible dataset per class, reasoned by the excluded samples without a detected start index. Each of the 330 samples were randomly separated, with 80% used for the training and 20% for the validation processes, leading to an even distribution of the represented classes and test subjects. Additionally, 330 samples without impacts were added to the dataset, separated accordingly into 80% for training and 20% for validation. All data were normalized using the overall maximum amplitude to ensure an amplitude range between 0 and 1.
4.2. Preliminary Study Results
For the first evaluation step, two LSTM networks were trained using the generated dataset for training and validation with the raw sensor signal. The LSTM network was chosen because of its specialization in detecting long-term relationships, as they are expected in case of the sensor signals. Additionally, the work presented by Chen et al. [
20] has proven the feasibility of LSTM networks in combination with CNNs for impact detection. The first LSTM network represents a simple realization with two layers and 30 neurons (20/10), while the second implementation represents a complex structure of four layers and 425 neurons (250/100/50/25). For both LSTM networks, the training did not converge and the maximum achieved classification accuracy was an insufficient 6%, showing the necessity of additional data. Therefore, the damage index results for SHM application of the used PLM [
8] inspired the use of the signal amplitude spectrum as well as the signal power spectrum. The shift in the frequency domain not only changes the signal representation, but also adds the intensity information of each frequency bin. Furthermore, the short-term energy used is represented by the signal power spectrum since the sum of all frequency powers is equivalent to the short-term energy of the signal, also analyzed by Schmidt et al. [
8] as an SHM feature.
Within this context, four signal combinations were generated (
Table 1), representing the analysis basis for the feasibility of the use of additionally generated data. As a comparison basis, the data combination RAW-SPEC is used, containing the raw sensor signal and the corresponding amplitude spectrum. The RAW-SPEC-POW combination adds the signal power spectrum as additional data, while RAW-POW replaces the signal spectrum with the signal power spectrum. To analyze the influence of the amplitude spectrum, the SPEC dataset was used. Therefore, the data contain only the amplitude spectrum of the recorded signals as training data.
The results of the training process for the complex LSTM network with four layers and 425 neurons are shown in
Figure 2a. In contrast to the first attempt, using only the raw sensor data, it can be seen that all data combinations lead to a convergence of the LSTM network, resulting in classification accuracy scores of 97.4% to 99.02% in the training phase. Comparing the training results of the RAW-SPEC and RAW-SPEC-POW datasets, it is observable that adding the power spectrum leads to a decrease in the convergence speed and the achieved classification accuracy is approximately 1% lower. A similar observation can be made when comparing the training results of the RAW-SPEC and RAW-POW datasets. Comparing the training results of the RAW-SPEC and SPEC datasets, a similar convergence speed and classification accuracy can be observed.
A comparison of the classification accuracy for the given datasets in the validation process is shown in
Figure 2b. Overall, the characteristics of the convergence speed and classification accuracy are comparable with respect to the training results. However, the classification accuracy evolution over the epochs on the validation dataset fluctuates slightly in comparison to the training dataset. When comparing the validation results using the RAW-SPEC and the RAW-SPEC-POW datasets, it can be seen that the convergence speed slows down and the classification accuracy is approximately 2% lower. When analyzing the validation results of the RAW-SPEC and RAW-POW datasets, the same behavior is observable, resulting in a comparable classification accuracy difference. When comparing the validation results using the RAW-SPEC and the SPEC datasets, the convergence speeds, just like the classification accuracy, are on an comparable level. In detail, a classification accuracy difference of approximately 1% is achieved. When analyzing the resulting convergence in detail, it can be seen that the fluctuation in the classification accuracy over all epochs is higher for the SPEC dataset using the spectrum information only.
In consequence, all generated datasets lead to the convergence of the used LSTM network and result in high classification accuracy levels of 94% to 96% on the validation dataset, showing the general possibility to detect the impact on the center console using hybrid laminates with piezoelectric sensors. However, the datasets including the power spectrum data fall behind in the case of the resulting classification accuracy. Furthermore, the RAW-SPEC and SPEC datasets result in higher classification accuracies compared to the other datasets. Taking into account these results and the lower classification accuracy results of the RAW-SPEC-POW dataset compared to the RAW-SPEC dataset, it can be concluded that the power spectrum should not be considered as input data. On the other hand, the SPEC dataset containing the spectrum data only provides promising results for training and validation. RAW-SPEC and SPEC dataset usage results in a similar convergence speed and classification accuracy in training and validation. As a consequence, the amplitude spectrum data lead to a huge improvement compared to the insufficient results using only the raw sensor data. Furthermore, it is observable that the raw sensor data have no significant influence on the classification accuracy in both training and validation. Due to the good performance of the datasets containing the amplitude spectrum and the insufficient results when using only the raw data, the original assumption that long-term dependencies in the signals have to be detected is invalidated. Thus, the application of non-RNN deep learning methods has to be evaluated as well.
For the usage on embedded devices, the additional transformation of the signal to the frequency domain leads to a higher computational load, accompanied by a higher power consumption. Therefore, it is desirable to find other models providing a comparable accuracy but using the raw sensor data only or reducing the computational load of the devices. To identify possible models, the following main study has been conducted on the basis of the described preliminary study results.
5. Main Study
5.1. Main Study Design
One result of the preliminary study is that detecting long-term dependencies is not mandatory. For this reason, the aim of the main study is to evaluate different deep learning methods for the applicability of impact localization on hybrid laminates with piezoceramic sensors.
Therefore, three further LSTM networks have been implemented for comparison with the LSTM network from the preliminary study containing four layers with 425 neurons (250/100/50/25). The first LSTM network (LSTM-3L) uses three layers and 175 neurons (100/50/25), the second LSTM network (LSTM-2L) uses two layers and 125 neurons (100/25), and the third LSTM network (LSTM-BI) uses three bidirectional layers with 175 neurons (100/50/25).
Since the LSTM networks are RNNs, an alternative RNN is implemented for comparison. Three gated recurrent units (GRUs) have been implemented. While the first GRU network (GRU-2L) uses two layers with 70 neurons (50/20), the second GRU networks (GRU-4L) uses four layers with 120 neurons (25/50/25/20) and the last GRU network (GRU-BI) uses three bidirectional layers and 150 neurons (75/50/25).
Due to the localization results of the CNN networks presented by Tabian et al. [
19] and Damm et al. [
18], two CNN networks have been implemented. The first CNN (CNN-2 × 2) contains two sets of two convolution layers followed by one max pooling layer, one dropout layer and one normalization layer. After the two sets of layers, one flatten layer, one dense layer, one normalization layer and a dropout layer have been added. The second CNN (CNN-1 × 2) is equally implemented like CNN-2 × 2, but it contains just one set of two convolution layers followed by one max pooling layer, one dropout layer and one normalization layer.
The fourth category of deep learning techniques implements two MLPs. The first MLP (MLP-2L) uses two layers with 30 neurons (10/20) while the second MLP (MLP-4L) uses four layers with 160 neurons (10/50/75/25). For the construction, learning and validation of all networks, the deep learning library Keras was used, which utilizes the TensorFlow framework in the backend [
21,
22]. With this setup of deep learning networks, the main state-of-the-art methods are represented at different complexity levels.
The preliminary study has shown that the amplitude spectrum improves the classification accuracy. For this reason, two main datasets were created on the basis of the preliminary study results. The first dataset is equivalent to the SPEC dataset of the preliminary study, while the second dataset (RAW) contains only the raw data. The SPEC dataset was chosen due to its good performance in the preliminary study. Although the results using the SPEC dataset are promising, it is desirable to identify deep learning methods that do not require data preprocessing to reduce the computational complexity of embedded systems. Therefore, the RAW dataset was used, containing all raw sensor data. Comparing the accuracy fluctuation over the different epochs on the RAW-SPEC and SPEC datasets from the preliminary study, it is shown that the fluctuation in the RAW-SPEC dataset is slightly smoother compared to the SPEC dataset.
The two datasets have been extended by applying artificially generated data. Therefore, Gaussian noise was added to the recorded sensor data, simulating different moments of recording, since the general channel noise is independent of the sensor signals. Additionally, the data were randomly and slightly shifted in the measurement window, simulating the variation in the start index determination. Furthermore, the data were scaled by multiplication with a random number between 0.8 and 1.2, imitating different tapping intensities of the test subjects. Finally, the generated datasets were normalized with the maximum amplitude over all data, ensuring an amplitude range of between 0 and 1. Following this methodology, the sample count was increased to 1650 samples for each of the 17 classes, leading to an overall sample size of 28,050. The separation into training and validation datasets was achieved according to the preliminary study with a ratio of 80% and 20%.
In summary, four datasets have been generated. The first dataset, RAW, uses the raw sensor data only, the second dataset, SPEC, contains the corresponding amplitude spectra of the RAW dataset, the third dataset, RAW-AI, contains the RAW dataset with the extended artificial data and the fourth dataset, SPEC-AI, contains the corresponding amplitude spectra of the RAW-AI dataset.
5.2. Main Study Results
The defined deep learning methods were successively evaluated on the described datasets. For this purpose, the methods were trained on the different datasets, and the loss function as well as the classification accuracy were analyzed. For all networks, the categorical cross-entropy was used as a loss function.
5.2.1. LSTM and GRU Networks
Since the LSTM network showed an insufficient performance on the RAW dataset in the preliminary study, the LSTM networks were evaluated on the SPEC and SPEC-AI datasets only. Similarly, the GRU networks were evaluated only on the SPEC and SPEC-AI datasets, due to the close architecture of the GRU and LSTM networks and them belonging to the same method class (RNNs).
The classification accuracy results of the LSTM and GRU networks for the training process using the SPEC dataset are shown in
Figure 3a. It is evident that all used models converge during 20 epochs of training. Furthermore, all networks result in high classification accuracies between 96.2% and 100%. The networks with the highest convergence speed are the bidirectional models LSTM-BI and GRU-BI. Additionally, both result in the highest classification accuracy, with 99.5% for LSTM-BI and 100% for the GRU-BI model. A faster convergence, just like the high accuracies, results from the additional feedback provided by the bidirectional implementation of the models. However, in the case of the sequential GRU and LSTM models, the GRU models fall behind in classification accuracy compared to the LSTM models.
Similar results are achieved for the validation dataset shown in
Figure 3b. All models converge for the validation dataset and training dataset and result in high classification accuracies of between 90.64% and 97.95%. Just as in the training process, the bidirectional models LSTM-BI and GRU-BI result in the highest convergence speed and in the highest classification accuracies, with 97.95% for GRU-BI and 96.98% for the LSTM-BI network. In consequence, the bidirectional model training is successful, without overfitting occurring, even though the GRU-BI model reached 100% classification accuracy in the training phase. Furthermore, the GRU-2L and GRU-4L fall behind in both the classification accuracy and convergence speed compared to the LSTM models.
To compare the influence of the artificially generated data, the same procedure was evaluated on the SPEC-AI dataset. The results on the training dataset are comparable to the SPEC dataset for both architectures. However, there are differences in the validation process (see
Figure 4). The LSTM-2L network converges slower on the SPEC-AI dataset, but results in a comparable accuracy. The resulting difference is about 1% in training and 2.5% in validation. No significant difference between SPEC and SPEC-AI dataset usage can be found by comparison of the other LSTM methods. By comparing the GRU-4L network results, it becomes evident that the training process benefits from the artificially generated data usage, since the convergence speeds have been increased and the oscillation of the validation results has been reduced. In consequence, the classification accuracy also increases by 1.3%. Both GRU-BI and GRU-2L benefit mainly in the first epochs from the artificially generated data, but attain comparable classification accuracy levels of 96.3% (GRU-BI) and 90.5% (GRU-2L).
Considering the loss function, the generalization of the networks is confirmed in
Figure 5a,b, showing the convergence of all models used. The loss function characteristic of the LSTM-2L network using the SPEC-AI dataset (LSTM-2L-SPEC-AI) confirms that the generalization of the LSTM-2L network using the SPEC-AI dataset is less efficient compared to the SPEC dataset. The lowest loss function results are shown by the LSTM-BI on both datasets, proving the high classification accuracy results on both datasets. Furthermore, the GRU loss function analysis proves the described results, especially the improved convergence speed of GRU-4L via SPEC-AI dataset usage. Additionally, the bidirectional GRU model, GRU-BI, achieves the lowest loss values, proving the high classification accuracy results. In the case of the remaining sequential GRU networks, the loss functions show no significant difference regardless of SPEC or SPEC-AI dataset usage.
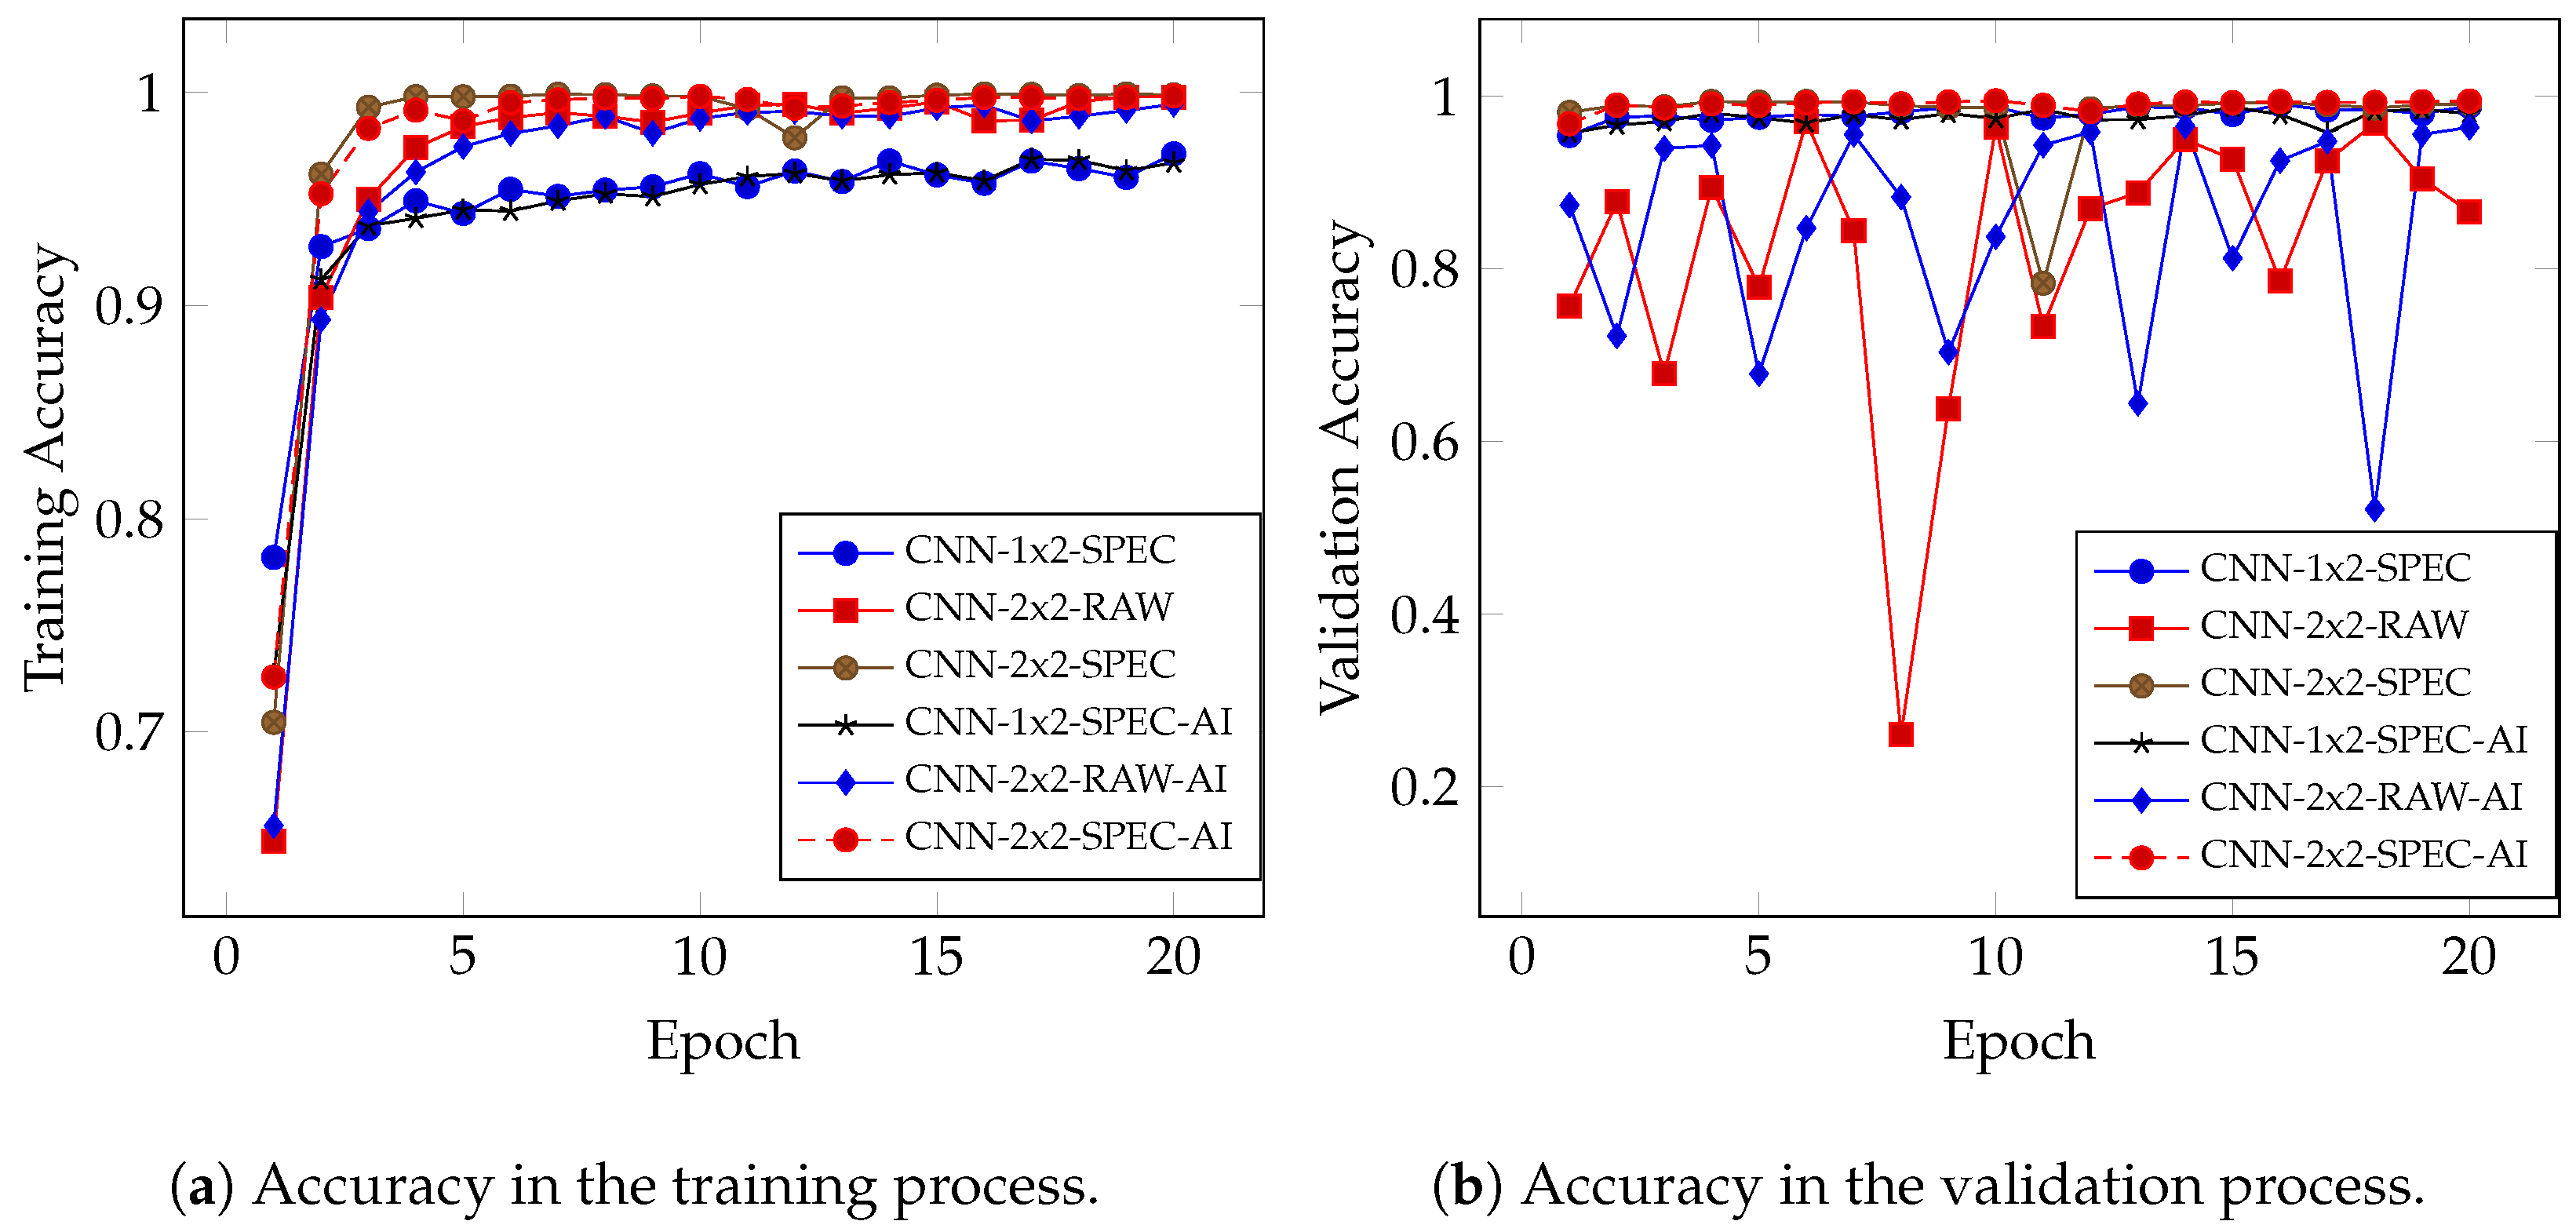
5.2.2. CNN Networks
The described CNN networks have been evaluated on all four datasets. A comparison is provided by the CNN-2 × 2 on the SPEC and SPEC-AI datasets, while the evaluation on the RAW and RAW-AI datasets with CNN-2 × 2 is used to identify the possibility of CNN usage with the raw sensor data. CNN-1 × 2 has been evaluated on the SPEC and SPEC-AI datasets only to evaluate a possible calculation complexity reduction compared to CNN-2 × 2.
The results of the classification accuracy for the training phase are shown in
Figure 6a. It is shown that the classification accuracy in training converges very rapidly for all networks, resulting in accuracies between 96.6% and 99.8%. When comparing the results between the SPEC and SPEC-AI datasets, no significant differences are observable. The very rapid increase and stagnation at the high classification level suggest that overfitting may have occurred. In addition, CNN-1 × 2 shows a lower classification accuracy on both the SPEC and SPEC-AI datasets compared to the CNN-2 × 2 networks. Furthermore, a slight oscillation is observable in the case of CNN-1 × 2.
The results of the classification accuracy for the validation process (compare
Figure 6b) show a strong oscillation, especially for the CNN-2 × 2 network on the RAW and RAW-AI datasets. Thus, for this network and the datasets with raw sensor data, an overfitting of the network is observed and no generalization of the network could be achieved. Equally to the training results, the CNN-2 × 2 and the CNN-1 × 1 networks show on the SPEC and SPEC-AI datasets comparably high classification accuracies.
When analyzing the loss function, overfitting of the CNN-2 × 2 network on the raw sensor data is confirmed by an equally high oscillation of the loss function. The results of the remaining combinations are shown in
Figure 7. For CNN-2 × 2 on the SPEC and SPEC-AI datasets, a low and converging loss function can be observed. Furthermore, it can be seen that the artificially generated data improved the generalization by eliminating the spike at epoch 11. On the contrary, CNN-1 × 2 shows a relatively high loss function and no convergence, indicating overfitting. The high loss function level and the slight oscillation observed in the training phase lead to the conclusion of overfitting. The high loss function shows a high learning error. Since the classification accuracy is also on a high level, the networks improve the classification in each epoch for another class but worsen the result of another one. Thus, the classification accuracy maintains an even level but exhibits a slight oscillation. In consequence, the CNN-1 × 2 network architecture is not sufficiently complex since the more complex CNN-2 × 2 network results in a generalized model. Thus, only the CNN-2 × 2 can be successfully trained to the present dataset.
5.2.3. MLP Networks
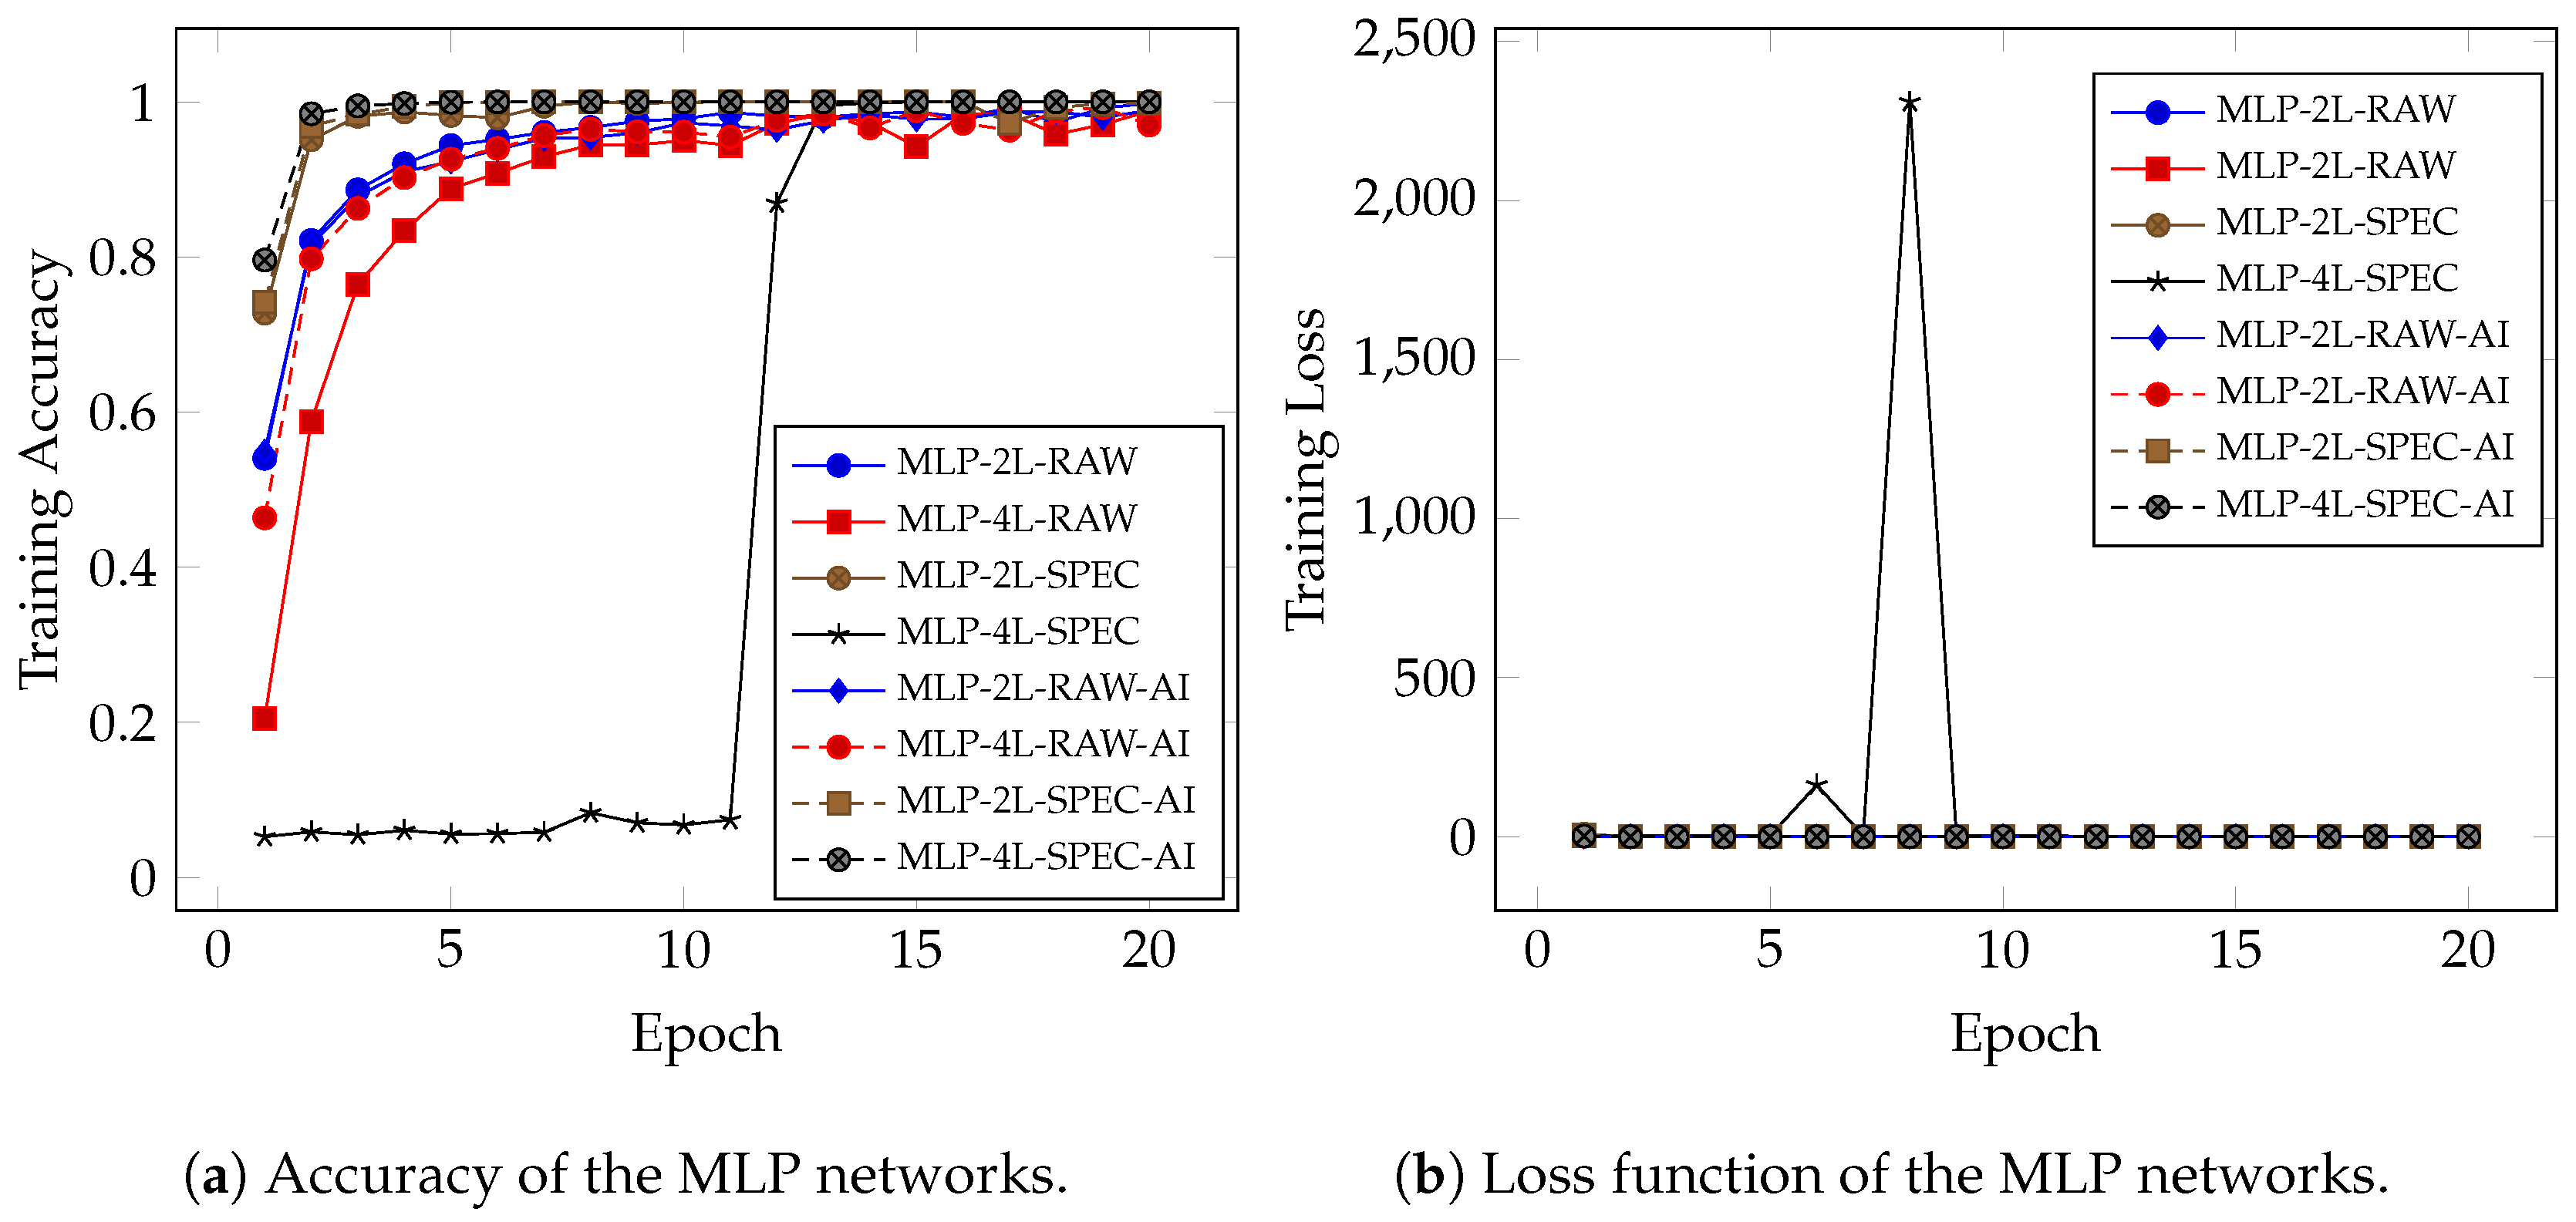
As the final deep learning method, MLPs were evaluated for their applicability in impact localization. The networks MLP-2L and MLP-4L were evaluated on all four datasets accordingly. A direct comparison of the training performance of the two networks on the four datasets is shown in
Figure 8a. The graph shows a convergence of the training classification accuracy for all combinations except MLP-4L using the SPEC dataset. The results show that MLP-2L using the SPEC and the SPEC-AI datasets, as well as MLP-4L on the SPEC-AI dataset, exhibits a high convergence speed, resulting in high accuracy rates of about 100%. When comparing the methods on the raw sensor datasets RAW and RAW-AI, a reduced convergence speed is shown. However, the achieved classification accuracies result in comparably high rates between 97% and 99.8%.
In the case of MLP-4L using the SPEC dataset, the classification accuracy remains low at 5% to 8% for 11 epochs and jumps to 87% only in two epochs, finally resulting in a 100% classification accuracy. This behavior can be explained by the loss function analysis of the training process.
Figure 8b shows the loss function for MLP-4L on the SPEC dataset. It becomes evident that the the low classification accuracies in the first epochs result from two high training errors in epoch six and eight. These huge errors lead to a reset of the training process. The reason for these errors may be the insufficient amount of data in the SPEC dataset, since MLP-2L, with two fewer layers, provides a good training performance just as the same network on the SPEC-AI dataset with five times more data. In consequence, the MLP-4L network profits from the artificially generated data, improving the training performance.
Considering the results of the validation process, a comparable behavior is observed (see
Figure 9a). Also, all methods and dataset combinations, with the exception of the MLP-4L network on the SPEC dataset, converge and all methods reach a high level of classification accuracy of 91.5% to 99.3%. Since the training process failed in the first epochs in the case of MLP-4L using the SPEC dataset, insufficient accuracies are also achieved on the validation dataset in the first epochs. However, the final classification accuracy achieved is 99.2%. Comparable to the training, the methods using the SPEC and SPEC-AI datasets achieve higher accuracies compared to those using the RAW and RAW-AI datasets. A comparison of the MLP-4L network on the RAW and RAW-AI datasets shows that the additional artificially generated data contribute to a better generalization, since the oscillations are reduced.
The results are confirmed by an analysis of the loss function, shown in
Figure 9b. It is equally evident that using the SPEC and SPEC-AI datasets results in a lower loss level than that using the RAW and RAW-AI datasets, which in turn is reflected in the classification accuracies. Similarly, a higher oscillation is observed for MLP-2L on the RAW dataset compared to the RAW-AI dataset. This is in agreement with the observations of the validation classification accuracy results. However, in the case of MLP-2L using the SPEC dataset, a high loss value is observed at epoch 4, leading to an oscillation in the classification accuracy (see
Figure 9a).
6. Discussion
For each deep learning method, at least one combination of a dataset and a network has been identified that provides classification accuracies of over 90%.
Taking into account the validation accuracy and the achieved loss function values, the best results are obtained for CNN-2 × 2 using the SPEC-AI dataset. This CNN achieves a training accuracy of 99.8%, a validation accuracy of 99.5% and a loss function value of 0.017. These results represent the highest validation accuracy, accompanied by the minimum loss value, obtained by all compared methods. A comparable result is achieved by the same network on the SPEC dataset, with 99.9% accuracy in training, 99.4% in validation and a slightly higher loss value of 0.029. This is remarkable because CNN-1 × 2 did not accomplish generalization.
The MLPs achieved comparable results. MLP-4L achieved, on the SPEC-AI dataset, a training accuracy of 100%, a validation accuracy of 99.4% and a loss value of 0.064. Thus, the results are generally similar to the results of CNN-2 × 2, but the loss value, as an error measurement, is about 3 times higher. The same MLP achieves a training accuracy of 100%, a validation accuracy of 99.2% and a loss value of 0.057 on the SPEC dataset. However, it should be noted that the training process on the SPEC dataset was fraught with problems in the first epochs, resetting the training process. Nevertheless, the very good classification results of the MLPs offer the possibility of efficient use on embedded systems, since their mathematical complexity is lower compared to CNNs and RNNs.
Among the representatives of RNNs, GRU-BI and LSTM-BI on the SPEC dataset have proven to be particularly suitable. GRU-BI also achieves a training accuracy of 100% and a validation accuracy of 98%, with a loss value of 0.065.
Considering the RNNs, comparing LSTM to LSTM-BI and GRU to GRU-BI, it is clear that bidirectional concatenation leads to improved results and faster training convergence. However, the mathematical complexity of the networks is essentially higher, resulting in significantly longer training and classification times. This is a disadvantage, especially when focusing on embedded systems. Furthermore, the results on the raw sensor data were not satisfying, so further preprocessing of the data by applying an FFT is necessary, which in turn leads to an increase in the computation time in live operations.
Looking at the results by dataset, the MLPs and CNN-2 × 2 achieve high accuracies in training and validation on the RAW dataset, but perform worse on the loss values. Even the addition of artificially generated data does not lead to a significant improvement, even through the training and validation accuracies are slightly improved. When comparing the values of the SPEC and SPEC-AI datasets, a similar picture emerges, with the exception of the results already mentioned for CNN-2 × 2 and GRU-4L. However, it is evident that the training process can be improved by adding artificially generated data, as shown by the MLP-4L results using the SPEC dataset.
7. Conclusions and Future Work
The focus of this work is a feasibility analysis of deep learning methods for impact detection as a haptic input device interface. For this purpose, a preliminary study and a main study were conducted. The preliminary study has been used to demonstrate the general applicability of deep learning methods and to identify necessary preprocessing steps, resulting in various datasets for the main study. The main study analyzed different realizations of LSTMs, RNNs, CNNs, and MLPs by evaluating the classification accuracy in training and validation as well as the loss function using the derived datasets. The results show the high potential of deep learning methods with validation accuracies of up to 99%. The results are consistent with those described in the state of the art.
The current study proves the usability of the PZT-based laminate for impact detection by using deep learning methods for the used center console. In addition, the suitability of MLPs for impact localization is evident, as is the suitability of the more recently developed CNNs. Nevertheless, the results are not directly comparable to the results in the state of the art, since in the present study, the center console is a formed specimen, while most related works use planar plates. Even though PZT-based sensors have been used in this study as well as in numerous previous works, the used laminate in this study differs clearly from the state of the art. In contrast to applied monolithic PZT sensors, PZT particles are integrated into the plastic layer of the laminate. Thus, the sensor is an integral part of the hybrid laminate. This active layer offers the possibility of a functionalized semi-finished part that can be transformed to a component with integrated sensor functions. In comparison to conventional PZT-based sensors and applied or integrated foils of polyvinylidene fluoride (PVDF), the sensitivity of the piezoactive layer and the amplitude of the generated sensor signal are lower. However, this leads to a higher capability of the investigated laminate. Environmental influences like thermal effects, external vibrations or acoustic waves are filtered by the material itself. Due to the accompanying noise reduction, less noise is picked up and the signal quality is increased. Accordingly, the tapping carried out by users has to be slightly stronger, which is why approximately 14% of the recordings had to be excluded in our experiments. On the other hand, the high sensitivity of monolithic PZT and PVDF leads to undesirable effects and faulty detections of impacts when using conventional piezoceramic sensors or PVDF layers. This behavior was also determined in investigations in the field of structural health monitoring.
Subsequent research should analyze whether the very good classification results are related to the used network structure or to the independently developed laminate. For this purpose, it is necessary to perform further studies where identical samples are trained and analyzed with the same networks. Furthermore, upcoming work should evaluate whether the identified networks can be efficiently implemented on embedded systems, or whether they require additional hardware acceleration via GPUs or FPGAs.
Author Contributions
The individual contributions of the authors are as follows: conceptualization, R.S. and S.L.; methodology, R.S., A.G. and R.D.; formal analysis, R.S., A.G. and R.D.; software, R.S. and S.L.; investigation, R.S., A.G. and R.D.; writing—original draft preparation, R.S., A.G. and R.D.; writing—review and editing, V.K.; project administration, V.K., L.K. and W.H. All authors have read and agreed to the published version of the manuscript.
Funding
Funded by the Deutsche Forschungsgemeinschaft (DFG, German Research Foundation), project number 491193532, and the Chemnitz University of Technology.
Institutional Review Board Statement
Not applicable.
Informed Consent Statement
Not applicable.
Data Availability Statement
The raw data supporting the conclusions of this article will be made available by the authors on request.
Acknowledgments
We gratefully acknowledge the cooperation of our project partners and the support of the Cluster of Excellence “MERGE”.
Conflicts of Interest
The authors declare no conflicts of interest.
References
- Vlot, A.; Gunnink, J. Fibre Metal Laminates an Introduction; Kluwer Academic Publishers: Dordrecht, The Netherlands, 2001; p. 523. [Google Scholar]
- Ibis, M.; Groche, P. Forming Limit Curves of Electrically Conductive Layers Printed on Sheet Metal Surfaces. Procedia Eng. 2014, 81, 779–786. [Google Scholar] [CrossRef]
- Brenneis, M.; Ibis, M.; Duschka, A.; Groche, P. Towards Mass Production of Smart Products by Forming Technologies. Adv. Mater. Res. 2014, 907, 113–125. [Google Scholar] [CrossRef]
- Müller, M.; Müller, B.; Hensel, S.; Nestler, M.; Jahn, S.; Wittstock, V.; Schubert, A.; Drossel, W.G. Structural Integration of PZT Fibers in Deep Drawn Sheet Metal for Material-integrated Sensing and Actuation. Procedia Technol. 2014, 15, 658–667. [Google Scholar] [CrossRef]
- Furukawa, T.; Fujino, K.; Fukada, E. Electromechanical Properties in the Composites of Epoxy Resin and PZT Ceramics. Jpn. J. Appl. Phys. 1976, 15, 2119–2129. [Google Scholar] [CrossRef]
- Hardt, W.; Kräusel, V.; Kroll, L.; Landgrebe, D.; Heinrich, M.; Decker, R.; Graf, A.; Ullmann, F. Scalable process for the production of active hybrid laminates. In Multifunctional Lightweight Structures; Springer Nature: Berlin/Heidelberg, Germany, 2023. [Google Scholar] [CrossRef]
- Schmidt, R.; Graf, A.; Decker, R.; Kräusel, V.; Hardt, W.; Landgrebe, D.; Kroll, L. Hybrid Laminate for Haptic Input Device with Integrated Signal Processing. Appl. Sci. 2018, 8, 1261. [Google Scholar] [CrossRef]
- Schmidt, R.; Graf, A.; Decker, R.; Heinrich, M.; Kräusel, V.; Kroll, L.; Hardt, W. Monitoring the Structural Health of Glass Fibre-Reinforced Hybrid Laminates Using Novel Piezoceramic Film. Sensors 2020, 20, 5428. [Google Scholar] [CrossRef] [PubMed]
- Staszewski, W.J.; Worden, K.; Wardle, R.; Tomlinson, G.R. Fail-safe sensor distributions for impact detection in composite materials. Smart Mater. Struct. 2000, 9, 298. [Google Scholar] [CrossRef]
- Seno, A.H.; Aliabadi, M. Impact localisation in composite plates of different stiffness impactors under simulated environmental and operational conditions. Sensors 2019, 19, 3659. [Google Scholar] [CrossRef] [PubMed]
- Fu, H.; Vong, C.M.; Wong, P.K.; Yang, Z. Fast detection of impact location using kernel extreme learning machine. Neural Comput. Appl. 2016, 27, 121–130. [Google Scholar] [CrossRef]
- Datta, A.; Augustin, M.; Gupta, N.; Viswamurthy, S.; Gaddikeri, K.M.; Sundaram, R. Impact localization and severity estimation on composite structure using fiber bragg grating sensors by least square support vector regression. IEEE Sens. J. 2019, 19, 4463–4470. [Google Scholar] [CrossRef]
- Lu, S.; Jiang, M.; Sui, Q.; Sai, Y.; Jia, L. Low velocity impact localization system of CFRP using fiber Bragg grating sensors. Opt. Fiber Technol. 2015, 21, 13–19. [Google Scholar] [CrossRef]
- Sung, D.U.; Oh, J.H.; Kim, C.G.; Hong, C.S. Impact monitoring of smart composite laminates using neural network and wavelet analysis. J. Intell. Mater. Syst. Struct. 2000, 11, 180–190. [Google Scholar] [CrossRef]
- Haywood, J.; Coverley, P.; Staszewski, W.J.; Worden, K. An automatic impact monitor for a composite panel employing smart sensor technology. Smart Mater. Struct. 2004, 14, 265. [Google Scholar] [CrossRef]
- Park, S.O.; Jang, B.W.; Lee, Y.G.; Kim, Y.Y.; Kim, C.G.; Park, C.Y.; Lee, B.W. Detection of impact location for composite stiffened panel using FBG sensors. Adv. Mater. Res. 2010, 123, 895–898. [Google Scholar] [CrossRef]
- LeClerc, J.; Worden, K.; Staszewski, W.J.; Haywood, J. Impact detection in an aircraft composite panel—A neural-network approach. J. Sound Vib. 2007, 299, 672–682. [Google Scholar] [CrossRef]
- Damm, A.M.; Spitzmüller, C.; Raichle, A.T.; Bühler, A.; Weißgraeber, P.; Middendorf, P. Deep learning for impact detection in composite plates with sparsely integrated sensors. Smart Mater. Struct. 2020, 29, 125014. [Google Scholar] [CrossRef]
- Tabian, I.; Fu, H.; Sharif Khodaei, Z. A convolutional neural network for impact detection and characterization of complex composite structures. Sensors 2019, 19, 4933. [Google Scholar] [CrossRef] [PubMed]
- Chen, T.; Guo, L.; Duan, A.; Gao, H.; Feng, T.; He, Y. A feature learning-based method for impact load reconstruction and localization of the plate-rib assembled structure. Struct. Health Monit. 2022, 21, 1590–1607. [Google Scholar] [CrossRef]
- Abadi, M.; Agarwal, A.; Barham, P.; Brevdo, E.; Chen, Z.; Citro, C.; Corrado, G.S.; Davis, A.; Dean, J.; Devin, M.; et al. TensorFlow: Large-Scale Machine Learning on Heterogeneous Systems. 2015. Available online: http://tensorflow.org/ (accessed on 7 March 2024).
- Chollet, F. Keras. 2015. Available online: https://keras.io (accessed on 7 March 2024).
| Disclaimer/Publisher’s Note: The statements, opinions and data contained in all publications are solely those of the individual author(s) and contributor(s) and not of MDPI and/or the editor(s). MDPI and/or the editor(s) disclaim responsibility for any injury to people or property resulting from any ideas, methods, instructions or products referred to in the content. |
© 2024 by the authors. Licensee MDPI, Basel, Switzerland. This article is an open access article distributed under the terms and conditions of the Creative Commons Attribution (CC BY) license (https://creativecommons.org/licenses/by/4.0/).


 ,
, 


