Article

Combining Electromyography and Tactile Myography to Improve Hand and Wrist Activity Detection in Prostheses

1
Idiap Research Institute, Rue Marconi 19, 1920 Martigny, Switzerland
2
DLR—German Aerospace Center, Münchener Str. 20, 82234 Wessling, Germany
*
Author to whom correspondence should be addressed.
Technologies 2017, 5(4), 64; https://doi.org/10.3390/technologies5040064
Submission received: 15 August 2017 / Revised: 29 September 2017 / Accepted: 2 October 2017 / Published: 6 October 2017
(This article belongs to the Special Issue Assistive Robotics)

Abstract

:
Despite recent advances in prosthetics and assistive robotics in general, robust simultaneous and proportional control of dexterous prosthetic devices remains an unsolved problem, mainly because of inadequate sensorization. In this paper, we study the application of regression to muscle activity, detected using a flexible tactile sensor recording muscle bulging in the forearm (tactile myography—TMG). The sensor is made of 320 highly sensitive cells organized in an array forming a bracelet. We propose the use of Gaussian process regression to improve the prediction of wrist, hand and single-finger activation, using TMG, surface electromyography (sEMG; the traditional approach in the field), and a combination of the two. We prove the effectiveness of the approach for different levels of activations in a real-time goal-reaching experiment using tactile data. Furthermore, we performed a batch comparison between the different forms of sensorization, using a Gaussian process with different kernel distances.

1. Introduction

Most of the clinically available non-invasive externally-powered hand prostheses are controlled by identifying myoelectric signals corresponding to finger, hand and wrist activations. Surface electromyography (sEMG) sensors allow for capturing the electrical activity of the muscles of the forearm, which is used to estimate the user intent using machine learning methods [1]. Most research efforts in this area have focused on myoelectric prostheses, by exploring the control of one, two or multiple degrees of freedom (DOFs) [2,3,4] or by exploiting hand synergies [5,6]. Even by means of this technology, simultaneous and proportional control of multiple DOFs remains a major challenge [7]; the problem is that even when state-of-the-art machine learning algorithms are used to interpret sEMG data, robust (reliable) hand activity detection is not yet possible in daily living activities with a small number of sEMG sensors.
In order to try to provide a solution to this problem, we propose the exploiting of tactile myography (TMG) to detect hand and wrist movements as a complementary source of information to augment the traditional sEMG sensors. TMG is high-resolution pressure information, related to the deformations induced by muscle activity in the body [8,9]. In [10], a shape-conformable tactile bracelet was developed, comprising 320 sensors (taxels) measuring the bulging of the muscles around the full circumference of the forearm. A preliminary comparison between TMG and sEMG during a real-time target-reaching experiment showed that detection using linear regression applied directly to the data of the bracelet tends to outperform detection using sEMG [11]. In this work specifically, we propose the use of Gaussian process regression (GPR) [12] to improve the intent detection with TMG data and to combine information of the two sources. The choice of GPR is motivated by the fact that only a limited number of samples is needed to train the method. Despite that the data contains the typical type of patterns that could be treated by deep learning strategies, the use of such an approach would require a large training dataset to be efficient. Such a dataset would require many hours of data collection with each amputee, which would result in a non-user-friendly system. As TMG data have a matrix form, we aim to exploit the data structure to learn a controller from few examples. This is achieved using a tensor Gaussian process [13,14], which is an extension of the Gaussian process to matrix data (or data organized as higher-order arrays). We extend this method to multimodal data and perform regression using TMG and sEMG to detect user intents. Our contribution is twofold. First, we validate the use of the Gaussian process for TMG data with a real-time goal-reaching task involving hand and wrist movement detection. Second, we propose a GPR approach to combine multimodal data and compare the use of sEMG, TMG and a combination of both for hand and wrist movement detection. For both experiments, the intended activations were associated with input signal patterns by relying on the values of an animated hand model that the participants had to imitate. This approach could introduce some mismatches compared to the use of a dataglove or a vision system to detect the hand pose. The aim of using this method was to test if such a protocol could be used in future studies with amputees, for whom data cannot be collected by directly measuring the movements of the hand. The paper is organized as follows. Section 2 and Section 3 present the sensors and regression methods used in the experiments. Section 4 describes the experimental protocol. The results are presented and discussed in Section 5 and Section 6. Section 7 concludes the paper.

2. Materials

Muscle activity was acquired using two sensor devices. The first was based on TMG, and the process is known as high-resolution force myography (HD-FMG) or residual kinetic imaging (RKI). This idea was introduced in the prosthetics community by Craelius, Phillips and others [8,9], who demonstrated that this method could intensify patterns of individual finger motions. The second device was based on sEMG, which is the standard detection method in clinical applications. The bracelets were placed on the proximal end of the forearm, at the position with the greatest muscle bulk, as shown in Figure 1a.

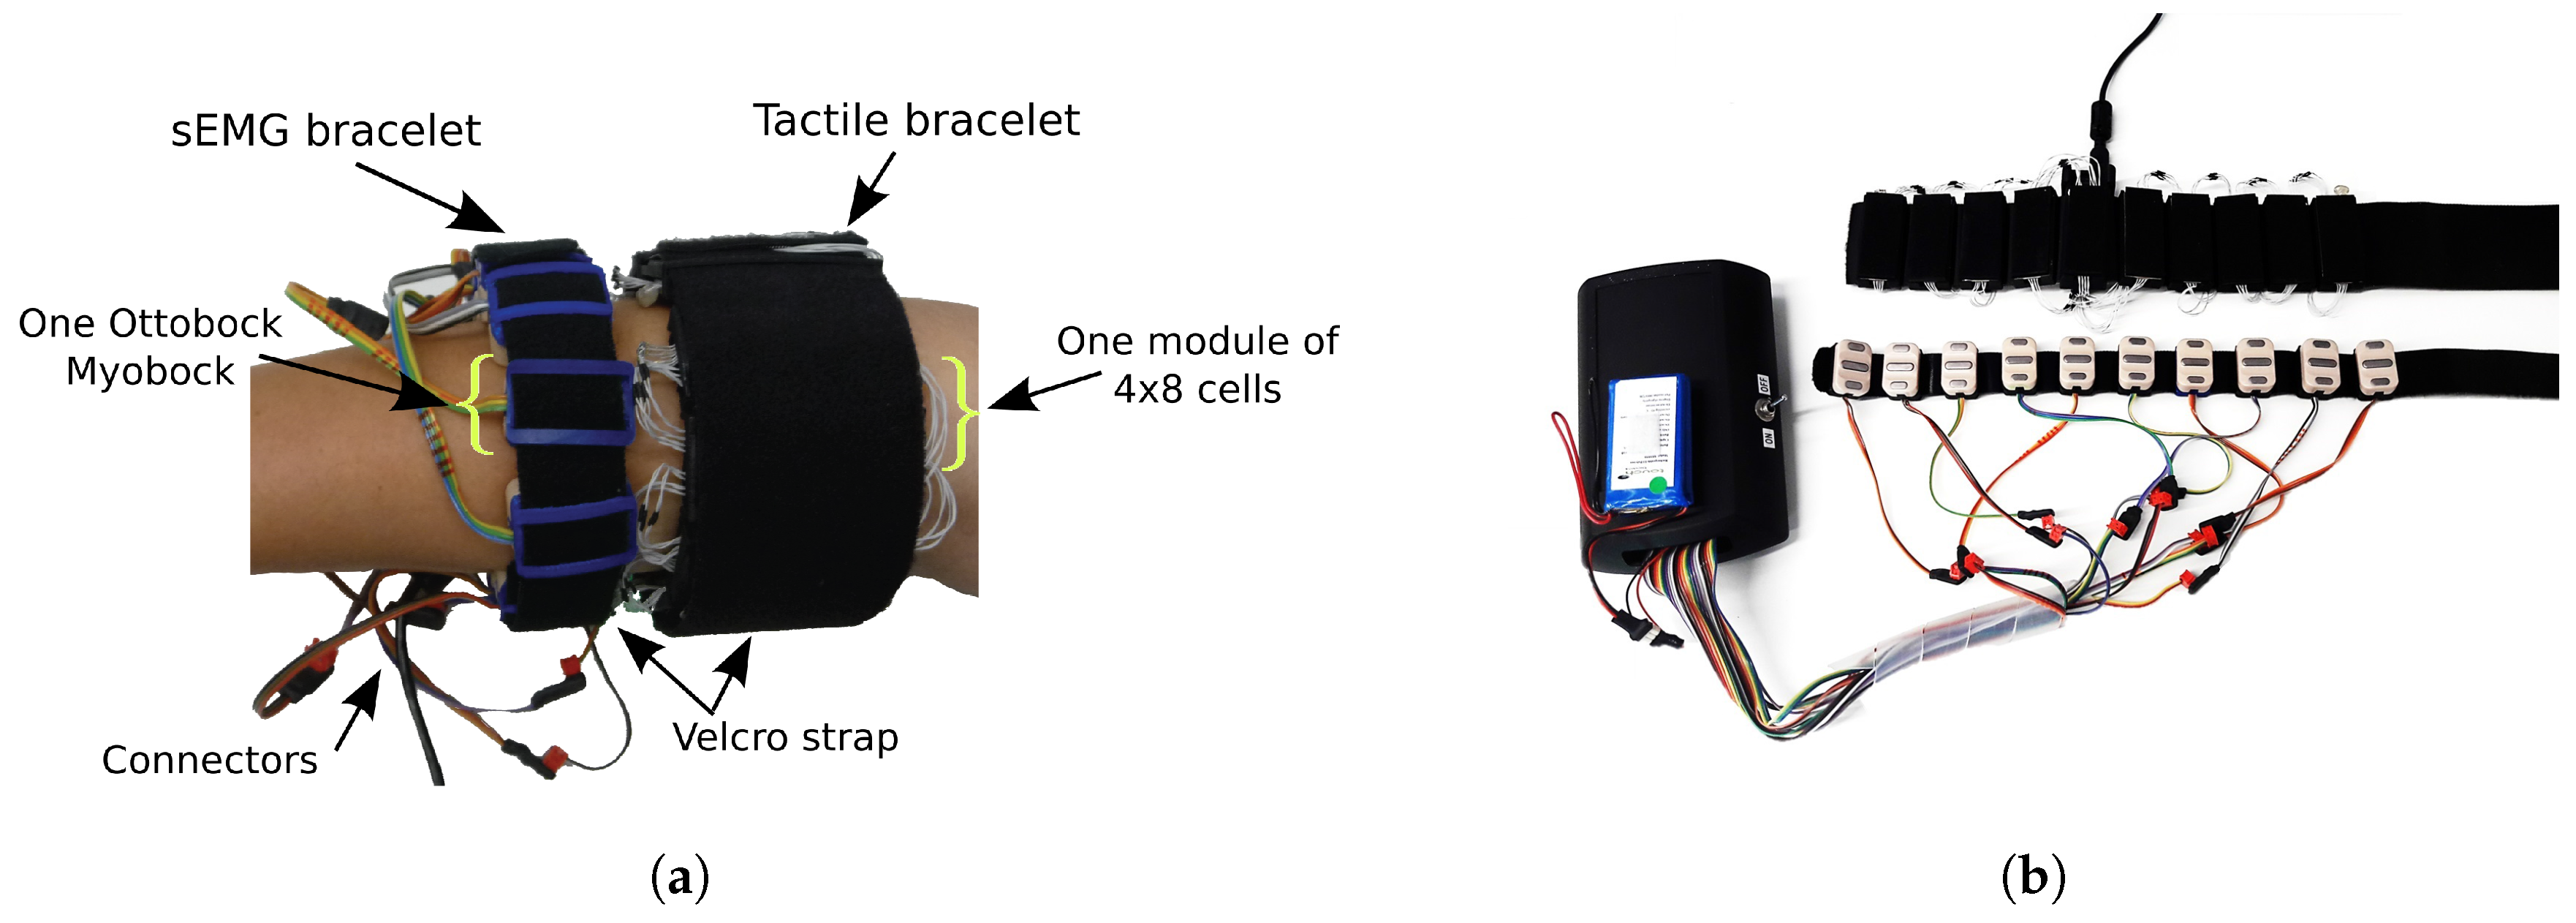
2.1. Surface Electromyography Bracelet

Ten Ottobock MyoBock 13E200=50 placed on a Velcro strap, as shown in Figure 1b, were used to gather sEMG data. The sensors were linked to the wireless acquisition device developed in [15], which can gather up to 32 sensors by multiplexing the channels and gathering these through the 12-bit analog-to-digital converter (ADC) of a MSP430 microcontroller that transmitted the data via Bluetooth to the computer. In our case, only 10 sensors were used because of the limited space on the forearm. The functional block representation of the acquisition device is shown by Figure 2. Each off-the-shelf sEMG sensor provided amplification, rectification and filtering on-board. Such sensors are standardly used in prosthetic sockets for myocontrol.

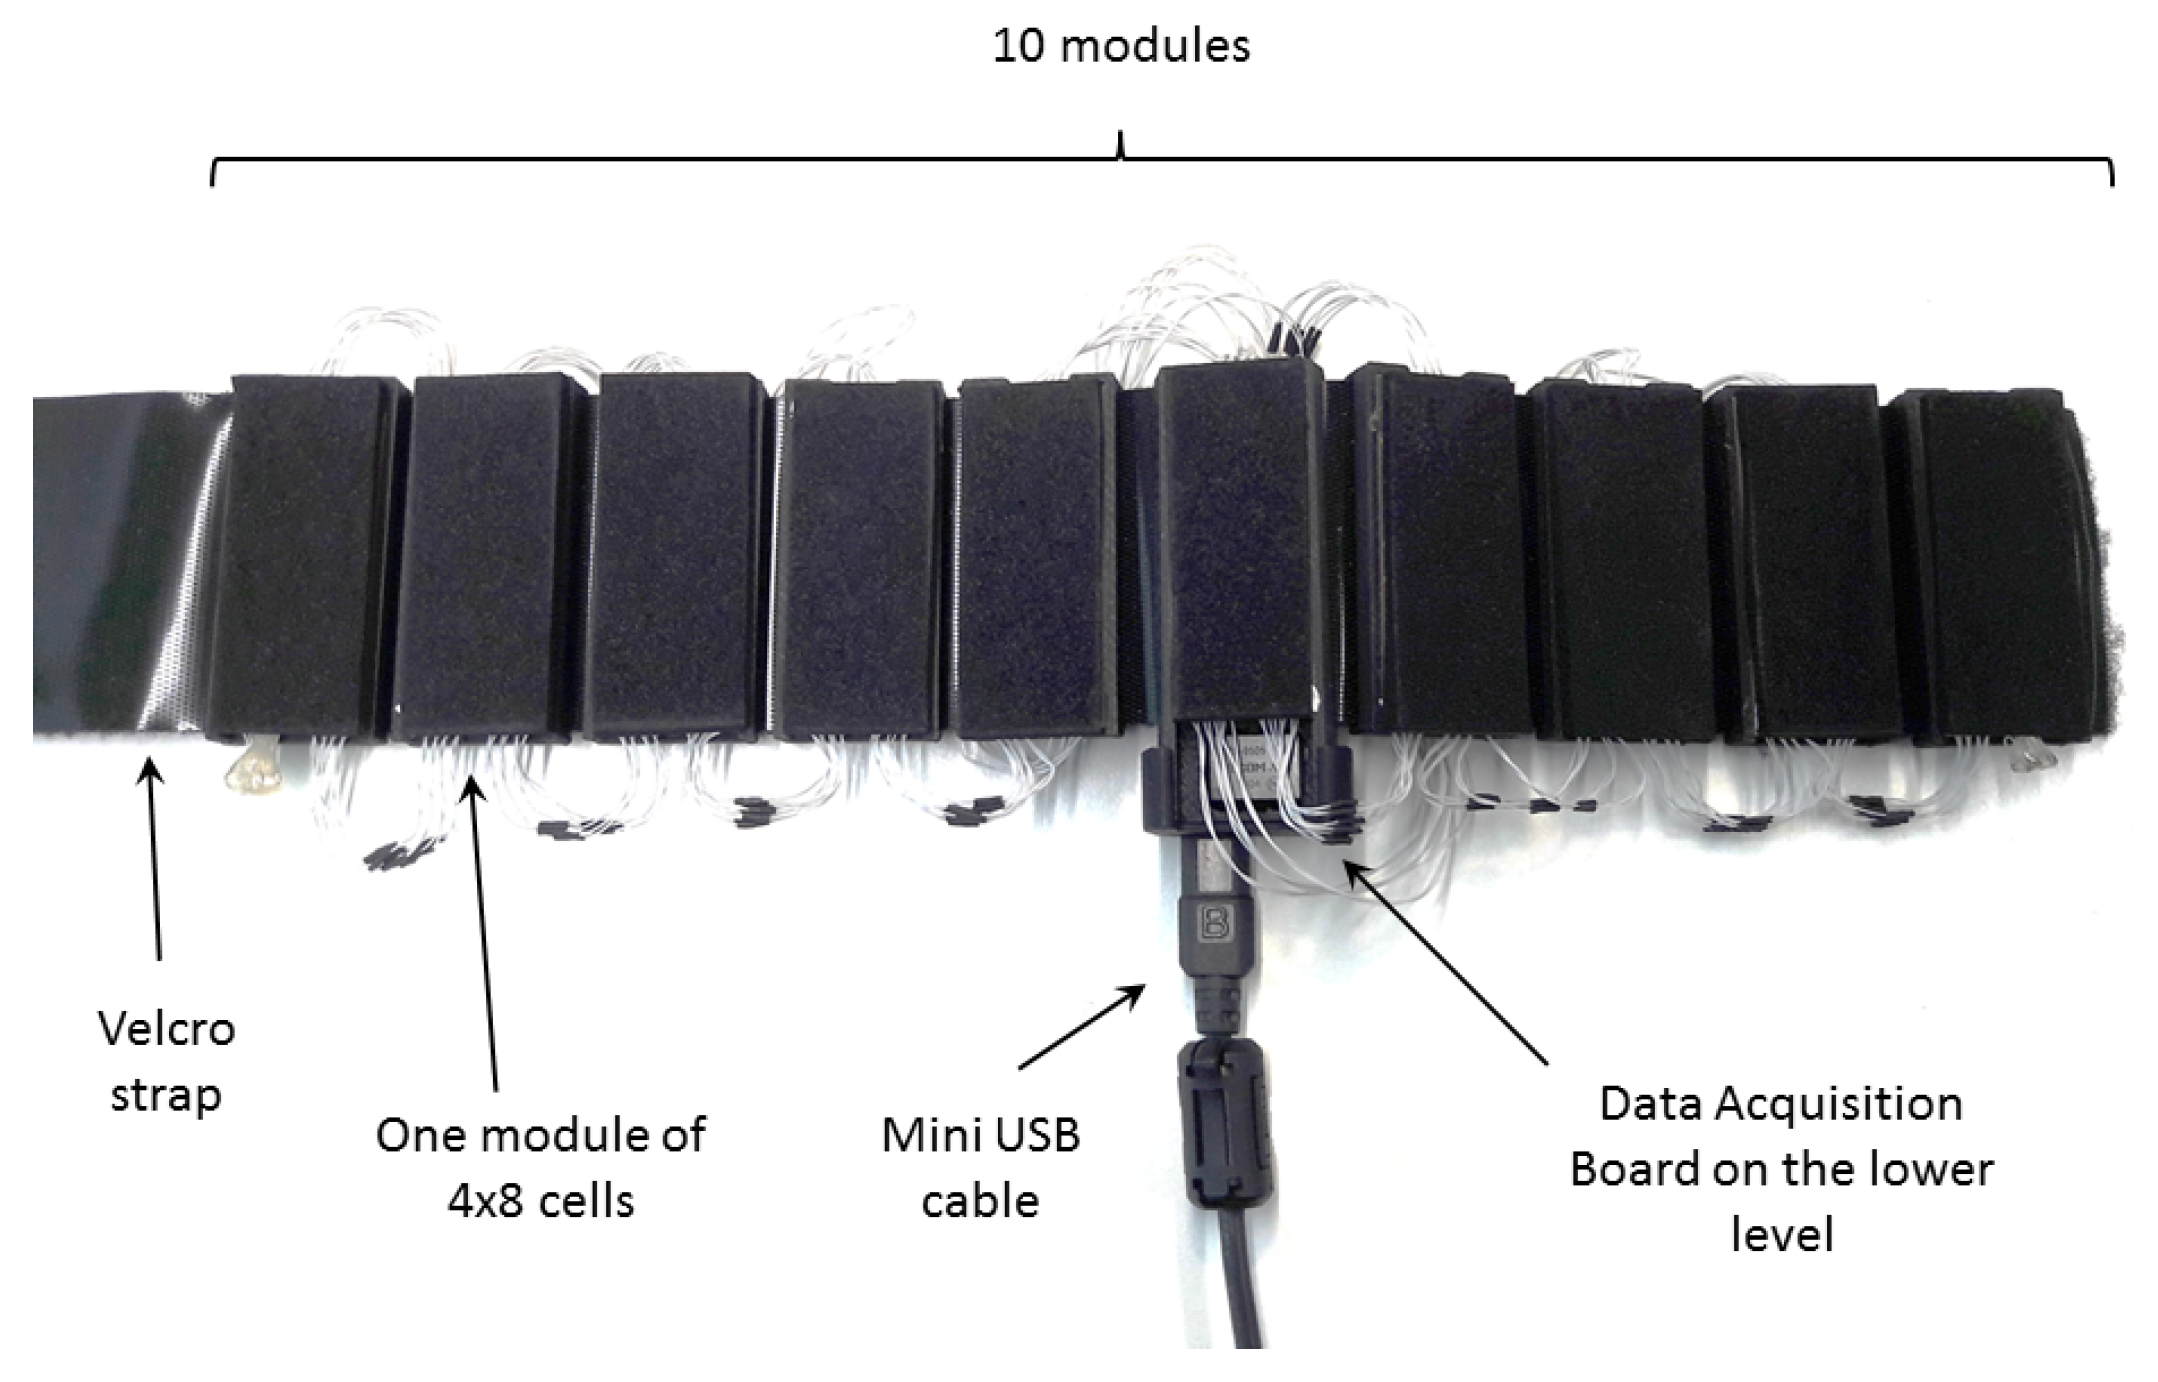
2.2. Tactile Bracelet

The tactile bracelet developed in [10] was composed of 7 to 10 modules, each having 4 × 8 cells, resulting in a total of 320 input sensors. Each module was linked to the main data acquisition board that gathered the signals with 12-bit precision via serial peripheral interface (SPI) and sent them through a serial port via a mini USB cable (see Figure 3). On each module lay a soft, porose conductive foam whose resistance decreased when pressure was applied. The variable cell resistance was then converted to a voltage value and, after passing through a standard voltage divider, was sent through an ADC to obtain the sensor output. TMG gathers a high-spatial resolution (5 mm) image of the pressure exerted at the surface of the forearm by the volumetric changes of the muscles due to movements. All details regarding the device can be found in [10], while further details regarding the resistive-based approach to TMG employed in the device are available in [16].

3. Methods

3.1. Gaussian Process Regression

Gaussian processes are a class of probabilistic models that define a posterior over functions given a set of input and output data. A dataset of N observations { ( x n , y n ) } n = 1 N or { X , Y } is encoded as a joint distribution, which is assumed to be Gaussian with some mean μ and covariance or kernel matrix K , as follows:
p ( y | X ) N ( μ , K )
The covariance K R N × N is computed using a kernel function k as a measure of similarity so that K i j = k ( x i , x j ) . If two input points are similar according to the kernel, the output of the function at those points will also be similar. The predictive distribution of a new output y corresponding to a new input x can then be inferred as
p ( y | x , X , y ) N ( μ , Σ )
where
μ = k ( x , X ) k ( X , X ) + σ 2 I 1 Y , Σ = k ( x , x ) k ( x , X ) k ( X , X ) + σ 2 I 1 k ( X , x )

3.2. Gaussian Process Regression for Matrix-Valued Data

GPR can be adapted to matrix and higher-order data by adapting the kernel function computation [13]. Given a dataset of N observations { ( X n , y n ) } n = 1 N , the kernel is defined as a product of positive semi-definite factor kernels:
k ( X i , X j ) = k ( X i , X j ) k ( X i , X j )
where X is the transpose of X .

3.3. Gaussian Process Regression for Multimodal Data

Given a dataset of N multimodal observations { ( X n 1 , , X n M , x n 1 , , x n P , y n ) } n = 1 N , where the inputs are matrix and/or vector-valued data, we propose to define the kernel as the following product:
k ( { X i , x i } , { X j , x j } ) = m = 1 M k ( X i m , X j m ) p = 1 P k ( x i p , x j p )

3.4. Kernels

We consider factor kernels in the form of radial basis function (RBF) kernels defined as
k ( x i , x j ) = exp d ( x i , x j ) 2 β 2
where d ( x i , x j ) is a distance measure and β is a scaling parameter defining the variance of the Gaussian. We investigated different distance measures for matrix and vector-valued data, namely
  • the Kullback–Leibler (KL) divergence d KL = KL p ( X i | μ i , Σ j ) q ( X j | μ j , Σ j ) by treating all matrix data as a Gaussian generative model [14];
  • two different distances for covariance or symmetric positive definite (SPD) matrices, d logSPD = ln ( Σ i ) ln ( Σ j ) F and d SPD = Σ i Σ j F , where Σ = X if X is a SPD matrix and Σ = cov ( X ) otherwise [17];
  • the Euclidean distance d Eucl = vec ( X i ) vec ( X j ) for matrices and d Eucl = x i x j for vectors.

4. Experiments

4.1. Participants

Nine non-amputated right-handed participants joined both experiments (two females and seven males, aged 31 ± 6 with a minimum age of 24 and a maximum age of 45 years old). None of the participants had medical issue that could interfere with the measurements. Moreover, three participants knew the material from previous experiments. The procedure was thoroughly explained to each participant before the trial, and it was conducted according to the World Medical Association (WMA) Declaration of Helsinki; informed consent was obtained from all the participants in written form.

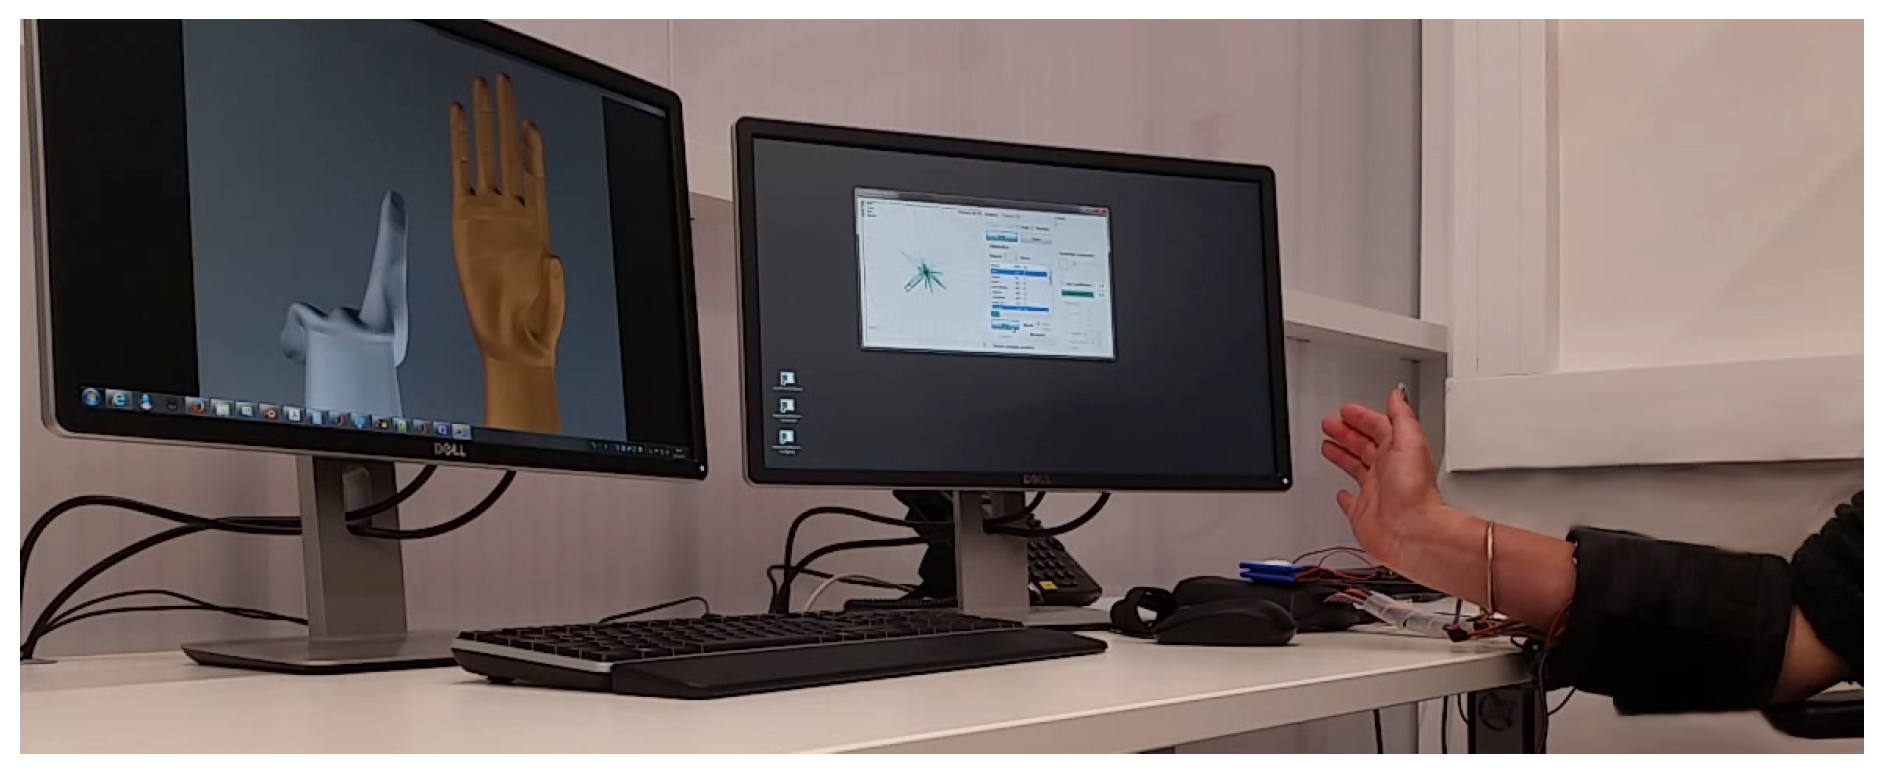
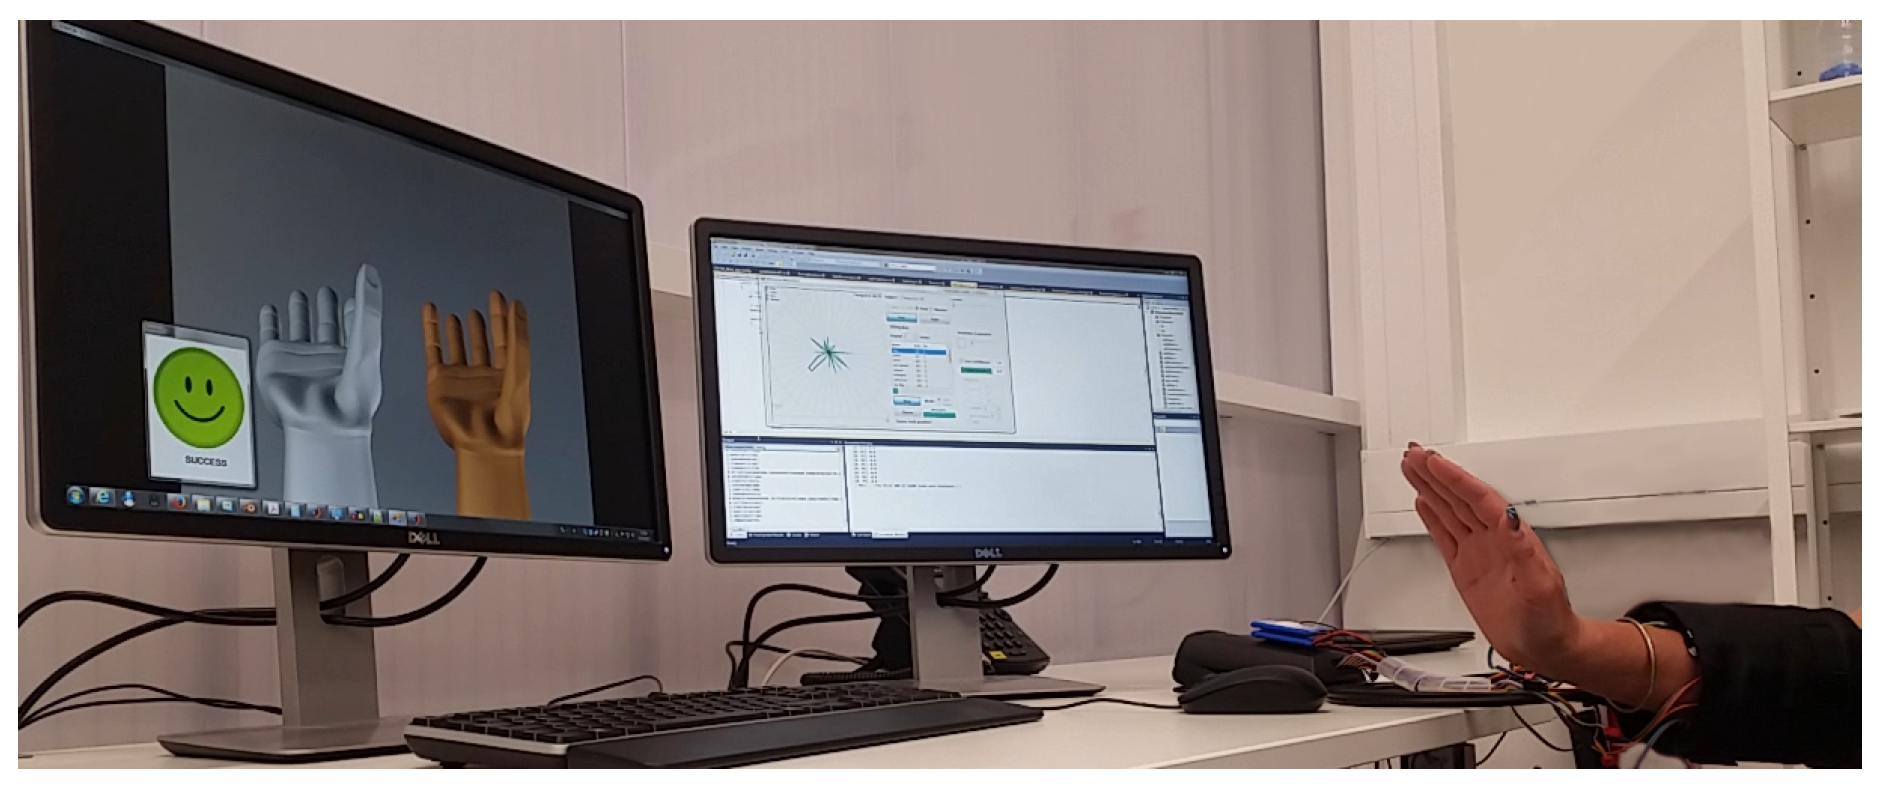
4.2. Experimental Setup

For both experiments, each participant was asked to sit comfortably in a chair in front of a monitor. The tactile and sEMG bracelets were fitted on the upper part of their right forearm, the tactile bracelet being further up than the sEMG sensors, as shown in Figure 1a. Ground truth was obtained by using the values of an animated visual stimulus in the form of a 9-DOF hand model. The stimulus was displayed on the monitor. This method relies on the assumption that the participant replicates the hand model movements with reasonable accuracy. For a study with non-amputees, it has the drawback of possibly reducing the precision in the prediction of the intent detection as a result of the delay required by the participant to adapt. However, as we forecasted future studies to be conducted with amputees, we could not collect data using precise systems such as motion capture or a position-sensing glove, as these involve directly measuring the movement of the hand. Because ground truth data cannot be collected on amputees, the approach described above was required to associate intended activations with input signal patterns.

4.3. Experiment 1: Real-Time Goal-Reaching Task with Tactile Myography

This experiment aimed to bring the analyses of TMG data performed in [11,18] one step further by applying a non-linear regression method to achieve real-time detection.
During the first part of the experiment, namely the training part, the participants were asked to imitate the movements of an animated hand model (see Figure 4). They were presented the following sequence of movements three times: wrist flexion, wrist extension, wrist supination, thumb flexion, index flexion and little-finger flexion. Wrist and finger movements were executed in the air and by pressing fingers on the table, respectively. Each stimulus followed a cycle of 14 s, consisting of a transition phase (2 s), an activation phase (6 s), a transition phase (2 s) and a relaxing phase (4 s). The data were captured only during the activation and rest phases, and the transition phases allowed the participant to reach full activation and rest, respectively. Data acquired from the tactile bracelet and the visual stimulus were synchronized by linearly interpolating the samples of each channel. TMG data were low-pass filtered (first-order Butterworth filter with cut-off frequency of 1 Hz) to remove high-frequency disturbances. We then trained two different regression models, namely, ridge regression (RR) and GPR, using a RBF kernel with a Euclidean distance. The GPR parameter β was optimized for each participant using cross-validation on training data. Each training dataset was randomly shuffled; then, 40% was used to train each model, and the test was performed on the remaining 60%. This procedure was repeated 10 times with a different random shuffle each time. The obtained β values ranged between 1 and 4 depending on the participant. The final model was trained on the whole training set with the optimized parameters.
The second part of the experiment consisted of a real-time goal-reaching task, in which the participants controlled a second hand model. For each method, 54 tasks were administrated to the participants (6 movements used for training at 3 activation levels, repeated 3 times). Half of the participants began with RR, while the other half began with GPR. For each method, the participants experienced the control of the virtual hand without constraints before beginning the goal-reaching tasks. For each task, the first hand model would perform a movement to either one-third, two-thirds or full activation. The participants controlled the second hand model and were asked to have it mimic the action of the first. Performing the detection for several activation levels allowed us to determine whether the method was adapted for proportional control. A task was considered successful if the participant could maintain the desired movement at the desired activation level for 1.5 s. The movement was considered as maintained as long as the difference between the first and the second hand model was below a fixed threshold. If the task was not successfully fulfilled after 15 s, it was considered to have failed. A visual marker (smiling or sad face) appearing on the monitor indicated the result of each task (see Figure 5). A video of this experiment can be found in the supplementary material (Video S1).

4.4. Experiment 2: Combination of Electromyography and Tactile Myography

With this experiment, we extended the preliminary comparison between sEMG and TMG performed in [11] with a comparison between sEMG, TMG and both inputs considered together. Moreover, we compared a simple linear regression method (RR) and GPR using a RBF kernel with different measures of distance. The data collection process was similar to that for the training part of the first experiment. The participants, wearing the tactile and sEMG bracelets, were asked to imitate movements of an animated hand model. They were presented the same sequence of six movements three times. The main difference to the previous experiment was that the data were recorded during the whole cycle of each stimulus in order to obtain the whole range of activation from rest to complete finger and wrist movement. The transition phases were extended from 2 to 5 s to allow the participants to follow the model more precisely.
Data from the TMG, sEMG sensors and visual stimulus were synchronized by linearly interpolating the samples of each channel. This was possible because each and every sample gathered from the input devices, as well as the stimulus values, were accurately timestamped using the computer’s performance counter. TMG and sEMG data were low-pass filtered (first-order Butterworth filter with cut-off frequency of 1 Hz) to remove high-frequency disturbances. We selected the training dataset as data recorded at zero and full activation and the testing dataset as data in the transition parts, corresponding to the whole range of intermediate activation levels. This choice was made in order to evaluate the performance of the models applicable to amputees in forecasted future studies, as they cannot provide accurate intermediate training data. For each participant, the RR and GPR models were trained on the training data using inputs from sEMG, TMG or both. The following distance measures were used in the RBF kernels of GPR:
  • sEMG signal as input: d Eucl , d SPD and d logSPD ;
  • TMG signal as input: d Eucl , d SPD , d logSPD and d KL ;
  • sEMG and TMG signals as input: all combinations of d Eucl , d SPD and d logSPD for sEMG coupled with d Eucl , d SPD and d KL for TMG.
In the case of sEMG data, the two distances d SPD and d logSPD were computed for data arranged in spatial covariances with a 400 ms sliding window and an increment of 40 ms. The parameters of each model were selected by cross-validation of the training data. The applied cross-validation process was the same as for the first experiment. The final model was trained on the whole training set with the optimized parameters and tested on data corresponding to the whole range of intermediate activation levels for each participant. A video of this experiment can be found in the supplementary material (Video S2).

5. Results

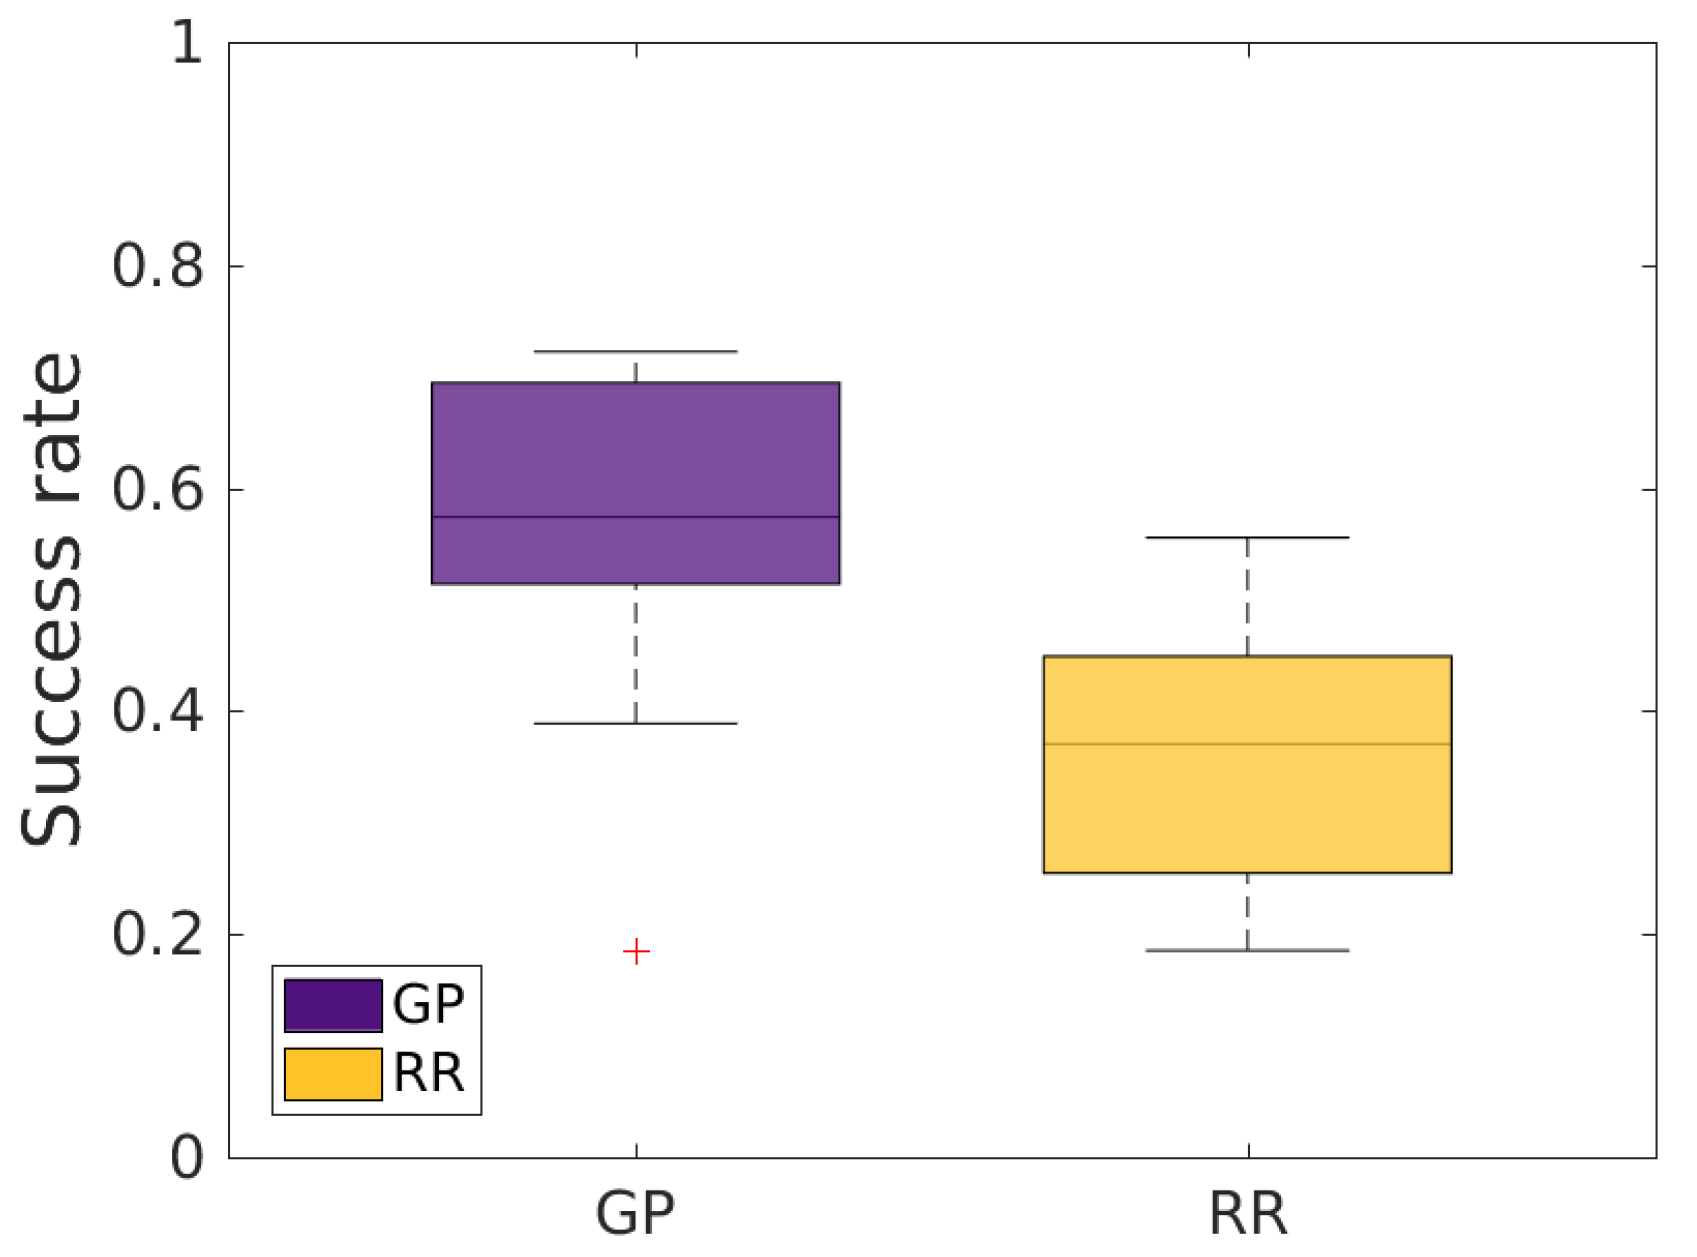
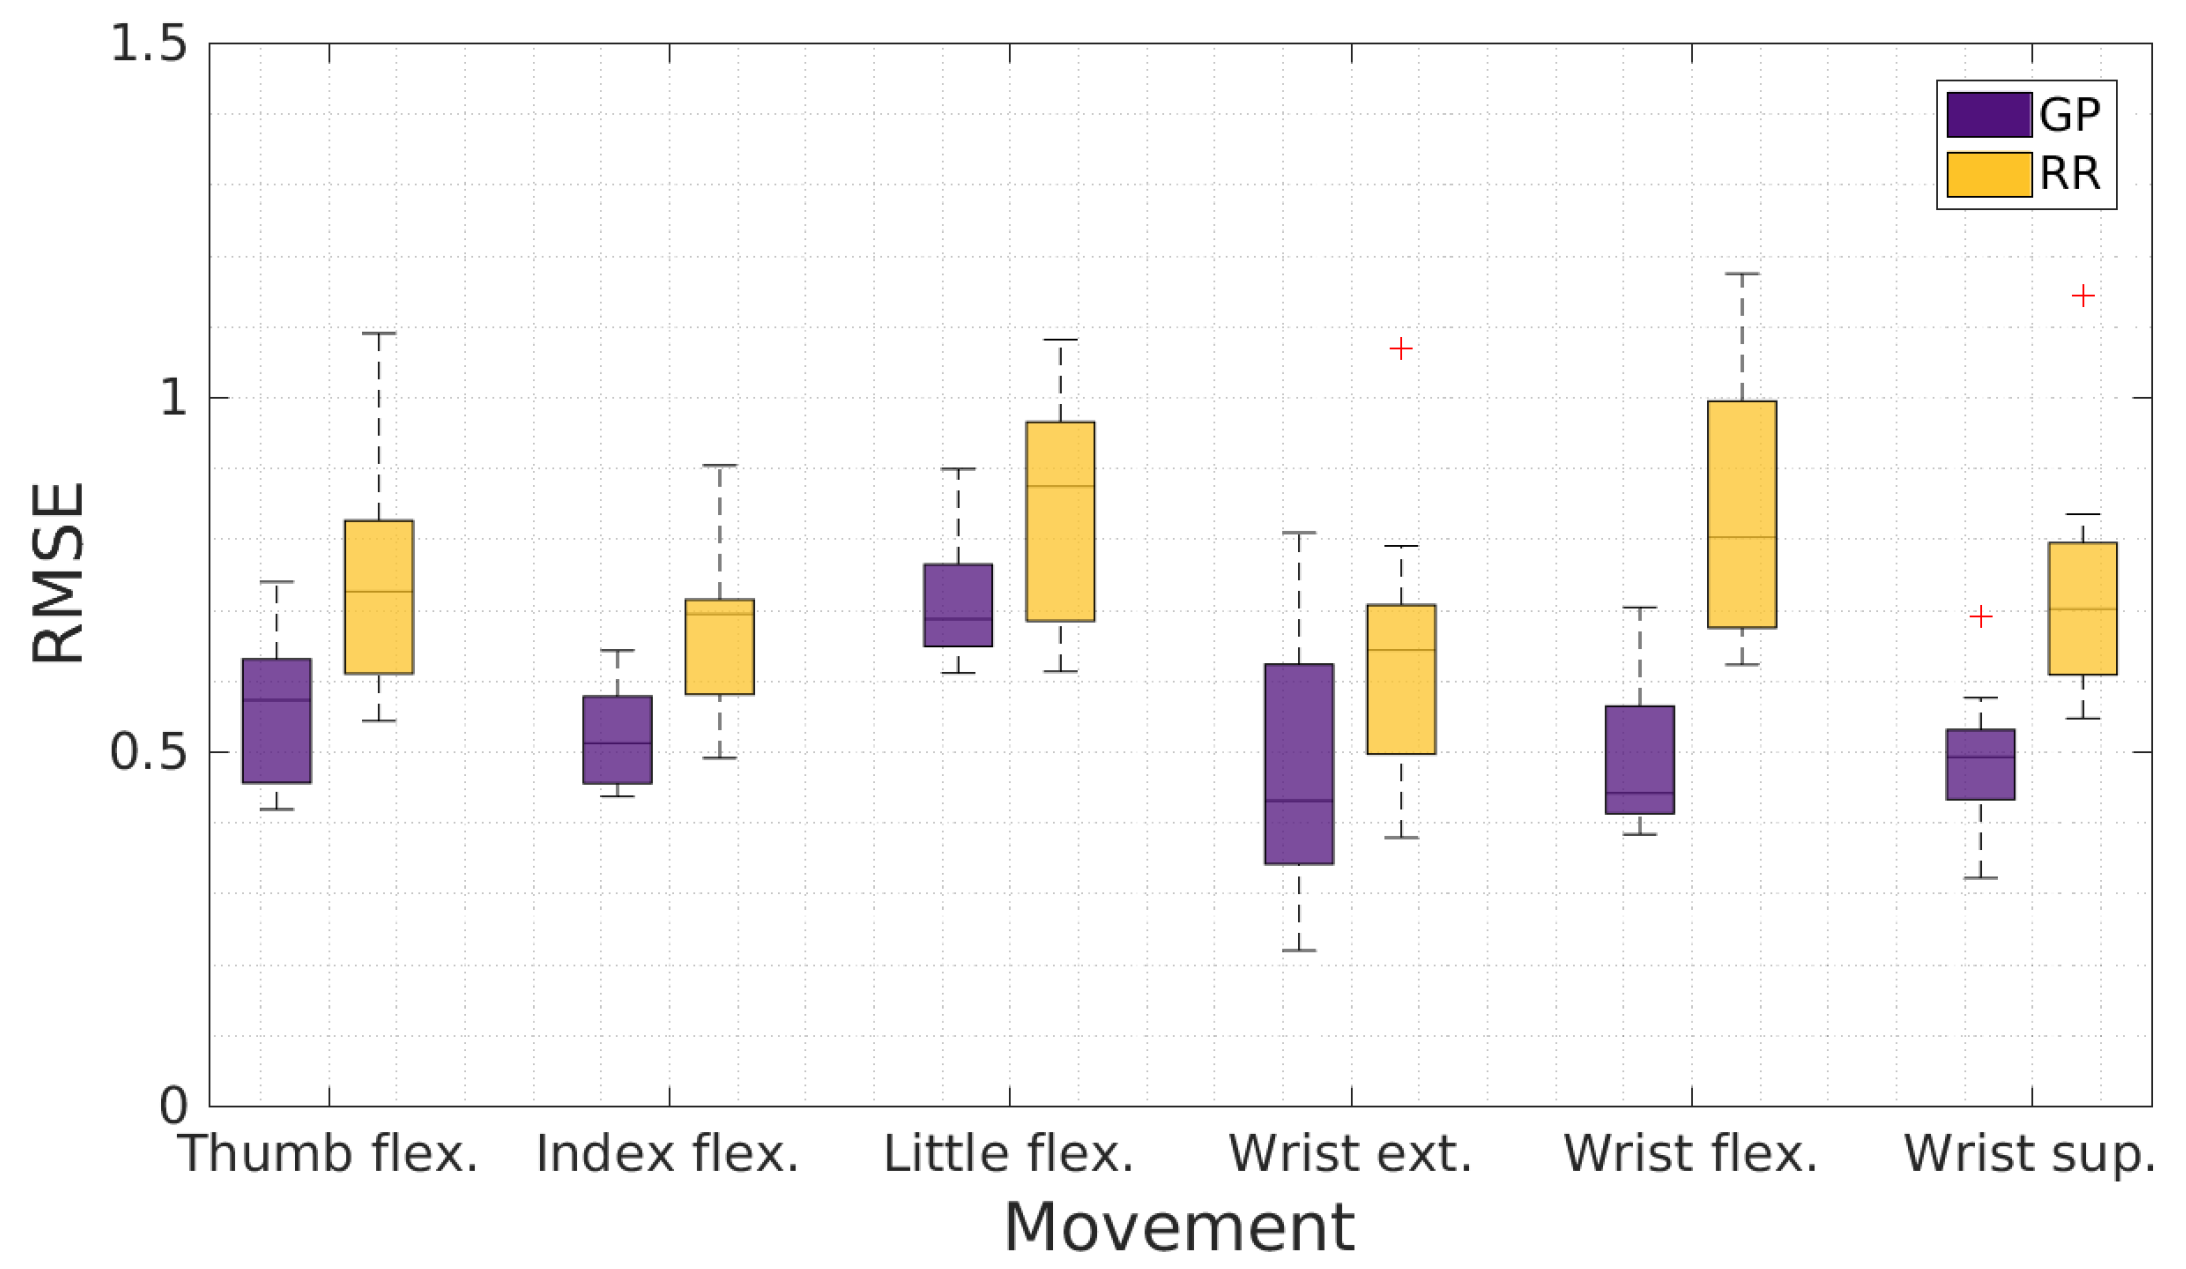
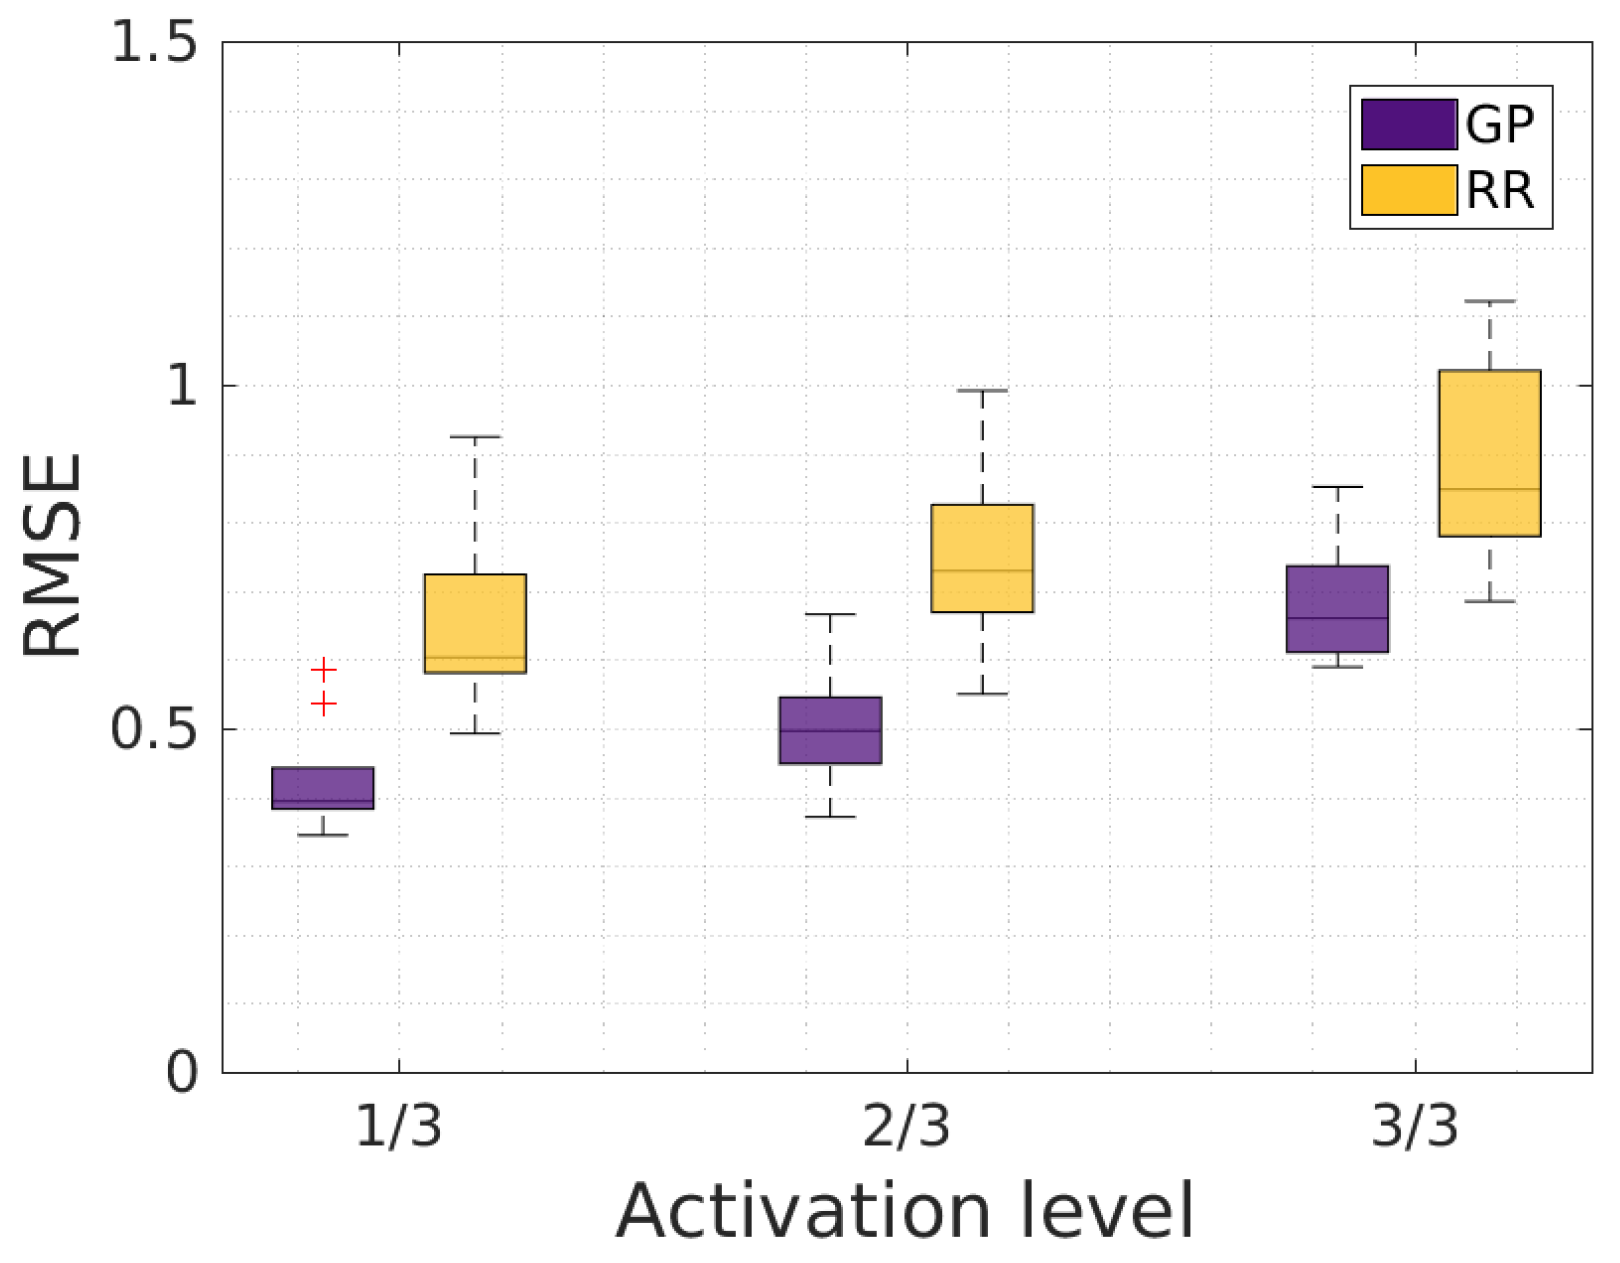
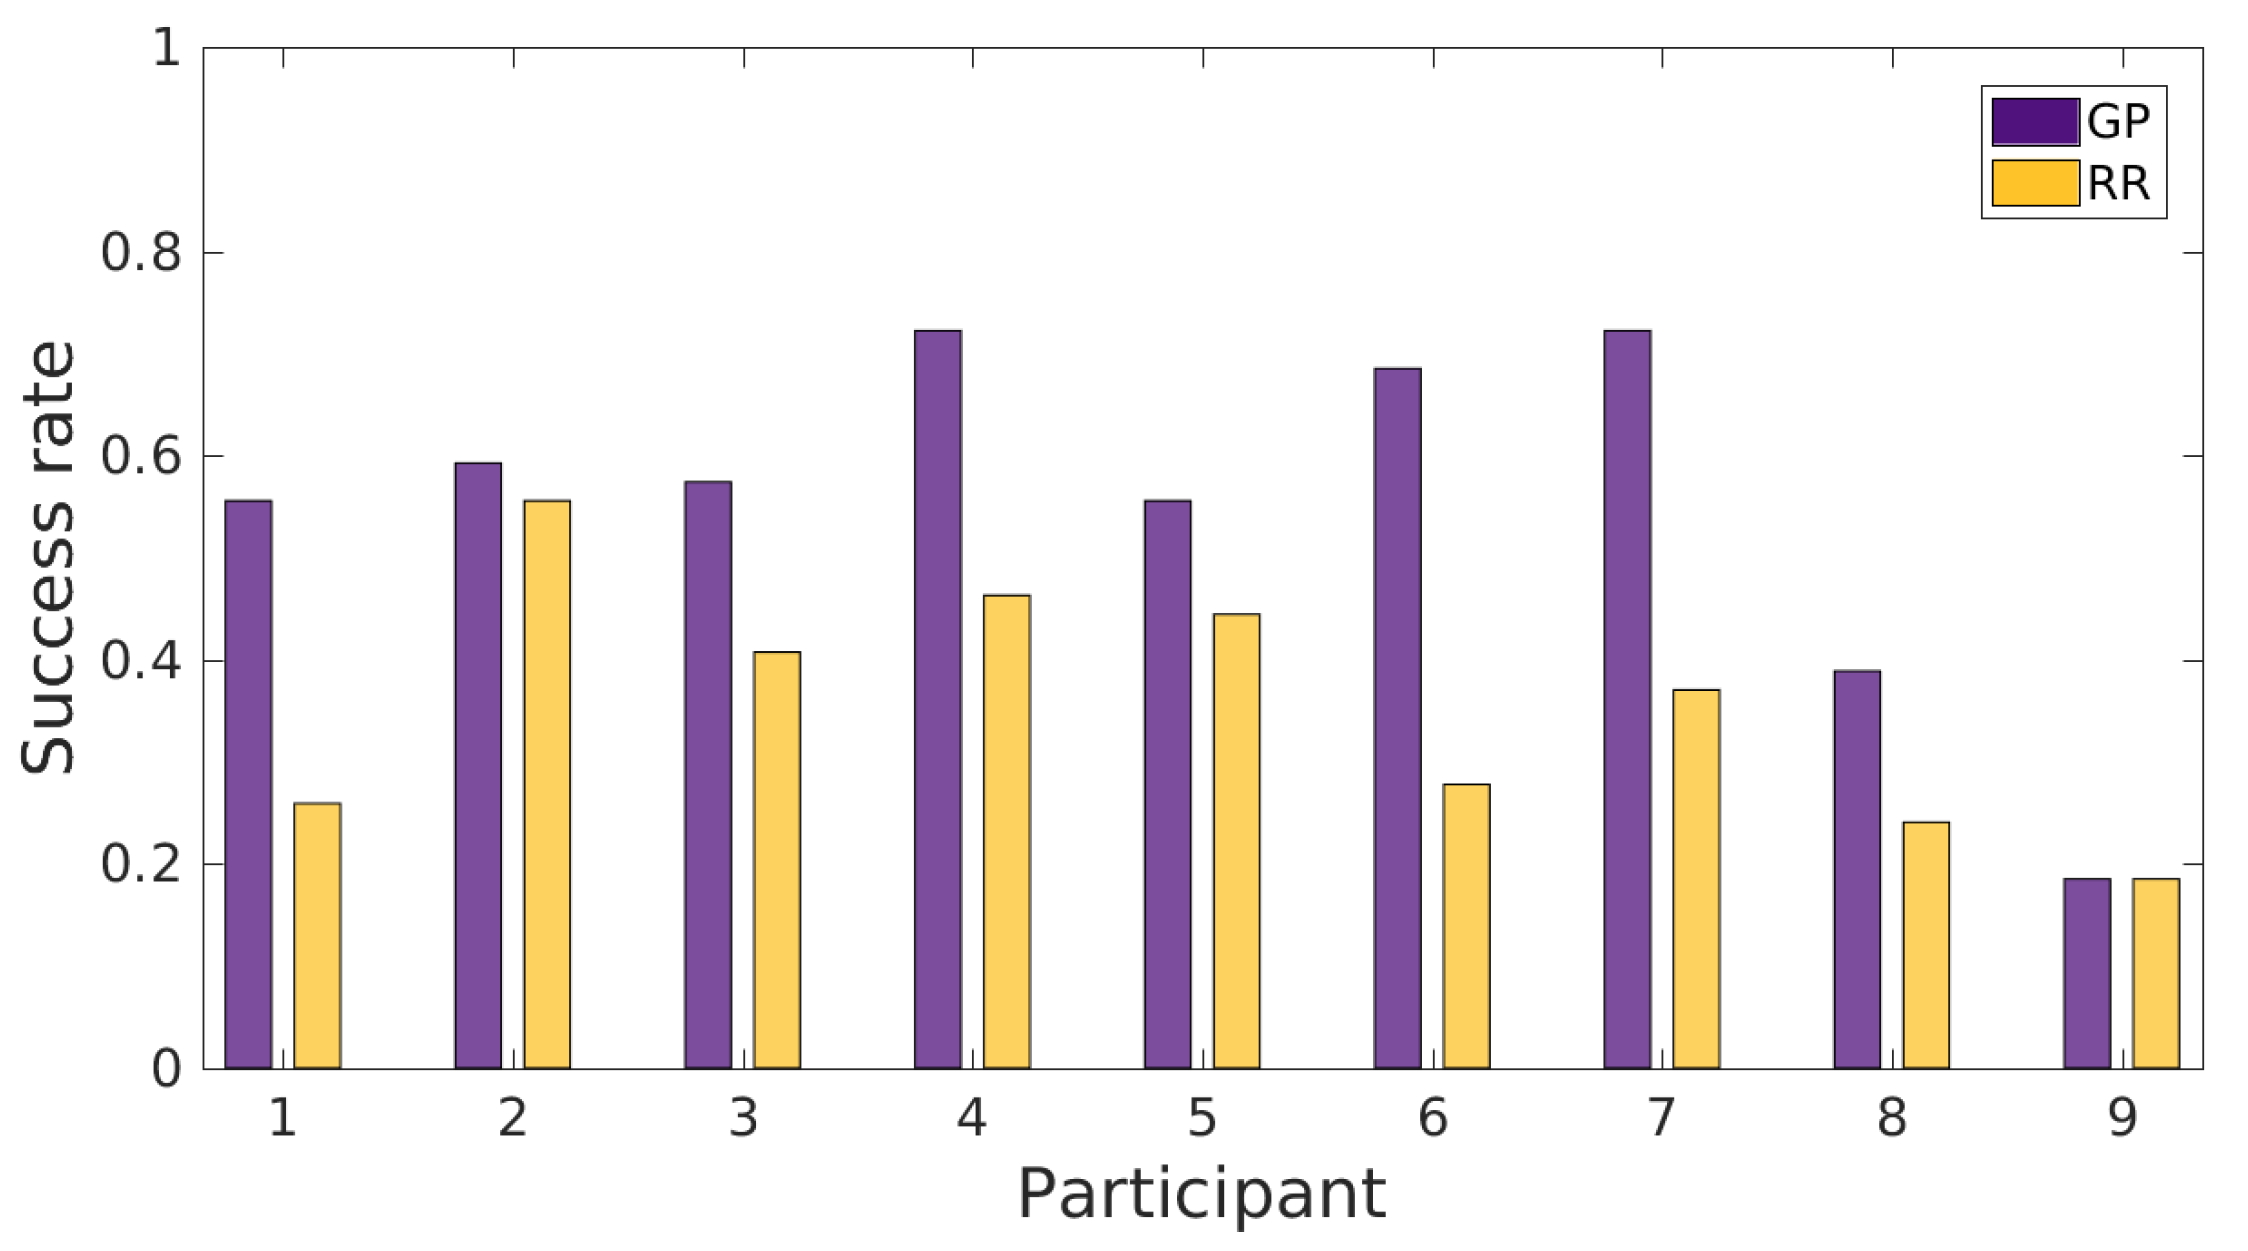
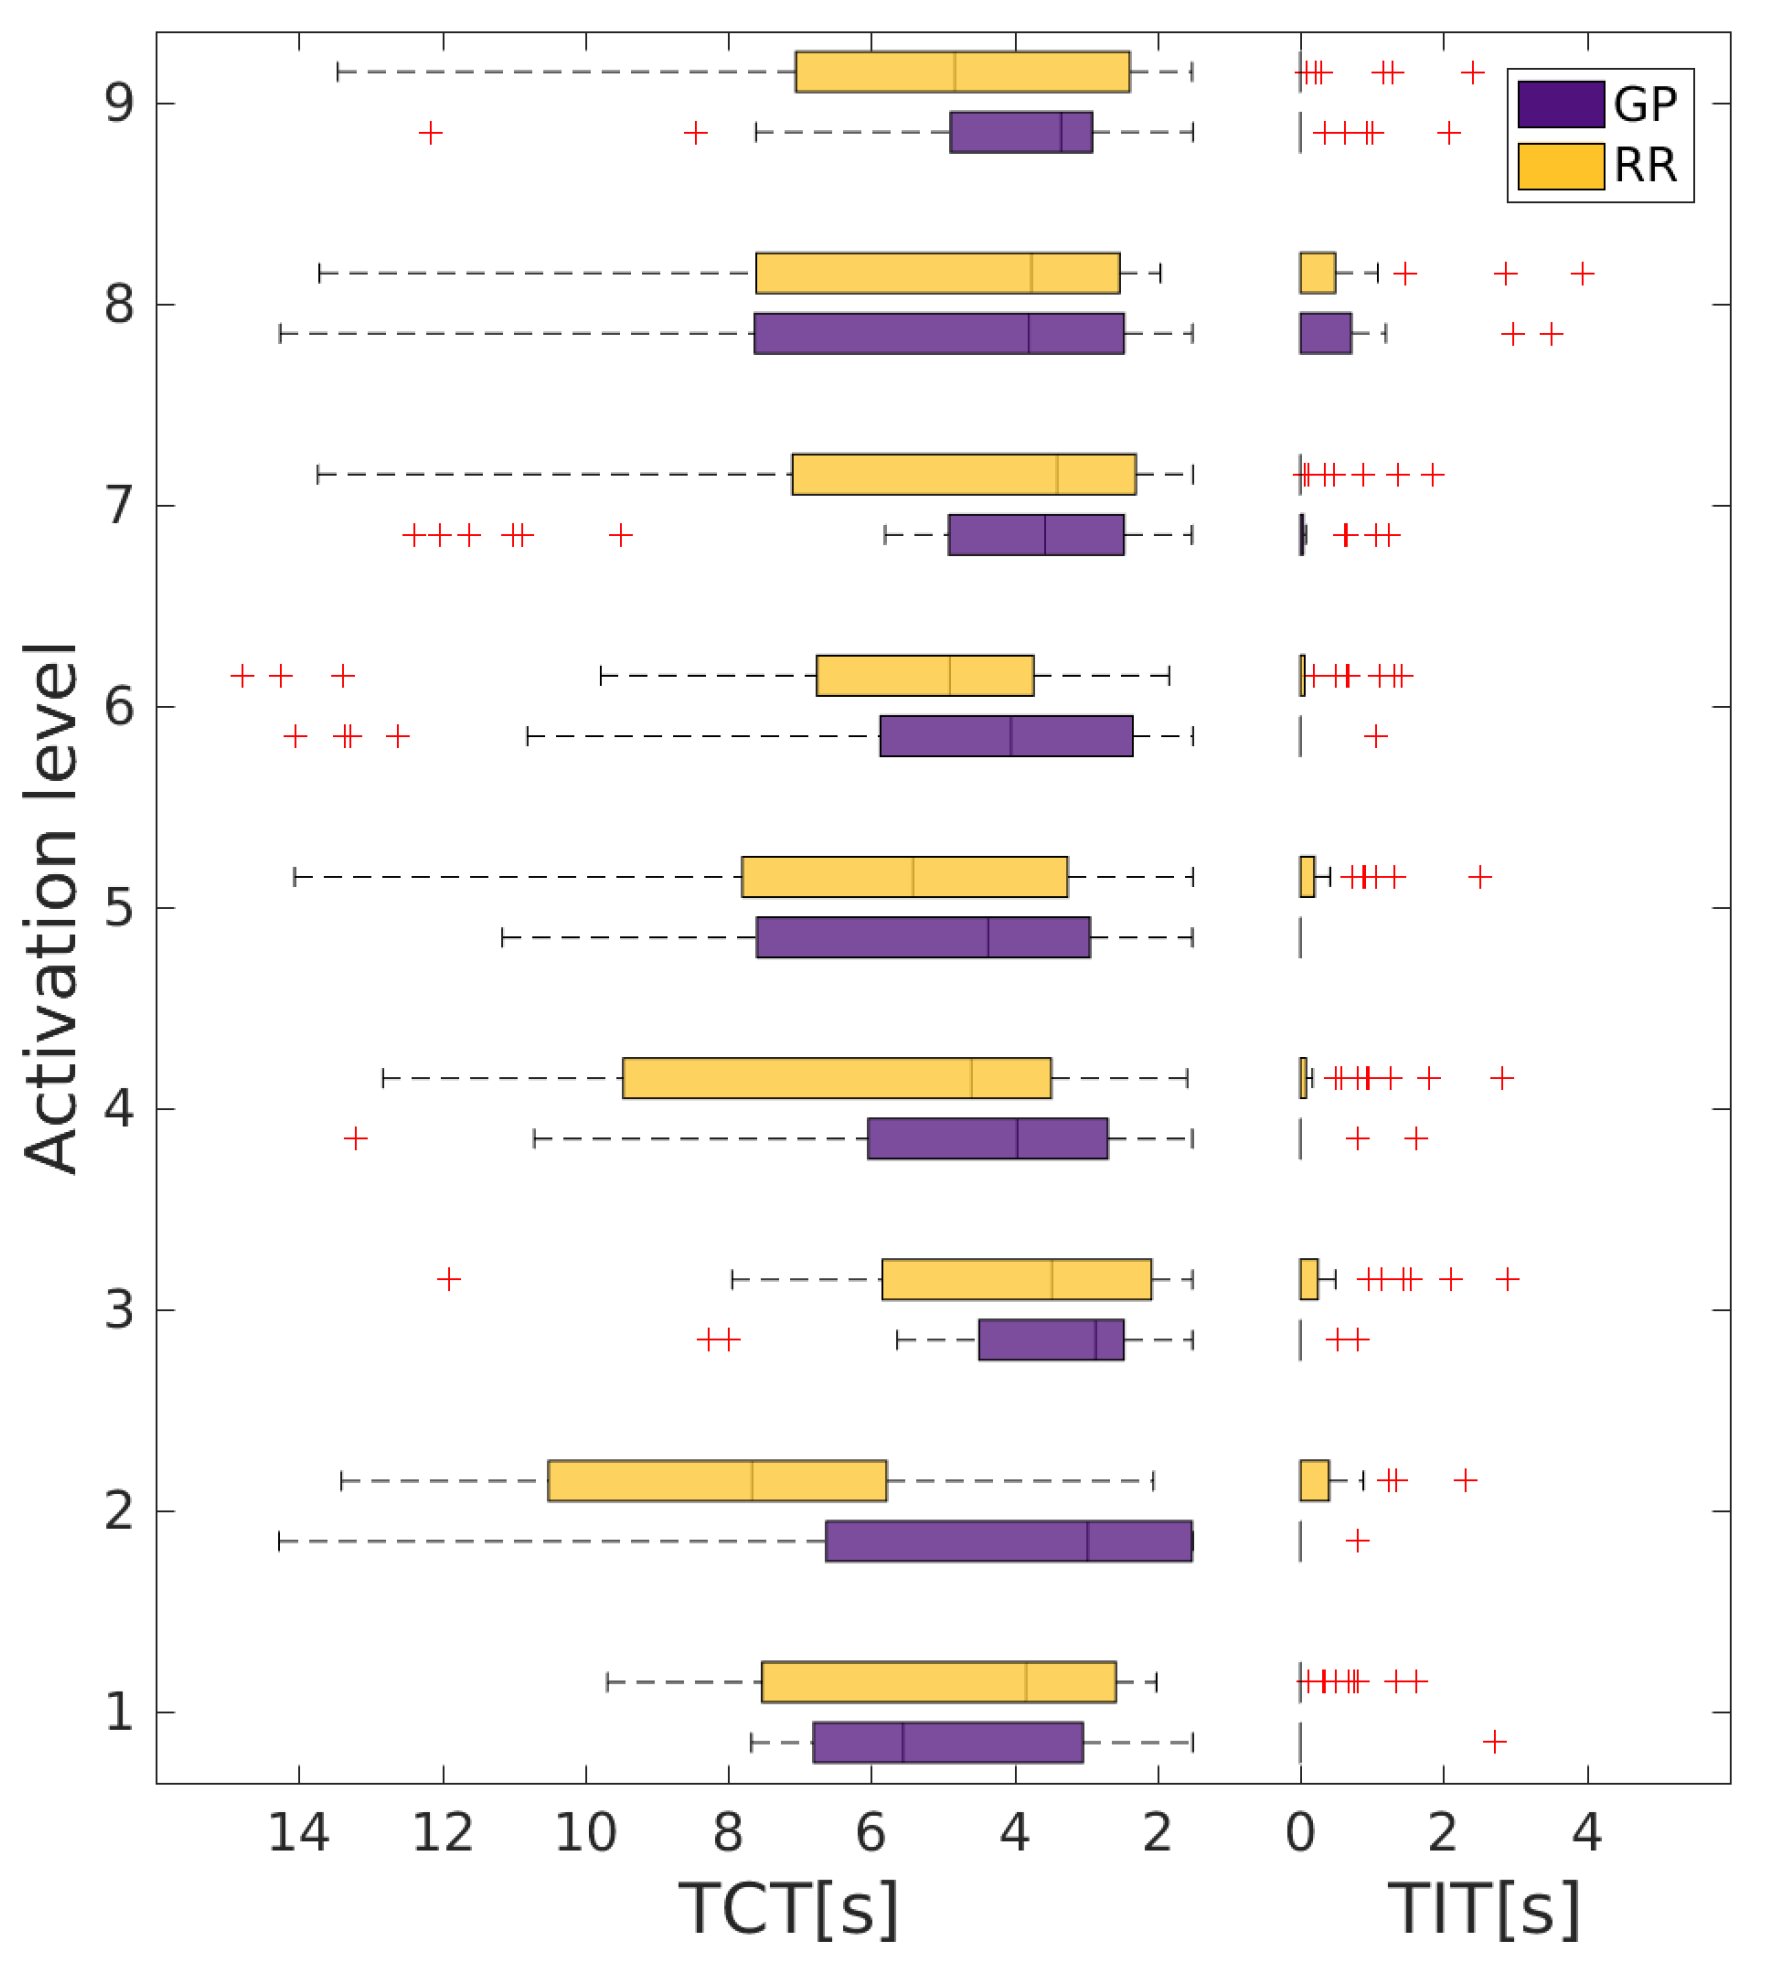
5.1. Experiment 1: Real-Time Goal-Reaching Task with Tactile Myography

We compared the performance of RR and GPR ( d Eucl ) by computing the ratio of successful tasks (success rate—SR), the time needed to accomplish successful tasks (time to complete task—TCT) and, in the case of unsuccessful tasks, the time spent within the goal (time in the target—TIT). We also computed the root-mean-square error (RMSE) between the ground truth and the prediction for both methods. Table 1 shows the average and the standard deviation of the mentioned results. Figure 6 and Figure 7 show evaluations in terms of SR, and in terms of TCT and TIT, respectively. The SR, TCT and TIT for each participant are available in Appendix A (Figure A1 and Figure A2).
A paired-samples Student’s t-test showed a statistically significant difference between the SR of the two methods ( p < 0 . 05 ). The performance of GPR outperformed the performance of RR by ∼20%. Moreover, we observe that the TCT of GPR was reduced by ∼1 s compared to RR. However, the TIT obtained with RR was slightly shorter, although the mean TIT was small for both methods, with a high standard deviation compared to the average value. As expected given the different SR, TCT and TIT values, GPR outperformed RR in terms of the RMSE.
Figure 8 shows the RMSE for each finger and wrist movement that the participants had to execute for both regression methods. We observe that GPR outperformed RR for all movements, especially for wrist flexion and supination. Moreover, little-finger flexion was the most difficult movement to predict for both methods. Figure 9 shows the RMSE computed for each activation level for both regression methods. The RMSE obtained with GPR was smaller and had a smaller variance than the RMSE obtained with RR. We observed a slight increase of the RMSE with the activation level. This may have been due to interferences between the DOFs that are more important for a higher level of activation; for example, flexing one finger completely tends to induce flexion of the other fingers, especially for a complete flexion.

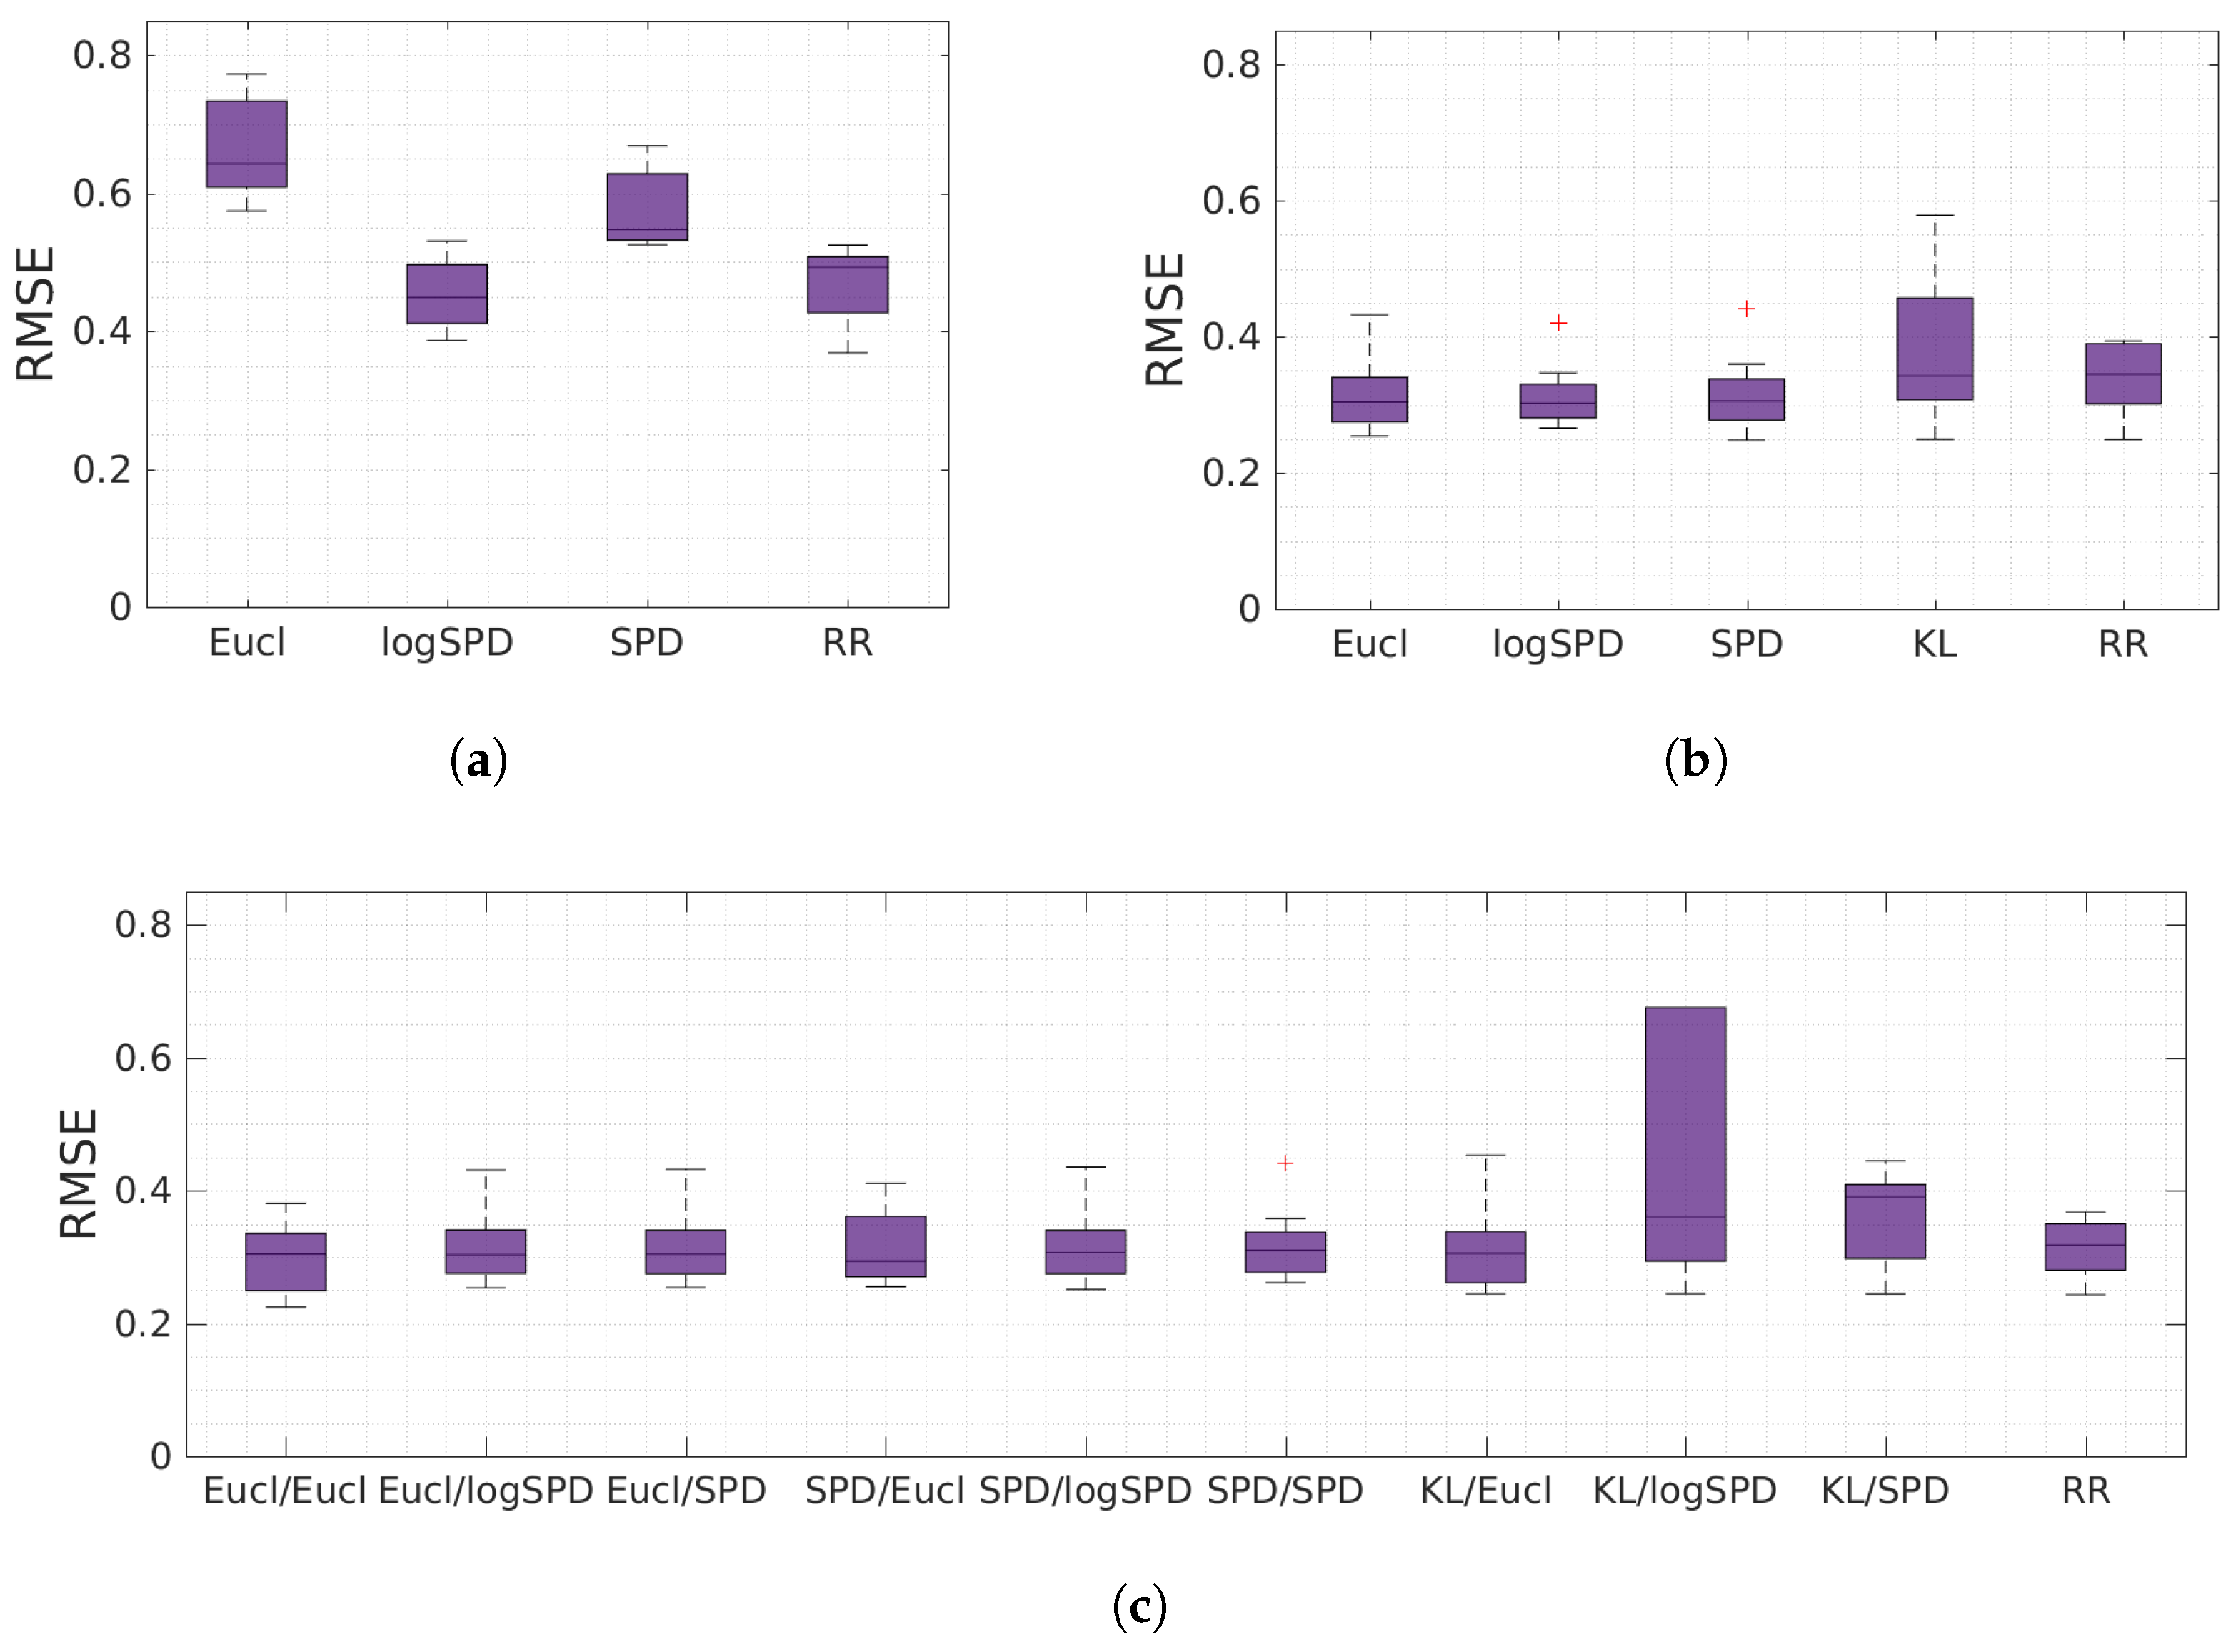
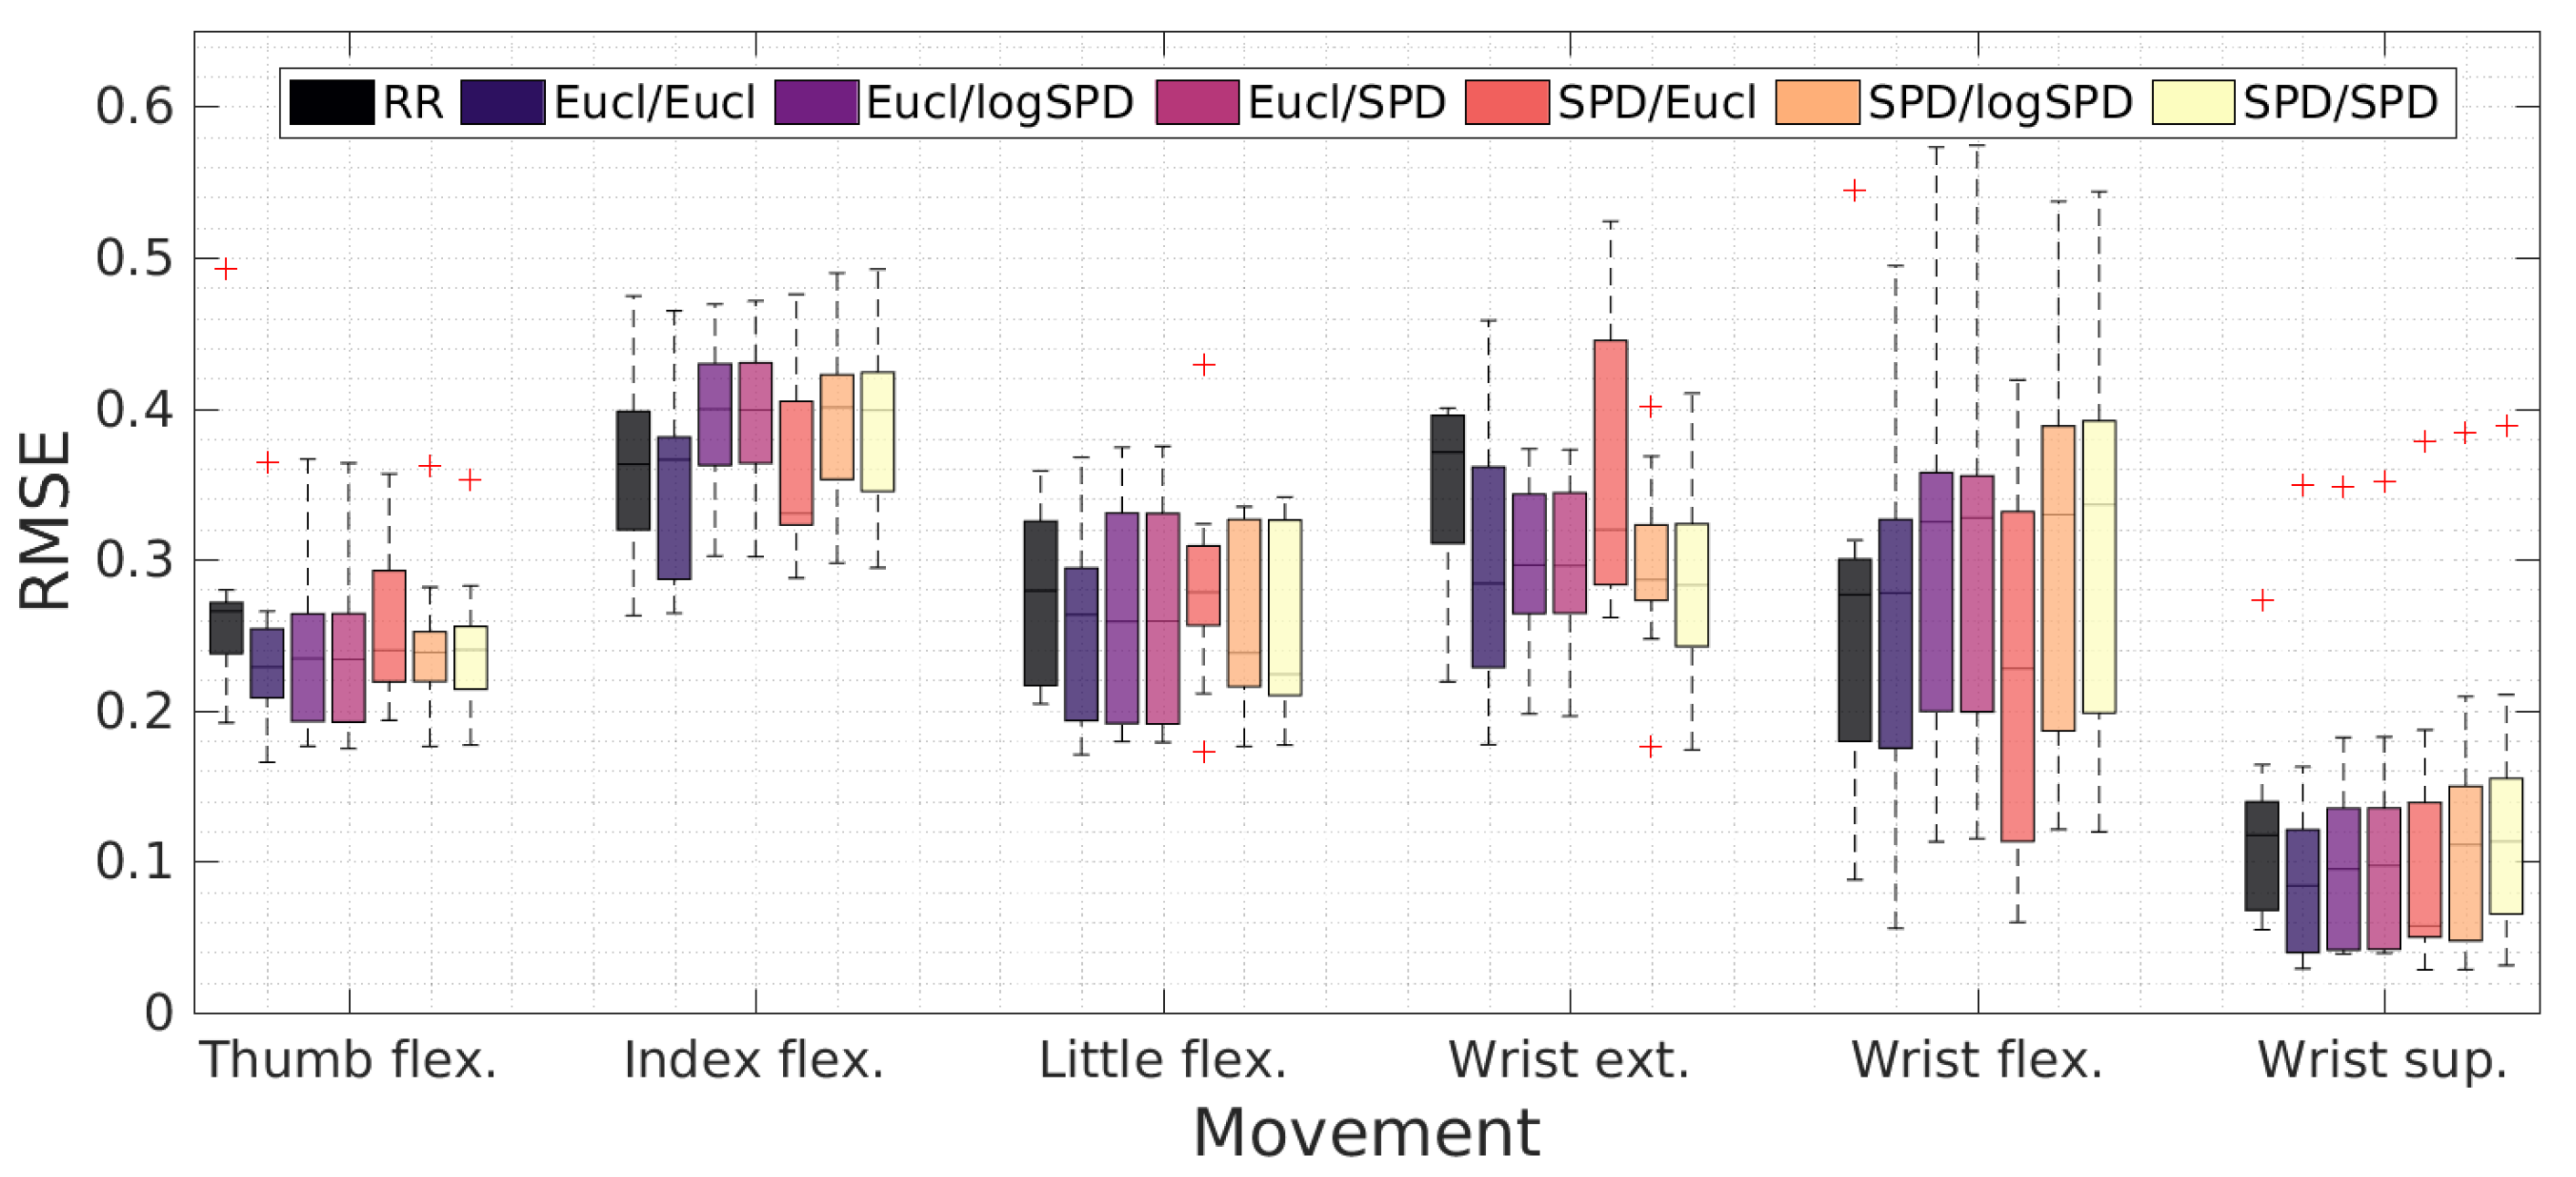
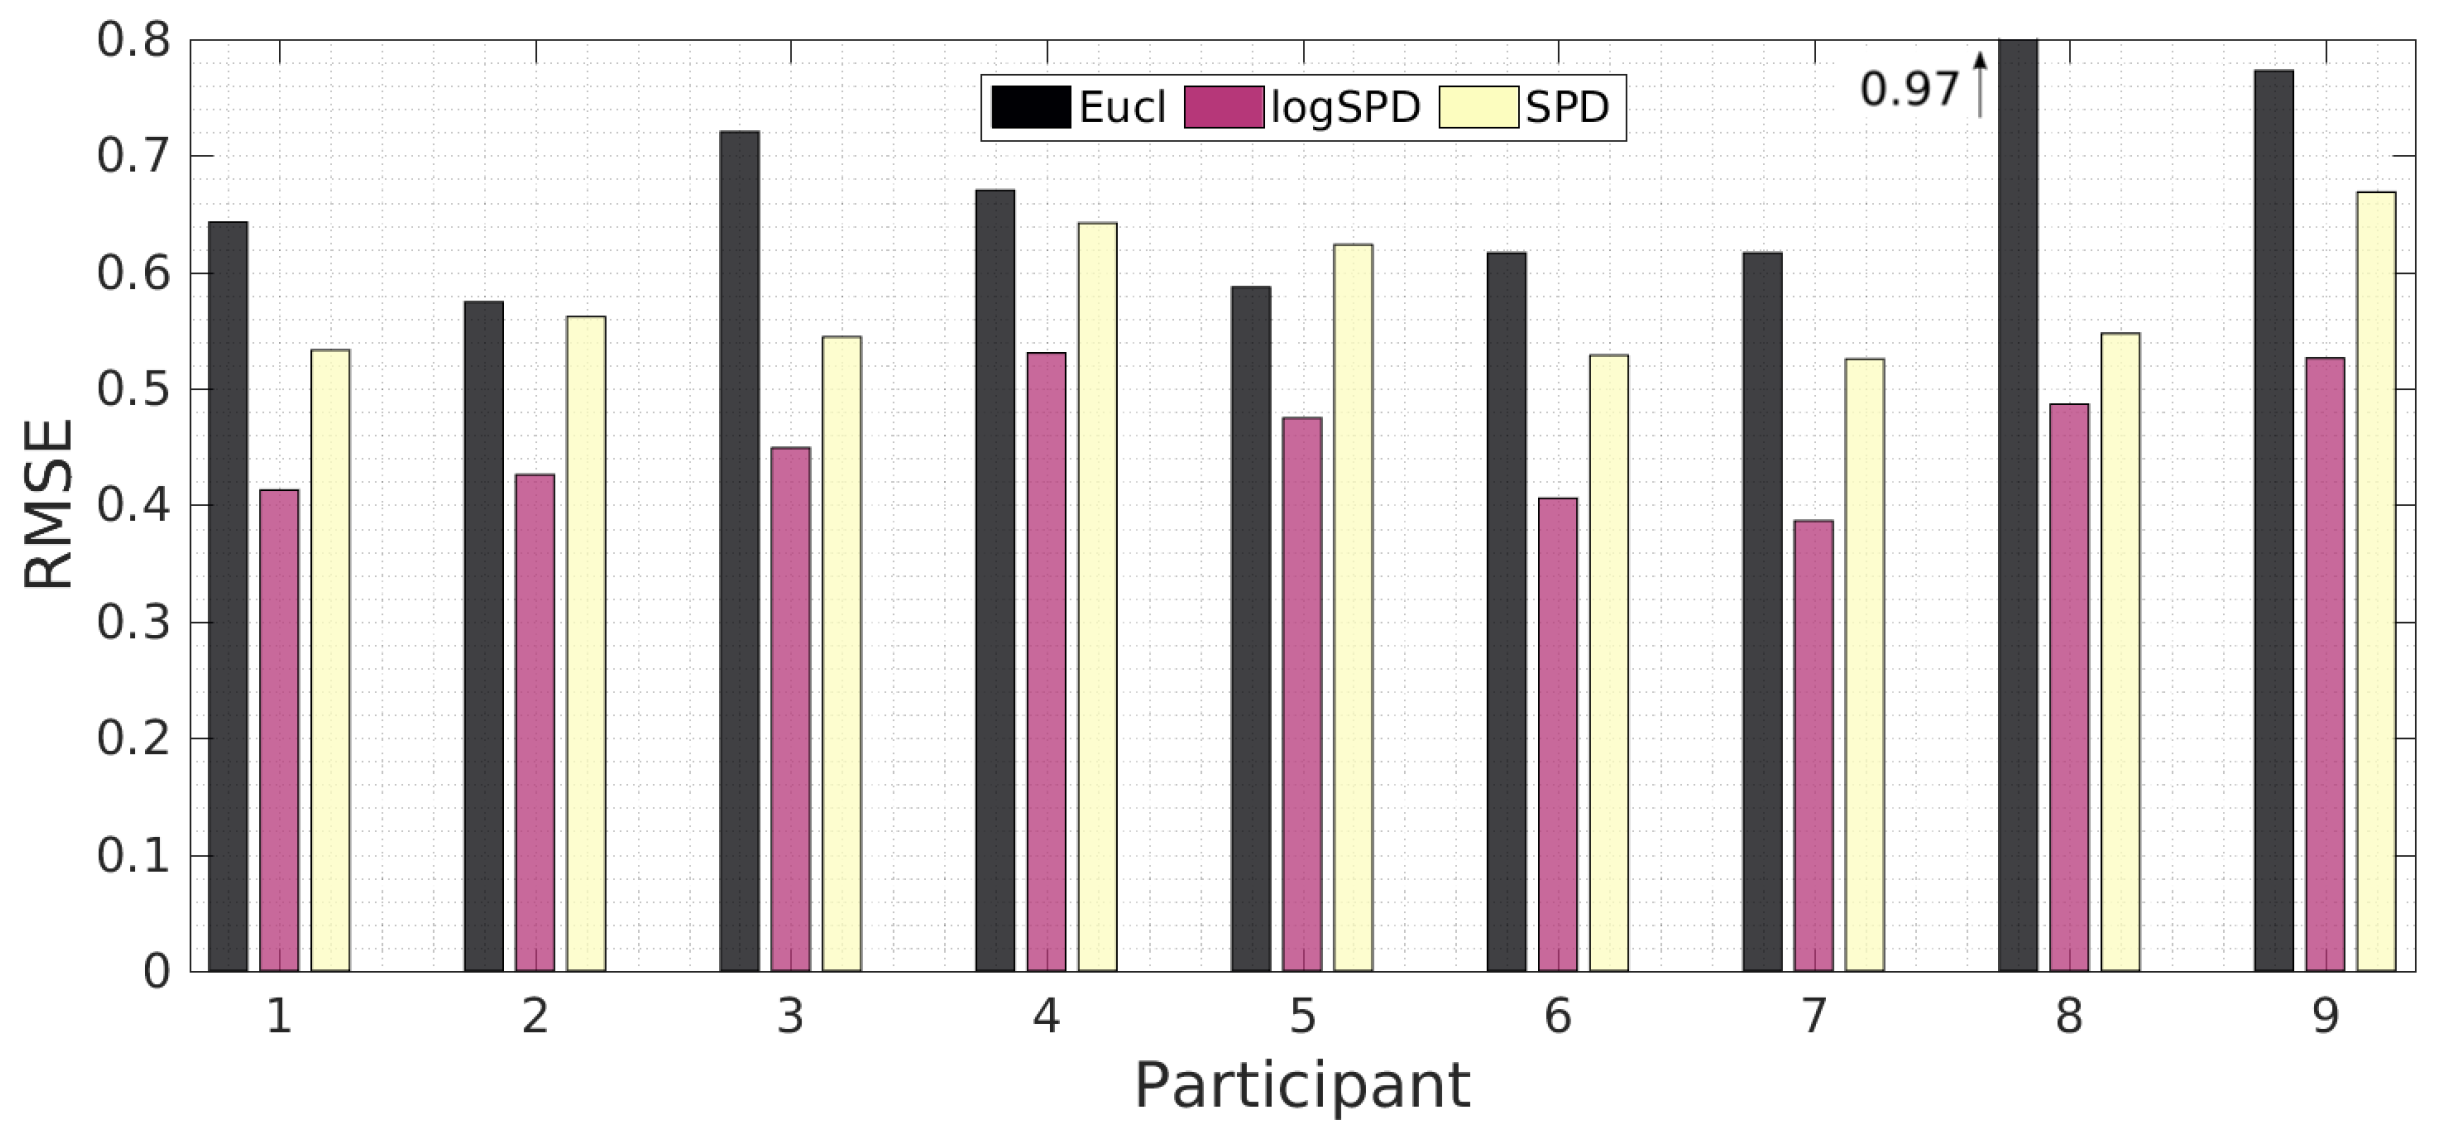
5.2. Experiment 2: Combination of Electromyography and Tactile Myography

We compared the performance of GPR with different distance measures and RR, with sEMG, TMG or both as the input, by computing the RMSE between the ground truth and the predictions. Table 2 and Table 3 show the average and the standard deviation of the RMSE for the participants, for unimodal (sEMG or TMG) and multimodal inputs, respectively. These results are also reported in Figure 10.
We observe that TMG outperformed sEMG for all the regression methods in the case of a unimodal input. Paired-samples Student’s t-tests applied to errors of any combination of methods showed statistically significant differences between sEMG and TMG ( p < 0 . 05 ). Only GPR using the distance d logSPD improved the prediction using sEMG input compared to RR. In the case of TMG, GPR outperformed RR for all distances; the better predictions were obtained using d logSPD and d Eucl . However, we chose not to use d logSPD for TMG input in the multimodal models, as its computation time was greatly increased compared to d SPD and both distances were similar to each other. Although GPR using d KL had the higher averaged RMSE value, it performed better than GPR using other distances for two participants (2 and 6). The RMSE for each participant is available in Appendix A (Figure A3 and Figure A4 for sEMG and TMG inputs, respectively).
RR using both sEMG and TMG as the input outperformed unimodal RR. A paired-samples t-test showed a statistically significant difference between errors obtained with TMG and with sEMG coupled with TMG using RR ( p < 0 . 05 ). However, in the case of GPR, the only combination of sEMG and TMG improving the RMSE compared to TMG was to use d Eucl for both inputs. The scores of the other combinations of distances were similar to those obtained using only TMG. The high RMSE value of d KL for TMG combined with d logSPD or d SPD for sEMG was due to the large error obtained for three participants (5, 6 and 7). The RMSE remained close to the RMSE of other distances for the rest of the participants. The RMSE values for all the participants are available in Appendix A (Figure A5).
Figure 11 shows the RMSE for each finger and wrist movement that the participant had to execute for GPR with different combinations of distances. We observe that all the methods had a high and low RMSE for the same movements. Wrist supination had the best RMSE, while index flexion and wrist extension seemed to be the most difficult to detect.
Table 4 shows the time to compute all the training distances between training data points and the time to compute the distances between a new test data point and the training data points. Computation times are shown for distances applied to sEMG and TMG data separately. These had to be added when both sensors were used as the input. The computation of these distances caused the difference in computation times for GPR using different kernel distances. All methods were programmed in Matlab and were run on a 3.5 GHz six-core CPU. We observe that d Eucl was the fastest to compute for both input sensors; d logSPD and d KL were more expensive than other distances in the case of sEMG and TMG data as input, respectively.

6. Discussion

In the first experiment, we showed that GPR outperformed RR to detect hand and wrist movements at different activation levels in terms of the SR, TCT and RMSE. GPR and RR obtained similar TIT values. These results confirm the batch analysis presented in [18] with GPR and RR on zero and full activation values. In comparison with the preliminary real-time experiment using RR presented in [11], we obtained a ∼20% lower SR, a ∼1 s lower TIT and similar TCT values. The lower SR and TIT results may have been explained by the fact that we tested individual finger movements that are usually more difficult to detect and can be confounded with some wrist movements. Furthermore, we often observed difficulties in discriminating index- and little-finger flexion and finger and wrist flexion during the real-time experiment, especially using RR. This often results in the activation of several DOFs rather than a unique DOF; for example, the index was often flexed along with the little finger during tasks involving only the little finger. Most failed tasks seemed to be due to this kind of interaction, which induced a large difference between the poses of the hand model and the controlled hand. It also induced a zero TIT for these failed tasks. Thus, the presence of many outliers in Figure 7 is explained by the fact that only a minority of failed tasks had a non-zero TIT. Difficulties in discriminating index- and little-finger flexion and finger and wrist flexion may also explain the slightly higher RMSE observed for those movements.
In the second experiment, we confirmed that TMG outperformed sEMG using RR, and we showed that the performance was also improved using GPR. The first assessment is in line with the comparison presented in [11], and the second confirms the results from [18] and from our first experiment. The RMSE values obtained with TMG in this experiment were slightly lower than those of the previous experiment. This may have been explained by the fact that the second experiment was performed in batch and because training and testing data are parts of a continuous set of data (i.e., in the whole dataset, zero and full activation are considered as training data, while transitions are considered as testing data).
The RMSE values we obtained showed only a small improvement for certain methods when combining sEMG and TMG compared to TMG. The RMSE of GPR with different combinations of distances were similar, except those for which the KL divergence was used for TMG data that performed very poorly for some participants. When combining sEMG and TMG, the Euclidean and SPD distances may have been preferred over the log SPD distance for sEMG, as the latter had a longer computation time and did not seem to improve the detection compared to other distances. Moreover, the Euclidean and SPD distances may have been preferred to the KL divergence for TMG data, as they were more stable over the participants and required less time to be computed. Similarly to the first experiment, the RMSE values computed for each movement suggest that wrist supination is the easiest to detect. Overall, the comparison between TMG and combined sEMG and TMG in the second experiment was performed in batch, and we are not aware of any such comparison in the literature. Thus, we consider the results of this comparison as preliminary. Moreover, the choice of RBF kernels with different distances was motivated by the fact that these are known to work well in practice and are easy to tune. However, it would be interesting to test GPR with other kernels, for example, with Matérn kernels. Further analysis and real-time evaluations are required and will be performed in future work.
Two further considerations must be put forward. Firstly, we used the stimulus values as ground truth, because of the impossibility of obtaining reliable data from amputees—a technique that was has already been introduced multiple times in literature [19,20]. That ground truth does not exactly match the “intent” of the subjects is an unavoidable drawback of this approach, and its solution relies on the adaptation of the subjects themselves to the visual stimuli. This fact has not been greatly investigated as far as we know, and it has a clear impact on the practical usability of all systems, such as that presented in this paper. Secondly, and even more importantly, it has even been shown [21,22] that offline accuracy hardly reflects practical usability. Therefore, a deeper investigation of the proposed technique in a real-sized daily living setup is necessary.

7. Conclusions

We presented a real-time goal-reaching experiment using TMG data as the input, by comparing a linear and a non-linear regression method (RR and GPR) to detect different levels of activation in finger and wrist movements. We proposed a GP-based regression approach to combine multimodal inputs and compared the efficiency of sEMG, TMG and a combination of the two in a batch analysis performed on data collected during a second experiment. We then compared the use of different RBF kernel distances for GPR applied to these data.
Results of both real-time and batch experiments showed that the information obtained from 320 sensors of the tactile bracelet could effectively be used to detect graded activation levels of finger and wrist movements. We confirmed that TMG outperformed sEMG to achieve proportional and simultaneous control of several DOFs. Furthermore, the performance of TMG is increased using GPR compared to a simple linear regression method, namely, RR.
The results of the comparison between TMG and the combination of both TMG and sEMG should be considered as preliminary and suggest that combining both sensors could improve the detection using RR and GPR with certain kernels. In future work, we plan to perform a comparison in the form of real-time goal-reaching experiments and to further analyze the potential use of multimodal inputs.

Supplementary Materials

The following are available online at www.mdpi.com/2227-7080/5/4/64/s1, Video S1: Real-time goal-reaching experiment: hand and wrist movements detection with Gaussian process regression, Video S2: Combining surface electro- and tactile myography for hand and wrist movements detection using Gaussian process regression. Data and Matlab codes are available online at http://www.idiap.ch/paper/mdpi/.

Acknowledgments

This work was supported by the SNSF/DFG project ”TACT-HAND: Improving control of prosthetic hands using tactile sensors and realistic machine learning” (Swiss National Science Foundation project 200021E-160665 and DFG Sachbeihilfe CA1389/1-1).

Author Contributions

Noémie Jaquier and Mathilde Connan conducted the first experiment and collected data for the second experiment. Noémie Jaquier conducted the analysis of the second experiment. Noémie Jaquier and Sylvain Calinon developed the learning approach. Noémie Jaquier implemented the learning approach. Mathilde Connan and Claudio Castellini developed the interface used for data acquisition. All authors participated in the design of the experiments and contributed to the writing of the paper. All authors have read and approved the final manuscript.

Conflicts of Interest

The authors declare no conflict of interest.

Abbreviations

The following abbreviations are used in this manuscript:
sEMGSurface electromyography
TMGTactile myography
RKIResidual kinematic imaging
ADCAnalog-to-digital converter
DOFDegree of freedom
RRRidge regression
GPRGaussian process regression
RBFRadial basis function
EuclEuclidean
SPDSymmetric positive definite matrix
KLKullback–Leibler divergence
SRSuccess rate
TCTTime to complete task
TITTime in the target
RMSERoot-mean-square error

Appendix A

Figure A1. Comparison of the success rate (SR) between Gaussian process regression (GPR) and ridge regression (RR) for each participant.
Technologies 05 00064 g012
Figure A2. Comparison of the time to complete task (TCT) and the time in the target (TIT) between Gaussian process regression (GPR) and ridge regression (RR), in the case of successful and failed tasks, for each participant.
Technologies 05 00064 g013
Figure A3. Comparison of the root-mean-square error (RMSE) between Gaussian process regression (GPR) using different kernel distances, with surface electromyography (sEMG) as input, for each participant.
Technologies 05 00064 g014
Figure A4. Comparison of the root-mean-square error (RMSE) between Gaussian process regression (GPR) using different kernel distances, with tactile myography (TMG) as input, for each participant.
Technologies 05 00064 g015
Figure A5. Comparison of the root-mean-square error (RMSE) between Gaussian process regression (GPR) using different kernel distances to combine surface electromyography (sEMG) and tactile myography (TMG) as input, for each participant.
Technologies 05 00064 g016

References

  1. Atzori, M.; Gijsberts, A.; Kuzborskij, I.; Elsig, S.; Mittaz Hager, A.G.; Deriaz, O.; Castellini, C.; Müller, H.; Caputo, B. Characterization of a Benchmark Database for Myoelectric Movement Classification. IEEE Trans. Neural Syst. Rehabilit. Eng. 2015, 23, 73–83. [Google Scholar] [CrossRef] [PubMed] [Green Version]
  2. Jiang, N.; Rehbaum, H.; Vujaklija, I.; Graimann, B.; Farina, D. Intuitive, Online, Simultaneous and Proportional Myoelectric Control Over Two Degrees-of-Freedom in Upper Limb Amputees. IEEE Trans. Neural Syst. Rehabilit. Eng. 2014, 22, 501–510. [Google Scholar] [CrossRef] [PubMed]
  3. Amsuess, S.; Vujaklija, I.; Goebel, P.; Roche, A.; Graimann, B.; Aszmann, O.; Farina, D. Context-Dependent Upper Limb Prosthesis Control for Natural and Robust Use. IEEE Trans. Neural Syst. Rehabilit. Eng. 2016, 24, 744–753. [Google Scholar] [CrossRef] [PubMed]
  4. Ameri, A.; Scheme, E.J.; Kamavuako, E.N.; Englehart, K.B.; Parker, P.A. Real-Time, Simultaneous Myoelectric Control Using Force and Position-Based Training Paradigms. IEEE Trans. Biomed. Eng. 2014, 61, 279–287. [Google Scholar] [CrossRef] [PubMed]
  5. Krasoulis, A.; Nazarpour, K.; Vijayakumar, S. Towards Low-Dimensional Proportional Myolelectric Control. In Proceedings of the IEEE International Conference on Engineering in Medicine and Biology Society (EMBS), Milano, Italy, 25–29 August 2015. [Google Scholar]
  6. Santello, M.; Bianchi, M.; Gabiccini, M.; Ricciardi, E.; Salvietti, G.; Prattichizzo, D.; Ernst, M.; Moscatelli, A.; Jörntell, H.; Kappers, A.; et al. Hand synergies: Integration of robotics and neuroscience for understanding the control of biological and artificial hands. Phys. Life Rev. 2016, 17, 1–23. [Google Scholar] [CrossRef] [PubMed]
  7. Peerdeman, B.; Boere, D.; Witteveen, H.; Hermens, H.; Stramigioli, S.; Rietman, H.; Veltink, P.; Misra, S. Myoelectric forearm prostheses: State of the art from a user-centered perspective. J. Rehabilit. Res. Dev. (JRRD) 2011, 48, 719–737. [Google Scholar] [CrossRef]
  8. Phillips, S.L.; Craelius, W. Residual kinetic imaging: A versatile interface for prosthetic control. Robotica 2005, 23, 277–282. [Google Scholar] [CrossRef]
  9. Wininger, M.; Kim, N.H.; Craelius, W. Pressure signature of forearm as predictor of grip force. J. Rehabilit. Res. Dev. 2008, 45, 883. [Google Scholar] [CrossRef]
  10. Kõiva, R.; Riedenklau, E.; Viegas, C.; Castellini, C. Shape Conformable High Spatial Resolution Tactile Bracelet for Detecting Hand and Wrist Activity. In Proceedings of the IEEE International Conference on Rehabilitation Robotics (ICORR), Singapore, 11–14 August 2015. [Google Scholar]
  11. Nissler, C.; Connan, M.; Nowak, M.; Castellini, C. Online Tactile Myography For Simultaneous and Proportional Hand and Wrist Myocontrol. In Proceedings of the Myoelectric Control Symposium (MEC), Fredericton, NB, Canada, 15–18 August 2017. [Google Scholar]
  12. Rasmussen, C.E.; Williams, C.K.I. Gaussian Processes for Machine Learning; MIT Press: Cambridge, MA, USA, 2006. [Google Scholar]
  13. Zhao, Q.; Zhou, G.; Adali, T.; Zhang, L.; Cichocki, A. Kernelization of Tensor-Based Models for Multiway Data Analysis: Processing of Multidimensional Structured Data. IEEE Signal Process. Mag. 2013, 30, 137–148. [Google Scholar] [CrossRef]
  14. Zhao, Q.; Zhou, G.; Zhang, L.; Cichocki, A. Tensor-Variate Gaussian Processes Regression and Its Application to Video Surveillance. In Proceedings of the IEEE International Conference on Acoustics, Speech and Signal Processing (ICASSP), Florence, Italy, 4–9 May 2014. [Google Scholar]
  15. Connan, M.; Ruiz Ramírez, E.; Vodermayer, B.; Castellini, C. Assessment of a Wearable Force- and Electromyography Device and Comparison of the Related Signals for Myocontrol. Front. Neurorobot. 2016, 10, 17. [Google Scholar] [CrossRef] [PubMed]
  16. Castellini, C.; Kõiva, R. Using a high spatial resolution tactile sensor for intention detection. In Proceedings of the ICORR—International Conference on Rehabilitation Robotics, Seattle, WA, USA, 24–26 June 2013; pp. 1–7. [Google Scholar]
  17. Jayasumana, S.; Hartley, R.; Salzmann, M.; Li, H.; Harandi, M. Kernel Methods on Riemannian Manifolds with Gaussian RBF Kernels. IEEE Trans. Pattern Anal. Mach. Intell. 2015, 37, 2464–2477. [Google Scholar] [CrossRef] [PubMed]
  18. Jaquier, N.; Castellini, C.; Calinon, S. Improving Hand and Wrist Activity Detection Using Tactile Sensors and Tensor Regression Methods on Riemannian Manifolds. In Proceedings of the Myoelectric Controls Symposium (MEC), Fredericton, NB, Canada, 15–18 August 2017. [Google Scholar]
  19. Nielsen, J.L.G.; Holmgaard, S.; Jiang, N.; Englehart, K.B.; Farina, D.; Parker, P.A. Simultaneous and Proportional Force Estimation for Multifunction Myoelectric Prostheses Using Mirrored Bilateral Training. IEEE Trans. Biomed. Eng. 2011, 58, 681–688. [Google Scholar] [CrossRef] [PubMed]
  20. Sierra González, D.; Castellini, C. A realistic implementation of ultrasound imaging as a human-machine interface for upper-limb amputees. Front. Neurorobot. 2013, 7, 17. [Google Scholar] [CrossRef] [PubMed] [Green Version]
  21. Jiang, N.; Vujaklija, I.; Rehbaum, H.; Graimann, B.; Farina, D. Is Accurate Mapping of EMG Signals on Kinematics Needed for Precise Online Myoelectric Control? IEEE Trans. Neural Syst. Rehabilit. Eng. 2014, 22, 549–558. [Google Scholar] [CrossRef] [PubMed]
  22. Ortiz-Catalan, M.; Rouhani, F.; Brånemark, R.; Håkansson, B. Offline accuracy: A potentially misleading metric in myoelectric pattern recognition for prosthetic control. In Proceedings of the 2015 37th Annual International Conference of the IEEE Engineering in Medicine and Biology Society (EMBC), Milano, Italy, 25–29 August 2015; pp. 1140–1143. [Google Scholar]
Figure 1. (a) A participant equipped with the two sensor devices. The proximal device is a shape-conformable tactile bracelet with 10 pressure sensor modules. The distal device is composed of 10 surface electromyography (sEMG) sensors linked to a wireless acquisition device. (b) The two sensor devices lain down, as shown from the side in contact with the skin. In the upper part, the tactile bracelet is linked via a mini USB cable to the computer. In the lower part, the sEMG Ottobock electrodes are linked to a data acquisition board transmitting the data via Bluetooth to the same computer. The spacing of the sensors/modules of each bracelet could be easily changed to adapt to the circumference of the forearm of each participant.
Technologies 05 00064 g001
Figure 2. Functional block representation of the analog-to-digital converter (ADC) board for the surface electromyography (sEMG) sensors (reproduced with permission from [15]).
Technologies 05 00064 g002
Figure 3. The tactile bracelet rolled out with 10 modules regularly spaced on a Velcro strap.
Technologies 05 00064 g003
Figure 4. Training part of the experiment: the participant imitates the grey animated hand model.
Technologies 05 00064 g004
Figure 5. Testing part of the experiment: the participant imitates the grey animated hand model and controls the skin-colored model. The green smiling face indicates a successful task.
Technologies 05 00064 g005
Figure 6. Comparison of the success rate (SR) of Gaussian process regression (GPR) and ridge regression (RR).
Technologies 05 00064 g006
Figure 7. Comparison of the time to complete task (TCT) and the time in the target (TIT) between Gaussian process regression (GPR) and ridge regression (RR), in the case of successful and failed tasks, respectively.
Technologies 05 00064 g007
Figure 8. Comparison of the root-mean-square error (RMSE) between Gaussian process regression (GPR) and ridge regression (RR) for the different movements executed by the participants.
Technologies 05 00064 g008
Figure 9. Comparison of the root-mean-square error (RMSE) between Gaussian process regression (GPR) and ridge regression (RR) for different activation levels.
Technologies 05 00064 g009
Figure 10. Performance of ridge regression (RR) and Gaussian process regression (GPR) with different distances using surface electromyography (sEMG) (a), tactile myography (TMG) (b), or both (c) as input for the regression models.
Technologies 05 00064 g010
Figure 11. Comparison of the root-mean-square error (RMSE) between Gaussian process regression (GPR) using different kernel distances to combine surface electromyography (sEMG) and tactile myography (TMG) as input for the different movements executed by the participants.
Technologies 05 00064 g011
Table 1. Performance comparison in term of success rate (SR), time to complete the task (TCT) and time in the target (TIT) between Gaussian process regression (GPR) and ridge regression (RR) in experiment 1.
Regression MethodSR (%)TCT (s)TIT (s)RMSE
GPR ( d Eucl ) 55 . 35 % ± 17 . 28 % 4 . 58 ± 3 . 02 0 . 13 ± 0 . 46 0 . 58 ± 0 . 08
RR 35 . 60 % ± 12 . 24 % 5 . 56 ± 3 . 46 0 . 23 ± 0 . 56 0 . 78 ± 0 . 12
Table 2. Performance in term of root mean square error (RMSE) of ridge regression (RR) and Gaussian process regression (GPR) with different distances using surface electromyography (sEMG) or tactile myography (TMG) as input for the regression model.
sEMGRMSE TMGRMSE
GPR ( d Eucl ) 0 . 69 ± 0 . 12 GPR ( d Eucl ) 0 . 31 ± 0 . 05
GPR ( d logSPD ) 0 . 46 ± 0 . 05 GPR ( d logSPD ) 0 . 31 ± 0 . 05
GPR ( d SPD ) 0 . 58 ± 0 . 05 GPR ( d SPD ) 0 . 32 ± 0 . 06
GPR ( d KL ) 0 . 38 ± 0 . 12
RR 0 . 47 ± 0 . 06 RR 0 . 41 ± 0 . 23
Table 3. Performance in term of root mean square error (RMSE) of ridge regression (RR) and Gaussian process regression (GPR) with different distances combining surface electromyography (sEMG) and tactile myography (TMG) as input for the regression models.
sEMG d Eucl d logSPD d SPD
TMG
d Eucl 0 . 29 ± 0 . 05 0 . 31 ± 0 . 05 0 . 31 ± 0 . 06 RR 0 . 39 ± 0 . 25
d SPD 0 . 31 ± 0 . 05 0 . 32 ± 0 . 06 0 . 32 ± 0 . 06
d KL 0 . 31 ± 0 . 06 1 . 15 ± 2 . 08 2 . 02 ± 5 . 01
Table 4. Computation (comp.) time for the different kernel distances using surface electromyography (sEMG) or tactile myography (TMG) as input for the regression model. The time to compute training distances is the time needed to compute the distances between all training data points. The time to compute testing distances is the time needed to compute the distance of a new test data point with all training data points.
sEMGTraining Distances Comp. Time (s)Testing Distances Comp. Time (s)
d Eucl 0 . 37 ± 0 . 01 0 . 001 ± 0 . 001
d logSPD 34 . 18 ± 0 . 96 0 . 046 ± 0 . 001
d SPD 2 . 75 ± 0 . 1 0 . 006 ± 0 . 001
TMG Training Distances Comp. Time (s)Testing Distances Comp. Time (s)
d Eucl 1 . 35 ± 0 . 06 0 . 003 ± 0 . 000
d SPD 1 . 94 ± 0 . 06 0 . 077 ± 0 . 007
d KL 49 . 31 ± 2 . 1 0 . 184 ± 0 . 010

