Dynamic Evaluation on the Traffic State of an Urban Gated Community by Opening the Micro-Inter-Road Network

1
Mechanical Engineering School, Shanghai University of Engineering Science, Shanghai 201620, China
2
Department of Mechanical Systems Engineering, Yamagata University, Yamagata 990-8560, Japan
3
School of Aeronautic Science and Engineering, Beihang University, Beijing 100191, China
*
Author to whom correspondence should be addressed.
Technologies 2018, 6(3), 71; https://doi.org/10.3390/technologies6030071
Submission received: 15 June 2018
/
Revised: 25 July 2018
/
Accepted: 26 July 2018
/
Published: 31 July 2018
(This article belongs to the Special Issue Smart Systems)
Abstract
:The opening of a gated community to expand the micro-road network in an urban traffic system is an importance research topic related to urban congestion. To satisfy the demands of opening an early choosing case, this paper proposes a comprehensive selection framework on qualified communities and their appropriate opening times by describing the traffic state at the boundary road network accurately. The traffic entropy model and fuzzy c-means (FCM) method are used in this paper. In the framework, a new opening evaluation entropy model is built using basic theory of the thermodynamic traffic entropy method. The traffic state entropy values of the boundary road network and entropy production are calculated to determinate the opening time. In addition, a specific fuzzy range evaluation standard at a preset gated community is drawn with an FCM algorithm to verify the opening determination. A case study based on the traffic information in a simulated gated community in Shanghai is evaluated and proves that the findings of opening evaluation are in accordance with the actual situation. It is found that the micro-inter-road network of a gated community should be opened as the entropy value reaches 2.5. As the travel time is less than 20 s, the correlation between the opening entropy value and the journey delay time exhibits a good linear correlation, which indicates smooth traffic flow.
1. Introduction
Urban gated communities create a boundary separating the road system from the open community outside the walls or fences. The boundary walls on the boundary of living are quartered from each independent area. Though gated communities are attractive due to their lifestyle, elite and secure characteristics, they have heavy traffic congestion problems, especially in city center and at peak traffic times. The outside traffic flow cannot go through such communities, which seriously influences the traffic around them. The internal roads are not connected with the main roads of the outside traffic network. This reduces the density of the urban road network and the effective use of the residential roads which greatly increases the pressure on road access around the community.
Three typical internal road network types are square type, grid type, and inter-loop type networks. The inter-loop type has the highest density and multi-directional structure out of the three typical internal road networks. Therefore, based on the effects of the internal roads on the surrounding road capacity, the inter-loop type is most qualified to open, the grid type is the second choice, and the linear type is the last choice.
In order to evaluate the opening state of gated communities, it is necessary to analyze the mechanisms of traffic flow congestion at the boundary road networks accurately. Actually, there is no unified and fixed evaluation process for traffic operation degrees. Therefore, many studies or organizations accumulate a lot of real-time traffic flow information, such as volume, speed, journey time, and so on. The Washington State Transportation Department [1] stated that the congestion evaluation degree is defined as the average peak travel time. The latest Highway Capacity Manual (HCM) [2] used a level of service that was defined into six grades to evaluate road performance in the United States. However, it is perhaps not appropriate for the urban traffic state in China which has a specific road network structure. On the other hand, the trend entropy theory has become an important method for studying traffic flow. Shao et al. [3] explored the principles and algorithm of the entropy-maximizing model (EM model) with gravitational prior probability. Yong et al. [4] studied the entropy condition for the Lighthill–Whitham–Richards model of fractal traffic flow described by local fractional calculus. They also discussed the solutions of non-differentiability with graphs using the local fractional vibrational iteration method.
The traffic flow of a specific gated living quarter is characterized by its uniqueness, experience historical aspect, uncertainty, and complexity. Therefore, to address these shortcomings, historical specific traffic flow data should be studied sufficiently. Lozano et al. [5] proposed a recognition algorithm for road congestion levels by analyzing real-time traffic flow data based on the K-means clustering analysis algorithm. Sun [6] employed the fuzzy c-means (FCM) cluster analysis and fuzzy synthetic evaluation method to classify urban traffic into six different state classifications. However, it is difficult to obtain the quantitative evaluation results of traffic state. Antoniou et al. [7] proposed an approach for local traffic flow state estimation and prediction based on data-driven computational approaches. It built a pre-existing modeling component in a methodologically novel way.
Researchers have taken a keen interest in exploring the problem of opening gated communities’ internal road systems. It has become to optimize the layout of the urban road network and to ease the increasingly serious traffic congestion. It leads to many problems, such as modification cost, noise pollution, safety, and so on. However, there has been little research on how to consider specific gated communities’ objectives and how to optimize open planning, which has become a realistic problem and urgently needs to be solved, thus motivating the present work. Further research remains to be conducted on the comprehensive strategies of gated community selection and opening. An outside road system analysis and influential factor evaluation of the traffic state at the boundaries around gated communities, which has the ability to decide the opening hours, is the objective of the present work.
In this paper, an overview of the framework and process of the comprehensive opening evaluation model is first described. Then, the methodology of traffic flow state identification and opening evaluation at the boundary is proposed. The evaluation standard for the specific gated community case by FCM clustering method is built. Finally, a case study based on a simulated gated community is carried out to demonstrate the performance and applicability of the proposed method.
2. Proposed Framework and Process of Comprehensive Opening Evaluation Model
There are several challenges in the analysis, selection, and evaluation of gated communities. Firstly, the qualified living quarter within a wide variety of boundary road structures needs to be analyzed. Secondly, it is necessary to accurately start the opening based on real-time evaluation. Thirdly, the uncertainty and complexity of traffic flow should be evaluated. Finally, it is important to obtain quantitative results of the opening state evaluation rather than qualitative results.
In the proposed framework, as shown in Figure 1, firstly, the traffic state entropy values of the boundary road network and entropy production are calculated. Then, a new opening evaluation entropy model using the basic theory of thermodynamic traffic entropy is developed. The traffic flow data of the specific gated community is classified into five levels to determine the fuzzy standard of the opening state based on the FCM clustering method. At last, the comparison between the entropy value and standard is performed and discussed.
3. Evaluation of the Opening System at the Boundary Road Network
3.1. Variables of Interest at the Boundary Road Network
3.1.1. Free Flow Speed (uf)
A vehicle passes a certain section at the maximum speed without any interference. The corresponding density tends towards zero, and the traffic flow tends to zero.
3.1.2. Critical Speed (um)
When the flow volume increases gradually, the flow speed reaches the road capacity speed at , and the corresponding density is called the critical density (km). The traffic flow volume at this time is the maximum flow volume in the road section (qm) [6].
3.1.3. Jam Density (kj)
The jam density is defined as a density at which traffic flow tends towards zero-speed or the density at which vehicles queue. Meanwhile, the flow speed tends towards zero.
In this study, the following variables for the evaluation of the boundary road network were used to determine the threshold value of the opening entropy model.
3.2. Basic Traffic Flow Entropy Model at the Boundary Road Network
In an actual road traffic system, it is difficult to detect the traffic pressure increments and vehicle number increments in a unit of road per unit of time, but the traffic pressure increments and vehicle number increments between two states may be measured. Therefore, it is possible to define any one of the states as the initial state and to derive other state entropy values [7,8,9,10].
It is well known that entropy is used to describe the order or disorder of the system—the smaller the entropy value is, the more the system tends to be ordered. As , the traffic road system has the highest degree of order which is defined as the initial state at this time. The other variables of the initial state are defined as the opening entropy, and the density. Therefore, we may calculate the entropy of any specific state from the initial state. The basic entropy model is given as
where P0 is the initial traffic flow press, and x is the number of vehicles. Based on the initial state data ( and ) the basic entropy model is written as
By using above model, the opening entropy of any traffic flow state may be evaluated.
- 1.
- Steady Traffic Flow State
When the traffic flow speed and density are unchanged with time, we define it as a steady traffic flow state. Additional, the traffic speed of the road section is considered to be the same within a short road section. Therefore, the number of input vehicles is equal to the number of output vehicles on the road section. Meanwhile, if the vehicle’s speed does not change, and the entire road section is in a steady state, then the entropy model of the steady traffic flow section is given as
The entropy value of steady traffic flow with speed u is obtained by
The congestion is also considered to be a kind of steady traffic flow state, in which the speed and density are also unchanged with time.
- 2.
- Unsteady Traffic Flow State
If it is assumed that in a short period of time, the speed of the road section changes from u1 to u2, the entropy is generated as
The entropy rate in units of time is written as
3.3. Opening Evaluation Entropy Model
In order to visualize and evaluate the operation of the vehicle flow on the boundary of the gated communities, we introduce a new physical evaluation state as the opening state entropy, defined as . The study set the research object as a simulated boundary road system with the total length (L) being a road section. In the fixed length (L) road section, three critical state parameters are substituted into the basic entropy model. When vehicles are moving with free flow speed ( and k = 0), the local entropy rate is . At this moment, the traffic road system is steady and S = 0.
When vehicles are moving at the critical speed (, k = km), then
As the traffic flow density tends towards jam density (, k = kf),
The opening evaluation entropy is defined in the range of 0–10. When vehicles are moving with free flow speed, i.e., , the opening evaluation entropy becomes the minimum value of 0. On the other hand, when u = 0, the opening evaluation entropy value is defined as the maximum value of 10.
Therefore, any u and k in a fixed length (L) of road, the road network opening entropy value is
Then, the opening evaluation entropy model is obtained as follows:
In addition, in order to determine the accurate time to open the inner road system of a gated community, the threshold value of the opening state in the entropy model should be defined. Here, we chose specific parameters’ values at the critical traffic state, For example, when vehicles are moving at a critical speed (, density k = km), the opening evaluation entropy value is . Then, we defined the threshold value of the opening state in the entropy model as . If , the boundary road networks is in correct order and the gated communities should be keep closed; if , the boundary road networks is in disorder, and the inter-road network should be open to the public to relieve the traffic jam.
3.4. FCM Clustering Analysis of Opening Traffic Data at Boundary
Clustering analyses identify the similarities and dissimilarities in data and classify data into groups based on similar characteristics. It can be used for large data analyses and divides multidimensional data into a specific number of classes.
In this paper, the fuzzy c-means (FCM) clustering algorithm was used to solve the threshold values of different traffic and opening states. The opening data and traffic flow at the boundary are continuously random, so it was necessary to build a clustering model to distinguish the opening state from others [11,12,13,14,15,16].
The modified FCM method was used to calculate the fuzzy range of each index. The input data, which is historic traffic flow data of the study gated community was defined as
where m is the sample data number, and n is the index number. The solution steps were as follows:
- Step 1.
- Set initialization parameters. In this paper, the opening state data was classified into five different states: the smooth-close state (A), the stable-ready close state (B), the slow-open state(C), the congested-open state (D), and the very congested-open state (E). The cluster number was set to c = 5, the iterative stopping threshold was set to , and the exponential weight was set to t = 2.5. Choose the initial cluster centers , andomly from the . The iteration number was set to r = 0. Here, xij is the j-th sample, Ki is the i-th cluster center, and n is the number of evaluation indices.
- Step 2.
- The membership matrix (U(r)) was computed or updated. We setas the distance between the i-th cluster center (Ki) for the j-th sample. The matrix (U(r)) was expressed by the following:where is the membership degree of the j-th sample belonging to the i-th cluster.
- Step 3.
- The new cluster centers (K(r+1)) were updated as follows:
- Step 4.
- We set . If , in which the iterative stopping threshold , the algorithm was deemed to be finished, and the membership matrix (U) and the clustering center (K) were output. If , , we returned to Step 2.
4. Results and Discussion
4.1. Environment of Simulation Gated Community
The simulation gated community, as shown in Figure 2, covers a total area of 3900 square meters in Shanghai, in which the total construction area is 13,000 square meters and the greening rate is 42%. It is mainly constructed of high-rise buildings and slab-type apartments.
The sample case is characterized by a loop type boundary structure. It is located at the key urban center of Shanghai, surrounded by advantageous trading. As shown in Figure 3, Dapuqiao business zone is located 200 m to the west and Huaihai road is located 300 m to the north. A new shopping mall is located in the east. It also has a primary school, a medical school of a top university, various small business building, shops, and many other facilities in a kilometer circle area.
The internal road network is the typical loop type, and the main road is two-way, single lane, as indicated in Figure 3. The surrounding living quarters were mainly constructed more than 20 years ago, and the internal networks are limited for huge vehicles. In addition, the width of the road completely splits the flow of people and vehicles, and its good view and other various advantages have promoted it to be an open community.
As for the more important boundary road network system, it blocks center area road networks to daily urban traffic. As shown in Figure 3, it is a well-shaped road network. To the east is Madang road, and to the north is Jiangguo east road. To the west is Danshui road, and to the south is the urban main road, Xujiahui road. The key south and north viaducts are located 100 m to the southwest along Xujiahui road. As determined by examining the historical data of the morning and evening traffic peaks, the gated community blocks the urban traffic flow seriously. In this study, we evaluate the opening entropy to determine the optimum time to open the gated community and relieve the congestion.
4.2. Opening Evaluation Results of Boundary Network
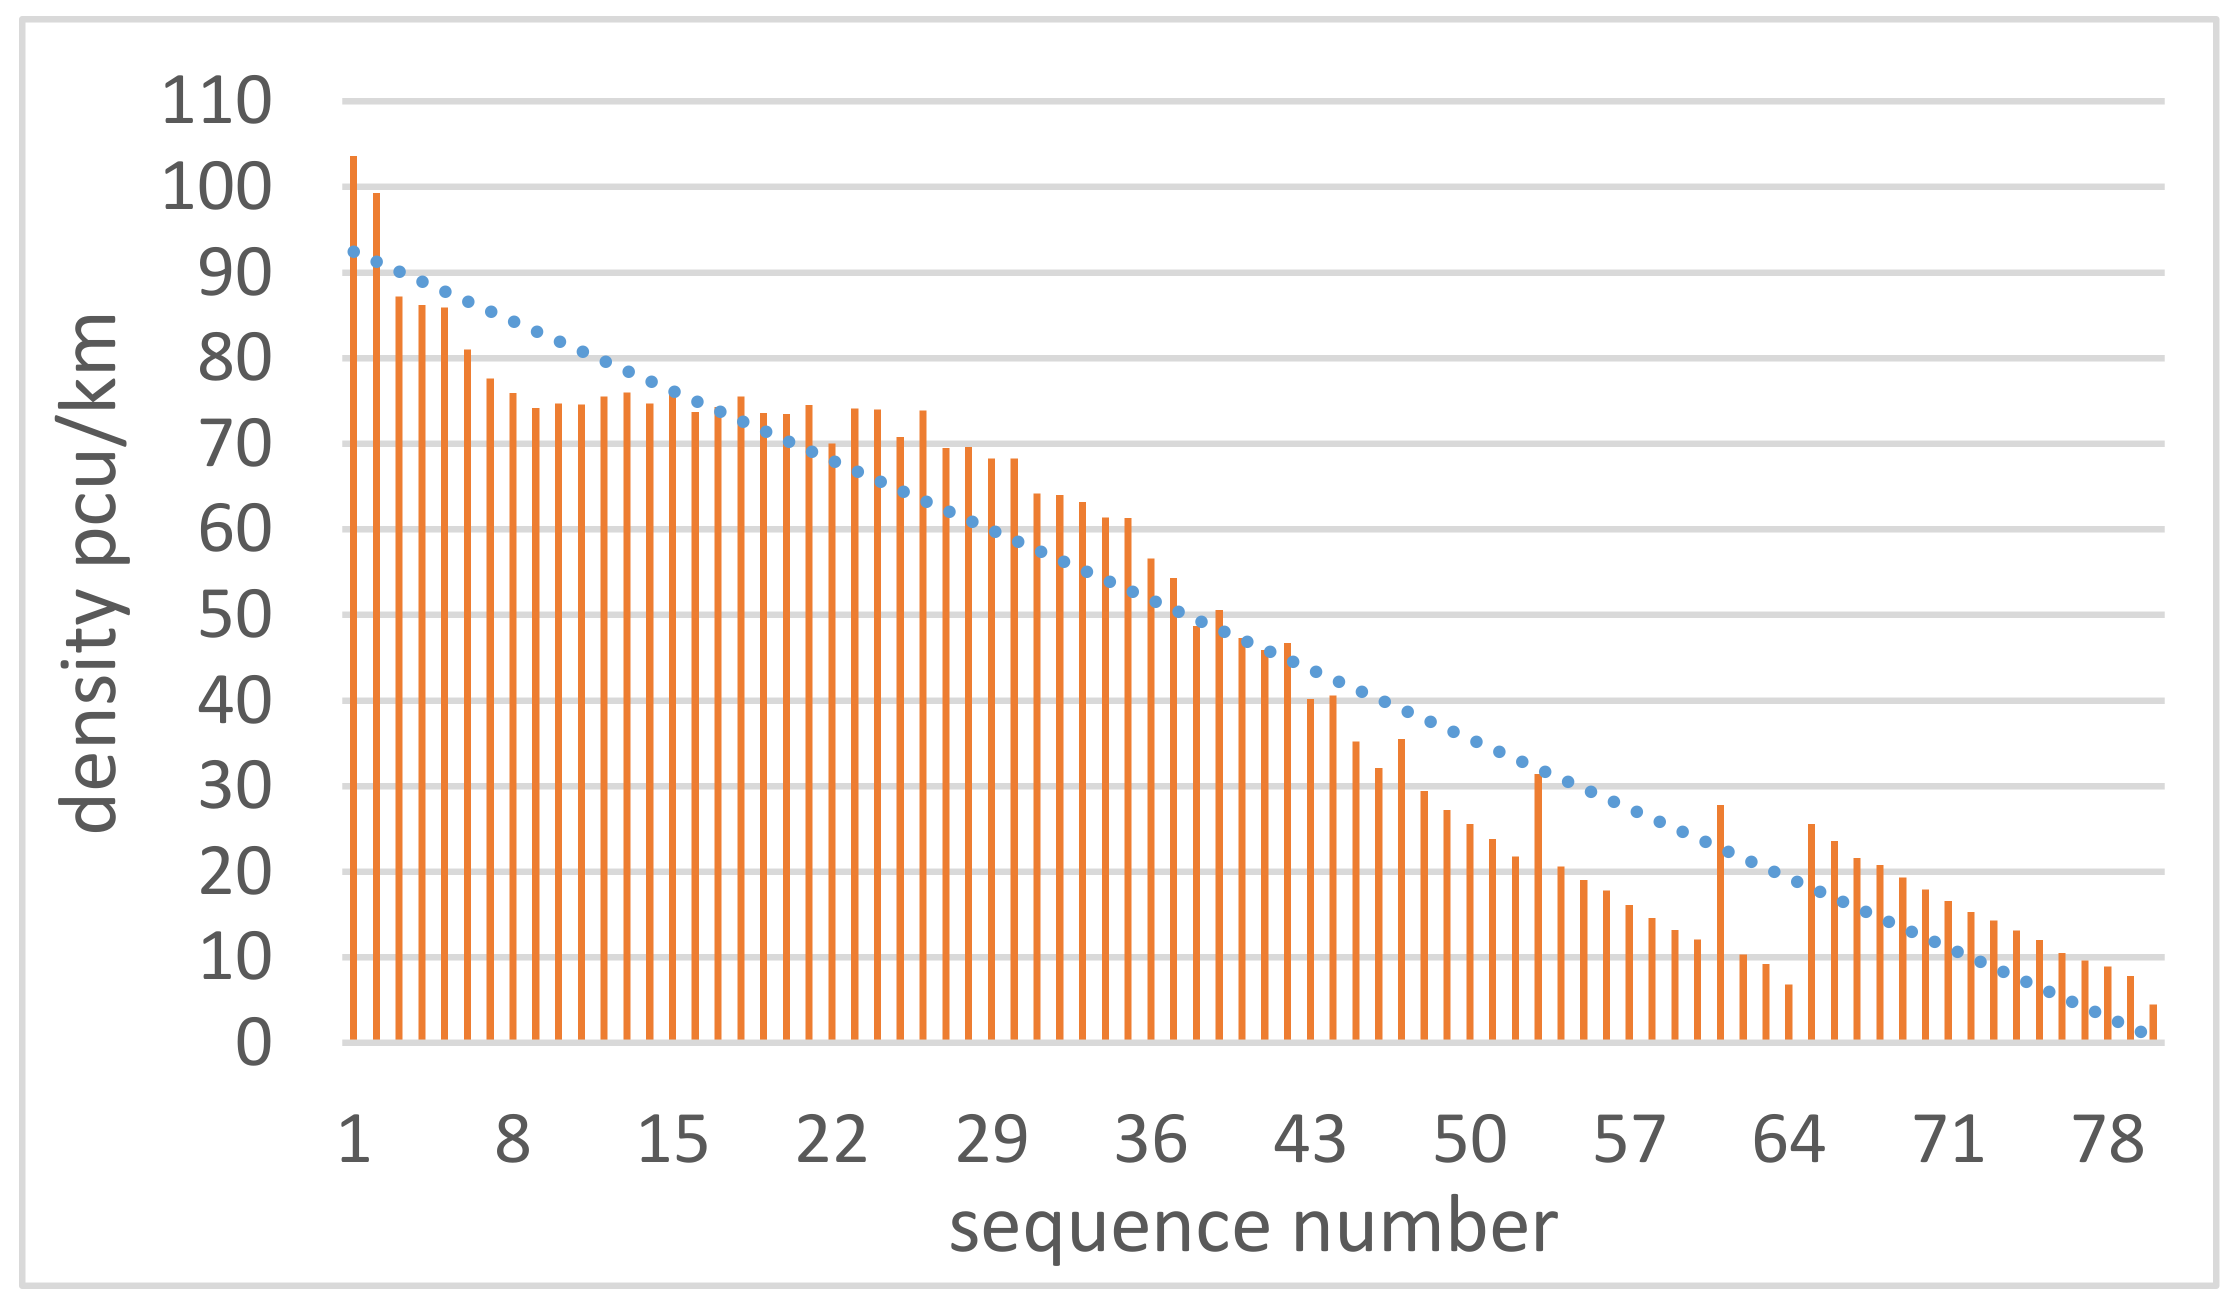
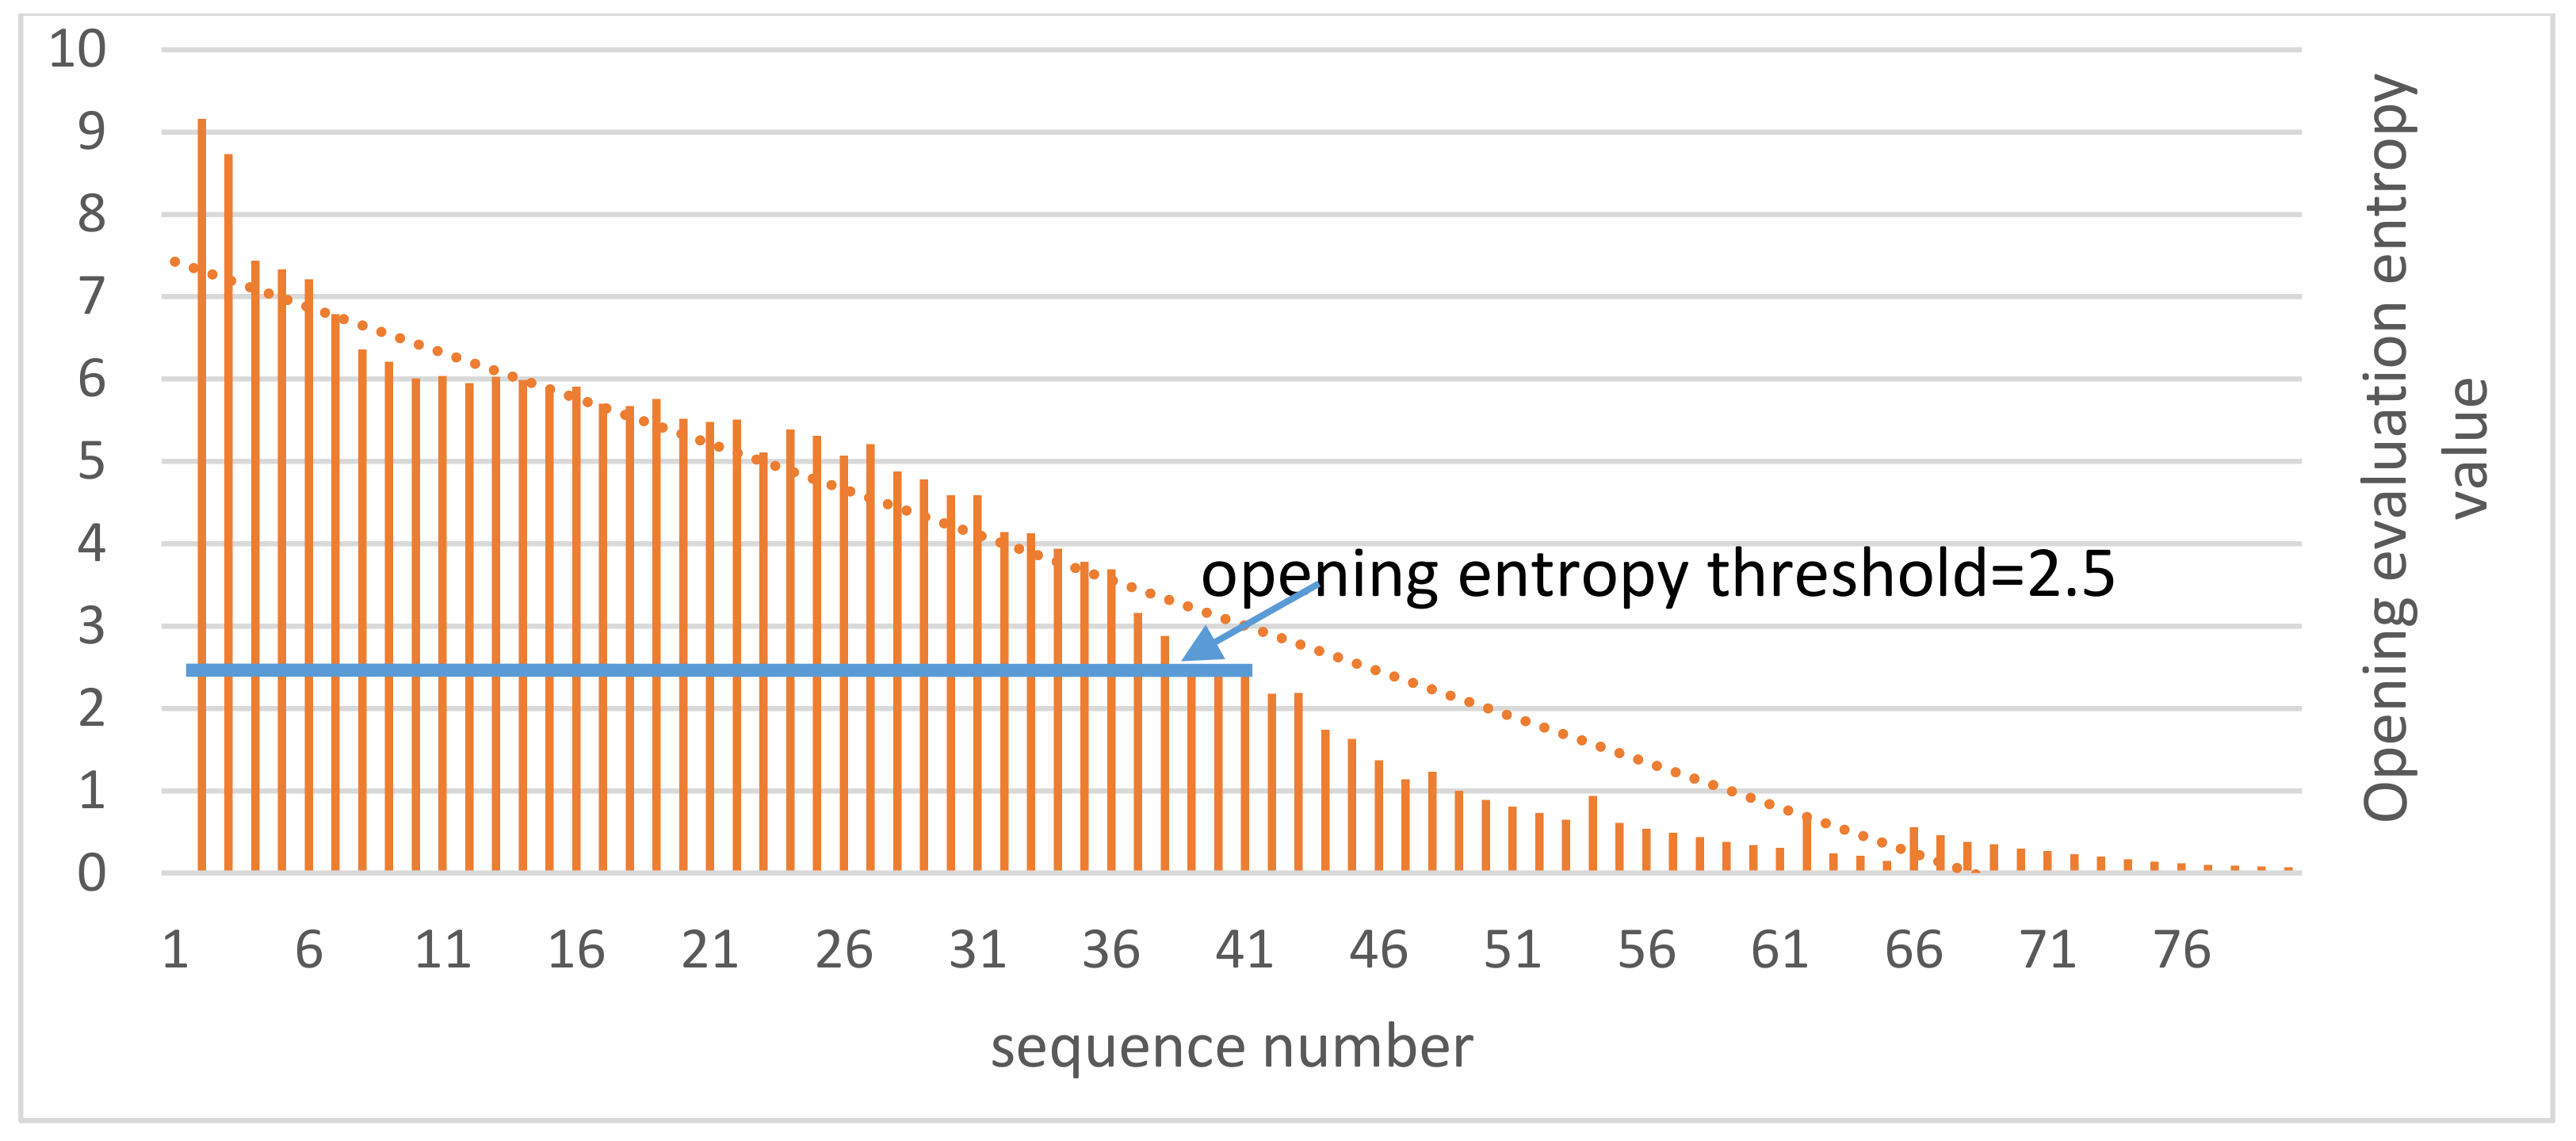
As indicated in Figure 3, the boundary road network at the gated community case is equipped with four roads and a total of 12 sections. Road 1 consists of sections 1–3, and road 2 includes sections 4–6. Road 3 is divided into sections 7–9, and road 4 includes sections 10–12. Traffic information, including the volume, average velocity, and time occupancy were obtained from the simulations and were used in the model of opening evaluation entropy. The results are shown in Figure 4, Figure 5 and Figure 6. Here, the abscissa of the graph is the sequence number axis. Figure 4 and Figure 5 indicate that as the traffic flow speed increases, the density of vehicles decreases. The opening evaluation entropy value, as shown in Figure 6, also decreases. A line of the opening threshold value, 2.5, is plotted in Figure 6. Below 2.5, the opening evaluation entropy value rapidly decreases. The inter-road of the gated community tends to be open when the entropy value reaches 2.5. On the other hand, it closes when the entropy value is below 2.5. Figure 4, Figure 5 and Figure 6 also indicate that the opening threshold value, 2.5, corresponds to the sequence number 40, revealing the inter-road of the gated community when the vehicle velocity is less than 25 km/h or the vehicle density is larger than 45 pcu/km.
4.3. Clustering Analysis of the Fuzzy Standard Ranges
In order to obtain the fuzzy range standard in different states to verify the model result, an FCM clustering analysis was performed for the boundary road network in this case study. The FCM results are shown in Figure 7. The FCM clustering model was employed to classify traffic flow data at the boundary into five different states, and the evaluation of the fuzzy standard range is given in Table 1. The vehicles in the sections were moving at 50–60 km/h and the traffic free flow was 50 km/h. Furthermore, the travel time of a road network is one of the most intuitive and effective traffic flow parameters that characterizes traffic congestion. The travel time may be used as a comparative evaluation verified criterion for the discrimination of traffic conditions. Therefore, we calculated the corresponding journey time delay value that is also shown in Table 1.
4.4. Comparison between Entropy Value and Journey Delay Time
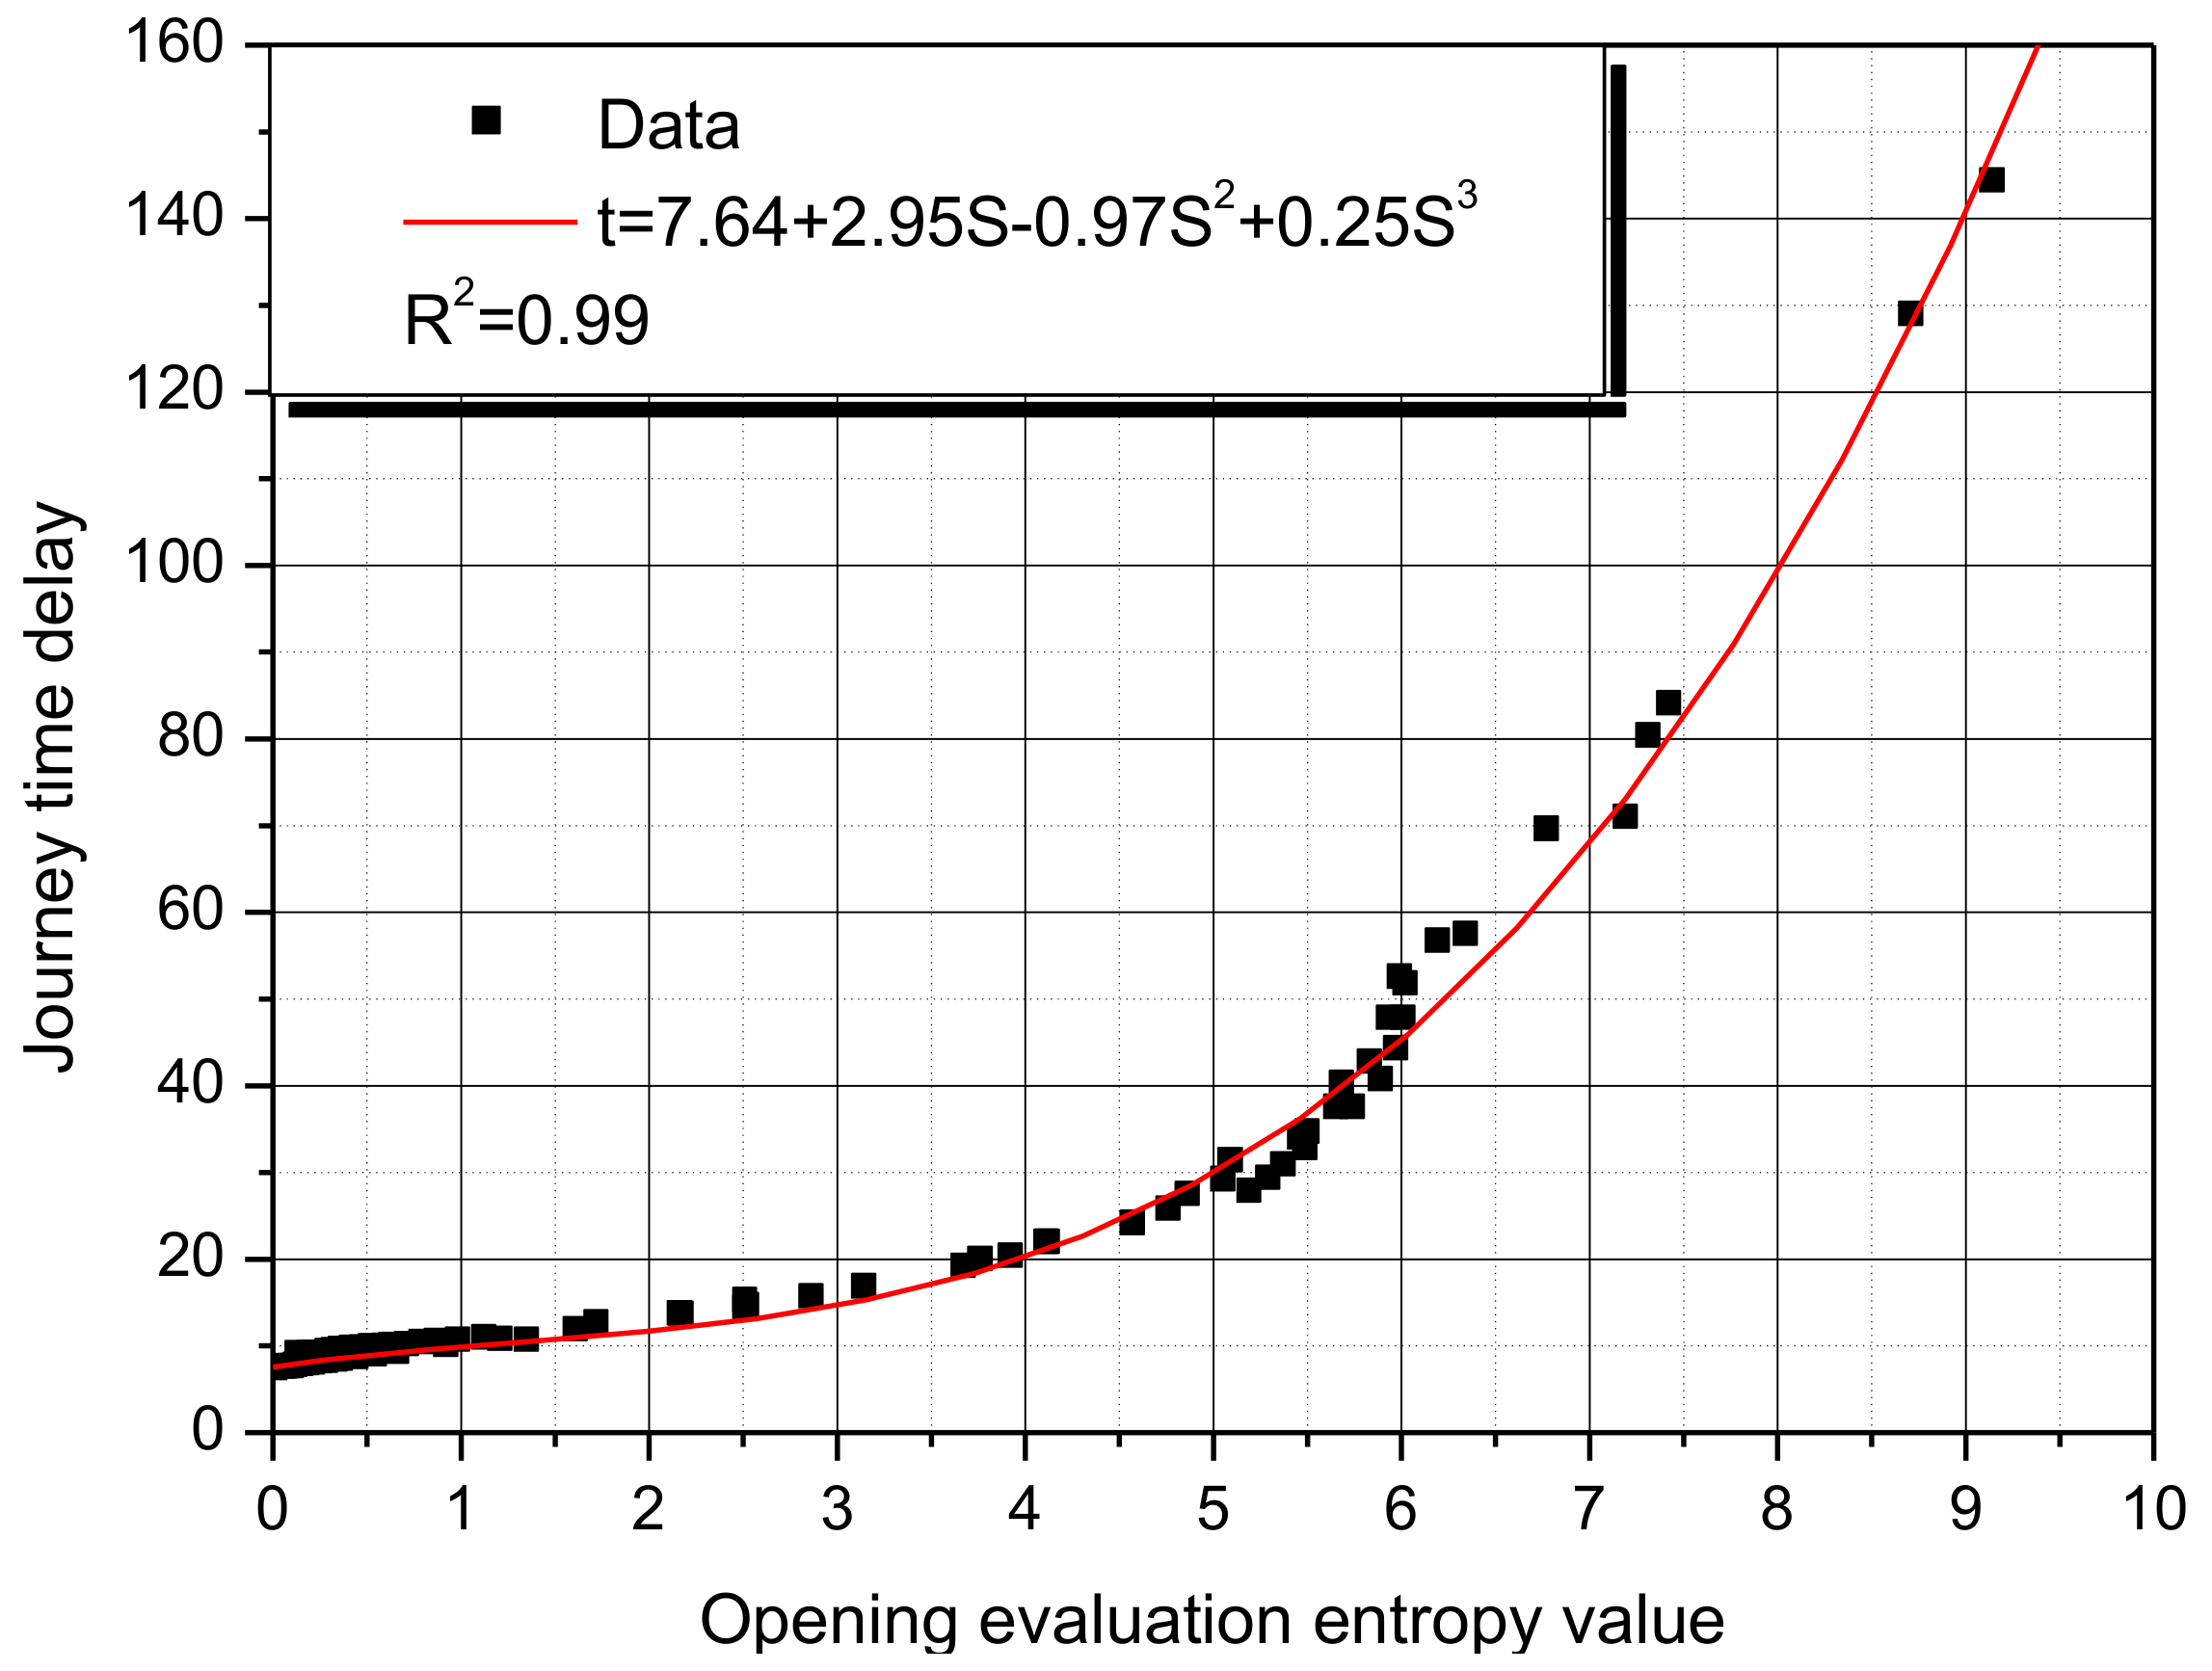
Figure 8 shows the relationship between the opening entropy value and the journey delay time by analyzing the traffic flow data of the boundary road network based on the opening entropy model. The simulation results indicate that as the journey delay time increases, the opening entropy value increases. When the opening entropy value is larger than 2.5, the journey delay time increases from t = 16.8 rapidly. Therefore, the state entropy results are consistent with those of the journey travel time.
The real-time traffic flow data was the input to the opening entropy model, and the journey delay time values were also calculated. The correlation between the opening entropy value and the journey delay time is expressed as following equation:
and it is within the acceptable error range of R2 = 0.99.
When the travel time is less than 20 s, the correlation between the opening entropy value and the journey delay time exhibit a good linear correlation which indicates a smooth traffic flow. As the vehicle is in a congested state, vehicles tend to stop, and the travel time increases rapidly. So, it is feasible to collect data over a short time period.
5. Conclusions
A comprehensive opening framework on qualified communities and their appropriate opening times was studied by developing an improved opening evaluation model that consists of the traffic entropy model and the fuzzy c-means method. The opening evaluation entropy values and their visual present were mainly investigated. The simulation indicated that the proposed analysis and model are capable of capturing the real opening states of gated communities. The important results are summarized as follows:
- 1.
- The micro-inter-road network of the gated community should be opened as the entropy value reaches 2.5.
- 2.
- As the travel time becomes less than 20 s, the correlation between the opening entropy value and the journey delay time exhibits a good linear correlation which indicates smooth traffic flow.
Since the simulations were implemented with the comprehensive opening evaluation model, which should be improved in the future, the mechanisms of opening and congestion characteristics should be paid more attention.
Author Contributions
Conceptualization, L.D. and A.R.; Methodology, L.D. and A.R.; Investigation, Z.T.
Funding
This work is partially supported by the visiting foreign scholarship of 8th “Teacher Professional Development Project” fund by Shanghai Municipal Education Commission (No. 2017 32), and the Teaching construction project of Shanghai University of Engineering and Technology (No. P201701001).
Conflicts of Interest
The authors declare no conflict of interest.
References
- Bar-Gera, H. Evaluation of a cellular phone-based system for measurements of traffic speeds and travel times: A case study from Israel. Transp. Res. C Emerg. Technol. 2007, 15, 380–391. [Google Scholar] [CrossRef]
- Transportation Research Board. Highway Capacity Manual; TRB, National Research Council: Washington, DC, USA, 2000.
- Shao, Y.; Cheng, L.; Wang, W. Application of Entropy-maximizing (EM) Model in Traffic Distribution Forecast. J. Transp. Syst. Eng. Inf. Technol. 2005, 5, 83–87. [Google Scholar]
- Guo, Y.-M.; Zhao, Y.; Zhou, Y.-M.; Xiao, Z.-B.; Yang, X.J. On the local fractional LWR model in fractal traffic flows in the entropy condition. Math. Methods Appl. Sci. 2017, 40, 6127–6132. [Google Scholar] [CrossRef]
- Lozano, A.; Manfredi, G.; Nieddu, L. An algorithm for the recognition of levels of congestion in road traffic problems. Math. Comput. Simul. 2009, 79, 1926–1934. [Google Scholar] [CrossRef]
- Sun, X.L. Urban Road Traffic State Evaluation and Prediction: A New Scheme with Applications. Ph.D. Thesis, Beijing Jiaotong University, Beijing, China, 2013. [Google Scholar]
- Antoniou, C.; Koutsopoulos, H.N.; Yannis, G. Dynamic data-driven local traffic state estimation and prediction. Transp. Res. Part C Emerg. Technol. 2013, 34, 89–107. [Google Scholar] [CrossRef]
- Feng, K.Y. Entropy and Component Properties of Mixed Traffie. J. Funan Univ. 1992, 19, 10–16. [Google Scholar]
- Jie, Q. Research on Traffic State Discrimination of Urban Trunk Road Based on Entropy and Hydrodynamics. Master’s Thesis, Northeast Forestry University, Harbin, China, 2010. [Google Scholar]
- Mao, X. Microcirculation: A Case Study of Donghu District in Nanchang. J. Landsc. Res. 2017, 9, 1–3. [Google Scholar]
- Yao, Y.; Ye, H.; Wu, D.; Zhang, Y.; Guan, Q. Estimating the effects of “community opening” policy on alleviating traffic congestion in large Chinese cities by integrating ant colony optimization and complex network analyses. Comput. Environ. Urban Syst. 2018, 70, 163–174. [Google Scholar] [CrossRef]
- Min, W.; Wynter, L. Real-time road traffic prediction with spatio-temporal correlations. Transp. Res. C Emerg. Technol. 2011, 19, 606–616. [Google Scholar] [CrossRef]
- Yuan, J.; Mills, K.A. A cross-correlation-based method for spatial–temporal traffic analysis. Perform. Eval. 2005, 61, 163–180. [Google Scholar] [CrossRef]
- Bhattacharya, S.; Bhatnagar, V. Fuzzy data mining: a literature survey and classification framework. Int. J. Netw. Virtual Organ. 2012, 11, 382–408. [Google Scholar] [CrossRef]
- Wright, M.; Horowitz, R. Fusing loop and GPS probe measurements to estimate freeway density. IEEE Trans. Intell. Transp. Syst. 2016, 17, 3577–3590. [Google Scholar] [CrossRef]
- Lo, C.-C.; Kuo, Y.-H. Traffic-aware routing protocol with cooperative coverage-oriented information collection method for VANET. IET Commun. 2017, 11, 444–450. [Google Scholar] [CrossRef]
Figure 1.
The framework and process of the comprehensive opening evaluation model.

Figure 2.
Simulated gated community.

Figure 3.
Boundary road network system.

Figure 4.
Average speed.

Figure 5.
Density.

Figure 6.
Opening evaluation entropy value.

Figure 7.
Results of the improved FCM clustering analysis for the standard range.

Figure 8.
Relationship between the evaluation entropy and journey delay time.


Table 1.
Fuzzy standard ranges of influential factors in different states of the specific gated community case.
Table 1.
Fuzzy standard ranges of influential factors in different states of the specific gated community case.
| Factor | Average Speed (Vs) | Journey Time Delay (JTD) | |
|---|---|---|---|
| State | |||
| Smooth | 44~ | 50~16.8 | |
| Stable | 30~44 | 11.4~12.6 | |
| Slow (open) | 26~30 | 12.6~14.2 | |
| Congested (open) | 17~26 | 1.42~16.8 | |
| Very congested (open) | 0~17 | 16.8~ | |
© 2018 by the authors. Licensee MDPI, Basel, Switzerland. This article is an open access article distributed under the terms and conditions of the Creative Commons Attribution (CC BY) license (http://creativecommons.org/licenses/by/4.0/).
Share and Cite
MDPI and ACS Style
Dong, L.; Rinoshika, A.; Tang, Z. Dynamic Evaluation on the Traffic State of an Urban Gated Community by Opening the Micro-Inter-Road Network. Technologies 2018, 6, 71. https://doi.org/10.3390/technologies6030071
AMA Style
Dong L, Rinoshika A, Tang Z. Dynamic Evaluation on the Traffic State of an Urban Gated Community by Opening the Micro-Inter-Road Network. Technologies. 2018; 6(3):71. https://doi.org/10.3390/technologies6030071
Chicago/Turabian StyleDong, Lin, Akira Rinoshika, and Zhixian Tang. 2018. "Dynamic Evaluation on the Traffic State of an Urban Gated Community by Opening the Micro-Inter-Road Network" Technologies 6, no. 3: 71. https://doi.org/10.3390/technologies6030071
Note that from the first issue of 2016, this journal uses article numbers instead of page numbers. See further details here.