

Evaluating the Privacy and Utility of Time-Series Data Perturbation Algorithms

Department of Electrical Engineering and Information Technology, Faculty of Engineering and Information Technology, George Emil Palade University of Medicine, Pharmacy, Science, and Technology of Targu Mures, 540139 Targu Mures, Romania
Mathematics 2023, 11(5), 1260; https://doi.org/10.3390/math11051260
Submission received: 1 February 2023
/
Revised: 26 February 2023
/
Accepted: 3 March 2023
/
Published: 5 March 2023
(This article belongs to the Special Issue Recent Advances in Security, Privacy, and Applied Cryptography)
Abstract
:Data collected from sensor-rich systems may reveal user-related patterns that represent private information. Sensitive patterns from time-series data can be protected using diverse perturbation methods; however, choosing the method that provides the desired privacy and utility level is challenging. This paper proposes a new procedure for evaluating the utility and privacy of perturbation techniques and an algorithm for comparing perturbation methods. The contribution is significant for those involved in protecting time-series data collected from various sensors as the approach is sensor-type-independent, algorithm-independent, and data-independent. The analysis of the impact of data integrity attacks on the perturbed data follows the methodology. Experimental results obtained using actual data collected from a VW Passat vehicle via the OBD-II port demonstrate the applicability of the approach to measuring the utility and privacy of perturbation algorithms. Moreover, important benefits have been identified: the proposed approach measures both privacy and utility, various distortion and perturbation methods can be compared (no matter how different), and an evaluation of the impact of data integrity attacks on perturbed data is possible.
Keywords:
data privacy; data perturbation; time-series perturbation; data mining; automotive systemsMSC:
68P271. Introduction
Time-series data collected from various sensor-rich systems (e.g., auto vehicles, wearable devices, industrial equipment) may not reveal tangible personal identifying information, such as name, physical address, or email addresses. However, such data may still reveal essential user-related information (e.g., geolocation, biometrics). For example, time-series data collected from automotive systems, wearable devices, or smart grids contain information that may lead to identifying the end-user [1,2,3]. Thus, sensitive information should be hidden before leaving the sensor-based device and reaching external data processing and analysis systems.
The state-of-the-art research proposes several time-series data perturbation algorithms capable of protecting sensitive data, while exposing useful data for aggregation and analysis purposes [3,4,5,6,7,8,9,10]. Furthermore, these algorithms aim to eliminate sensitive patterns that may lead to user identification, while introducing a minor utility loss for third-party processing systems. However, additional research is necessary to establish a proper (or desired) balance between data privacy and data utility.
This paper proposes a novel methodology for assessing the privacy and utility of time-series perturbation algorithms. It documents a systematic methodology to assess and compare existing data perturbation techniques from the perspective of data privacy and data utility.
The proposed technique is inspired by the cyber attack impact assessment (CAIA) methodology [11], an approach based on system dynamics research [12]. CAIA studies the behavior of complex physical processes in the presence and absence of deliberate or accidental interventions to evaluate cyber-assets’ significance in large-scale, hierarchical, and heterogeneous installations. The impact of the interventions on the system is measured, and decisions involving response adjustments are taken.
Our proposed approach considers a data protection system (from sensors to the perturbation method) similar to a physical process. It measures the impact of various user behavior (normal and sensitive) and data interventions on the time-series perturbation system, and evaluates the utility and privacy of the resulting perturbed data. Furthermore, the computed impact compares various perturbation algorithms and additionally identifies perturbation methods that preserve information on data interventions (e.g., from data integrity attacks). The approach is validated using real data captured from a VW Passat vehicle via the on board diagnostics 2 (OBD-II) port.
We consider the present work to be complementary to previous studies on measuring the utility and privacy of perturbation methods. Previous studies on time-series data perturbation techniques [3,8,9,13,14] focused on demonstrating their performance using specific datasets and conveniently selected parameters. However, more general approaches are necessary for enabling data perturbation on a large scale and for miscellaneous sensor-based data-collection scenarios.
The objectives of the current research were to: (i) define a testing procedure for measuring the data privacy and data utility provided by time series perturbation methods in the case of normal and sensitive behavior, as well as in the case of data interventions (attacks); (ii) describe an algorithm to compare two perturbation mechanisms; and (iii) propose a procedure to identify the types of attacks that can be detected after applying a specific perturbation mechanism.
Our main contributions are the following:
- A systematic procedure for evaluating the utility and privacy of perturbation algorithms. The approach is sensor-type-independent, algorithm-independent, and data-independent.
- A methodology for comparing data perturbation methods.
- We demonstrate applicability by assessing the impact of data integrity attacks on perturbed data.
- We analyze the approach on actual driving data and build the dataset following the stated requirements.
The remainder of the paper is organized as follows: Section 2 provides an overview of perturbation techniques of interest, explains our choices for the privacy and utility metrics, and briefly presents the CAIA methodology that inspired our research. The proposed approach is presented in Section 3. The experimental results are documented in Section 4, discussed in Section 5, and the conclusions are formulated in Section 6.
2. Background and Related Work
2.1. Time-Series Data Privacy Techniques
Time-series data collected continuously from selected data sources (e.g., sensors) are often regarded as time-domain signals. The signal characteristics (amplitude, average, peak and trough, trend, and periodicity) may reveal user-related patterns, and, as they represent private information, they should be subject to protection. Moreover, time-series data protection must consider both time and frequency domains.
Various techniques have been proposed to protect the privacy of potentially sensitive sensor data streams when transmitted over the Internet to third-party processing systems. The protection of private information from time-series sensor data is mainly achieved using encryption, de-identification, and perturbation [15]. Encryption is a standard privacy approach for protecting data from unauthorized access [16]. However, due to processing power constraints, encryption may be challenging to implement in sensor-based systems. Additionally, encryption methods assume that the entities that handle the personal information are trustworthy [17]. Anonymization (also called sanitation [18] or de-identification) consists of deleting, replacing, or hashing all the personally identifiable information (PII) within a dataset. This process does not reduce the data quality, and anonymized data can be safely transported over the Internet. Popular approaches for data anonymization include k-anonymity [19], l-diversity [20], and t-closeness [21]. However, anonymization is difficult to enforce on time-series data that do not contain explicit personal information.
Perturbation or random perturbation, the method of interest for the paper at hand, is a well-known approach for protecting time-series private data. It partially hides information, while maintaining the possibility of information extraction through data-mining techniques. The main advantage of perturbation is that it does not require additional knowledge of the data to be protected. Moreover, the computational complexity of the perturbation is low [18]. Data perturbation techniques include randomization-based methods (additive perturbation [4], multiplicative perturbation [5,6], geometric perturbation [6], nonlinear perturbation [22], differential privacy (DP) [23]) and transformation-based methods [3,7,8,9,10] (collected values are first translated from the original feature space into a lower-dimensional feature space where noise is added). Whether the perturbation preserves the essential characteristics of the data depends on (i) how much perturbation is added (i.e., in differential privacy) and (ii) how the perturbation is added. Generally, the perturbation amount is predefined by the user.
Differential privacy (DP) or -differential privacy [24] is a widely accepted technique for implementing perturbation-based privacy protection, including for deep learning approaches [25]. Classical techniques (such as anonymization or aggregation) have been the subject of various privacy attacks, and even more so, modern techniques (such as k-anonymity [19]) have failed to protect data from certain types of attacks. Differential privacy protects data by adding a selected amount of noise to the original data using various mathematical algorithms (e.g., Laplace, Gaussian). Differential privacy, initially proposed to protect database queries, guarantees that changing the value of a single record has minimal effect on the statistical output of results [13]. However, obtaining the desired trade-off between privacy and accuracy may be challenging for time series, and it may reduce data utility [15,26].
2.2. Privacy and Utility Metrics for Data Perturbation
Data perturbation involves adding noise to data. The more noise is added, the more data privacy is achieved, and consequently, the more data is hidden, thus also reducing data utility. Many perturbation mechanisms, and, more precisely, those that use data transformation, do not only add noise, but also use other parameters for implementing privacy. Consequently, finding the proper perturbation is not only a matter of increasing or decreasing noise. Several methods for computing these parameters have been proposed [3,9,13], with limited success. In a recent survey, Dwork et al. [27], while referring to finding the optimum privacy budget for differential privacy-based algorithms, stated that there is no clear consensus on choosing privacy parameters for a practical scenario. Thus, to the best of our knowledge, this issue remains an open question.
After applying a perturbation mechanism, the usefulness of the resulting data needs to be measured to ensure that sufficient information is preserved for data analysis and other types of data processing (e.g., anomaly or tampering detection [14,28,29,30]). Utility metrics are essential to data analysts and data-processing applications. There is no universally accepted definition for data utility related to privacy mechanisms (i.e., differential privacy approach). However, generally speaking, data utility or usefulness is measured by the extent to which the chosen data privacy approach preserves aggregate statistical information [18].
Two main aspects are considered when measuring privacy and utility [6]: the privacy loss (PL) and the information loss (IL). Privacy loss measures the capacity of an attacker to extract relevant information about the original data from the perturbed data. In contrast, information loss measures the reduction in the statistical utility of the perturbed data compared to the original data. Therefore, the ideal approaches minimize privacy loss (maximize perturbation) and the loss of information (maximize utility).
The state-of-the-art literature lists several common metrics for measuring information loss (utility), such as variance [31,32], mean relative error (MRE) [33,34], mean squared error (MSE) [35] and mean absolute error (MAE) [13,36]. For all, a lower value implies better utility. To validate the proposed approach, we chose to compute the mean absolute error (MAE) to measure the utility (Equation (1)), a metric often utilized for comparing time-series perturbation methods [13,37]:
where N is the length of the time series, X is the original data vector, and is the perturbed data.
For quantifying privacy loss, three main approaches have been proposed in the literature [7]: measuring how closely the original values of a perturbed attribute can be estimated [4,13], using information theory [38], or, using the notion of privacy breach [39]. For our research, we calculate the probability density function (PDF) of queries executed on perturbed data and compute the probability of obtaining the original value (computed from the unperturbed data) from perturbed data. The lower the probability, the better the data privacy.
As previously shown, the scientific literature provides a rich palette of perturbation algorithms for time-series data and many metrics for measuring their performance. Despite the extensive research, currently, there needs to be a standardized approach for comparing these perturbation methods. The approach outlined in this paper stands out from previous works in the following ways: First, to the best of our knowledge, the presented procedure is the first approach to simultaneously measure both the privacy provided by the perturbation and the utility of the resulting data. Second, the comparison framework (including data generation) can be applied to diverse perturbation techniques without prior knowledge of the implemented algorithms. We note, however, that the methodology presented in this paper may be perceived as supplementary to the prevailing data privacy and utility metrics.
2.3. Cyber Attack Impact Assessment (CAIA) Methodology
The cyber attack impact assessment (CAIA) [11] builds on the behavioral analysis of physical processes proposed by Ford [12]. Additionally, the sensitivity assessment approach of Huang et al. [40] computes the relative variance between model behavior in the activated and deactivated control loop cases. Control loops rely on observed variables and cause changes to the physical process state via control variables. The objective of the sensitivity assessment is to quantify the contribution of the control loop to the behavior of a certain variable of interest.
The CAIA methodology computes the covariance of the observed variables before and after the execution of a specific intervention involving the control variables. Metrics quantify the impact of deliberate interventions on the control variables. The cross-covariance values, comprising the impact matrix, are computed between the observed variable with no intervention and the observed variable with intervention on the control variable. The impact matrix provides useful information on (i) the impact of cyber attacks on the studied system, (ii) the propagation of disturbances to remote assets, and (iii) equally significant observed variables.
3. Proposed Approach
The proposed methodology is inspired by research in system dynamics, sensitivity analysis, and the CAIA framework. The perturbation method is modeled as a dynamic system, and the perturbation is first analyzed in the absence and the presence of sensitive user behavior. The main symbols used throughout this research are described in Table 1.
3.1. Perturbation System Architecture and Design Consideration
Sensor data can either be protected by performing the perturbation locally, on the system that gathers the data, or to a remote system by securely transferring the data from the data source to the third-party processing systems. However, due to recent regulations, which explicitly stipulate that “wherever possible, use processes that do not involve personal data or transferring personal data outside of the vehicle (i.e., the data is processed internally)” [41], the local perturbation is preferred (see Figure 1).
Implementing a protection system for time-series data involves choosing the perturbation method, taking into account data and equipment restrictions, such as:
- the type of data leaving the system and the potentially sensitive information they carry;
- the amount of information to be hidden considering possible sensitive information or other external factors;
- utility restrictions (how much information about the data should still be available after perturbation);
- the processing power of the equipment.
Because many data protection mechanisms have been proposed and implemented during the last decade, choosing the most suitable one is challenging. Consequently, the main purpose of this research is to make such decisions simpler.
3.2. Formal Description
Consider time-series data X, collected from a sensor at time instants for one observed variable (time series attribute), a vector containing measurements corresponding to regular (typical) user behavior , corresponding to sensitive behavior , corresponding to any type of regular or sensitive behavior (, and ), corresponding to data intervention . Moreover, consider the standard deviation of X, the feasible interval of minimum and maximum standard deviations (available from the sensor specifications), the standard deviation of a regular (typical) user behavior, the standard deviation interval corresponding to regular behavior, the standard deviation of a sensitive behavior, and the standard deviation of a data intervention.
Definition 1.
Time-series data X, collected by a sensor, contains information associated with regular behavior if its standard deviation is in the interval of regular operation, .
The interval of regular operation is obtained by computing the standard deviation for several time-series data collected during what is subjectively considered the typical operation of the device or equipment.
Definition 2.
Time-series data X, collected by a sensor, contains information associated with sensitive behavior (user-specific information) of the system user if the standard deviation of X, , is outside the regular operation interval, or .
From the privacy point of view, sensitive behavior corresponds to patterns that may lead to user identification or the identification of specific user behavior (e.g., aggressive driver behavior, nervous tics). Thus, such patterns should be recognized and protected by the perturbation system.
Data interventions are conducted either by altering the sensor or injecting erroneous data before the perturbation process occurs (see Figure 1) and, in this research, we associate them with integrity data attacks (e.g., pulse attacks, scaling attacks, random attacks). From the utility point of view, the information that may lead to an attack or anomaly detection should be maintained after data perturbation. The working hypotheses are that the impact of intervention data is more significant than the impact of the sensitive behavior data and that the impact of sensitive behavior data is higher, but reasonably close to, the regular behavior.
Definition 3.
An intervention is an intentional modification of the collected time-series data X, such that the standard deviation of X during the attack () is greater than the standard deviation of all collected sensitive behavior data, or it is smaller than the standard variation of all collected sensitive behavior data, .
Consider a perturbation mechanism that protects information from , , while maintaining the possibility of partial information extraction through data-mining techniques such that:
Let denote the reference data of regular operation, called landmark regular behavior, the measurement of the observed variable for the b behavior data, and the perturbation of .
The mean of the observed values for the behavior b is defined by:
Further, let be the impact that behavior b has on the observed variable of the perturbation system, computed as the cross-covariance between the perturbed landmark regular behavior and the collected behavior data b:
The impact (Equation (4)) is a measure of how much the output of the system deviates from regular behavior.
The relative impact of a behavior b on the observed variable is defined as:
As any perturbation method introduces a certain degree of uncertainty due to the added noise, the mean relative impact is used to quantify the impact of interventions under uncertainty:
where P is the number of times perturbation is performed, i.e., and are computed. The larger the P, the more accurate the relative impact.
Definition 4.
Let be a perturbation mechanism that takes as input time-series data , , corresponding to a regular or sensitive behavior, such that , and let be a real positive number. satisfies -behavior-privacy for the observed variable if it holds that:
where is the behavior-privacy parameter. Definition 4 imposes that the relative impact on the perturbed data of any behavior should be less than a pre-defined value, , for the observed variable. The behavior-privacy parameter in Equation (7) defines the desired level of privacy and it should be as small as possible for high data protection. In the case when the mean relative impact of a behavior data value b is higher than , we conclude that the perturbation method does not provide sufficient protection, meaning that it does not hide enough information (sensitive patterns can be detected).
Definition 5.
Let be a perturbation mechanism that takes as input time-series data , , corresponding to a regular or sensitive behavior, such that , and let be a real positive number. satisfies -behavior-utility for the observed variable if it holds that:
where is the behavior-utility parameter. Definition 5 states the condition to be met by the perturbation mechanism on any behavior data such that the perturbed result is useful. The behavior-utility parameter in Equation (8) defines the desired level of utility, and it should be as large as possible for high data utility. When the mean relative impact of a behavior data value b is lower than , we conclude that the perturbation method does not provide sufficient utility, meaning that it hides too much information.
An ideal perturbation mechanism for the observed variable satisfies both -behavior-privacy and -behavior utility conditions, such that the mean relative impact of any behavior b is in the interval , .
3.3. Comparing Perturbation Methods
Consider and , two perturbation mechanisms that satisfy -behavior-privacy and -behavior-utility with the targeted and , the behavior-utility parameter and behavior-privacy parameter, respectively.
Definition 6.
For the perturbation methods and we define the following privacy-utility operators:
- : if provides higher utility than ;
- : if provides higher privacy than ;
- : if provides higher utility than and provides higher privacy than .
Next, consider the landmark regular operation data, , a sensitive behavior data , , , , . Then, the mean relative impact is defined in Equations (9) and (10) as:
and
Let us denote and .
Proposition 1.
If , for any sensitive behavior s, then .
Proof.
For , . As and satisfy α-behavior-privacy and α-behavior-utility, . If then . Consequently, the impact that any sensitive behavior s has on data perturbed with is higher than the impact of at least one sensitive behavior s on data perturbed with ; thus, more information about the sensitive behavior is maintained in the data perturbed with for all , providing higher overall data utility. Then, according to Definition 6, . □
Proposition 2.
If , for any sensitive behavior s, then .
Proof.
For , . and satisfy α-behavior-privacy and α-behavior-utility; thus, . If then . The impact that any sensitive behavior s has on perturbed data with is smaller than the impact of at least one sensitive behavior s on data perturbed with . Consequently, less information about the sensitive behavior is held in the data perturbed with for all , providing higher overall data privacy. Then, according to Definition 6, . □
Proposition 3.
If and , for any sensitive behavior s, then .
Proof.
According to Proposition 1, if then , meaning that provides higher utility than . If then (from Proposition 2), meaning that provides higher privacy than . Then, according to Definition 6, . □
Taking into account Propositions 1–3, we propose the methodology described in Algorithm 1 for comparing two perturbation methods and .
Before applying Algorithm 1, data preparation is required. Firstly, we describe the regular user behavior for the tested system, collect regular behavior data, compute standard deviations for all data, and find the interval of regular operation . Then, we choose the landmark regular behavior, , selected from the collected regular behavior data such that the standard deviation is the closest to . Thirdly, we collect sensitive behavior data, . The constituent steps are also illustrated in Figure 2.
| Algorithm 1: Comparison of Perturbation Methods |
 |
3.4. Evaluation of the Utility of a Perturbation Method in Case of Data Interventions
External entities can alter sensor data, for instance, by modifying the sensor or changing the data after it is collected. Therefore, monitoring data interventions is essential for maintaining data integrity and detecting anomalies or attacks. We evaluate the impact data interventions have on the perturbed data and estimate the resulting data’s utility. Maintaining enough information after perturbation to detect anomalies/attacks is expected from the utility point of view. Our research focuses on a type of data intervention called an integrity attack, which consists of modifying data after it is collected using predefined patterns.
Consider A the set of possible data interventions. Let an intervention (attack) data , , be the input of a perturbation method . Let be the perturbed values, , and compute the mean relative impact of on the perturbed data for an observed variable as:
Denote and , .
Proposition 4.
If satisfies the condition:
then preserves the intervention information such that the perturbed data is useful for detecting data intervention a, .
Proof.
For and , . If . Then, the mean relative impact of a data intervention a, , is higher than the mean relative impact of any behavior b (regular or sensitive). Thus, the perturbed data resulted from applying on a preserves information about the intervention/attack, maintaining data utility. □
The consequence of Proposition 4 is that, if the impact of an intervention (attack) is higher than the impact of all defined sensitive behavior data, then the perturbed data is useful from the point of view of the attack or anomaly detection.
The proposed approach for evaluating the utility of a perturbation method in case of interventions is described in Algorithm 2. The same data preparation is necessary as in the case of Algorithm 1. Additionally, data intervention , , is collected. If the result of the evaluation is positive, then the perturbation method provides utility for the considered intervention data. Otherwise, the usefulness of the perturbation method is low or uncertain.
| Algorithm 2: Intervention Impact on Perturbed Data Algorithm |
 |
4. Experimental Results
The proposed framework is evaluated from several perspectives. Beforehand, the approach to collecting and generating the necessary data is described. Next, several standard perturbation methods are compared using the impact coefficients and the proposed algorithm for univariate time series. Finally, the method’s applicability is showcased for identifying the possibility of perturbation methods to detect specific types of integrity attacks. We consider the ability of the perturbation method to maintain information about the intervention as a measure of its utility.
The proposed framework is evaluated in the context of three time series distortion algorithms that leverage the discrete Fourier transform (DFT) as the transformation method: (i) a primary distortion method that consists of transforming the data in the frequency domain and filtering the first k coefficients (method denoted within this article as filtered FFT) and that does not introduce any noise perturbation (we use it for emphasizing the validity of the proposed method), (ii) the compressible perturbation algorithm (CPA) [8], based on the Fourier representation of the time series, it adds noise to a fraction of the frequencies, and (iii) the Fourier perturbation algorithm (FPA) [9], the first differentially private (DP) approach that offers practical utility for time-series data. The CPA and FPA algorithms are widely accepted as classical perturbation methods with many applications and variants. Thus, by demonstrating the validity of the proposed approach to these algorithms, we expect to have the framework’s utility applied to other similar perturbation techniques.
4.1. Data Collection and Intervention Generation
The first step in using the proposed framework is collecting data for both regular and sensitive behavior. Further, interventions are generated by simulating various integrity attacks based on regular behavior data.
This research uses data extracted from in-vehicle CAN data. Data was collected via the on board diagnostics 2 (OBD-II) port on a VW Passat vehicle using the OBD Fusion mobile app. Data were recorded every 1 second during driving, and 136 features were extracted through the OBD-II port. All driving data (regular behavior and sensitive behavior) were collected on the same route in similar traffic conditions.
The dataset preparation consists of the following steps:
- Step 1: Collect several normal behavior time-series data, compute the standard deviation for each one, and identify , the interval of minimum and maximum standard deviation possible for normal behavior.
- Step 2: Choose the landmark normal behavior (), the data further used for computing impact coefficients and for attack generation. For instance, choose the normal behavior that has the standard deviation closest to the middle of the interval.
- Step 3: Identify possible sensitive behaviors and collect the corresponding data. The collected data qualifies as sensitive behavior if its standard deviation is outside the interval , according to Definition 2.
Intervention data is generated from the landmark regular behavior by simulating four integrity attacks commonly utilized in the literature for security studies [42,43], plus the step attack that can be associated with a defective sensor. The list of interventions is not aimed to be exhaustive, but is provided to showcase the methodology in the context of possible attack scenarios. Given the attack interval , the following types of attacks on time-series data are considered:
- Pulse attack: In this case the altered value is obtained by dividing the value of the attribute j at time t, , by an attack parameter : with t in the attack interval ;
- Scaling attack: The value is scaled by attack parameter : , for ;
- Ramp attack: This type of attack adds values from a ramp function , for , where ;
- Random attack: Here, a random value selected from a uniform distribution interval is added: , for ;
- Step attack: This attack involves setting values to the attack parameter is added: , for .
Figure 3 displays a sample of the collected data, and the generated intervention data are illustrated in Figure 4. Interventions fulfill Definition 3 that states that the standard deviation of intervention data a is higher than the standard deviation of all defined sensitive behavior data s. Table 2 explains how sensitive behavior and attacks are generated and lists their corresponding standard deviations ().
4.2. Experiments
4.2.1. Compare Perturbation Methods
Auto vehicles, as well as many devices or industrial equipment, are enhanced with a large number of sensors. Only a fraction of the observed variable data collected from those sensors is sent to third-party processors. One or more collected or computed values are transmitted and must be protected.
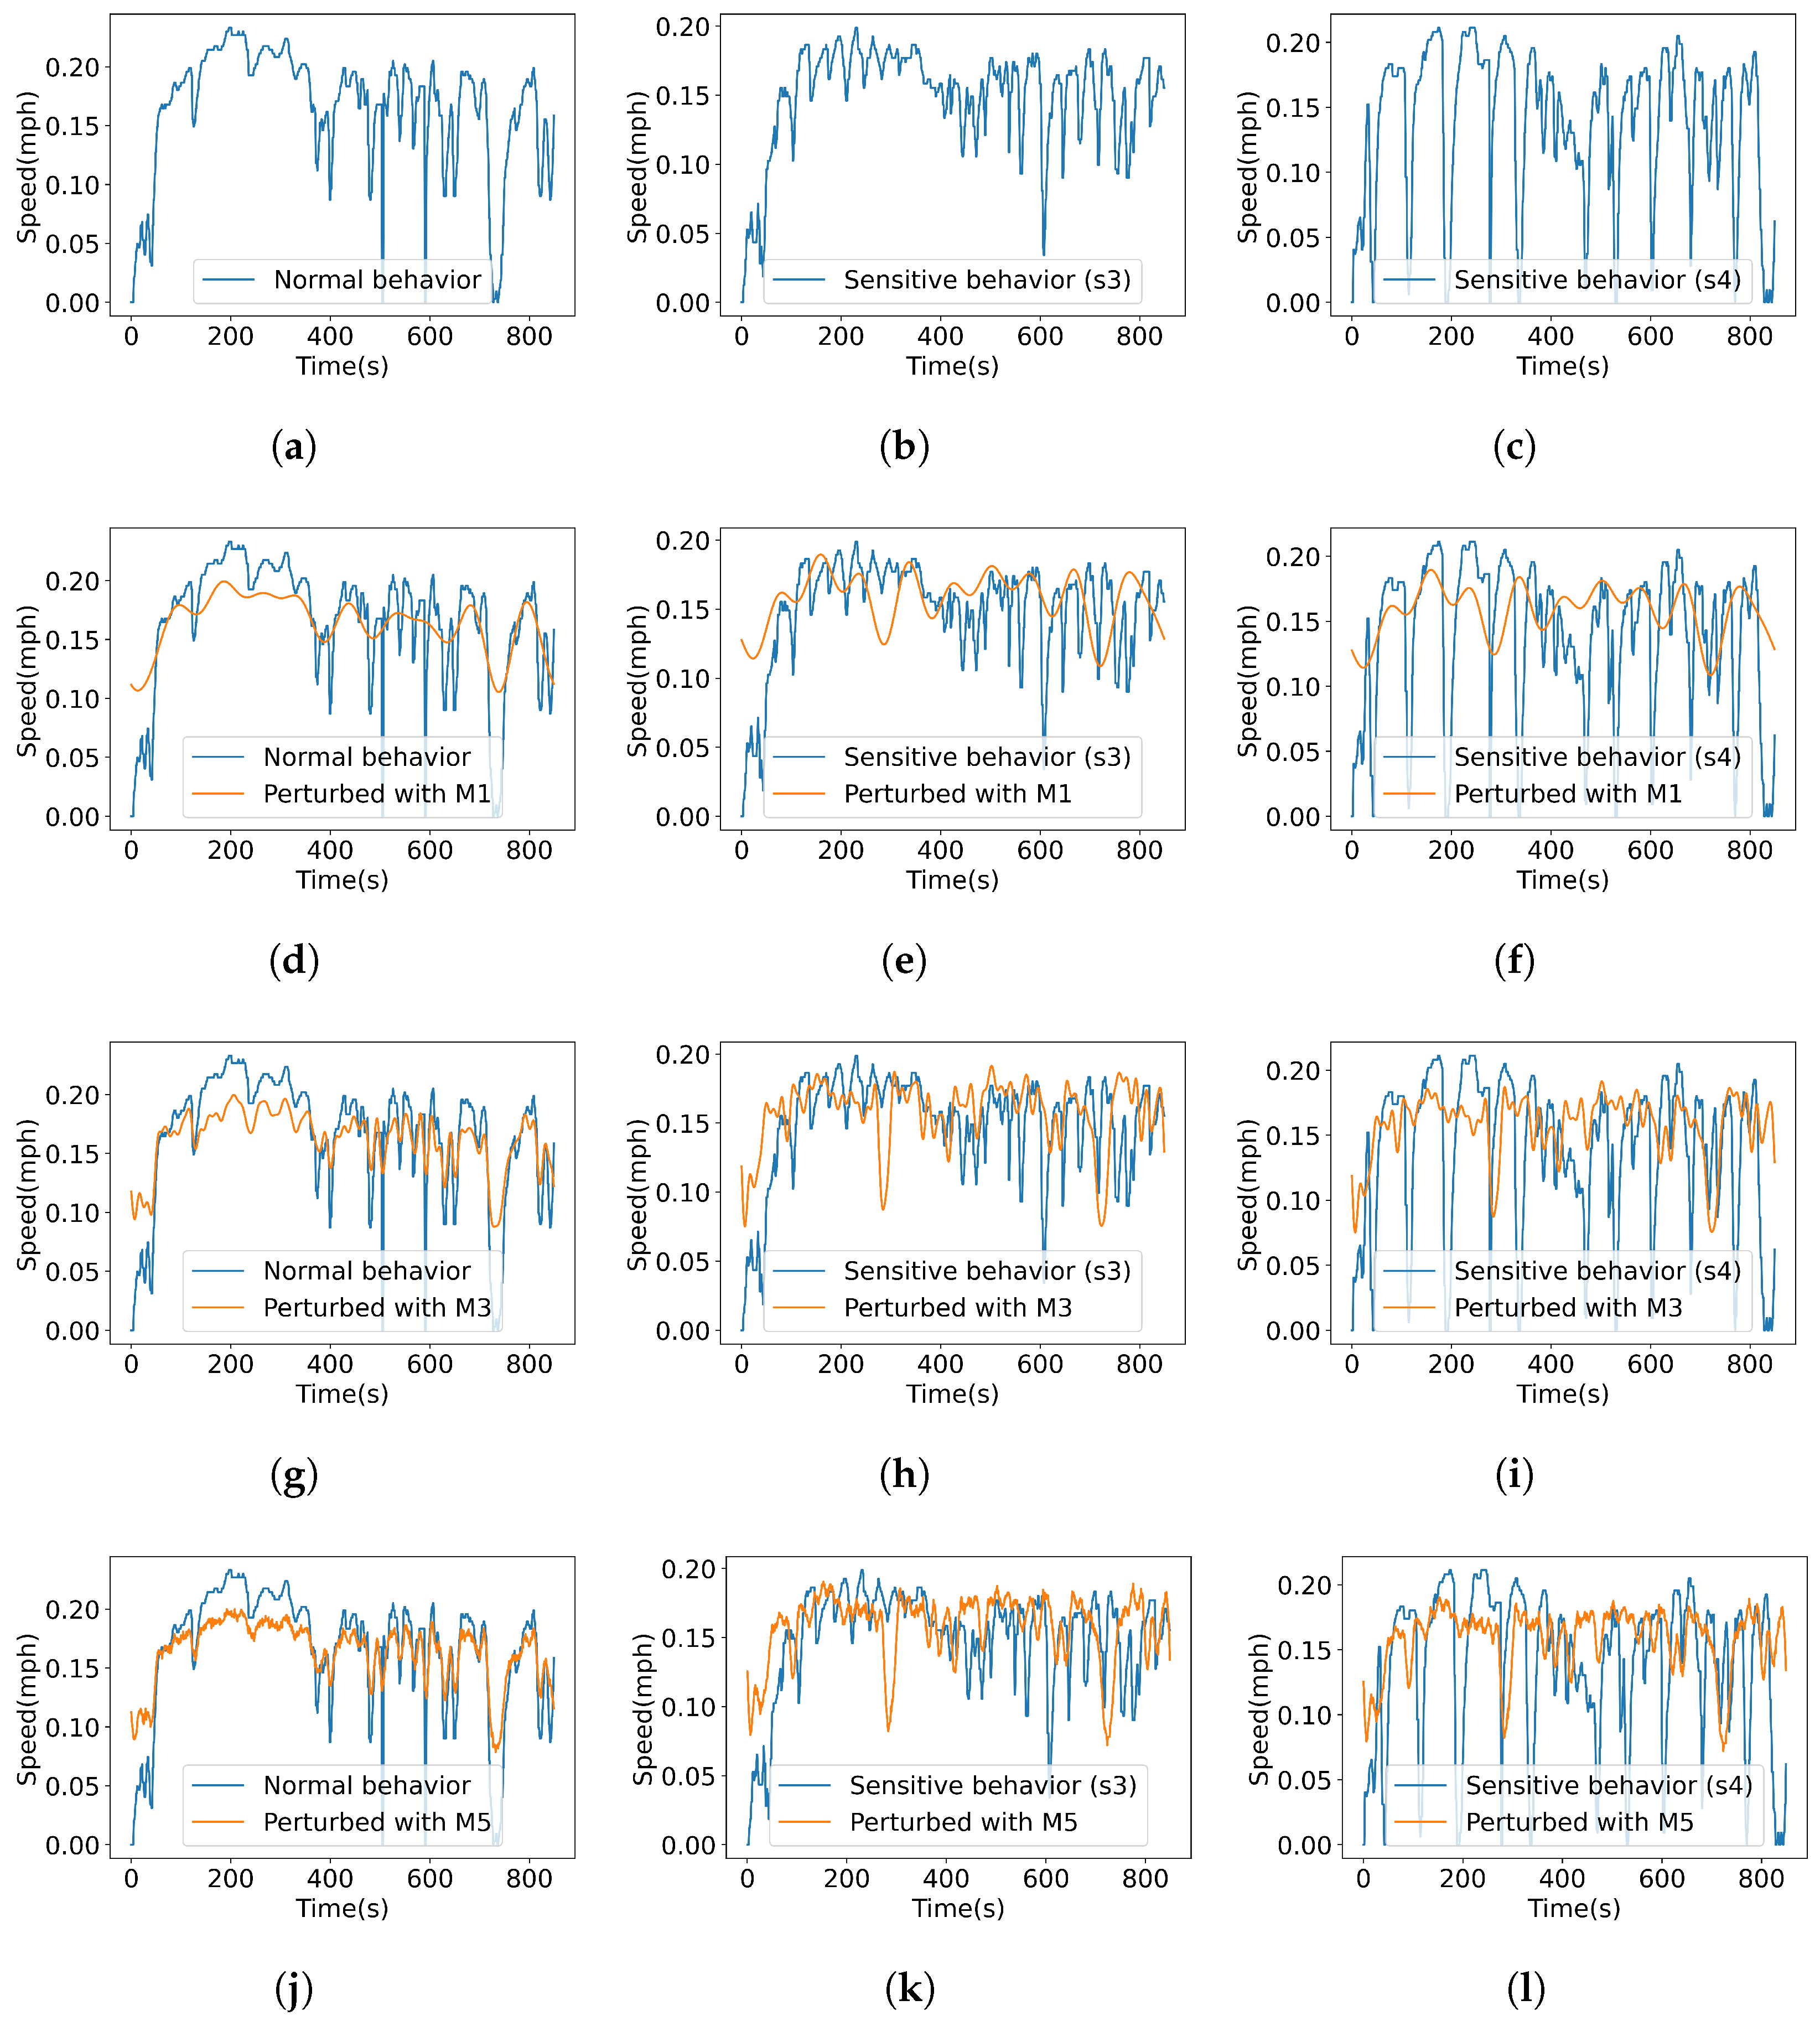
To demonstrate the usage of the proposed approach, firstly consider a univariate time series consisting of the vehicle speed observed variable. According to the procedure described in Section 3.3, the regular and sensitive behavior time series are perturbed by applying selected distortion methods described in Table 3. Figure 5 presents a sample of the perturbed data.
The perturbation is applied for all tested algorithms for each behavior data value, and the relative impact (Equation (5)) is computed. Finally, the process is repeated a significant number of times (e.g., larger than 100), and the mean relative impact is obtained (Equation (6)). Table 4 summarizes the computed impact selected sensitive behavior has on various perturbation systems, and Figure 6a illustrates the minimum and maximum impact coefficients for all perturbation methods (highlighted in Table 4).
Furthermore, we investigate the proposed approach’s utility in the case of multiple observed variables data. We selected more data attributes (instant fuel consumption, CO flow, and magnetometer X) from the collected dataset, besides the already presented vehicle speed observed variable, and computed their mean relative impact coefficients (illustrated in Figure 7).
4.2.2. Evaluate the Utility of a Perturbation Module for Detecting Data Interventions/Attacks
Section 3.4 describes the procedure to evaluate the utility provided by data resulting from the considered perturbation methods in case of data intervention. Consider the integrity attacks presented in Table 2 and apply the proposed approach for computing the impact of attacks on normal behavior data. Table 5 lists the mean relative impact coefficients (Equation (11)) for all integrity attacks and all tested perturbation methods. For all methods, and are extracted from Table 4.
5. Discussion
This paper proposes a comparison approach that identifies the minimum and maximum relative mean impact for each perturbation method. A suitable perturbation method is identified if it simultaneously holds the highest minimum and lowest maximum impact coefficients.
For one observed variable (vehicle speed), the computed minimum and maximum impact coefficients , for all tested perturbation methods, are listed in Table 4 and illustrated in Figure 6a. As observed, the perturbation method holds both the highest minimum impact () and the smallest maximum impact (). Based on Propositions 1–3, we conclude that provides the best privacy and utility from the tested algorithms, for the considered dataset, and the proposed sensitive behaviors. Perturbation also provides good privacy and utility with impact coefficients close to those computed for and it may be considered an alternative for .
The result is validated from the utility point of view by computing the mean absolute error (MAE) utility metric between the not perturbed sensitive behavior data and the perturbed version for each perturbation method (Table 6). Figure 6b highlights perturbation methods and as the ones that provide the smallest information loss.
For measuring the privacy provided by the tested perturbation methods, we calculated the probability distribution function (PDF) of queries executed on perturbed data and computed the probability to obtain the actual query result from the original data (Table 7). Figure 6c shows the mean probability for all sensitive behaviors computed from PDFs generated from 1000 queries. The smaller the probability, the higher the privacy, as more information is hidden. Again, the computed probabilities emphasize the perturbation methods and as the ones providing the best privacy protection.
In addition, we tested the proposed framework for more observed variables with the objective of finding the best perturbation method that can be applied to all variables. Figure 7 illustrates the computed mean relative impact coefficients for attributes instant fuel consumption, CO flow, and magnetometer X. According to the stated requirements, the perturbation method holds the highest minimum and lowest maximum impact coefficients for all variables, thus providing the best utility and privacy for the described scenario. Moreover, the result is confirmed from the utility and privacy points of view. Figure 8 shows that has the minimum information loss (MAE) from all tested perturbation methods, and, moreover, the lowest maximum probability of the real query result (lower probability is better).
Further, we investigated the possibility of using the mean relative impact coefficients (Equation (11)) for detecting data integrity attacks. Based on Proposition 4, data from Table 5 indicate that all data protection methods hide important information about the attacks. Attack detection may be possible but challenging for most perturbation methods, as the impact is similar to those of sensitive behaviors. As the impact coefficients for method are all smaller than the corresponding impact coefficients calculated for sensitive behavior, we conclude that hides essential information about the attacks. Thus, cannot be regarded as a suitable privacy protection method when attack or anomaly detection is an objective. In the case of , several attacks ( and ) may be detected according to the proposed criteria, and the impact of the other attacks (, , and ) is also significant.
We demonstrated that the proposed methodology could be used to measure the utility and privacy of various perturbation algorithms, and the following advantages have been identified:
- Compared to the other mechanisms, the proposed approach measures both privacy and utility;
- Various distortion and perturbation methods can be compared, no matter how different they are;
- An evaluation of the impact of various data integrity attacks on perturbed data is possible.
However, a few observations on its limitations are necessary. Firstly, the accuracy of the evaluation depends on the set of collected normal behavior time series and the set of defined sensitive behaviors. The more accurately they cover the possible sensitive behaviors, the more accurate the comparison is.
Secondly, the experiments have shown that the proposed approach may only be able to identify a suitable perturbation method for some observed variables. For example, certain algorithms provide high privacy for some variables but lack utility or vice versa.
Additionally, when more observed variables are evaluated, it is possible to identify desired perturbation methods depending on the variable. This can be anticipated as the impact of sensitive behavior or intervention may not be the same on all variables. In this case, we propose an improvement to the perturbation system illustrated in Figure 1: Instead of using a perturbation method for all observed variables, add several perturbation methods and assign variables to the ones implementing the best privacy and utility (see Figure 9).
The approach proposed for comparing various perturbation methods on time-series data can be expanded to evaluate the utility of the perturbed data in the case of data interventions (e.g., integrity attacks). The computed impact coefficients show how much information about the intervention is hidden or preserved after perturbation. However, more research is necessary to test various attacks and anomaly detection techniques and assess their performance on perturbed data.
6. Conclusions
This paper addressed a new approach for measuring the privacy and utility provided by time-series perturbation algorithms. The main novelty and contribution to the state of the art is the exposed procedure for comparing various perturbation methods. The framework involved collecting data corresponding to sensitive behavior and measuring the impact this behavior had on the perturbation system. As shown, the presented metrics were helpful for simultaneously measuring the privacy and utility of the perturbed data. The research contribution is meaningful for those protecting time-series data collected from various sensors, as the approach is sensor-type-independent, algorithm-independent, and data-independent.
The experiments demonstrated that the approach had significant benefits. It could be applied to diverse perturbation algorithms and on various data, under the condition that sensitive behavior could be defined and corresponding data could be collected. Moreover, the research suggested evaluating the impact of integrity data attacks on perturbed data. Data was collected via the OBD-II port on a VW Passat auto vehicle for both regular/typical and sensitive behavior. The experiments showed that the approach was also promising in measuring the impact of sensitive behavior on the perturbed data regarding privacy and utility. Furthermore, by exemplifying the approach on two classical perturbation algorithms, we expect our method to be applied to other perturbation techniques.
In future work, we intend to test the proposed method on publicly available datasets and on more diverse perturbation algorithms. A key challenge will be the detection of sensitive user behavior on such data. As a result, further adjustments to the presented approach may be required. Lastly, additional evaluation of the impact of integrity attacks on perturbed data and, consequently, the impact on the accuracy of the anomaly and attack detection algorithms will be included in future research work.
Author Contributions
Conceptualization, A.-S.R.; data curation, A.-S.R.; formal analysis, A.-S.R.; investigation, A.-S.R.; methodology, A.-S.R.; project administration, A.-S.R.; resources, A.-S.R.; software, A.-S.R.; supervision, A.-S.R.; validation, A.-S.R.; visualization, A.-S.R.; writing—original draft, A.-S.R.; writing—review and editing, A.-S.R. All authors have read and agreed to the published version of the manuscript.
Funding
The article processing charge (APC) was funded by the Institution Organizing University Doctoral Studies (I.O.S.U.D.), The Doctoral School of Letters, Humanities and Applied Sciences, George Emil Palade University of Medicine, Pharmacy, Science, and Technology of Targu Mures, 540139 Targu Mures, Romania.
Data Availability Statement
The data that support the findings of this study are openly available at https://github.com/aromanrsc/driving-ds (accessed on 31 January 2023).
Conflicts of Interest
The authors declare no conflict of interest.
References
- Hallac, D.; Sharang, A.; Stahlmann, R.; Lamprecht, A.; Huber, M.; Roehder, M.; Leskovec, J. Driver identification using automobile sensor data from a single turn. In Proceedings of the 2016 IEEE 19th International Conference on Intelligent Transportation Systems (ITSC), Rio de Janeiro, Brazil, 1–4 November 2016; IEEE: New York, NY, USA, 2016; pp. 953–958. [Google Scholar]
- Mekruksavanich, S.; Jitpattanakul, A. Biometric user identification based on human activity recognition using wearable sensors: An experiment using deep learning models. Electronics 2021, 10, 308. [Google Scholar] [CrossRef]
- Lako, F.L.; Lajoie-Mazenc, P.; Laurent, M. Privacy-Preserving Publication of Time-Series Data in Smart Grid. Secur. Commun. Netw. 2021, 2021, 6643566. [Google Scholar]
- Agrawal, R.; Srikant, R. Privacy-Preserving Data Mining. In Proceedings of the 2000 ACM SIGMOD International Conference on Management of Data, Dallas, TX, USA, 15–18 May 2000; Association for Computing Machinery: New York, NY, USA, 2000; pp. 439–450. [Google Scholar] [CrossRef]
- Bingham, E.; Mannila, H. Random Projection in Dimensionality Reduction: Applications to Image and Text Data. In Proceedings of the Seventh ACM SIGKDD International Conference on Knowledge Discovery and Data Mining, San Francisco, CA, USA, 26–29 August 2001; Association for Computing Machinery: New York, NY, USA, 2001; pp. 245–250. [Google Scholar] [CrossRef]
- Chen, K.; Liu, L. Privacy preserving data classification with rotation perturbation. In Proceedings of the Fifth IEEE International Conference on Data Mining (ICDM’05), Houston, TX, USA, 27–30 November 2005; p. 4. [Google Scholar] [CrossRef]
- Mukherjee, S.; Chen, Z.; Gangopadhyay, A. A privacy-preserving technique for Euclidean distance-based mining algorithms using Fourier-related transforms. VLDB J. 2006, 15, 293–315. [Google Scholar] [CrossRef]
- Papadimitriou, S.; Li, F.; Kollios, G.; Yu, P.S. Time Series Compressibility and Privacy. In Proceedings of the 33rd International Conference on Very Large Data Bases—VLDB Endowment, Vienna, Austria, 23–27 September 2007; pp. 459–470. [Google Scholar]
- Rastogi, V.; Nath, S. Differentially Private Aggregation of Distributed Time-Series with Transformation and Encryption. In Proceedings of the 2010 ACM SIGMOD International Conference on Management of Data, Indianapolis, IN, USA, 6–10 June 2010; pp. 735–746. [Google Scholar]
- Lyu, L.; He, X.; Law, Y.W.; Palaniswami, M. Privacy-Preserving Collaborative Deep Learning with Application to Human Activity Recognition. In Proceedings of the 2017 ACM on Conference on Information and Knowledge Management, Singapore, 6–10 November 2017; pp. 1219–1228. [Google Scholar] [CrossRef]
- Genge, B.; Kiss, I.; Haller, P. A system dynamics approach for assessing the impact of cyber attacks on critical infrastructures. Int. J. Crit. Infrastruct. Prot. 2015, 10, 3–17. [Google Scholar] [CrossRef]
- Ford, D.N. A behavioral approach to feedback loop dominance analysis. Syst. Dyn. Rev. J. Syst. Dyn. Soc. 1999, 15, 3–36. [Google Scholar] [CrossRef]
- Wang, H.; Xu, Z. CTS-DP: Publishing correlated time-series data via differential privacy. Knowl. Based Syst. 2017, 122, 167–179. [Google Scholar] [CrossRef]
- Roman, A.S.; Genge, B.; Duka, A.V.; Haller, P. Privacy-Preserving Tampering Detection in Automotive Systems. Electronics 2021, 10, 3161. [Google Scholar] [CrossRef]
- Hassan, M.U.; Rehmani, M.H.; Chen, J. Differential Privacy Techniques for Cyber Physical Systems: A Survey. IEEE Commun. Surv. Tutor. 2020, 22, 746–789. [Google Scholar] [CrossRef] [Green Version]
- Liu, X.; Zheng, Y.; Yi, X.; Nepal, S. Privacy-preserving collaborative analytics on medical time series data. IEEE Trans. Dependable Secur. Comput. 2020, 19, 1687–1702. [Google Scholar] [CrossRef]
- Katsomallos, M.; Tzompanaki, K.; Kotzinos, D. Privacy, space and time: A survey on privacy-preserving continuous data publishing. J. Spat. Inf. Sci. 2019, 2019, 57–103. [Google Scholar] [CrossRef]
- Wang, T.; Zheng, Z.; Rehmani, M.H.; Yao, S.; Huo, Z. Privacy Preservation in Big Data From the Communication Perspective—A Survey. IEEE Commun. Surv. Tutor. 2019, 21, 753–778. [Google Scholar] [CrossRef]
- Sweeney, L. k-Anonymity: A Model for Protecting Privacy. IEEE Secur. Priv. 2002, 10, 557–570. [Google Scholar] [CrossRef] [Green Version]
- Machanavajjhala, A.; Gehrke, J.; Kifer, D.; Venkitasubramaniam, M. L-Diversity: Privacy Beyond k-Anonymity. Acm Trans. Knowl. Discov. Data 2006, 1, 24. [Google Scholar]
- Li, N.; Li, T.; Venkatasubramanian, S. t-Closeness: Privacy Beyond k-Anonymity and l-Diversity. In Proceedings of the 2007 IEEE 23rd International Conference on Data Engineering, Istanbul, Turkey, 17–20 April 2007; Volume 2, pp. 106–115. [Google Scholar]
- Bhaduri, K.; Stefanski, M.D.; Srivastava, A.N. Privacy-Preserving Outlier Detection Through Random Nonlinear Data Distortion. IEEE Trans. Syst. Man Cybern. Part B 2011, 41, 260–272. [Google Scholar] [CrossRef] [PubMed] [Green Version]
- Dwork, C. Differential privacy: A survey of results. In Proceedings of the International Conference on Theory and Applications of Models of Computation, Xi’an, China, 25–29 April 2008; Springer: Berlin/Heidelberg, Germany, 2008; pp. 1–19. [Google Scholar]
- Dwork, C.; McSherry, F.; Nissim, K.; Smith, A. Calibrating noise to sensitivity in private data analysis. In Theory of Cryptography Conference; Springer: Berlin/Heidelberg, Germany, 2006; pp. 265–284. [Google Scholar]
- Arcolezi, H.H.; Couchot, J.F.; Renaud, D.; Al Bouna, B.; Xiao, X. Differentially private multivariate time series forecasting of aggregated human mobility with deep learning: Input or gradient perturbation? Neural Comput. Appl. 2022, 34, 13355–13369. [Google Scholar] [CrossRef]
- Wu, T.; Wang, X.; Qiao, S.; Xian, X.; Liu, Y.; Zhang, L. Small perturbations are enough: Adversarial attacks on time series prediction. Inf. Sci. 2022, 587, 794–812. [Google Scholar] [CrossRef]
- Dwork, C.; Kohli, N.; Mulligan, D. Differential privacy in practice: Expose your epsilons! J. Priv. Confid. 2019, 9, 1–22. [Google Scholar] [CrossRef] [Green Version]
- Yang, E.; Parvathy, V.S.; Selvi, P.P.; Shankar, K.; Seo, C.; Joshi, G.P.; Yi, O. Privacy Preservation in Edge Consumer Electronics by Combining Anomaly Detection with Dynamic Attribute-Based Re-Encryption. Mathematics 2020, 8, 1871. [Google Scholar] [CrossRef]
- De Canditiis, D.; De Feis, I. Anomaly detection in multichannel data using sparse representation in RADWT frames. Mathematics 2021, 9, 1288. [Google Scholar] [CrossRef]
- Bolboacă, R. Adaptive Ensemble Methods for Tampering Detection in Automotive Aftertreatment Systems. IEEE Access 2022, 10, 105497–105517. [Google Scholar] [CrossRef]
- Geng, Q.; Viswanath, P. The optimal noise-adding mechanism in differential privacy. IEEE Trans. Inf. Theory 2015, 62, 925–951. [Google Scholar] [CrossRef]
- Soria-Comas, J.; Domingo-Ferrer, J. Optimal data-independent noise for differential privacy. Inf. Sci. 2013, 250, 200–214. [Google Scholar] [CrossRef]
- Xiao, X.; Bender, G.; Hay, M.; Gehrke, J. iReduct: Differential privacy with reduced relative errors. In Proceedings of the 2011 ACM SIGMOD International Conference on Management of Data, Athens, Greece, 12–16 June 2011; pp. 229–240. [Google Scholar]
- Yang, X.; Ren, X.; Lin, J.; Yu, W. On binary decomposition based privacy-preserving aggregation schemes in real-time monitoring systems. IEEE Trans. Parallel Distrib. Syst. 2016, 27, 2967–2983. [Google Scholar] [CrossRef]
- Kellaris, G.; Papadopoulos, S. Practical differential privacy via grouping and smoothing. Proc. VLDB Endow. 2013, 6, 301–312. [Google Scholar] [CrossRef] [Green Version]
- Acs, G.; Castelluccia, C.; Chen, R. Differentially private histogram publishing through lossy compression. In Proceedings of the 2012 IEEE 12th International Conference on Data Mining, Brussels, Belgium, 10–13 December 2012; IEEE: New Yok, NY, USA, 2012; pp. 1–10. [Google Scholar]
- Zhu, T.; Xiong, P.; Li, G.; Zhou, W. Correlated differential privacy: Hiding information in non-IID data set. IEEE Trans. Inf. Forensics Secur. 2014, 10, 229–242. [Google Scholar]
- Agrawal, D.; Aggarwal, C.C. On the Design and Quantification of Privacy Preserving Data Mining Algorithms. In Proceedings of the 20th ACM SIGACT-SIGMOD-SIGART Symposium on Principles of Database Systems, Santa Barbara, CA, USA, 21–23 May 2001; pp. 247–255. [Google Scholar]
- Evfimievski, A.; Srikant, R.; Agrawal, R.; Gehrke, J. Privacy preserving mining of association rules. In Proceedings of the 8th ACM SIGKDD International Conference on Knowledge Discovery and Data Mining, Edmonton, AB, Canada, 23–26 July 2002; pp. 217–228. [Google Scholar]
- Huang, J.; Howley, E.; Duggan, J. The Ford Method: A sensitivity analysis approach. In Proceedings of the 27th International Conference of the System Dynamics Society, Albuquerque, NM, USA, 26–30 July 2009; The System Dynamics Society: Littleton, MA, USA, 2009. [Google Scholar]
- European Data Protection Board. Guidelines 1/2020 on Processing Personal Data in the Context of Connected Vehicles and Mobility Related Applications; European Data Protection Board: Brussels, Belgium, 2020. [Google Scholar]
- Ntalampiras, S. Detection of integrity attacks in cyber-physical critical infrastructures using ensemble modeling. IEEE Trans. Ind. Inform. 2014, 11, 104–111. [Google Scholar] [CrossRef]
- Haller, P.; Genge, B. Using sensitivity analysis and cross-association for the design of intrusion detection systems in industrial cyber-physical systems. IEEE Access 2017, 5, 9336–9347. [Google Scholar] [CrossRef]
Figure 1.
Multi-sensor equipment with perturbation module.

Figure 2.
Methodology for comparing two perturbation methods.

Figure 3.
Regular and sensitive user behavior normalized data (Vehicle speed): (a) regular behavior; (b) sensitive behavior (break pressed every 30 s); (c) sensitive behavior (stop and go every 60 s); (d) sensitive behavior (sharp acceleration every 60 s); (e) sensitive behavior (break and acceleration alternatively every 60 s); (f) sensitive behavior (stop and go and acceleration alternatively every 60 s).

Figure 4.
Generated interventions from Vehicle speed normalized data: (a) landmark regular behavior; (b) Intervention/attack (pulse attack); (c) Intervention/attack (scaling attack); (d) Intervention/attack (ramp attack); (e) Intervention/attack (random attack); (f) Intervention/attack (step attack).

Figure 5.
Perturbation of time series (vehicle speed) normalized data using various perturbation methods: (a) regular/normal behavior; (b) sensitive behavior (s3); (c) sensitive behavior (s4); (d) regular behavior perturbed with M1; (e) sensitive behavior (s3) perturbed with M1; (f) sensitive behavior (s4) perturbed with M1; (g) regular behavior perturbed with M3; (h) sensitive behavior (s3) perturbed with M3; (i) sensitive behavior (s4) perturbed with M3; (j) regular behavior (s4) perturbed with M5; (k) sensitive behavior (s3) perturbed with M5; (l) sensitive behavior (s4) perturbed with M5.

Figure 6.
Sensitive behavior data (vehicle speed): (a) Minimum and maximum impact coefficients for all tested perturbation methods; (b) Maximum and mean MAE (information loss) for all tested perturbation methods; (c) The maximum probability of the real query result for all tested perturbation methods.

Figure 7.
Minimum and maximum impact coefficients for all tested perturbation methods for (a) CO flow (g/s) values; (b) instant fuel economy (l/100 km) values; (c) magnetometer X (µT) values.
Figure 7.
Minimum and maximum impact coefficients for all tested perturbation methods for (a) CO flow (g/s) values; (b) instant fuel economy (l/100 km) values; (c) magnetometer X (µT) values.

Figure 8.
(a) Maximum MAE (information loss) for all tested perturbation methods; (b) Maximum probability of the real query result for all tested perturbation methods.
Figure 8.
(a) Maximum MAE (information loss) for all tested perturbation methods; (b) Maximum probability of the real query result for all tested perturbation methods.

Figure 9.
Multi-sensor equipment with several perturbation modules.


Table 1.
Symbols and their description.
| Symbol | Description |
|---|---|
| R | Set of collected regular (typical) user behavior data |
| S | Set of collected sensitive user behavior data |
| B | Set of collected user behavior data (regular and sensitive), |
| and | |
| A | Set of intervention data (integrity attacks), |
| Standard deviation | |
| Minimum standard deviation of regular user behavior data, | |
| Maximum standard deviation of regular user behavior data, | |
| Standard deviation of a regular user behavior data, | |
| Standard deviation of a sensitive user behavior data, | |
| Standard deviation of an intervention data (integrity attacks), | |
| Regular user behavior data, | |
| Landmark regular user behavior data | |
| Sensitive user behavior data, | |
| Regular or sensitive user behavior data, | |
| Intervention (attack) data, | |
| Perturbation method | |
| , , , , | Perturbed data, , , , |
| , | |
| C | Cross-covariance |
| Relative impact of a behavior data on the observed variable (attribute) | |
| Mean relative impact of a behavior data on the observed | |
| variable (attribute) | |
| Behavior-privacy parameter | |
| Behavior-utility parameter |
Table 2.
Standard deviation for Vehicle speed collected data values and generated interventions/attacks.
Table 2.
Standard deviation for Vehicle speed collected data values and generated interventions/attacks.
| Time-Series Data | Description | Standard Deviation () |
|---|---|---|
| Regular behavior () | Vehicle usage under regular driving | 0.0539 |
| Regular behavior () | Vehicle usage under regular driving | 0.0474 |
| Regular behavior () | Vehicle usage under regular driving | 0.0463 |
| Regular behavior () | Vehicle usage under regular driving | 0.0495 |
| Regular behavior ()—landmark () | Vehicle usage under regular driving | 0.0500 |
| Sensitive behavior () | Break pressed with a random intensity every 30 s | 0.0376 |
| Sensitive behavior () | Stop and go every 60 s | 0.0598 |
| Sensitive behavior () | Accelerate with a random intensity every 60 s | 0.0557 |
| Sensitive behavior () | Break and accelerate alternatively every 60 s | 0.0678 |
| Sensitive behavior () | Stop and go and accelerate alternatively every 60 s | 0.0569 |
| Intervention/attack () | Pulse attack (attack window size = 7, ) | 0.0701 |
| Intervention/attack () | Scaling attack (attack window size = 7, ) | 0.0816 |
| Intervention/attack () | Ramp attack (attack window size = 35, ) | 0.0860 |
| Intervention/attack () | Random attack (attack window size = 7, ) | 0.0762 |
| Intervention/attack () | Step attack (attack window size = 10, ) | 0.0906 |
Table 3.
Distortion /perturbation methods and parameters.
| Distortion/Perturbation Method | Notation | Number of Fourier Coefficients | Noise Size/Privacy Budget |
|---|---|---|---|
| No distortion/perturbation | - | - | |
| Filtered FFT | - | ||
| Filtered FFT | - | ||
| CPA Algorithm | |||
| CPA Algorithm | |||
| FPA Algorithm | |||
| FPA Algorithm |
Table 4.
Mean relative impact coefficients for tested perturbation methods applied on sensitive behavior data.
Table 4.
Mean relative impact coefficients for tested perturbation methods applied on sensitive behavior data.
| Sensitive Behavior | |||||||
|---|---|---|---|---|---|---|---|
| Break/30 s () | 1.0 | 0.205 | 0.217 | 0.194 | 0.255 | 0.236 | 0.228 |
| Stop/60 s () | 1.0 | 0.266 | 0.205 | 0.353 | 0.202 | 0.235 | 0.259 |
| Acceleration/60 s () | 1.0 | 0.251 | 0.238 | 0.208 | 0.232 | 0.239 | 0.243 |
| Break and acceleration | |||||||
| (alternatively)/60 s () | 1.0 | 0.184 | 0.218 | 0.364 | 0.105 | 0.228 | 0.240 |
| Stop and go and acceleration | |||||||
| (alternatively)/60 s () | 1.0 | 0.257 | 0.256 | 0.334 | 0.216 | 0.245 | 0.249 |
Table 5.
Mean relative impact coefficients for tested perturbation methods applied on intervention data (vehicle speed observed variable).
Table 5.
Mean relative impact coefficients for tested perturbation methods applied on intervention data (vehicle speed observed variable).
| Intervention/Attack | |||||||
|---|---|---|---|---|---|---|---|
| Intervention/attack () | 1.0 | 0.157 | |||||
| Intervention/attack () | 1.0 | 0.140 | |||||
| Intervention/attack () | 1.0 | 0.134 | 0.231 | ||||
| Intervention/attack () | 1.0 | 0.138 | 0.263 | ||||
| Intervention/attack () | 1.0 | 0.132 | 0.261 | 0.230 | |||
| 1.0 | 0.184 | 0.205 | 0.194 | 0.105 | 0.228 | 0.228 | |
| 1.0 | 0.266 | 0.256 | 0.364 | 0.255 | 0.245 | 0.259 |
Table 6.
Mean absolute error (MAE) for tested perturbation methods () applied on sensitive behavior data.
Table 6.
Mean absolute error (MAE) for tested perturbation methods () applied on sensitive behavior data.
| Sensitive Behavior | |||||||
|---|---|---|---|---|---|---|---|
| Break/30 s () | 0.0 | 1.977 | 1.601 | 1.518 | 1.775 | 1.486 | 1.486 |
| Stop/60 s () | 0.0 | 3.977 | 2.832 | 2.668 | 2.650 | 2.568 | 2.577 |
| Acceleration/60 s () | 0.0 | 2.744 | 2.359 | 2.266 | 2.519 | 2.162 | 2.176 |
| Break and acceleration | |||||||
| (alternatively)/60 s () | 0.0 | 3.541 | 3.027 | 3.072 | 3.028 | 2.849 | 2.796 |
| Stop and go and acceleration | |||||||
| (alternatively)/60 s () | 0.0 | 3.218 | 2.454 | 2.197 | 2.276 | 2.273 | 2.248 |
Table 7.
Probability of the real query result applied on sensitive behavior data.
| Sensitive Behavior | ||||
|---|---|---|---|---|
| Break/30 s () | ||||
| Stop/60 s () | ||||
| Acceleration/60 s () | ||||
| Break and acceleration | ||||
| (alternatively)/60 s () | ||||
| Stop and go and | ||||
| acceleration/60 s () |
Disclaimer/Publisher’s Note: The statements, opinions and data contained in all publications are solely those of the individual author(s) and contributor(s) and not of MDPI and/or the editor(s). MDPI and/or the editor(s) disclaim responsibility for any injury to people or property resulting from any ideas, methods, instructions or products referred to in the content. |
© 2023 by the author. Licensee MDPI, Basel, Switzerland. This article is an open access article distributed under the terms and conditions of the Creative Commons Attribution (CC BY) license (https://creativecommons.org/licenses/by/4.0/).
Share and Cite
MDPI and ACS Style
Roman, A.-S. Evaluating the Privacy and Utility of Time-Series Data Perturbation Algorithms. Mathematics 2023, 11, 1260. https://doi.org/10.3390/math11051260
AMA Style
Roman A-S. Evaluating the Privacy and Utility of Time-Series Data Perturbation Algorithms. Mathematics. 2023; 11(5):1260. https://doi.org/10.3390/math11051260
Chicago/Turabian StyleRoman, Adrian-Silviu. 2023. "Evaluating the Privacy and Utility of Time-Series Data Perturbation Algorithms" Mathematics 11, no. 5: 1260. https://doi.org/10.3390/math11051260
Note that from the first issue of 2016, this journal uses article numbers instead of page numbers. See further details here.