
Integrating Demographics and Imaging Features for Various Stages of Dementia Classification: Feed Forward Neural Network Multi-Class Approach


Abstract
:1. Introduction
2. Materials and Methods
2.1. Patient Dataset
2.1.1. ADNI Dataset
2.1.2. OASIS Dataset
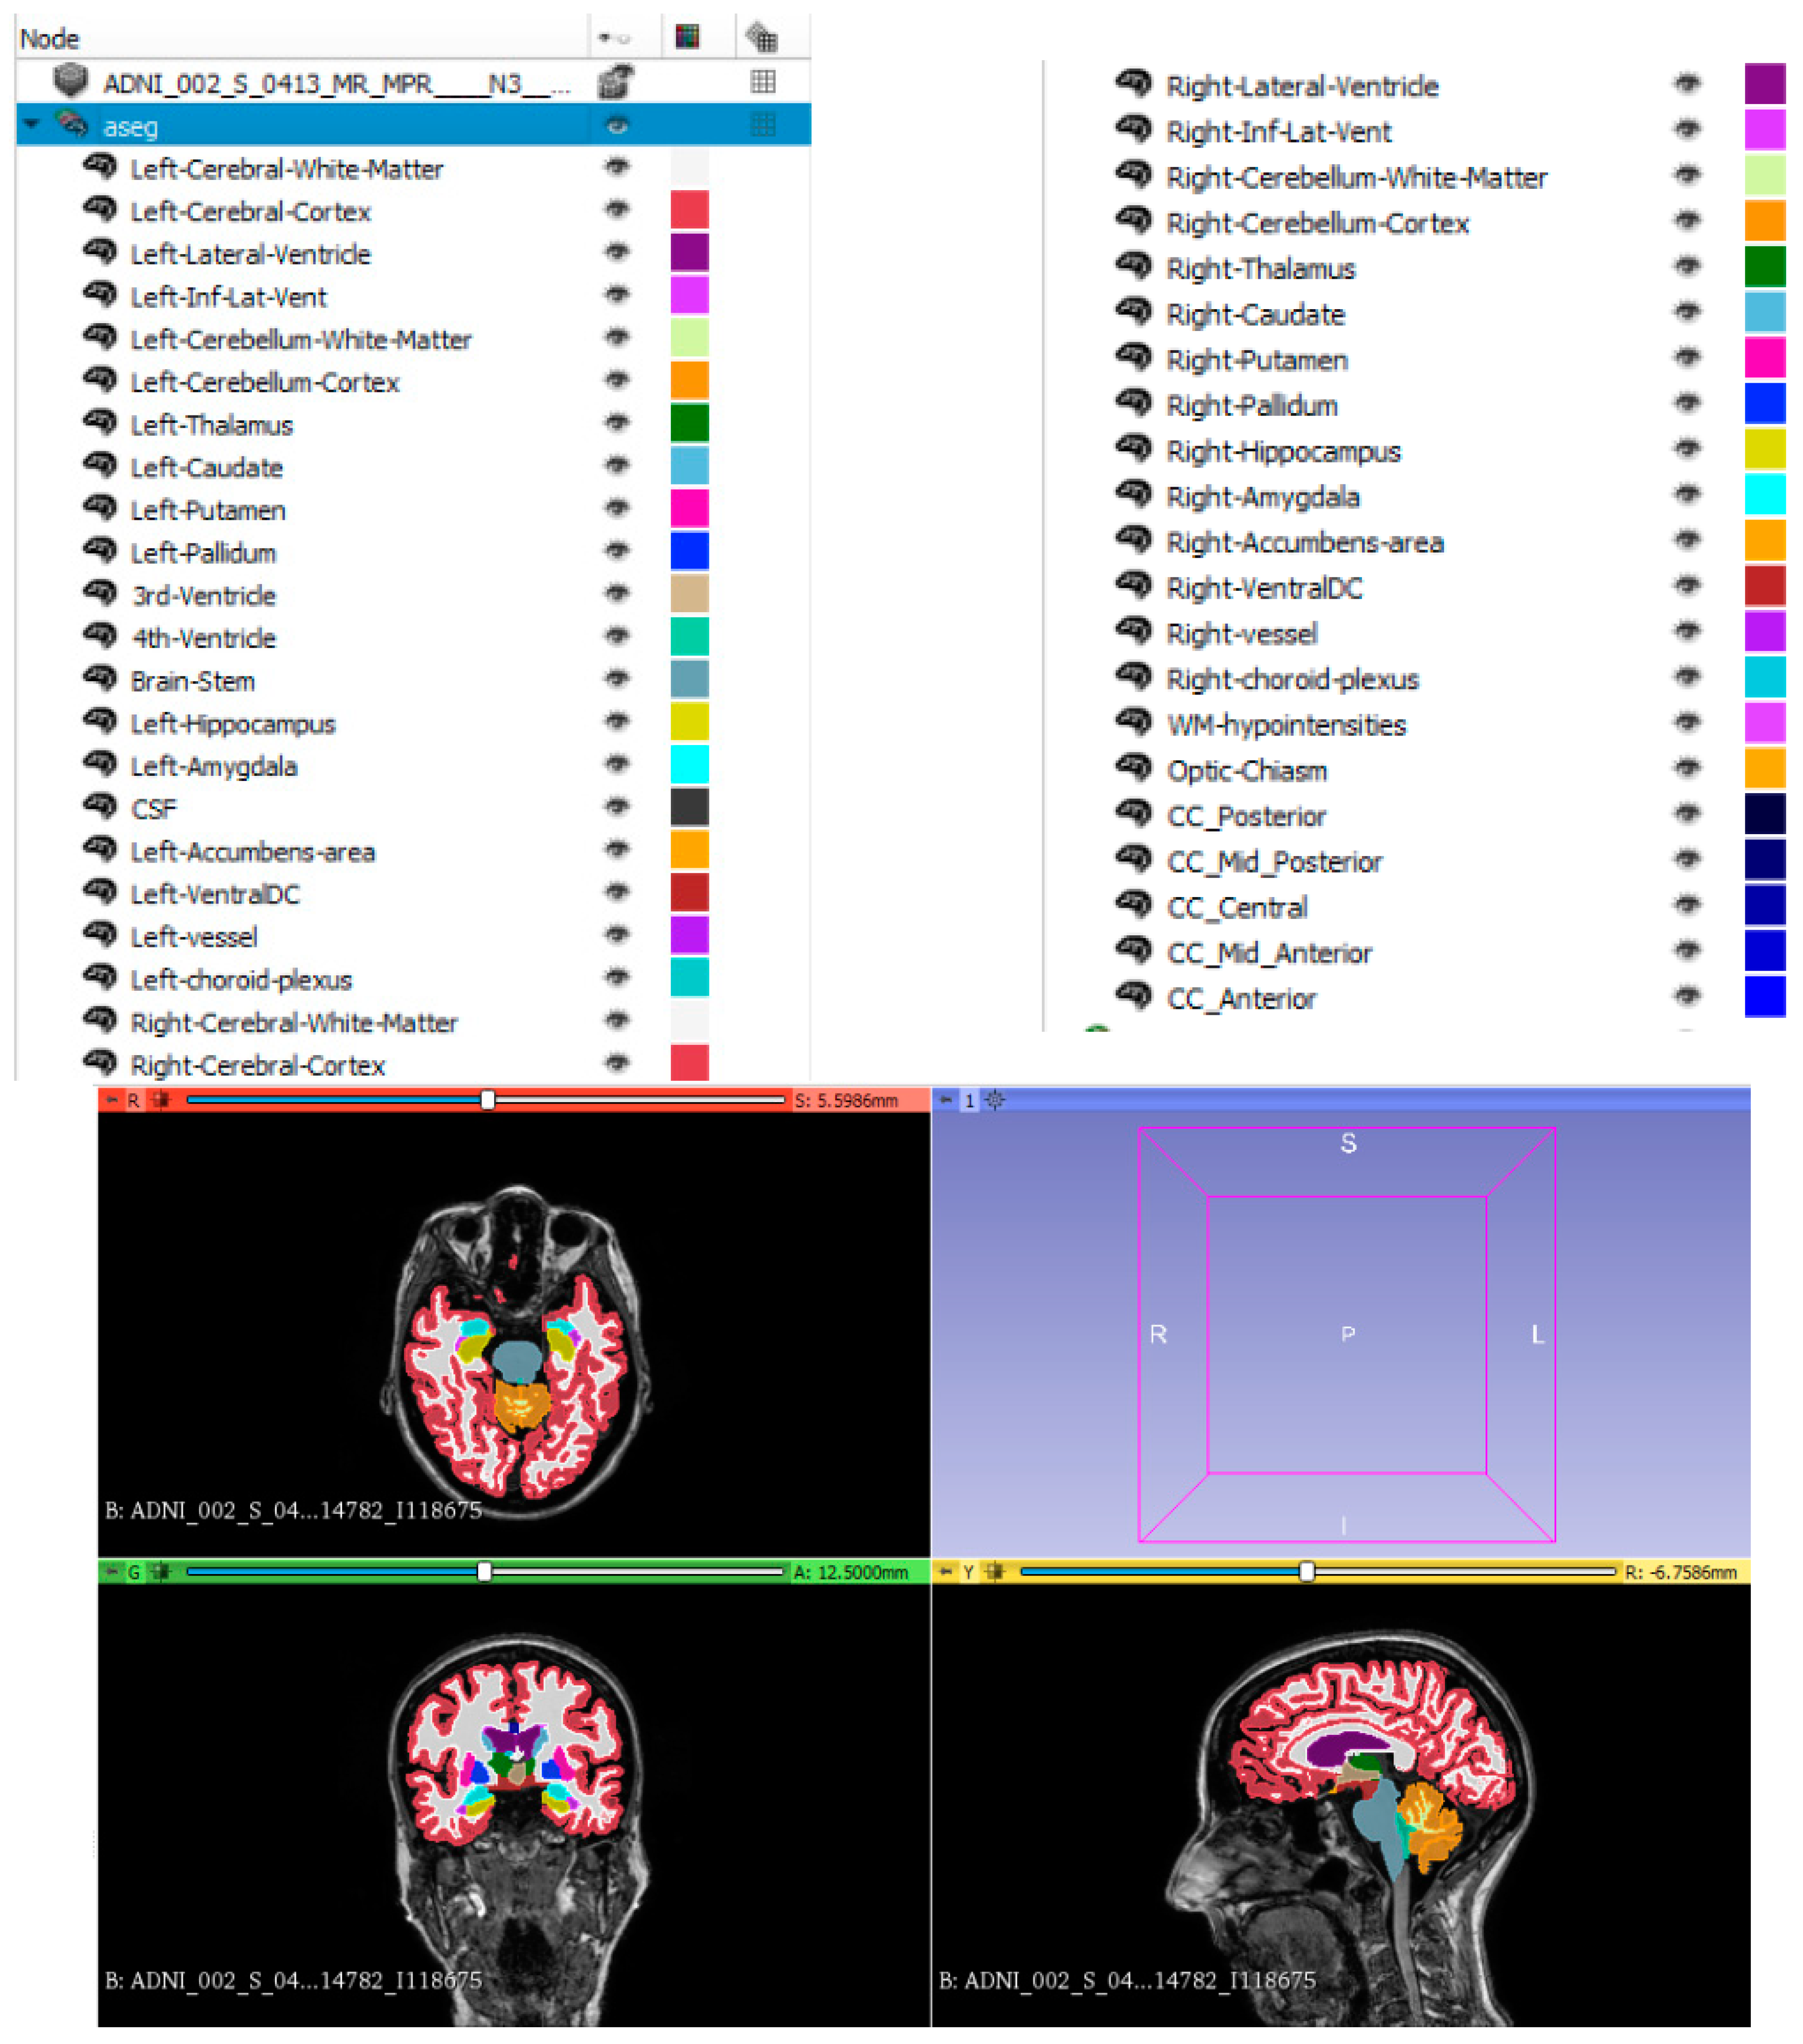
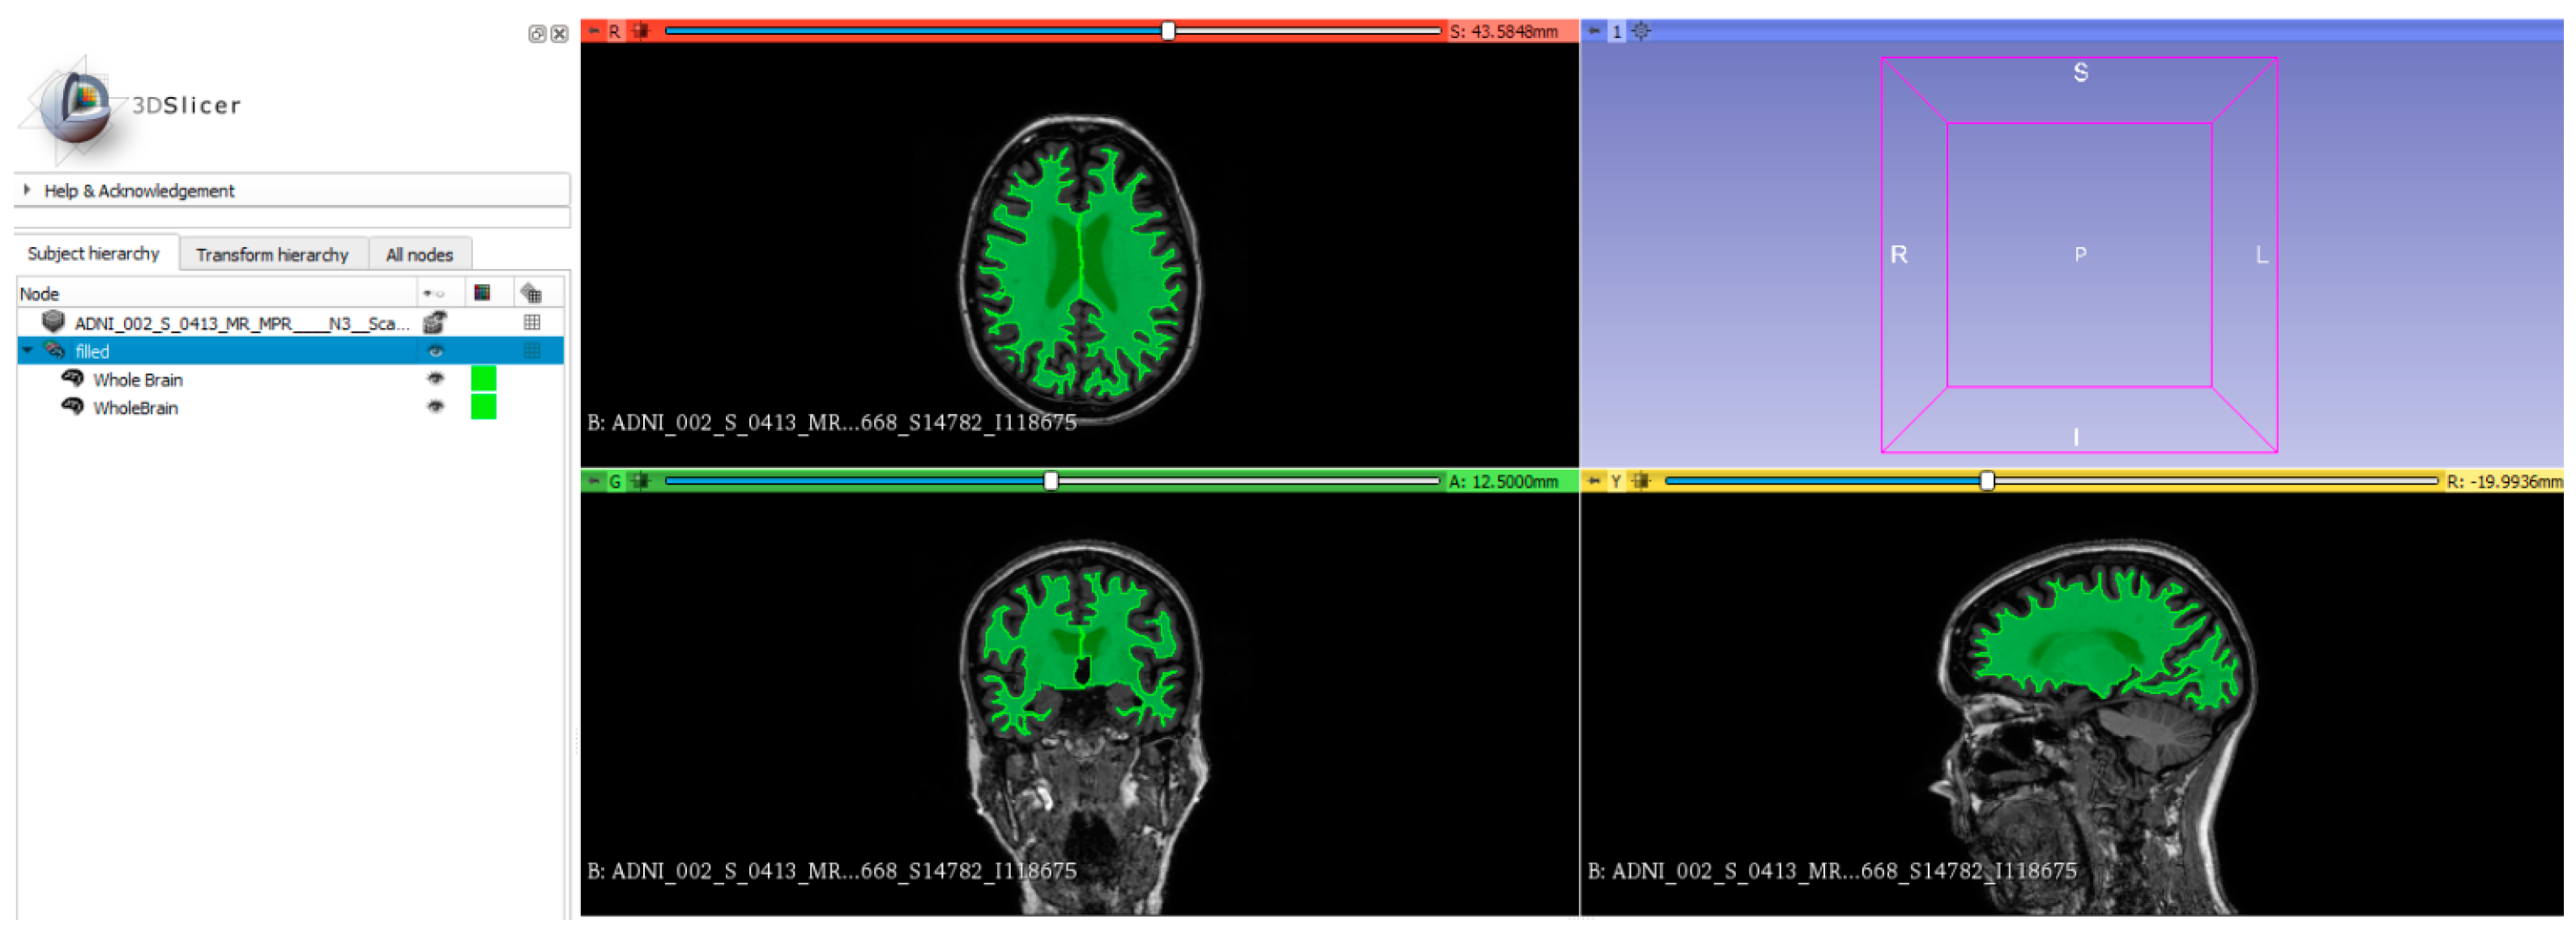
2.2. Brain Segmentation and Regional Volume Analysis
2.3. Radiomics Features
2.4. Demographics
2.5. Integration of Patients’ Demographics and Image Features
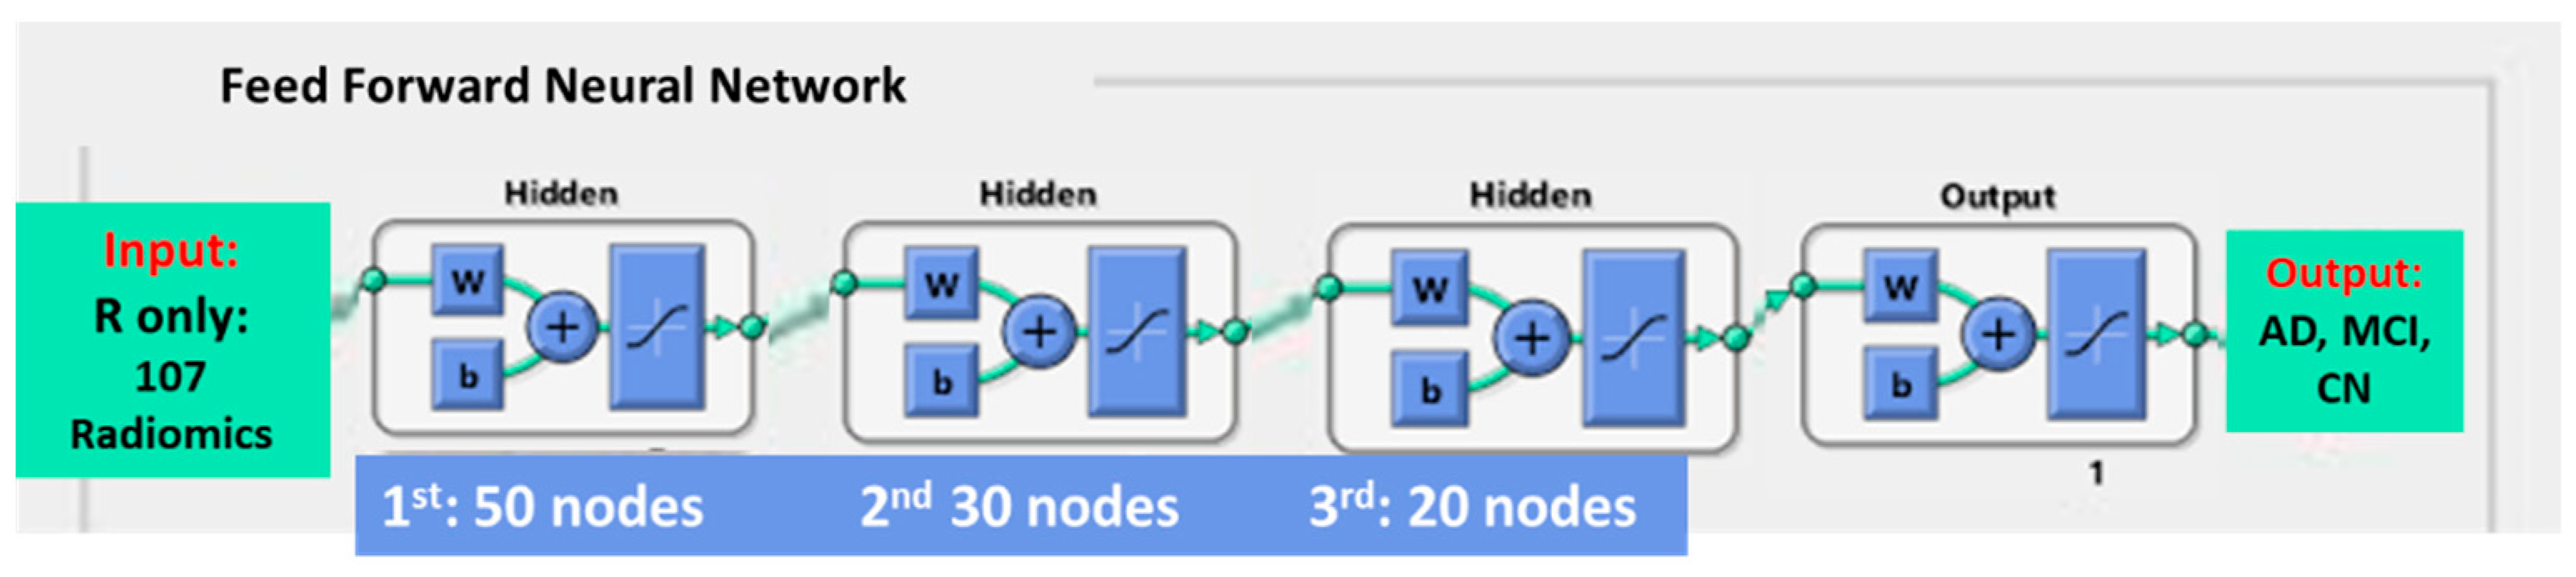
2.6. Model Building
2.7. Model Testing and Data Analysis
3. Results
3.1. Dataset Demographics
3.2. Performance Comparison in View of the Various Features Employed for Model Building
3.3. Performance Evaluation of FFNN when Compared to Traditional Classifiers
4. Discussion
4.1. The Value of Integrating Image Features and Patient Demographics in AD, MCI and CN Classification
4.2. The Value of the Feed-Forward Neural Network in Classification of AD, MCI and CN
4.3. The Value of Multi-Classes in Classification of AD, MCI and CN
4.4. The Value of Testing against Independent Cohort of Patients
4.5. Potential Clinical Application and Development of the Proposed Model
4.6. Main Findings of Study
4.7. Study Limitations and Future Directions
5. Conclusions
Author Contributions
Funding
Institutional Review Board Statement
Informed Consent Statement
Data Availability Statement
Acknowledgments
Conflicts of Interest
References
- Prince, M.; Comas-Herrera, A.; Knapp, M.; Guerchet, M.; Karagiannidou, M. World Alzheimer Report 2016; Alzheimer’s Disease International: London, UK, 2016. [Google Scholar]
- Esiri, M.M. Is an Effective Immune Intervention for Alzheimer’s Disease in Prospect? Trends Pharmacol. Sci. 2001, 22, 2–3. [Google Scholar] [CrossRef] [PubMed]
- Wang, J.; He, L.; Zheng, H.; Lu, Z.-L. Optimizing the Magnetization-Prepared Rapid Gradient-Echo (MP-RAGE) Sequence. PLoS ONE 2014, 9, e96899. [Google Scholar] [CrossRef] [PubMed]
- van der Flier, W.M.; van Straaten, E.C.W.; Barkhof, F.; Ferro, J.M.; Pantoni, L.; Basile, A.M.; Inzitari, D.; Erkinjuntti, T.; Wahlund, L.O.; Rostrup, E.; et al. Medial Temporal Lobe Atrophy and White Matter Hyperintensities Are Associated with Mild Cognitive Deficits in Non-Disabled Elderly People: The LADIS Study. J. Neurol. Neurosurg. Psychiatry 2005, 76, 1497–1500. [Google Scholar] [CrossRef] [PubMed]
- Visser, P.J.; Verhey, F.R.J.; Hofman, P.A.M.; Scheltens, P.; Jolles, J. Medial Temporal Lobe Atrophy Predicts Alzheimer’s Disease in Patients with Minor Cognitive Impairment. J. Neurol. Neurosurg. Psychiatry 2002, 72, 491–497. [Google Scholar] [CrossRef] [PubMed]
- Scheltens, P.; Fox, N.; Barkhof, F.; De Carli, C. Structural Magnetic Resonance Imaging in the Practical Assessment of Dementia: Beyond Exclusion. Lancet Neurol. 2002, 1, 13–21. [Google Scholar] [CrossRef] [PubMed]
- Glodzik-Sobanska, L.; Rusinek, H.; Mosconi, L.; Li, Y.; Zhan, J.; de Santi, S.; Convit, A.; Rich, K.; Brys, M.; de Leon, M.J. The Role of Quantitative Structural Imaging in the Early Diagnosis of Alzheimer’s DiseaseQ4. Neuroimaging Clin. N. Am. 2005, 15, 803–826. [Google Scholar] [CrossRef] [PubMed]
- Cheung, E.Y.; Chiu, P.K.; Kwan, J.S.; Shea, Y.F.; Mak, H. Brain Regional Volume Analysis to Differentiate Alzheimer’s Disease (AD) and Vascular Dementia (VD) from Healthy Control (HC): Machine Learning Approach. Alzheimers Dement. 2021, 17, e058343. [Google Scholar] [CrossRef]
- Cherbuin, N.; Anstey, K.J.; Réglade-Meslin, C.; Sachdev, P.S. In Vivo Hippocampal Measurement and Memory: A Comparison of Manual Tracing and Automated Segmentation in a Large Community-Based Sample. PLoS ONE 2009, 4, e5265. [Google Scholar] [CrossRef] [PubMed]
- Pardoe, H.R.; Pell, G.S.; Abbott, D.F.; Jackson, G.D. Hippocampal Volume Assessment in Temporal Lobe Epilepsy: How Good Is Automated Segmentation? Epilepsia 2009, 50, 2586–2592. [Google Scholar] [CrossRef]
- Qiu, Y.; Liu, S.; Hilal, S.; Loke, Y.M.; Ikram, M.K.; Xu, X.; Yeow Tan, B.; Venketasubramanian, N.; Chen, C.L.-H.; Zhou, J. Inter-Hemispheric Functional Dysconnectivity Mediates the Association of Corpus Callosum Degeneration with Memory Impairment in AD and Amnestic MCI. Sci. Rep. 2016, 6, 32573. [Google Scholar] [CrossRef]
- Cheung, E.Y.; Shea, Y.F.; Chiu, P.K.; Kwan, J.S.; Mak, H. The Role of Corpus Callosum Sub-regional Volume and Its Association to Interhemispheric Functional Connectivity in Alzheimer’s Disease (AD) and Amyloid Mild Cognitive Impairment (amyMCI). Alzheimers Dement. 2021, 17, e050099. [Google Scholar] [CrossRef]
- Saygin, Z.M.; Osher, D.E.; Augustinack, J.; Fischl, B.; Gabrieli, J.D.E. Connectivity-Based Segmentation of Human Amygdala Nuclei Using Probabilistic Tractography. NeuroImage 2011, 56, 1353–1361. [Google Scholar] [CrossRef] [PubMed]
- Ramani, A.; Jensen, J.H.; Helpern, J.A. Quantitative MR Imaging in Alzheimer Disease. Radiology 2006, 241, 26–44. [Google Scholar] [CrossRef] [PubMed]
- Moodley, K.K.; Chan, D. The Hippocampus in Neurodegenerative Disease. Front. Neurol. Neurosci. 2014, 34, 95–108. [Google Scholar] [CrossRef] [PubMed]
- Fh, T.; Cyw, C.; Eyw, C. Radiomics AI Prediction for Head and Neck Squamous Cell Carcinoma (HNSCC) Prognosis and Recurrence with Target Volume Approach. BJR|Open 2021, 3, 20200073. [Google Scholar] [CrossRef] [PubMed]
- Tang, F.-H.; Cheung, E.-Y.-W.; Wong, H.-L.; Yuen, C.-M.; Yu, M.-H.; Ho, P.-C. Radiomics from Various Tumour Volume Sizes for Prognosis Prediction of Head and Neck Squamous Cell Carcinoma: A Voted Ensemble Machine Learning Approach. Life 2022, 12, 1380. [Google Scholar] [CrossRef] [PubMed]
- Zhang, Y.; Oikonomou, A.; Wong, A.; Haider, M.A.; Khalvati, F. Radiomics-Based Prognosis Analysis for Non-Small Cell Lung Cancer. Sci. Rep. 2017, 7, 46349. [Google Scholar] [CrossRef] [PubMed]
- Zhang, L.; Dong, D.; Li, H.; Tian, J.; Ouyang, F.; Mo, X.; Zhang, B.; Luo, X.; Lian, Z.; Pei, S.; et al. Development and Validation of a Magnetic Resonance Imaging-Based Model for the Prediction of Distant Metastasis before Initial Treatment of Nasopharyngeal Carcinoma: A Retrospective Cohort Study. EBioMedicine 2019, 40, 327–335. [Google Scholar] [CrossRef] [PubMed]
- Das, A.K.; Bell, M.H.; Nirodi, C.S.; Story, M.D.; Minna, J.D. Radiogenomics Predicting Tumor Responses to Radiotherapy in Lung Cancer. Semin. Radiat. Oncol. 2010, 20, 149–155. [Google Scholar] [CrossRef]
- Li, T.-R.; Wu, Y.; Jiang, J.-J.; Lin, H.; Han, C.-L.; Jiang, J.-H.; Han, Y. Radiomics Analysis of Magnetic Resonance Imaging Facilitates the Identification of Preclinical Alzheimer’s Disease: An Exploratory Study. Front. Cell Dev. Biol. 2020, 8, 605734. [Google Scholar] [CrossRef]
- Hogervorst, E.; Temple, S.; O’Donnell, E. Sex Differences in Dementia. In Sex Differences in Brain Function and Dysfunction; Gibson, C., Galea, L.A.M., Eds.; Current Topics in Behavioral Neurosciences; Springer International Publishing: Cham, Switzerland, 2022; Volume 62, pp. 309–331. ISBN 978-3-031-26722-2. [Google Scholar]
- Dong, C.; Zhou, C.; Fu, C.; Hao, W.; Ozaki, A.; Shrestha, N.; Virani, S.S.; Mishra, S.R.; Zhu, D. Sex Differences in the Association between Cardiovascular Diseases and Dementia Subtypes: A Prospective Analysis of 464,616 UK Biobank Participants. Biol. Sex Differ. 2022, 13, 21. [Google Scholar] [CrossRef]
- Lopez, O.L.; Kuller, L.H. Epidemiology of Aging and Associated Cognitive Disorders: Prevalence and Incidence of Alzheimer’s Disease and Other Dementias. In Handbook of Clinical Neurology; Elsevier: Amsterdam, The Netherlands, 2019; Volume 167, pp. 139–148. ISBN 978-0-12-804766-8. [Google Scholar]
- Chary, E.; Amieva, H.; Pérès, K.; Orgogozo, J.; Dartigues, J.; Jacqmin-Gadda, H. Short- versus Long-term Prediction of Dementia among Subjects with Low and High Educational Levels. Alzheimers Dement. 2013, 9, 562–571. [Google Scholar] [CrossRef]
- Barnes, D.E.; Covinsky, K.E.; Whitmer, R.A.; Kuller, L.H.; Lopez, O.L.; Yaffe, K. Commentary on “Developing a National Strategy to Prevent Dementia: Leon Thal Symposium 2009.” Dementia Risk Indices: A Framework for Identifying Individuals with a High Dementia Risk. Alzheimers Dement. 2010, 6, 138–141. [Google Scholar] [CrossRef]
- Maroco, J.; Silva, D.; Rodrigues, A.; Guerreiro, M.; Santana, I.; De Mendonça, A. Data Mining Methods in the Prediction of Dementia: A Real-Data Comparison of the Accuracy, Sensitivity and Specificity of Linear Discriminant Analysis, Logistic Regression, Neural Networks, Support Vector Machines, Classification Trees and Random Forests. BMC Res. Notes 2011, 4, 299. [Google Scholar] [CrossRef]
- Lebedev, A.V.; Westman, E.; Van Westen, G.J.P.; Kramberger, M.G.; Lundervold, A.; Aarsland, D.; Soininen, H.; Kłoszewska, I.; Mecocci, P.; Tsolaki, M.; et al. Random Forest Ensembles for Detection and Prediction of Alzheimer’s Disease with a Good between-Cohort Robustness. NeuroImage Clin. 2014, 6, 115–125. [Google Scholar] [CrossRef]
- Cheung, E.Y. Radiomics Deep Learning Application to Differentiate Mild Cognitive Impairment Patients (MCI) from Healthy Control (HC). Alzheimers Dement. 2023, 19, e066747. [Google Scholar] [CrossRef]
- Cheung, E.Y.W.; Chau, A.C.M.; Tang, F.H.; on behalf of the Alzheimer’s Disease Neuroimaging Initiative. Radiomics-Based Artificial Intelligence Differentiation of Neurodegenerative Diseases with Reference to the Volumetry. Life 2022, 12, 514. [Google Scholar] [CrossRef]
- Wei, W.; Visweswaran, S.; Cooper, G.F. The Application of Naive Bayes Model Averaging to Predict Alzheimer’s Disease from Genome-Wide Data. J. Am. Med. Inform. Assoc. 2011, 18, 370–375. [Google Scholar] [CrossRef]
- Kruthika, K.R.; Rajeswari; Maheshappa, H.D. Multistage Classifier-Based Approach for Alzheimer’s Disease Prediction and Retrieval. Inform. Med. Unlocked 2019, 14, 34–42. [Google Scholar] [CrossRef]
- Seo, K.; Pan, R.; Lee, D.; Thiyyagura, P.; Chen, K. Visualizing Alzheimer’s Disease Progression in Low Dimensional Manifolds. Heliyon 2019, 5, e02216. [Google Scholar] [CrossRef]
- Sheng, J.; Wang, B.; Zhang, Q.; Liu, Q.; Ma, Y.; Liu, W.; Shao, M.; Chen, B. A Novel Joint HCPMMP Method for Automatically Classifying Alzheimer’s and Different Stage MCI Patients. Behav. Brain Res. 2019, 365, 210–221. [Google Scholar] [CrossRef]
- Alzheimer’s Disease Neuroimaging Initiative; Yamashita, A.Y.; Falcão, A.X.; Leite, N.J. The Residual Center of Mass: An Image Descriptor for the Diagnosis of Alzheimer Disease. Neuroinformatics 2019, 17, 307–321. [Google Scholar] [CrossRef]
- Yang, W.; Chen, X.; Cohen, D.S.; Rosin, E.R.; Toga, A.W.; Thompson, P.M.; Huang, X. Classification of MRI and Psychological Testing Data Based on Support Vector Machine. Int. J. Clin. Exp. Med. 2017, 10, 16004–16026. [Google Scholar]
- Zhao, W.; Luo, Y.; Zhao, L.; Mok, V.; Su, L.; Yin, C.; Sun, Y.; Lu, J.; Shi, L.; Han, Y. Automated Brain MRI Volumetry Differentiates Early Stages of Alzheimer’s Disease from Normal Aging. J. Geriatr. Psychiatry Neurol. 2019, 32, 354–364. [Google Scholar] [CrossRef]
- Zheng, Y.; Guo, H.; Zhang, L.; Wu, J.; Li, Q.; Lv, F. Machine Learning-Based Framework for Differential Diagnosis Between Vascular Dementia and Alzheimer’s Disease Using Structural MRI Features. Front. Neurol. 2019, 10, 1097. [Google Scholar] [CrossRef]
- Danso, S.O.; Zeng, Z.; Muniz-Terrera, G.; Ritchie, C.W. Developing an Explainable Machine Learning-Based Personalised Dementia Risk Prediction Model: A Transfer Learning Approach with Ensemble Learning Algorithms. Front. Big Data 2021, 4, 613047. [Google Scholar] [CrossRef]
- Suk, H.-I. An Introduction to Neural Networks and Deep Learning. In Deep Learning for Medical Image Analysis; Elsevier: Amsterdam, The Netherlands, 2017; pp. 3–24. ISBN 978-0-12-810408-8. [Google Scholar]
- Cheung, E.Y.; Mak, H.; Chiu, P.K.; Shea, Y.F.; Chau, A.C.; Kwan, J.S. Artificial Neural Network Application to Characterize Patients with Alzheimer’s Disease and Mild Cognitive Impairment from Cognitive Normal. Alzheimers Dement. 2023, 19, e079624. [Google Scholar] [CrossRef]
- Cárdenas-Peña, D.; Collazos-Huertas, D.; Castellanos-Dominguez, G. Centered Kernel Alignment Enhancing Neural Network Pretraining for MRI-Based Dementia Diagnosis. Comput. Math. Methods Med. 2016, 2016, 9523849. [Google Scholar] [CrossRef]
- Ning, K.; Chen, B.; Sun, F.; Hobel, Z.; Zhao, L.; Matloff, W.; Toga, A.W. Classifying Alzheimer’s Disease with Brain Imaging and Genetic Data Using a Neural Network Framework. Neurobiol. Aging 2018, 68, 151–158. [Google Scholar] [CrossRef]
- Cohen, D.S.; Carpenter, K.A.; Jarrell, J.T.; Huang, X.; Alzheimer’s Disease Neuroimaging Initiative. Deep Learning-Based Classification of Multi-Categorical Alzheimer’s Disease Data. Curr. Neurobiol. 2019, 10, 141–147. [Google Scholar]
- Frizzell, T.O.; Glashutter, M.; Liu, C.C.; Zeng, A.; Pan, D.; Hajra, S.G.; D’Arcy, R.C.N.; Song, X. Artificial Intelligence in Brain MRI Analysis of Alzheimer’s Disease over the Past 12 Years: A Systematic Review. Ageing Res. Rev. 2022, 77, 101614. [Google Scholar] [CrossRef]
- Jack, C.R.; Bernstein, M.A.; Fox, N.C.; Thompson, P.; Alexander, G.; Harvey, D.; Borowski, B.; Britson, P.J.; Whitwell, J.L.; Ward, C.; et al. The Alzheimer’s Disease Neuroimaging Initiative (ADNI): MRI Methods. J. Magn. Reson. Imaging 2008, 27, 685–691. [Google Scholar] [CrossRef]
- LaMontagne, P.J.; Benzinger, T.L.S.; Morris, J.C.; Keefe, S.; Hornbeck, R.; Xiong, C.; Grant, E.; Hassenstab, J.; Moulder, K.; Vlassenko, A.G.; et al. OASIS-3: Longitudinal Neuroimaging, Clinical, and Cognitive Dataset for Normal Aging and Alzheimer Disease. medRxiv, 2019; preprint. [Google Scholar]
- Dale, A.M.; Fischl, B.; Sereno, M.I. Cortical Surface-Based Analysis. I. Segmentation and Surface Reconstruction. Neuroimage 1999, 9, 179–194. [Google Scholar] [CrossRef]
- Fischl, B.; Liu, A.; Dale, A.M. Automated Manifold Surgery: Constructing Geometrically Accurate and Topologically Correct Models of the Human Cerebral Cortex. IEEE Trans. Med. Imaging 2001, 20, 70–80. [Google Scholar] [CrossRef]
- Fischl, B.; Salat, D.H.; van der Kouwe, A.J.W.; Makris, N.; Ségonne, F.; Quinn, B.T.; Dale, A.M. Sequence-Independent Segmentation of Magnetic Resonance Images. NeuroImage 2004, 23, S69–S84. [Google Scholar] [CrossRef]
- Fischl, B.; Sereno, M.I.; Dale, A.M. Cortical Surface-Based Analysis. II: Inflation, Flattening, and a Surface-Based Coordinate System. Neuroimage 1999, 9, 195–207. [Google Scholar] [CrossRef]
- Jovicich, J.; Czanner, S.; Greve, D.; Haley, E.; van der Kouwe, A.; Gollub, R.; Kennedy, D.; Schmitt, F.; Brown, G.; Macfall, J.; et al. Reliability in Multi-Site Structural MRI Studies: Effects of Gradient Non-Linearity Correction on Phantom and Human Data. Neuroimage 2006, 30, 436–443. [Google Scholar] [CrossRef]
- Reuter, M.; Rosas, H.D.; Fischl, B. Highly Accurate Inverse Consistent Registration: A Robust Approach. Neuroimage 2010, 53, 1181–1196. [Google Scholar] [CrossRef]
- Reuter, M.; Schmansky, N.J.; Rosas, H.D.; Fischl, B. Within-Subject Template Estimation for Unbiased Longitudinal Image Analysis. Neuroimage 2012, 61, 1402–1418. [Google Scholar] [CrossRef]
- Friston, K.J. (Ed.) Statistical Parametric Mapping: The Analysis of Funtional Brain Images, 1st ed.; Elsevier: Amsterdam, The Netherlands; Academic Press: Boston, MA, USA, 2007; ISBN 978-0-12-372560-8. [Google Scholar]
- Aerts, H.J.W.L.; Velazquez, E.R.; Leijenaar, R.T.H.; Parmar, C.; Grossmann, P.; Carvalho, S.; Cavalho, S.; Bussink, J.; Monshouwer, R.; Haibe-Kains, B.; et al. Decoding Tumour Phenotype by Noninvasive Imaging Using a Quantitative Radiomics Approach. Nat. Commun. 2014, 5, 4006. [Google Scholar] [CrossRef]
- Zwanenburg, A.; Vallières, M.; Abdalah, M.A.; Aerts, H.J.W.L.; Andrearczyk, V.; Apte, A.; Ashrafinia, S.; Bakas, S.; Beukinga, R.J.; Boellaard, R.; et al. The Image Biomarker Standardization Initiative: Standardized Quantitative Radiomics for High-Throughput Image-Based Phenotyping. Radiology 2020, 295, 328–338. [Google Scholar] [CrossRef]
- Nuti, G.; Jiménez Rugama, L.A.; Cross, A.-I. An Explainable Bayesian Decision Tree Algorithm. Front. Appl. Math. Stat. 2021, 7, 598833. [Google Scholar] [CrossRef]
- Cross-Validation: Evaluating Estimator Performance. Available online: https://scikit-learn/stable/modules/cross_validation.html (accessed on 8 October 2022).
- de Flores, R.; La Joie, R.; Chételat, G. Structural Imaging of Hippocampal Subfields in Healthy Aging and Alzheimer’s Disease. Neuroscience 2015, 309, 29–50. [Google Scholar] [CrossRef]
- Sørensen, L.; Igel, C.; Pai, A.; Balas, I.; Anker, C.; Lillholm, M.; Nielsen, M. Differential Diagnosis of Mild Cognitive Impairment and Alzheimer’s Disease Using Structural MRI Cortical Thickness, Hippocampal Shape, Hippocampal Texture, and Volumetry. NeuroImage Clin. 2017, 13, 470–482. [Google Scholar] [CrossRef]
- Koikkalainen, J.; Rhodius-Meester, H.; Tolonen, A.; Barkhof, F.; Tijms, B.; Lemstra, A.W.; Tong, T.; Guerrero, R.; Schuh, A.; Ledig, C.; et al. Differential Diagnosis of Neurodegenerative Diseases Using Structural MRI Data. Neuroimage Clin. 2016, 11, 435–449. [Google Scholar] [CrossRef]
- Du, Y.; Zhang, S.; Fang, Y.; Qiu, Q.; Zhao, L.; Wei, W.; Tang, Y.; Li, X. Radiomic Features of the Hippocampus for Diagnosing Early-Onset and Late-Onset Alzheimer’s Disease. Front. Aging Neurosci. 2022, 13, 789099. [Google Scholar] [CrossRef]
- Zell, A. Simulation Neuronaler Netze, 1st ed.; Addison-Wesley: Bonn, Germany, 1996; ISBN 978-3-89319-554-1. [Google Scholar]
- Gavin, H.P. The Levenberg-Marquardt Algorithm for Nonlinear Least Squares Curve-Fitting Problems; Department of Civil and Environmental Engineering, Duke University: Durham, NC, USA, 2019; 19p. [Google Scholar]
- Zhang, F.; Tian, S.; Chen, S.; Ma, Y.; Li, X.; Guo, X. Voxel-Based Morphometry: Improving the Diagnosis of Alzheimer’s Disease Based on an Extreme Learning Machine Method from the ADNI Cohort. Neuroscience 2019, 414, 273–279. [Google Scholar] [CrossRef]
- Mendoza-Léon, R.; Puentes, J.; Uriza, L.F.; Hernández Hoyos, M. Single-Slice Alzheimer’s Disease Classification and Disease Regional Analysis with Supervised Switching Autoencoders. Comput. Biol. Med. 2020, 116, 103527. [Google Scholar] [CrossRef]
- Borchert, R.J.; Azevedo, T.; Badhwar, A.; Bernal, J.; Betts, M.; Bruffaerts, R.; Burkhart, M.C.; Dewachter, I.; Gellersen, H.M.; Low, A.; et al. Artificial Intelligence for Diagnostic and Prognostic Neuroimaging in Dementia: A Systematic Review. Alzheimers Dement. 2023, 19, 5885–5904. [Google Scholar] [CrossRef] [PubMed]
- Moore, P.J.; Lyons, T.J.; Gallacher, J.; for the Alzheimer’s Disease Neuroimaging Initiative. Random Forest Prediction of Alzheimer’s Disease Using Pairwise Selection from Time Series Data. PLoS ONE 2019, 14, e0211558. [Google Scholar] [CrossRef]
- Bucholc, M.; James, C.; Khleifat, A.A.; Badhwar, A.; Clarke, N.; Dehsarvi, A.; Madan, C.R.; Marzi, S.J.; Shand, C.; Schilder, B.M.; et al. Artificial Intelligence for Dementia Research Methods Optimization. Alzheimers Dement. 2023, 19, 5934–5951. [Google Scholar] [CrossRef]
- Sørensen, L.; Nielsen, M. Ensemble Support Vector Machine Classification of Dementia Using Structural MRI and Mini-Mental State Examination. J. Neurosci. Methods 2018, 302, 66–74. [Google Scholar] [CrossRef]
- Qiu, S.; Joshi, P.S.; Miller, M.I.; Xue, C.; Zhou, X.; Karjadi, C.; Chang, G.H.; Joshi, A.S.; Dwyer, B.; Zhu, S.; et al. Development and Validation of an Interpretable Deep Learning Framework for Alzheimer’s Disease Classification. Brain 2020, 143, 1920–1933. [Google Scholar] [CrossRef]
- Cheung, E.Y.W.; Chau, A.C.M.; Shea, Y.-F.; Chiu, P.K.C.; Kwan, J.S.K.; Mak, H.K.F. Level of Amyloid-β (Aβ) Binding Leading to Differential Effects on Resting State Functional Connectivity in Major Brain Networks. Biomedicines 2022, 10, 2321. [Google Scholar] [CrossRef] [PubMed]
- Shu, Z.-Y.; Shao, Y.; Xu, Y.-Y.; Ye, Q.; Cui, S.-J.; Mao, D.-W.; Pang, P.-P.; Gong, X.-Y. Radiomics Nomogram Based on MRI for Predicting White Matter Hyperintensity Progression in Elderly Adults. J. Magn. Reson. Imaging 2020, 51, 535–546. [Google Scholar] [CrossRef]
- Cheung, E.Y.; Shea, Y.F.; Chiu, P.K.; Kwan, J.S.; Mak, H. Aberrant Interhemispheric Functional Connectivity and Cerebral Blood Flow in Vascular Dementia (VD) and Non-amyloid Mild Cognitive Impairment (NamyMCI). Alzheimers Dement. 2021, 17, e049381. [Google Scholar] [CrossRef]
- Cheung, E.Y.W.; Shea, Y.F.; Chiu, P.K.C.; Kwan, J.S.K.; Mak, H.K.F. Diagnostic Efficacy of Voxel-Mirrored Homotopic Connectivity in Vascular Dementia as Compared to Alzheimer’s Related Neurodegenerative Diseases—A Resting State fMRI Study. Life 2021, 11, 1108. [Google Scholar] [CrossRef] [PubMed]
- Hampel, H.; Hardy, J.; Blennow, K.; Chen, C.; Perry, G.; Kim, S.H.; Villemagne, V.L.; Aisen, P.; Vendruscolo, M.; Iwatsubo, T.; et al. The Amyloid-β Pathway in Alzheimer’s Disease. Mol. Psychiatry 2021, 26, 5481–5503. [Google Scholar] [CrossRef]
- Gabelle, A.; Richard, F.; Gutierrez, L.-A.; Schraen, S.; Delva, F.; Rouaud, O.; Buée, L.; Dartigues, J.-F.; Touchon, J.; Lambert, J.-C.; et al. Plasma Amyloid-β Levels and Prognosis in Incident Dementia Cases of the 3-City Study. JAD 2012, 33, 381–391. [Google Scholar] [CrossRef]


| ADNI Dataset 21 Centers for Training | ADNI Dataset 4 Centers for Testing | OASIS Dataset for Testing | |
|---|---|---|---|
| Alzheimer’s Disease | 69 | 28 | 28 |
| Mild Cognitive Decline | 202 | 91 | 91 |
| Health Control | 135 | 57 | 57 |
| Total | 406 | 176 | 176 |
| 45 Brain Regional Volumes Segmented by FreeSurfer | ||
|---|---|---|
| Left-Lateral-Ventricle | Right-Lateral-Ventricle | CSF |
| Left-Inf-Lat-Vent | Right-Inf-Lat-Vent | Third-Ventricle |
| Left-Cerebellum-White-Matter | Right-Cerebellum-White-Matter | Forth-Ventricle |
| Left-Cerebellum-Cortex | Right-Cerebellum-Cortex | Fifth-Ventricle |
| Left-Thalamus | Right-Thalamus | Brain-Stem |
| Left-Caudate | Right-Caudate | WM-hypointensities |
| Left-Putamen | Right-Putamen | non-WM-hypointensities |
| Left-Pallidum | Right-Pallidum | Optic-Chiasm |
| Left-Hippocampus | Right-Hippocampus | CC_Posterior |
| Left-Amygdala | Right-Amygdala | CC_Mid_Posterior |
| Left-Accumbens-area | Right-Accumbens-area | CC_Central |
| Left-Ventral DC | Right-Ventral DC | CC_Mid_Anterior |
| Left-vessel | Right-vessel | CC_Anterior |
| Left-choroid-plexus | Right-choroid-plexus | |
| Left-WM-hypointensities | Right-WM-hypointensities | |
| Left-non-WM-hypointensities | Right-non-WM-hypointensities | |
| Radiomics Features | No. of Features |
|---|---|
| First-order statistics | 14 |
| 2D-shaped based features | 9 |
| 3D-shaped based features | 13 |
| Gray-level co-occurrence matrix (GLCM) | 22 |
| Gray-level run length matrix (GLRLM) | 16 |
| Gray-level size zone matrix (GLSZM) | 16 |
| Gray-level dependence matrix (GLDM) | 12 |
| Neighboring gray tone difference matrix (NGTDM) | 5 |
| Total | 107 |
| Radiomics 107 Features | Volumes 45 Features | Patients’ Demographics 2 Features | Total Number of Features | |
|---|---|---|---|---|
| R only | ✔ | 107 | ||
| RD | ✔ | ✔ | 109 | |
| V only | ✔ | 45 | ||
| VD | ✔ | ✔ | 47 | |
| VRD | ✔ | ✔ | ✔ | 154 |
| ADNI 21 Centers for Training | ADNI 4 Centers for Testing | Oasis Dataset for Testing | |
|---|---|---|---|
| Age range | 55–90 | 65–90 | 74–89 |
| Sex Ratio (M:F) | 205:201 | 99:77 | 92:84 |
| Alzheimer’s Disease | 69 | 28 | 28 |
| Mild Cognitive Decline | 202 | 91 | 91 |
| Health Control | 135 | 57 | 57 |
| Total | 406 | 176 | 176 |
| (a) Various features employed for model building using SVM. | |||||||||||||||||
| SVM | MCI | AD | CN | ||||||||||||||
| Overall Accuracy | Accuracy | Sensitivity | Specificity | Precision | F1 Score | Accuracy | Sensitivity | Specificity | Precision | F1 Score | Accuracy | Sensitivity | Specificity | Precision | F1 Score | ||
| R only | Train | 67.74% | 73.45% | 70.85% | 76.67% | 79.00% | 74.70% | 83.62% | 52.63% | 88.73% | 43.48% | 47.62% | 78.41% | 69.11% | 82.50% | 63.43% | 66.15% |
| Test1 | 40.57% | 56.00% | 56.99% | 54.88% | 58.89% | 57.92% | 74.29% | 9.52% | 83.12% | 7.14% | 8.16% | 50.86% | 26.23% | 64.04% | 28.07% | 27.12% | |
| Oasis | 35.43% | 52.57% | 58.54% | 50.75% | 26.67% | 36.64% | 66.29% | 10.26% | 82.35% | 14.29% | 11.94% | 52.00% | 35.79% | 71.25% | 59.65% | 44.74% | |
| RD | Train | 62.03% | 68.49% | 63.88% | 77.14% | 84.00% | 72.57% | 81.14% | 33.33% | 83.77% | 10.14% | 15.56% | 74.44% | 63.03% | 79.23% | 55.97% | 59.29% |
| Test1 | 60.00% | 66.86% | 63.11% | 75.47% | 85.56% | 72.64% | 81.71% | 0.00% | 83.63% | 0.00% | #DIV/0! | 71.43% | 57.14% | 76.98% | 49.12% | 52.83% | |
| Oasis | 54.29% | 61.14% | 57.05% | 94.74% | 98.89% | 72.36% | 83.43% | 0.00% | 83.91% | 0.00% | #DIV/0! | 64.00% | 33.33% | 67.52% | 10.53% | 16.00% | |
| V only | Train | 98.26% | 98.51% | 98.02% | 99.00% | 99.00% | 98.51% | 98.76% | 97.06% | 99.10% | 95.65% | 96.35% | 99.26% | 99.25% | 99.26% | 98.51% | 98.88% |
| Test1 | 70.29% | 75.43% | 75.82% | 75.00% | 76.67% | 76.24% | 84.57% | 60.00% | 85.29% | 10.71% | 18.18% | 80.57% | 64.56% | 93.75% | 89.47% | 75.00% | |
| Oasis | 61.14% | 66.29% | 68.24% | 64.44% | 64.44% | 66.29% | 76.57% | 19.05% | 84.42% | 14.29% | 16.33% | 79.43% | 65.22% | 88.68% | 78.95% | 71.43% | |
| VD | Train | 94.79% | 96.28% | 93.02% | 100.00% | 100.00% | 96.39% | 96.03% | 100.00% | 95.43% | 76.81% | 86.89% | 97.27% | 95.56% | 98.13% | 96.27% | 95.91% |
| Test1 | 71.43% | 74.86% | 70.18% | 83.61% | 88.89% | 78.43% | 84.00% | #DIV/0! | 84.00% | 0.00% | #DIV/0! | 84.00% | 73.77% | 89.47% | 78.95% | 76.27% | |
| Oasis | 71.43% | 71.43% | 67.24% | 79.66% | 86.67% | 75.73% | 84.00% | #DIV/0! | 84.00% | 0.00% | #DIV/0! | 87.43% | 79.66% | 91.38% | 82.46% | 81.03% | |
| VRD | Train | 81.14% | 83.62% | 78.15% | 91.52% | 93.00% | 84.93% | 89.58% | 100.00% | 88.83% | 39.13% | 56.25% | 89.08% | 82.61% | 92.45% | 85.07% | 83.82% |
| Test1 | 71.43% | 73.14% | 66.93% | 89.58% | 94.44% | 78.34% | 82.86% | 0.00% | 83.82% | 0.00% | #DIV/0! | 86.86% | 86.96% | 86.82% | 70.18% | 77.67% | |
| Oasis | 68.00% | 70.29% | 67.27% | 75.38% | 82.22% | 74.00% | 80.00% | 23.08% | 84.57% | 10.71% | 14.63% | 85.71% | 80.77% | 87.80% | 73.68% | 77.06% | |
| (b) Various features employed for models building using ensemble classifier (EC). | |||||||||||||||||
| Ensemble | MCI | AD | CN | ||||||||||||||
| Overall Accuracy | Accuracy | Sensitivity | Specificity | Precision | F1 Score | Accuracy | Sensitivity | Specificity | Precision | F1 Score | Accuracy | Sensitivity | Specificity | Precision | F1 Score | ||
| R only | Train | 64.52% | 68.98% | 64.71% | 76.35% | 82.50% | 72.53% | 83.62% | 54.84% | 86.02% | 24.64% | 34.00% | 76.43% | 66.67% | 80.42% | 58.21% | 62.15% |
| Test1 | 49.14% | 58.86% | 57.14% | 63.27% | 80.00% | 66.67% | 78.29% | 8.33% | 83.44% | 3.57% | 5.00% | 61.14% | 35.14% | 68.12% | 22.81% | 27.66% | |
| Oasis | 58.29% | 65.14% | 62.39% | 70.69% | 81.11% | 70.53% | 81.14% | 14.29% | 83.93% | 3.57% | 5.71% | 70.29% | 54.90% | 76.61% | 49.12% | 51.85% | |
| RD | Train | 67.49% | 70.97% | 66.27% | 79.05% | 84.50% | 74.29% | 83.62% | 54.05% | 86.61% | 28.99% | 37.74% | 80.40% | 74.77% | 82.53% | 61.94% | 67.76% |
| Test1 | 53.14% | 61.71% | 58.91% | 69.57% | 84.44% | 69.41% | 81.14% | 22.22% | 84.34% | 7.14% | 10.81% | 63.43% | 40.54% | 69.57% | 26.32% | 31.91% | |
| Oasis | 52.00% | 60.57% | 63.64% | 58.16% | 54.44% | 58.68% | 74.29% | 20.69% | 84.93% | 21.43% | 21.05% | 69.14% | 52.17% | 80.19% | 63.16% | 57.14% | |
| V only | Train | 96.28% | 96.28% | 94.26% | 98.45% | 98.50% | 96.33% | 97.52% | 96.83% | 97.65% | 88.41% | 92.42% | 98.76% | 99.24% | 98.53% | 97.01% | 98.11% |
| Test1 | 73.14% | 73.14% | 69.03% | 80.65% | 86.67% | 76.85% | 82.86% | 0.00% | 83.82% | 0.00% | #DIV/0! | 90.29% | 83.33% | 93.91% | 87.72% | 85.47% | |
| Oasis | 68.00% | 69.71% | 68.32% | 71.62% | 76.67% | 72.25% | 82.29% | 36.36% | 85.37% | 14.29% | 20.51% | 84.00% | 73.02% | 90.18% | 80.70% | 76.67% | |
| VD | Train | 95.29% | 96.28% | 93.84% | 98.96% | 99.00% | 96.35% | 96.28% | 100.00% | 95.70% | 78.26% | 87.80% | 98.01% | 95.65% | 99.25% | 98.51% | 97.06% |
| Test1 | 77.91% | 77.91% | 73.21% | 86.67% | 91.11% | 81.19% | 83.72% | #DIV/0! | 83.72% | 0.00% | #DIV/0! | 94.19% | 86.67% | 98.21% | 96.30% | 91.23% | |
| Oasis | 70.86% | 70.86% | 67.57% | 76.56% | 83.33% | 74.63% | 84.57% | 57.14% | 85.71% | 14.29% | 22.86% | 86.29% | 78.95% | 89.83% | 78.95% | 78.95% | |
| VRD | Train | 93.55% | 94.29% | 91.94% | 96.88% | 97.00% | 94.40% | 96.53% | 100.00% | 95.98% | 79.71% | 88.71% | 96.28% | 93.43% | 97.74% | 95.52% | 94.46% |
| Test1 | 74.86% | 76.00% | 70.00% | 89.09% | 93.33% | 80.00% | 84.00% | 50.00% | 84.39% | 3.57% | 6.67% | 89.71% | 86.79% | 90.98% | 80.70% | 83.64% | |
| Oasis | 69.71% | 72.00% | 74.12% | 70.00% | 70.00% | 72.00% | 80.57% | 40.00% | 88.97% | 42.86% | 41.38% | 86.86% | 78.33% | 91.30% | 82.46% | 80.34% | |
| (c) Various features employed for model building using decision tree (DT). | |||||||||||||||||
| Decision Tree | MCI | AD | CN | ||||||||||||||
| Overall Accuracy | Accuracy | Sensitivity | Specificity | Precision | F1 Score | Accuracy | Sensitivity | Specificity | Precision | F1 Score | Accuracy | Sensitivity | Specificity | Precision | F1 Score | ||
| R only | Train | 58.31% | 65.51% | 62.87% | 69.28% | 74.50% | 68.19% | 80.15% | 36.59% | 85.08% | 21.74% | 27.27% | 70.97% | 56.80% | 77.34% | 52.99% | 54.83% |
| Test1 | 47.43% | 54.86% | 54.55% | 55.56% | 73.33% | 62.56% | 76.00% | 20.83% | 84.77% | 17.86% | 19.23% | 64.00% | 40.00% | 68.97% | 21.05% | 27.59% | |
| Oasis | 54.86% | 56.00% | 53.99% | 83.33% | 97.78% | 69.57% | 85.14% | 100.00% | 84.97% | 7.14% | 13.33% | 68.57% | 60.00% | 69.09% | 10.53% | 17.91% | |
| RD | Train | 62.78% | 70.22% | 65.50% | 78.62% | 84.50% | 73.80% | 82.63% | 46.15% | 83.85% | 8.70% | 14.63% | 72.70% | 59.09% | 79.34% | 58.21% | 58.65% |
| Test1 | 57.71% | 64.00% | 62.86% | 65.71% | 73.33% | 67.69% | 81.14% | 22.22% | 84.34% | 7.14% | 10.81% | 70.29% | 54.10% | 78.95% | 57.89% | 55.93% | |
| Oasis | 57.14% | 61.14% | 58.09% | 71.79% | 87.78% | 69.91% | 82.29% | 36.36% | 85.37% | 14.29% | 20.51% | 70.86% | 60.71% | 72.79% | 29.82% | 40.00% | |
| V only | Train | 82.63% | 87.34% | 87.44% | 87.25% | 87.00% | 87.22% | 88.83% | 65.00% | 94.74% | 75.36% | 69.80% | 89.08% | 86.29% | 90.32% | 79.85% | 82.95% |
| Test1 | 62.86% | 70.86% | 68.93% | 73.61% | 78.89% | 73.58% | 78.29% | 25.00% | 85.16% | 17.86% | 20.83% | 76.57% | 65.38% | 81.30% | 59.65% | 62.39% | |
| Oasis | 64.57% | 70.86% | 70.10% | 71.79% | 75.56% | 72.73% | 78.29% | 22.22% | 84.71% | 14.29% | 17.39% | 80.00% | 68.33% | 86.09% | 71.93% | 70.09% | |
| VD | Train | 84.12% | 86.85% | 86.57% | 87.13% | 87.00% | 86.78% | 88.34% | 68.33% | 91.84% | 59.42% | 63.57% | 93.05% | 87.32% | 96.17% | 92.54% | 89.86% |
| Test1 | 70.86% | 74.86% | 71.70% | 79.71% | 84.44% | 77.55% | 84.00% | 50.00% | 86.96% | 25.00% | 33.33% | 82.86% | 74.55% | 86.67% | 71.93% | 73.21% | |
| Oasis | 70.29% | 74.29% | 70.64% | 80.30% | 85.56% | 77.39% | 82.29% | 41.18% | 86.71% | 25.00% | 31.11% | 84.00% | 79.59% | 85.71% | 68.42% | 73.58% | |
| VRD | Train | 71.22% | 73.70% | 68.65% | 82.12% | 86.50% | 76.55% | 84.86% | 66.67% | 86.02% | 23.19% | 34.41% | 83.87% | 77.17% | 86.96% | 73.13% | 75.10% |
| Test1 | 75.43% | 75.43% | 69.11% | 90.38% | 94.44% | 79.81% | 86.29% | 83.33% | 86.39% | 17.86% | 29.41% | 89.14% | 91.30% | 88.37% | 73.68% | 81.55% | |
| Oasis | 72.00% | 75.43% | 73.27% | 78.38% | 82.22% | 77.49% | 85.14% | 55.00% | 89.03% | 39.29% | 45.83% | 83.43% | 75.93% | 86.78% | 71.93% | 73.87% | |
| (d) Various features employed for model building using feed-forward neural network (FFNN). | |||||||||||||||||
| Feed Forward Neural Network | MCI | AD | CN | ||||||||||||||
| Overall Accuracy | Accuracy | Sensitivity | Specificity | Precision | F1 Score | Accuracy | Sensitivity | Specificity | Precision | F1 Score | Accuracy | Sensitivity | Specificity | Precision | F1 Score | ||
| R only | Train | 73.55% | 75.76% | 70.00% | 85.71% | 89.44% | 78.54% | 85.95% | 78.95% | 86.34% | 24.19% | 37.04% | 85.40% | 79.82% | 87.95% | 75.21% | 77.45% |
| Test1 | 51.43% | 58.29% | 57.26% | 60.34% | 74.44% | 64.73% | 82.86% | 0.00% | 83.82% | 0.00% | #DIV/0! | 61.71% | 41.07% | 71.43% | 40.35% | 40.71% | |
| Oasis | 45.71% | 54.86% | 57.14% | 53.06% | 48.89% | 52.69% | 82.29% | 28.57% | 84.52% | 7.14% | 11.43% | 54.29% | 37.36% | 72.62% | 59.65% | 45.95% | |
| RD | Train | 92.01% | 92.29% | 93.33% | 91.26% | 91.30% | 92.31% | 96.14% | 87.10% | 98.01% | 90.00% | 88.52% | 95.59% | 92.56% | 97.11% | 94.12% | 93.33% |
| Test1 | 55.43% | 64.57% | 62.96% | 67.16% | 75.56% | 68.69% | 76.57% | 21.74% | 84.87% | 17.86% | 19.61% | 69.71% | 54.55% | 74.81% | 42.11% | 47.52% | |
| Oasis | 55.43% | 68.57% | 73.97% | 64.71% | 60.00% | 66.26% | 74.86% | 16.67% | 84.11% | 14.29% | 15.38% | 67.43% | 50.00% | 81.44% | 68.42% | 57.78% | |
| V only | Train | 100.00% | 100.00% | 100.00% | 100.00% | 100.00% | 100.00% | 100.00% | 100.00% | 100.00% | 100.00% | 100.00% | 100.00% | 100.00% | 100.00% | 100.00% | 100.00% |
| Test1 | 61.14% | 64.57% | 65.56% | 63.53% | 65.56% | 65.56% | 79.43% | 16.67% | 84.05% | 7.14% | 10.00% | 78.29% | 63.01% | 89.22% | 80.70% | 70.77% | |
| Oasis | 48.57% | 49.71% | 51.19% | 48.35% | 47.78% | 49.43% | 79.43% | 27.78% | 85.35% | 17.86% | 21.74% | 68.00% | 50.68% | 80.39% | 64.91% | 56.92% | |
| VD | Train | 99.72% | 99.72% | 99.44% | 100.00% | 100.00% | 99.72% | 99.72% | 100.00% | 99.67% | 98.41% | 99.20% | 100.00% | 100.00% | 100.00% | 100.00% | 100.00% |
| Test1 | 65.71% | 67.43% | 67.74% | 67.07% | 70.00% | 68.85% | 77.14% | 22.73% | 84.97% | 17.86% | 20.00% | 86.86% | 78.33% | 91.30% | 82.46% | 80.34% | |
| Oasis | 54.29% | 54.86% | 55.24% | 54.29% | 64.44% | 59.49% | 77.71% | 13.33% | 83.75% | 7.14% | 9.30% | 76.00% | 63.64% | 81.67% | 61.40% | 62.50% | |
| VRD | Train | 99.72% | 99.72% | 99.44% | 100.00% | 100.00% | 99.72% | 100.00% | 100.00% | 100.00% | 100.00% | 100.00% | 99.72% | 100.00% | 99.57% | 99.18% | 99.59% |
| Test1 | 76.57% | 78.29% | 76.53% | 80.52% | 83.33% | 79.79% | 89.71% | 72.73% | 92.16% | 57.14% | 64.00% | 85.14% | 78.18% | 88.33% | 75.44% | 76.79% | |
| Oasis | 73.14% | 74.86% | 78.75% | 71.58% | 70.00% | 74.12% | 88.00% | 62.07% | 93.15% | 64.29% | 63.16% | 83.43% | 71.21% | 90.83% | 82.46% | 76.42% | |
| (a) Model performance using radiomics only in various model-building algorithms | |||||||||||||||||
| R Only | MCI | AD | CN | ||||||||||||||
| Overall Accuracy | Accuracy | Sensitivity | Specificity | Precision | F1 Score | Accuracy | Sensitivity | Specificity | Precision | F1 Score | Accuracy | Sensitivity | Specificity | Precision | F1 Score | ||
| SVM | Train | 67.74% | 73.45% | 70.85% | 76.67% | 79.00% | 74.70% | 83.62% | 52.63% | 88.73% | 43.48% | 47.62% | 78.41% | 69.11% | 82.50% | 63.43% | 66.15% |
| Test1 | 40.57% | 56.00% | 56.99% | 54.88% | 58.89% | 57.92% | 74.29% | 9.52% | 83.12% | 7.14% | 8.16% | 50.86% | 26.23% | 64.04% | 28.07% | 27.12% | |
| Oasis | 35.43% | 52.57% | 58.54% | 50.75% | 26.67% | 36.64% | 66.29% | 10.26% | 82.35% | 14.29% | 11.94% | 52.00% | 35.79% | 71.25% | 59.65% | 44.74% | |
| EC | Train | 64.52% | 68.98% | 64.71% | 76.35% | 82.50% | 72.53% | 83.62% | 54.84% | 86.02% | 24.64% | 34.00% | 76.43% | 66.67% | 80.42% | 58.21% | 62.15% |
| Test1 | 49.14% | 58.86% | 57.14% | 63.27% | 80.00% | 66.67% | 78.29% | 8.33% | 83.44% | 3.57% | 5.00% | 61.14% | 35.14% | 68.12% | 22.81% | 27.66% | |
| Oasis | 58.29% | 65.14% | 62.39% | 70.69% | 81.11% | 70.53% | 81.14% | 14.29% | 83.93% | 3.57% | 5.71% | 70.29% | 54.90% | 76.61% | 49.12% | 51.85% | |
| DT | Train | 58.31% | 65.51% | 62.87% | 69.28% | 74.50% | 68.19% | 80.15% | 36.59% | 85.08% | 21.74% | 27.27% | 70.97% | 56.80% | 77.34% | 52.99% | 54.83% |
| Test1 | 47.43% | 54.86% | 54.55% | 55.56% | 73.33% | 62.56% | 76.00% | 20.83% | 84.77% | 17.86% | 19.23% | 64.00% | 40.00% | 68.97% | 21.05% | 27.59% | |
| Oasis | 54.86% | 56.00% | 53.99% | 83.33% | 97.78% | 69.57% | 85.14% | 100.00% | 84.97% | 7.14% | 13.33% | 68.57% | 60.00% | 69.09% | 10.53% | 17.91% | |
| FFNN | Train | 73.55% | 75.76% | 70.00% | 85.71% | 89.44% | 78.54% | 85.95% | 78.95% | 86.34% | 24.19% | 37.04% | 85.40% | 79.82% | 87.95% | 75.21% | 77.45% |
| Test1 | 51.43% | 58.29% | 57.26% | 60.34% | 74.44% | 64.73% | 82.86% | 0.00% | 83.82% | 0.00% | #DIV/0! | 61.71% | 41.07% | 71.43% | 40.35% | 40.71% | |
| Oasis | 45.71% | 54.86% | 57.14% | 53.06% | 48.89% | 52.69% | 82.29% | 28.57% | 84.52% | 7.14% | 11.43% | 54.29% | 37.36% | 72.62% | 59.65% | 45.95% | |
| (b) Model performance using RD in various model-building algorithms | |||||||||||||||||
| RD | MCI | AD | CN | ||||||||||||||
| Overall Accuracy | Accuracy | Sensitivity | Specificity | Precision | F1 Score | Accuracy | Sensitivity | Specificity | Precision | F1 Score | Accuracy | Sensitivity | Specificity | Precision | F1 Score | ||
| SVM | Train | 62.03% | 68.49% | 63.88% | 77.14% | 84.00% | 72.57% | 81.14% | 33.33% | 83.77% | 10.14% | 15.56% | 74.44% | 63.03% | 79.23% | 55.97% | 59.29% |
| Test1 | 60.00% | 66.86% | 63.11% | 75.47% | 85.56% | 72.64% | 81.71% | 0.00% | 83.63% | 0.00% | #DIV/0! | 71.43% | 57.14% | 76.98% | 49.12% | 52.83% | |
| Oasis | 54.29% | 61.14% | 57.05% | 94.74% | 98.89% | 72.36% | 83.43% | 0.00% | 83.91% | 0.00% | #DIV/0! | 64.00% | 33.33% | 67.52% | 10.53% | 16.00% | |
| EC | Train | 67.49% | 70.97% | 66.27% | 79.05% | 84.50% | 74.29% | 83.62% | 54.05% | 86.61% | 28.99% | 37.74% | 80.40% | 74.77% | 82.53% | 61.94% | 67.76% |
| Test1 | 53.14% | 61.71% | 58.91% | 69.57% | 84.44% | 69.41% | 81.14% | 22.22% | 84.34% | 7.14% | 10.81% | 63.43% | 40.54% | 69.57% | 26.32% | 31.91% | |
| Oasis | 52.00% | 60.57% | 63.64% | 58.16% | 54.44% | 58.68% | 74.29% | 20.69% | 84.93% | 21.43% | 21.05% | 69.14% | 52.17% | 80.19% | 63.16% | 57.14% | |
| DT | Train | 62.78% | 70.22% | 65.50% | 78.62% | 84.50% | 73.80% | 82.63% | 46.15% | 83.85% | 8.70% | 14.63% | 72.70% | 59.09% | 79.34% | 58.21% | 58.65% |
| Test1 | 57.71% | 64.00% | 62.86% | 65.71% | 73.33% | 67.69% | 81.14% | 22.22% | 84.34% | 7.14% | 10.81% | 70.29% | 54.10% | 78.95% | 57.89% | 55.93% | |
| Oasis | 57.14% | 61.14% | 58.09% | 71.79% | 87.78% | 69.91% | 82.29% | 36.36% | 85.37% | 14.29% | 20.51% | 70.86% | 60.71% | 72.79% | 29.82% | 40.00% | |
| FFNN | Train | 92.01% | 92.29% | 93.33% | 91.26% | 91.30% | 92.31% | 96.14% | 87.10% | 98.01% | 90.00% | 88.52% | 95.59% | 92.56% | 97.11% | 94.12% | 93.33% |
| Test1 | 55.43% | 64.57% | 62.96% | 67.16% | 75.56% | 68.69% | 76.57% | 21.74% | 84.87% | 17.86% | 19.61% | 69.71% | 54.55% | 74.81% | 42.11% | 47.52% | |
| Oasis | 55.43% | 68.57% | 73.97% | 64.71% | 60.00% | 66.26% | 74.86% | 16.67% | 84.11% | 14.29% | 15.38% | 67.43% | 50.00% | 81.44% | 68.42% | 57.78% | |
| (c) Model performance using volumes only in various model-building algorithms | |||||||||||||||||
| V only | MCI | AD | CN | ||||||||||||||
| Overall Accuracy | Accuracy | Sensitivity | Specificity | Precision | F1 Score | Accuracy | Sensitivity | Specificity | Precision | F1 Score | Accuracy | Sensitivity | Specificity | Precision | F1 Score | ||
| SVM | Train | 98.26% | 98.51% | 98.02% | 99.00% | 99.00% | 98.51% | 98.76% | 97.06% | 99.10% | 95.65% | 96.35% | 99.26% | 99.25% | 99.26% | 98.51% | 98.88% |
| Test1 | 70.29% | 75.43% | 75.82% | 75.00% | 76.67% | 76.24% | 84.57% | 60.00% | 85.29% | 10.71% | 18.18% | 80.57% | 64.56% | 93.75% | 89.47% | 75.00% | |
| Oasis | 61.14% | 66.29% | 68.24% | 64.44% | 64.44% | 66.29% | 76.57% | 19.05% | 84.42% | 14.29% | 16.33% | 79.43% | 65.22% | 88.68% | 78.95% | 71.43% | |
| EC | Train | 96.28% | 96.28% | 94.26% | 98.45% | 98.50% | 96.33% | 97.52% | 96.83% | 97.65% | 88.41% | 92.42% | 98.76% | 99.24% | 98.53% | 97.01% | 98.11% |
| Test1 | 73.14% | 73.14% | 69.03% | 80.65% | 86.67% | 76.85% | 82.86% | 0.00% | 83.82% | 0.00% | #DIV/0! | 90.29% | 83.33% | 93.91% | 87.72% | 85.47% | |
| Oasis | 68.00% | 69.71% | 68.32% | 71.62% | 76.67% | 72.25% | 82.29% | 36.36% | 85.37% | 14.29% | 20.51% | 84.00% | 73.02% | 90.18% | 80.70% | 76.67% | |
| DT | Train | 82.63% | 87.34% | 87.44% | 87.25% | 87.00% | 87.22% | 88.83% | 65.00% | 94.74% | 75.36% | 69.80% | 89.08% | 86.29% | 90.32% | 79.85% | 82.95% |
| Test1 | 62.86% | 70.86% | 68.93% | 73.61% | 78.89% | 73.58% | 78.29% | 25.00% | 85.16% | 17.86% | 20.83% | 76.57% | 65.38% | 81.30% | 59.65% | 62.39% | |
| Oasis | 64.57% | 70.86% | 70.10% | 71.79% | 75.56% | 72.73% | 78.29% | 22.22% | 84.71% | 14.29% | 17.39% | 80.00% | 68.33% | 86.09% | 71.93% | 70.09% | |
| FFNN | Train | 100.00% | 100.00% | 100.00% | 100.00% | 100.00% | 100.00% | 100.00% | 100.00% | 100.00% | 100.00% | 100.00% | 100.00% | 100.00% | 100.00% | 100.00% | 100.00% |
| Test1 | 61.14% | 64.57% | 65.56% | 63.53% | 65.56% | 65.56% | 79.43% | 16.67% | 84.05% | 7.14% | 10.00% | 78.29% | 63.01% | 89.22% | 80.70% | 70.77% | |
| Oasis | 48.57% | 49.71% | 51.19% | 48.35% | 47.78% | 49.43% | 79.43% | 27.78% | 85.35% | 17.86% | 21.74% | 68.00% | 50.68% | 80.39% | 64.91% | 56.92% | |
| (d) Model performance using VD in various model-building algorithms | |||||||||||||||||
| VD | MCI | AD | CN | ||||||||||||||
| Overall Accuracy | Accuracy | Sensitivity | Specificity | Precision | F1 Score | Accuracy | Sensitivity | Specificity | Precision | F1 Score | Accuracy | Sensitivity | Specificity | Precision | F1 Score | ||
| SVM | Train | 94.79% | 96.28% | 93.02% | 100.00% | 100.00% | 96.39% | 96.03% | 100.00% | 95.43% | 76.81% | 86.89% | 97.27% | 95.56% | 98.13% | 96.27% | 95.91% |
| Test1 | 71.43% | 74.86% | 70.18% | 83.61% | 88.89% | 78.43% | 84.00% | #DIV/0! | 84.00% | 0.00% | #DIV/0! | 84.00% | 73.77% | 89.47% | 78.95% | 76.27% | |
| Oasis | 71.43% | 71.43% | 67.24% | 79.66% | 86.67% | 75.73% | 84.00% | #DIV/0! | 84.00% | 0.00% | #DIV/0! | 87.43% | 79.66% | 91.38% | 82.46% | 81.03% | |
| EC | Train | 95.29% | 96.28% | 93.84% | 98.96% | 99.00% | 96.35% | 96.28% | 100.00% | 95.70% | 78.26% | 87.80% | 98.01% | 95.65% | 99.25% | 98.51% | 97.06% |
| Test1 | 77.91% | 77.91% | 73.21% | 86.67% | 91.11% | 81.19% | 83.72% | #DIV/0! | 83.72% | 0.00% | #DIV/0! | 94.19% | 86.67% | 98.21% | 96.30% | 91.23% | |
| Oasis | 70.86% | 70.86% | 67.57% | 76.56% | 83.33% | 74.63% | 84.57% | 57.14% | 85.71% | 14.29% | 22.86% | 86.29% | 78.95% | 89.83% | 78.95% | 78.95% | |
| DT | Train | 84.12% | 86.85% | 86.57% | 87.13% | 87.00% | 86.78% | 88.34% | 68.33% | 91.84% | 59.42% | 63.57% | 93.05% | 87.32% | 96.17% | 92.54% | 89.86% |
| Test1 | 70.86% | 74.86% | 71.70% | 79.71% | 84.44% | 77.55% | 84.00% | 50.00% | 86.96% | 25.00% | 33.33% | 82.86% | 74.55% | 86.67% | 71.93% | 73.21% | |
| Oasis | 70.29% | 74.29% | 70.64% | 80.30% | 85.56% | 77.39% | 82.29% | 41.18% | 86.71% | 25.00% | 31.11% | 84.00% | 79.59% | 85.71% | 68.42% | 73.58% | |
| FFNN | Train | 99.72% | 99.72% | 99.44% | 100.00% | 100.00% | 99.72% | 99.72% | 100.00% | 99.67% | 98.41% | 99.20% | 100.00% | 100.00% | 100.00% | 100.00% | 100.00% |
| Test1 | 65.71% | 67.43% | 67.74% | 67.07% | 70.00% | 68.85% | 77.14% | 22.73% | 84.97% | 17.86% | 20.00% | 86.86% | 78.33% | 91.30% | 82.46% | 80.34% | |
| Oasis | 54.29% | 54.86% | 55.24% | 54.29% | 64.44% | 59.49% | 77.71% | 13.33% | 83.75% | 7.14% | 9.30% | 76.00% | 63.64% | 81.67% | 61.40% | 62.50% | |
| (e) Model performance using VRD in various model-building algorithms | |||||||||||||||||
| VRD | MCI | AD | CN | ||||||||||||||
| Overall Accuracy | Accuracy | Sensitivity | Specificity | Precision | F1 Score | Accuracy | Sensitivity | Specificity | Precision | F1 Score | Accuracy | Sensitivity | Specificity | Precision | F1 Score | ||
| SVM | Train | 81.14% | 83.62% | 78.15% | 91.52% | 93.00% | 84.93% | 89.58% | 100.00% | 88.83% | 39.13% | 56.25% | 89.08% | 82.61% | 92.45% | 85.07% | 83.82% |
| Test1 | 71.43% | 73.14% | 66.93% | 89.58% | 94.44% | 78.34% | 82.86% | 0.00% | 83.82% | 0.00% | #DIV/0! | 86.86% | 86.96% | 86.82% | 70.18% | 77.67% | |
| Oasis | 68.00% | 70.29% | 67.27% | 75.38% | 82.22% | 74.00% | 80.00% | 23.08% | 84.57% | 10.71% | 14.63% | 85.71% | 80.77% | 87.80% | 73.68% | 77.06% | |
| EC | Train | 93.55% | 94.29% | 91.94% | 96.88% | 97.00% | 94.40% | 96.53% | 100.00% | 95.98% | 79.71% | 88.71% | 96.28% | 93.43% | 97.74% | 95.52% | 94.46% |
| Test1 | 74.86% | 76.00% | 70.00% | 89.09% | 93.33% | 80.00% | 84.00% | 50.00% | 84.39% | 3.57% | 6.67% | 89.71% | 86.79% | 90.98% | 80.70% | 83.64% | |
| Oasis | 69.71% | 72.00% | 74.12% | 70.00% | 70.00% | 72.00% | 80.57% | 40.00% | 88.97% | 42.86% | 41.38% | 86.86% | 78.33% | 91.30% | 82.46% | 80.34% | |
| DT | Train | 71.22% | 73.70% | 68.65% | 82.12% | 86.50% | 76.55% | 84.86% | 66.67% | 86.02% | 23.19% | 34.41% | 83.87% | 77.17% | 86.96% | 73.13% | 75.10% |
| Test1 | 75.43% | 75.43% | 69.11% | 90.38% | 94.44% | 79.81% | 86.29% | 83.33% | 86.39% | 17.86% | 29.41% | 89.14% | 91.30% | 88.37% | 73.68% | 81.55% | |
| Oasis | 72.00% | 75.43% | 73.27% | 78.38% | 82.22% | 77.49% | 85.14% | 55.00% | 89.03% | 39.29% | 45.83% | 83.43% | 75.93% | 86.78% | 71.93% | 73.87% | |
| FFNN | Train | 99.72% | 99.72% | 99.44% | 100.00% | 100.00% | 99.72% | 100.00% | 100.00% | 100.00% | 100.00% | 100.00% | 99.72% | 100.00% | 99.57% | 99.18% | 99.59% |
| Test1 | 76.57% | 78.29% | 76.53% | 80.52% | 83.33% | 79.79% | 89.71% | 72.73% | 92.16% | 57.14% | 64.00% | 85.14% | 78.18% | 88.33% | 75.44% | 76.79% | |
| Oasis | 73.14% | 74.86% | 78.75% | 71.58% | 70.00% | 74.12% | 88.00% | 62.07% | 93.15% | 64.29% | 63.16% | 83.43% | 71.21% | 90.83% | 82.46% | 76.42% | |
Disclaimer/Publisher’s Note: The statements, opinions and data contained in all publications are solely those of the individual author(s) and contributor(s) and not of MDPI and/or the editor(s). MDPI and/or the editor(s) disclaim responsibility for any injury to people or property resulting from any ideas, methods, instructions or products referred to in the content. |
© 2024 by the authors. Licensee MDPI, Basel, Switzerland. This article is an open access article distributed under the terms and conditions of the Creative Commons Attribution (CC BY) license (https://creativecommons.org/licenses/by/4.0/).
Share and Cite
Cheung, E.Y.W.; Wu, R.W.K.; Chu, E.S.M.; Mak, H.K.F. Integrating Demographics and Imaging Features for Various Stages of Dementia Classification: Feed Forward Neural Network Multi-Class Approach. Biomedicines 2024, 12, 896. https://doi.org/10.3390/biomedicines12040896
Cheung EYW, Wu RWK, Chu ESM, Mak HKF. Integrating Demographics and Imaging Features for Various Stages of Dementia Classification: Feed Forward Neural Network Multi-Class Approach. Biomedicines. 2024; 12(4):896. https://doi.org/10.3390/biomedicines12040896
Chicago/Turabian StyleCheung, Eva Y. W., Ricky W. K. Wu, Ellie S. M. Chu, and Henry K. F. Mak. 2024. "Integrating Demographics and Imaging Features for Various Stages of Dementia Classification: Feed Forward Neural Network Multi-Class Approach" Biomedicines 12, no. 4: 896. https://doi.org/10.3390/biomedicines12040896