
Decision-Making Model of Mechanical Components in a Lean–Green Manufacturing System Based on Carbon Benefit and Its Application

1
School of Economics & Management, Shaoyang University, Shaoyang 422000, China
2
School of Computer and Information, Qiannan Normal University for Nationalities, Duyun 558000, China
3
Key Laboratory of Complex Systems and Intelligent Optimization of Guizhou Province, Duyun 558000, China
4
Key Laboratory of Complex Systems and Intelligent Optimization of Qiannan, Duyun 558000, China
*
Author to whom correspondence should be addressed.
Processes 2022, 10(11), 2297; https://doi.org/10.3390/pr10112297
Submission received: 19 October 2022
/
Revised: 2 November 2022
/
Accepted: 3 November 2022
/
Published: 4 November 2022
(This article belongs to the Special Issue Automation Control Systems & Process Control for Industry 4.0)
Abstract
:The key to achieving low-carbon manufacturing is to effectively reduce the carbon emissions of production systems and improve carbon benefits. The use of lean and green tools aids in measuring the added value of products, and increases the efficiency and sustainability of production systems. To address this problem and verify that the synergetic relationship between lean and green innovation increases the efficiency and sustainability in production systems, a new low-carbon manufacturing evaluation indicator—carbon benefit—in lean manufacturing systems was discussed. A low-carbon decision-making model of multiple processes aiming at carbon benefit maximization, as well as the dynamic characteristics of carbon benefit and sustainable process improvements in a lean production system, was established. A case study of a certain satellite dish parts manufacturing line was introduced to analyze and verify the feasibility of the proposed model. After improvement, the processing time of unit parts was reduced from 63 s to 54 s. The workstations were optimized again according to the lean–green manufacturing concept, and the number was reduced by 37.5%. The process was recombined and reduced from 8 to 5 to achieve continuous-flow processing. This reduced the distance by 77 m, and at the same time, the number of operating personnel was reduced, and the after-improvement carbon efficiency increased from 12.98 s/kg CO2e to 36.33 s/kg CO2e in comparison with that before the improvement. The carbon benefit after improvement was 193.92% higher than that before the improvement.
1. Introduction
According to the 2014 International Energy Agency’s report on the “Five Key Technologies for Low Carbon Energy Outlook”, more than 80% of nearly two-thirds of the greenhouse gas emissions worldwide are comprised of carbon dioxide [1]. Enterprises’ strategies and consumer preferences have been focusing increasingly on environmental protection. To date, an increasing number of transnational companies have adopted the lean–green philosophy to maintain competitive power in the global market. The automobile manufacturing industry is also a pioneer in implementing lean–green manufacturing technology. For instance, Toyota has realized sustainable management using lean–green. In 2015, Toyota Motor Corporation made contributions to the realization of sustainable development society and released the strategy of “Toyota Environmental Challenge 2050”. Aiming at global environmental problems such as climate change, water resource shortage, resource depletion, and biodiversity reduction, the strategy launched six challenges in three major areas, namely, “building better cars”, “better production activities”, and “a better city and a better society”, with the goal of “making the negative impact of cars infinitely close to zero” and “bringing positive energy to society”. Most manufacturing companies understand and accept this philosophy. The concept of lean production involves increasing the efficiency and quality of the entire manufacturing process while lowering the cost by eliminating waste in the product/service manufacturing process [2]. Lean production has a series of practical methods and tools to reduce manufacturing waste, eliminate negative environmental impacts, save resources and energy sources, and increase efficiency and benefits [3]. Furthermore, lean production is beneficial for relieving environmental pollution, removing barriers for enterprises to import and use new pollution control technologies, building a conducive atmosphere for enterprises to thrive, and emphasizing the benefits of enterprises by relieving environmental pollution. In addition, 3R technologies (reduce, reuse, and recycle) in green manufacturing present similar attributes to those of lean production. Enterprises should adopt green environmental production design and recycling parts in the manufacturing process while eliminating waste, thereby continuously improving the environment through lean production.
In recent years, market dynamics have changed with the rise of operations, environmental, social, and quality improvement methods (e.g., Lean, Six Sigma, and Green), and increasing attention has been paid to environmental and social responsibility [4,5,6]. Traditionally, productivity and profitability, as well as recent quality, customer satisfaction, and flexibility, have been the major concerns for organizations [7,8,9,10,11]. However, organizations are forced to reconsider how to manage their processes and operations and seek innovative ways of doing business in response to governmental environmental regulations and customer demands for environmentally sustainable services and products [12,13,14]. Thus, the challenge for the organization is to achieve economic success through strategies that are compatible with and support environmental and social sustainability to meet all stakeholder requirements [15]. To this end, lean and green technologies have become an important part of sustainable solutions [5,16]. Lean refers to eliminating waste in all production areas, supplier networks, design, and plant management [17], thus potentially increasing resource efficiency and reducing the environmental impact [18,19]. Green manufacturing is an integrated approach designed to reduce negative environmental impacts and waste in all areas of the product and service life cycle [20]. This enables companies to achieve a range of long-term performances, especially in reducing costs through a more efficient use of resources [21].
There are usually seven sources of wastes at a production site: overproduction, inventory, transportation, over-processing, over-action, waiting, and defects. Although the EPA (United States Environmental Protection Agency) has proposed a relationship between the seven wastes and their environmental impacts, most current literature only focuses on the seven wastes from the production management level [22]. Currently, only few studies have estimated the carbon emissions generated by analyzing and quantifying the seven wastes. Therefore, this study proposes an improved model of the process optimization method for collecting carbon emissions from production equipment, materials, transportation, and storage in the form of time flow, energy flow, material flow, transport flow, and carbon emissions: visualization of carbon emissions, quantification of value-added carbon emissions and non-value-added carbon emissions in production, and establishment of mathematical models based on carbon efficiency. The carbon emissions generated by the seven wastes were analyzed and quantified. Application analysis of the metal stamping part production process was conducted to verify the feasibility of the model.
Therefore, the objectives of this research were formulated as follows:
- (1)
- To analyze the functional characteristics of three types of carbon emissions in the typical mechanical manufacturing process, such as material carbon, energy carbon, and process carbon, establish the carbon emission characteristic function of manufacturing system, quickly estimate and quantify the carbon emissions of products, and illustrate the application of this function in the selection of processing methods and processing sequences in process planning through a case study.
- (2)
- To research low-carbon manufacturing process decision-making problems combined with a green ideas lean transformation product manufacturing system, explore the ability of different process route selections for low-carbon manufacturing of components, put forward the key decision-making indicators and quantitative analysis method (a process decision-making model based on low carbon efficiency), and improve the product line layout and the overall carbon efficiency improvement.
- (3)
- To demonstrate that environmental innovation and the transformation of production systems to lean systems can improve revenues, reduce costs, fulfill better social responsibility, and achieve corporate sustainability.
The paper consists of five parts. The rest of the paper is structured as follows: Section 2 presents the study background, namely the concepts of lean manufacturing, green manufacturing, and the lean–green. The research methodology is discussed in Section 3, followed by a presentation of the case study in Section 4. In the last section, some conclusions are drawn.
2. Background
This section presents some concepts of lean manufacturing, green manufacturing, and the lean–green synergetic model.
2.1. Lean Manufacturing
Lean Manufacturing (LM) can be viewed as a convergent sociotechnical approach aimed at reducing waste by minimizing manufacturing changes. Large corporations and SMEs strive to achieve considerable improvements in operational performance [23,24,25]. The implementation of lean manufacturing practices enables a business to remain competitive and thrive in the long term as it focuses on the pursuit of business operations that deliver value to customers.
Lean manufacturing is recognized for its long-term business goals of eliminating waste on the factory floor and in service. It is an organizational model that originated in Toyota Motor Corporation’s Toyota Production System and enabled the company to remain competitive and thrive in a highly competitive automotive market under highly restrictive circumstances. MIT studied the success of TPS, characterized it in many success-based cases and events, and popularized the concept, which was then adopted by many manufacturing companies to improve the shop-floor-related management operating efficiency [23,24,25]. Lean thinking aims to achieve the goals of high quality, low cost, and shorter lead times by reducing waste in operational and supply chain processes. The seven types of waste involved are stock on hand, transportation, overproduction, processing, body motion, defects, and waiting [23,24,25,26,27,28]. To achieve this, academia and industry have summarized and developed many practical tools and techniques, including supplier quality management, lean supply chain, just-in-time, automation with herringbone, employee engagement, quality circles, hierarchical scheduling, Kanban, process manufacturing, one-flow production, visual control, employee engagement, SMED, poka-yoke, VSM, TPM, and 5S [2,7,20,22,26,29,30,31,32].
2.2. Green Manufacturing
While implementing lean production, manufacturing enterprises must also be regulated by environmental laws and regulations in the production process to reduce its environmental impact, prevent pollution, and control pollution by adopting green manufacturing throughout the product life cycle. Green manufacturing (GM) refers to a modern manufacturing model that comprehensively considers environmental impact and resource efficiency on the premise of ensuring product function, quality, and cost. This ensures the design, manufacture, and use of scrap in the entire product life cycle, thereby minimizing or producing no environmental pollution in line with environmental protection requirements. It is also harmless or minimally harmful to the ecological environment, saving resources and energy and minimizing energy consumption [7,14,33,34,35,36,37,38,39,40,41,42,43,44,45,46].
In the product manufacturing process of manufacturing enterprises, the green manufacturing model mainly eliminates the negative environmental output of products through cleaner production, product life cycle management, an environmental management system (ISO14000 standard, among others), remanufacturing, and other methods and tools [47]. The goal of green manufacturing is to minimize the impact on the environment (negative effect) and maximize the utilization of resources in the entire product life cycle from design, manufacturing, packaging, transportation, and use of scrapping, and to coordinate and optimize the economic and social benefits of the enterprise [7,14,33,34,35,36,37,38,39,40,41,42,43,44,45,46]. In summary, the implementation of green manufacturing will provide many benefits to manufacturing enterprises.
2.3. The Integrated Relationship between Lean–Green Paradigms
Two paradigms, lean and green manufacturing, have been independently studied in the literature. However, the manufacturing system is highly complex, and a single approach to improve performance is often insufficient. The complex internal coupling relationship, key factors, and important interactions within the manufacturing system cannot be ignored, because the manufacturing performance is affected by multiple factors. The integration of lean and green practices is jointly promoted by internal factors such as risk management, profitability, and cost; changes in corporate culture; a focus on continuous innovation and process improvement; external factors such as customer and environmental pressure, government policies and regulations, and the potential for further profit by increasing customer value [7,14,33,34,35,36,37,38,40,41,42,43,44,45,46].
The practices of lean and green integration have many similarities, including reducing waste; practical tools to eliminate waste; shortening delivery and lead time; cooperating with suppliers; jointly improving environmental efficiency and profitability; realizing the economic, social, and environmental benefits of business organizations. Many scholars have verified that the key synergy between the two paradigms is reducing waste in the manufacturing process and/or operations in the supply chain [34,35,36,37,38,39,40,41,42,43,44,45,46,47,48,49]. In addition, lean and green practice aims to minimize the waste of transportation and handling to consequently save costs (lean), reduce CO2 emissions (green), and shorten waiting and delivery times. Therefore, the synergy between lean and eco-efficient methods, commonly known as lean–green, is an arduous task.
3. Methodology
3.1. Mathematical Models
3.1.1. Definition of Carbon Benefit and Carbon Efficiency
In the actual manufacturing process, after optimizing and improving the production line using the lean–green manufacturing methods and reforming the product mechanical process, a variety of different process selections can be used. Therefore, there are substantial differences in the production time, cost benefit, and energy consumption of the manufacturing process of the same production. To evaluate the actual improvement effect of lean–green manufacturing in the product manufacturing process, we must consider the main evaluation indicators of lean–green manufacturing theory—production efficiency, production benefit, production cycle time, and carbon emissions; this study uses two evaluation index systems of carbon efficiency and carbon benefit.
Carbon benefit (CB) refers to the economic benefit created by consuming unit time and producing unit carbon emission. Its mathematical expression is as follows:
where B is the economic benefit generated by the processing unit product, C is the carbon emissions produced by the processing unit product, and T is the production cycle or beat time of the processing unit product.
In the present study, an evaluation indicator of carbon efficiency was used to create more value and produce less environmental impact in lean production, thereby achieving certain production objectives [50,51,52,53]. According to [54], the formula can be expressed as:
where k is a factor assigned to calculate the data, tva is the value-added time, and Ctotal is total carbon emissions.
3.1.2. Calculation of Carbon Emissions
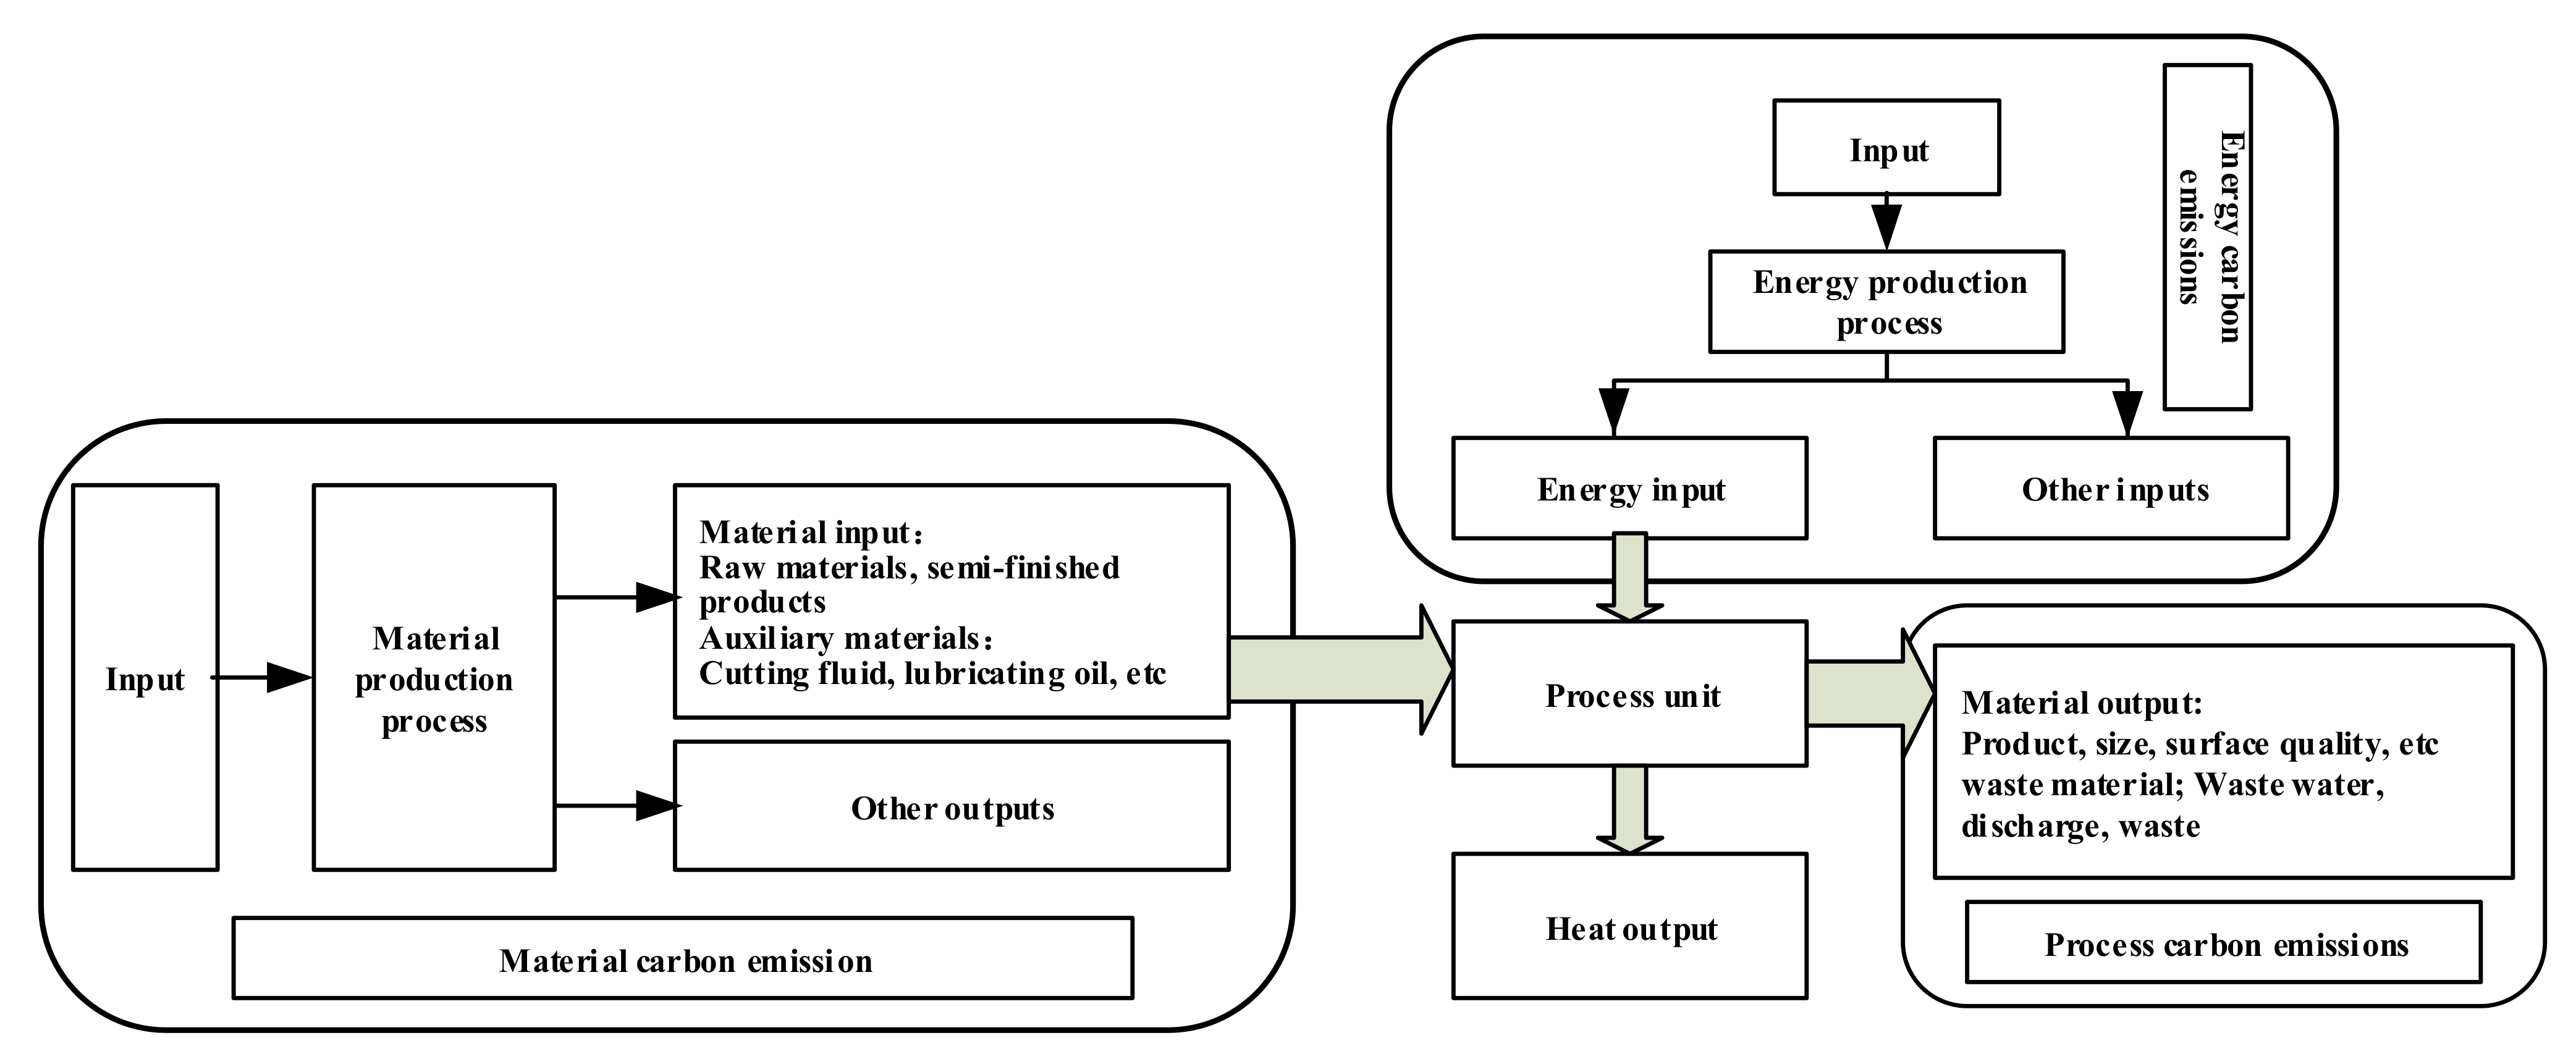
The conversion process of product manufacturing is analyzed from the input of various production factors (raw materials, auxiliary materials, and energy) and the output of products and waste. Simultaneously, part of the input energy is converted into useful work, and part of it is output into heat energy. The IPO process used in production is shown in Figure 1. The carbon emissions generated during the manufacturing process are composed of direct and indirect carbon emissions, as shown in Figure 2. Cdirect refers to the carbon emissions generated by fuel combustion in the production process, which directly changes the shape, size, and performance of raw materials, and the carbon emissions generated by the mutual chemical interaction of auxiliary materials in the production process, such as CO2, NOx, and other gases generated in the casting or heat treatment process. Cindirect refers to carbon emissions calculated by the conversion coefficient of carbon emissions of raw materials, energy consumption of production equipment, and auxiliary materials used in the production process of products.
The Cdirect of the product manufacturing process mainly comprises the direct carbon emission of each manufacturing process. The carbon emissions generated by the manufacturing process are primarily from three sources: from the plastic deformation process, the machining process such as cutting, and the assembly process. The formula for calculating Cdirect in the manufacturing process is as follows:
where N1 is the type of plastic deformation and other processes; Wij is the weight of the i-th material using the j-th plastic deformation process; E1ij is the embodied energy consumption of the i-th material for the j-th plastic deformation; N2 is the type of cutting and other processes; Vij is the amount of removal or treatment of the i-th material for the j-th mechanical process; E2ij is the specific energy consumption of the i-th material for the j-th process; E0 is the total energy consumption of the assembly workshop; T0 is the current calculated product assembly man-hour quota; nk is the quantity of k-type products in the workshop number; Tk is the assembly man-hour quota of k-type products; EFeleck is the discharge coefficient of electric energy, whose value is 2.41 kgCO2e/kWh.
Cindirect represents the carbon emissions generated by the energy consumption of raw materials in the product manufacturing process, auxiliary materials, and production equipment. The formula for Cindirect is as follows:
where C is the carbon emissions of the raw materials, Cam is the carbon emissions of the auxiliary materials, CE is the carbon emissions of the energy consumed by the equipment to maintain basic operation, Cshop is the carbon emissions of workshop auxiliary equipment, Q is the annual output of the workshop, qm is the weight of the initial input raw materials, Cami is the carbon emissions of the i-th type of auxiliary material, Ni is the number of products in the i-th type of auxiliary material during its service life, Eidle,j is the no-load energy consumption of the j-th type of equipment, Ej is the specific energy consumption of the j-th processing method, and mj is the weight of the workpiece.
Carbon emissions emanate from multiple sources, such as indirect and direct carbon emissions, in mechanical manufacturing systems. In a lean production system, the production process is divided into value-creating and non-value-creating processes in the manufacturing system. In summary, this equation expresses the total carbon emissions (5).
According to this study [23], the carbon emissions of the value-creating process calculation formula (Cva) are as follows:
where is the weight of the j-th consumption of the raw material of the single piece product of the i-th process; is the carbon emission coefficient of the j-th consumption of the raw material of the i-th process; is the material utilization ratio of the j-th consumption of the raw material of the i-th process; is the no-load energy consumption of the l-th piece of equipment of the i-th process; is the rated power of the lth piece of equipment of the i-th process; is the effective working time of the l-th piece of equipment of the i-th process (value-added time).
3.1.3. Calculation of Carbon Emissions Generated by the Seven Wastes
According to the environmental impact shown in this study [54], carbon emissions generated (Cwastes) by the seven wastes can be calculated as follows:
The meaning of each parameter in Formula (7) is explained in the papers [54,55,56]. During the manufacturing process, the raw materials or semi-finished products that need to be processed owing to the dispersion of equipment are moved between each process. Therefore, the transportation carbon emission Ct is:
where, to is the type of transportation mode adopted in the process of transportation or movement, Dt is the distance of the t-th mode of transportation, and TEt is the carbon emission coefficient of the t-th mode of transportation.
In conclusion, the manufacturing process of mechanical products includes parts machining and whole machine assembly. Manufacturing processes such as casting, extrusion, stamping, cold/hot rolling, turning, milling, grinding, surface hardening, annealing, and tempering may be involved in the processing of parts. According to statistics, in the process of mechanical manufacturing, carbon emissions mainly come from the consumption of electric energy [57]. Therefore, when calculating the carbon emissions of machine tool manufacturing processes, this paper focuses on the carbon emissions caused by the energy consumption of the process. For the carbon emissions of plastic deformation processes such as stamping, it can be calculated according to the embodied energy of the process [58]. The energy consumption of turning, milling, surface hardening, annealing, and tempering processes can be calculated according to the specific energy of the process [57]. Energy consumption in the assembly process shall be allocated according to the total energy consumption of the assembly workshop, the working hour quota, and the assembly quantity of various types of machine tools during a period of time after investigation.
4. Case Study
4.1. Problem Description and Data Collection
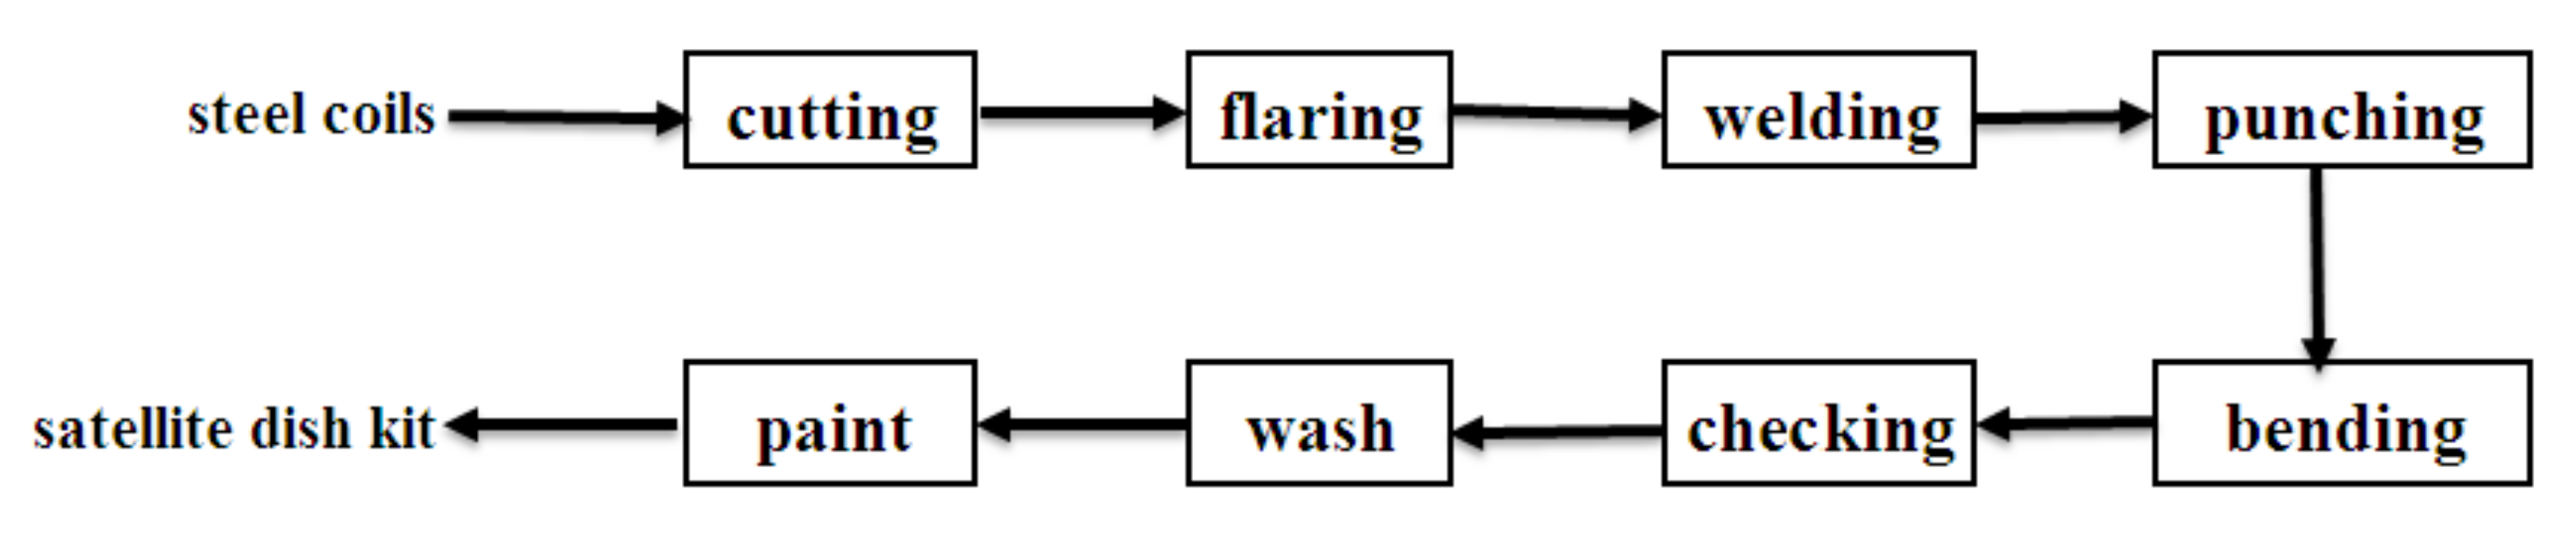
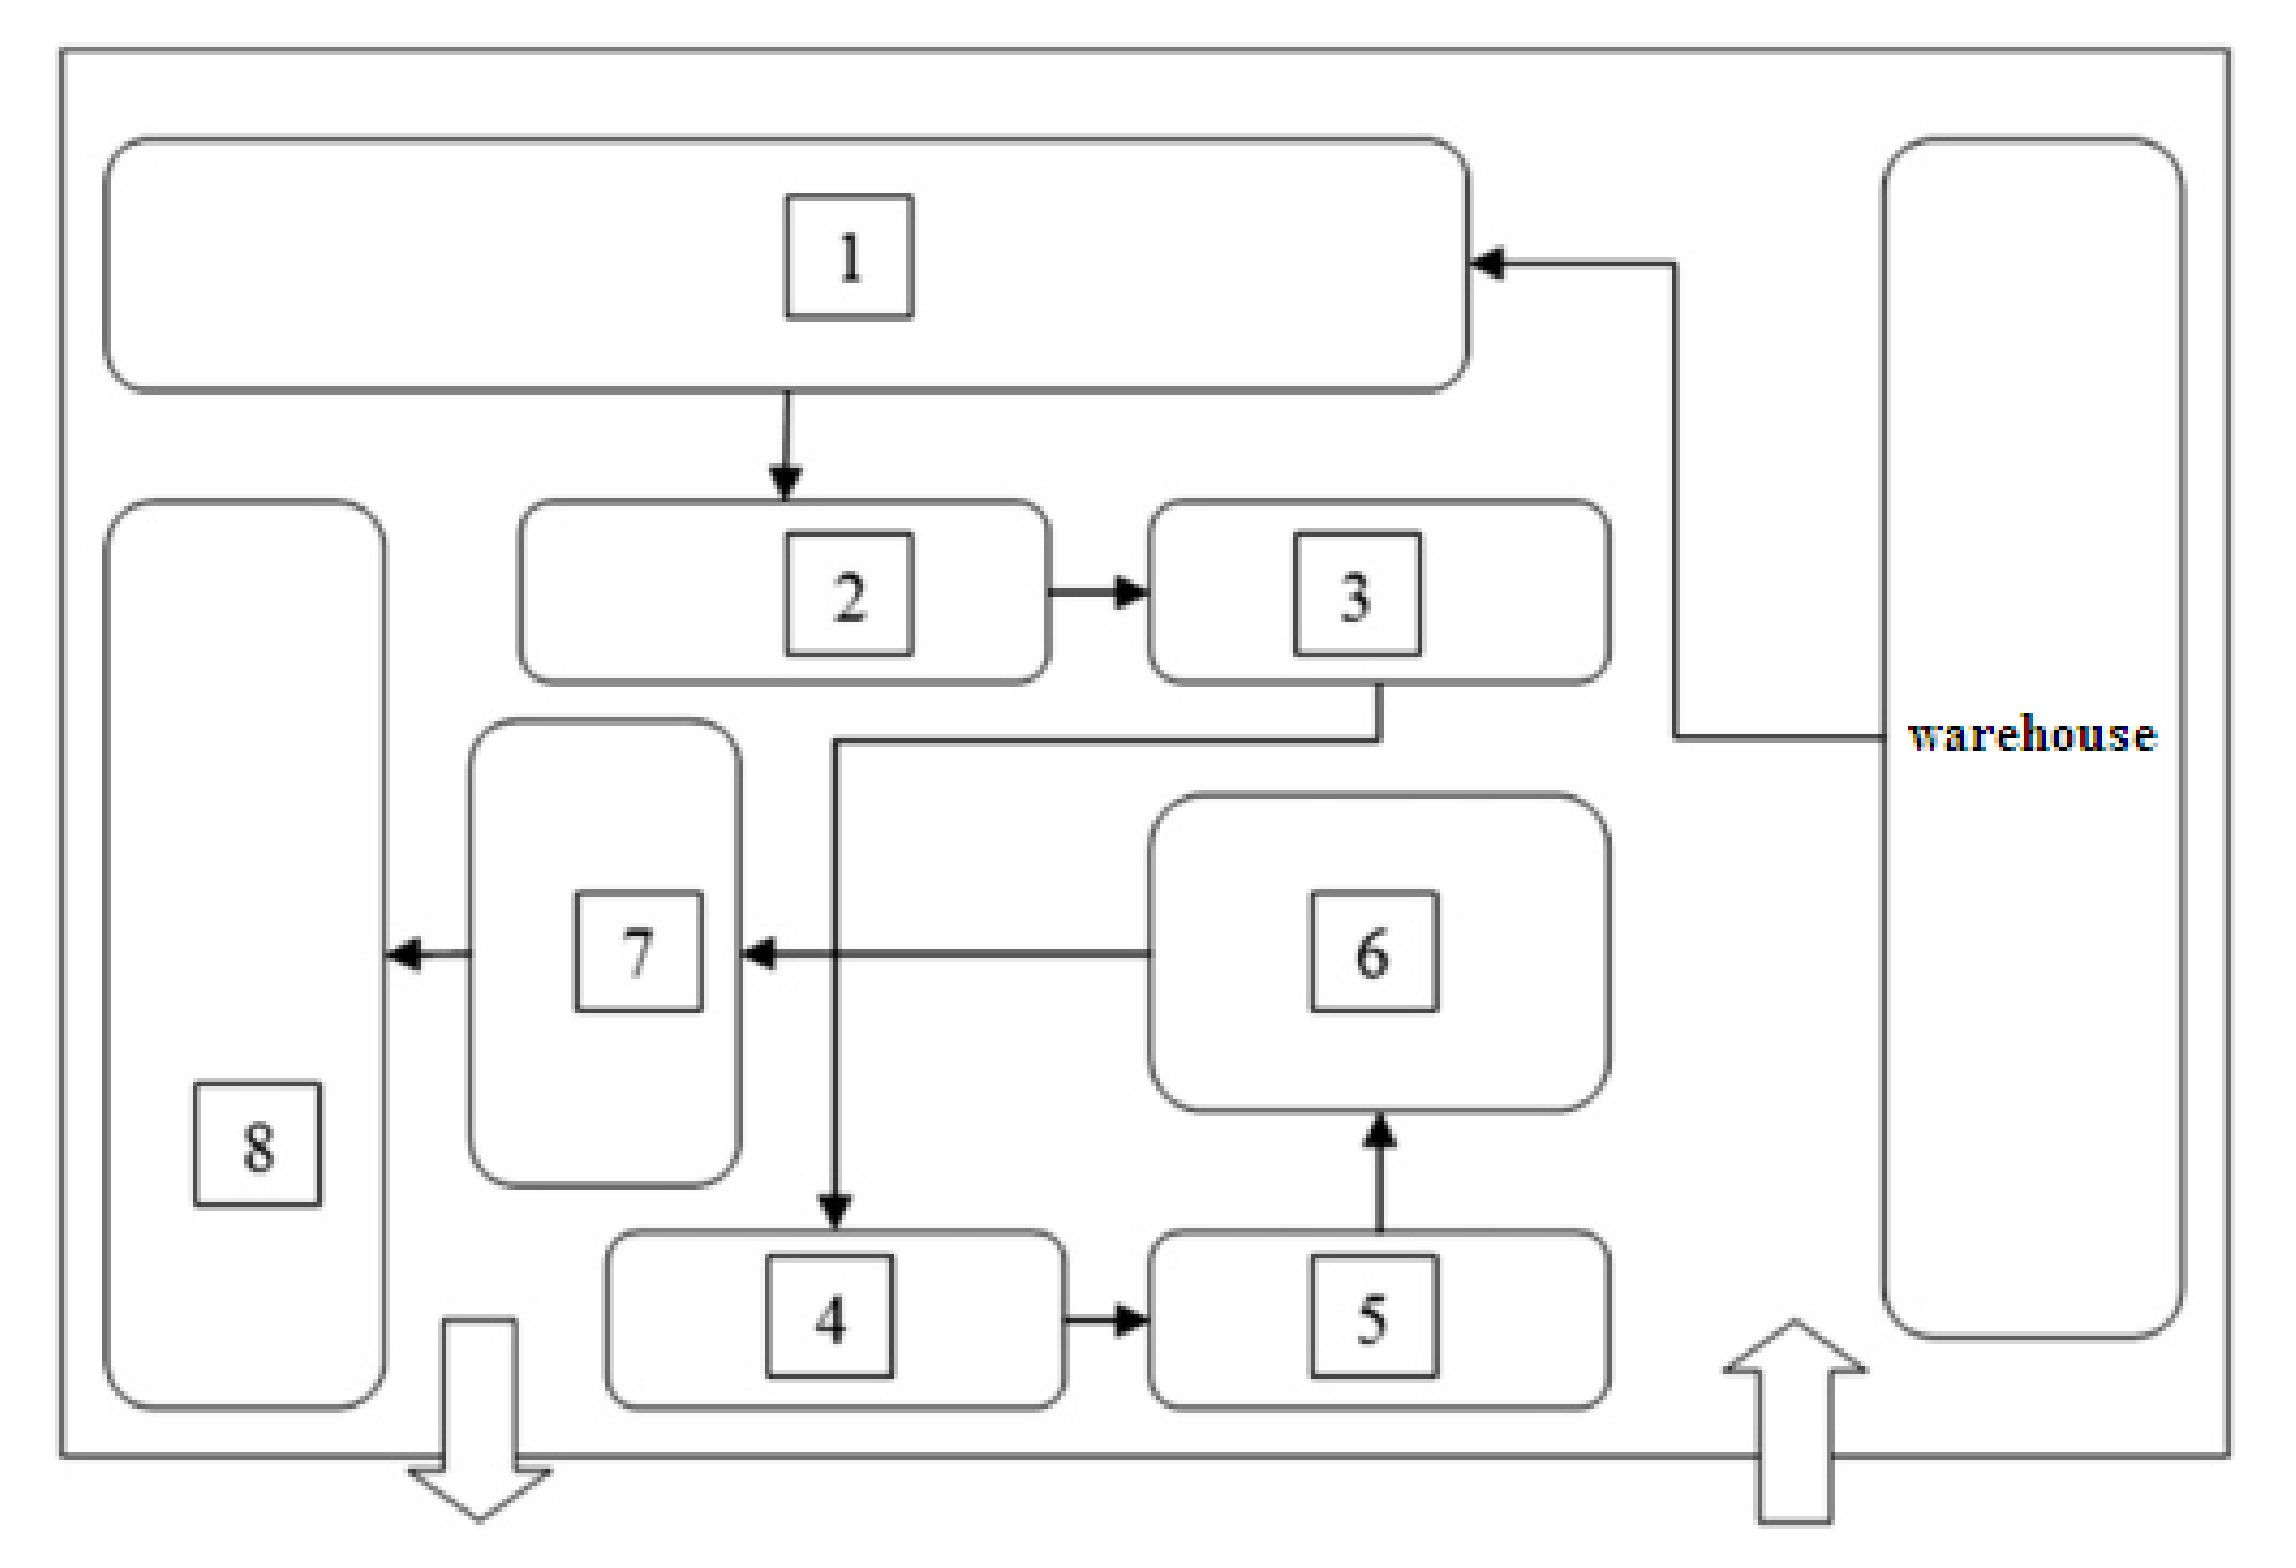
We selected the production line of a manufacturing unit that produced satellite dish kits as the case study. The daily production demand was 1000 pieces, of 0.7 mm thickness of 500 g weight, made of different materials such as copper, aluminum, brass, and galvanized steel. The production line adopted a double working shift, with an effective shift time of 7.5 h per shift. The production of the satellite dish kits included five main processes (Figure 3). Therefore, the takt time to manufacture each satellite dish kit was 54 s; the process cycle time of each satellite dish part is shown in Figure 4. The carbon emission coefficient of steel was 7.048 kg CO2e/kg [58], and EFeleck in the present study was 2.41 kg CO2e/kg/kWh (the discharge coefficient of electric energy was calculated based on the China energy conservation [59] and emission reduction development report and the 2050 China energy and CO2 emission report [60]). All the data involved in the case were from the internal data of the factory. In this workshop, the staff were distributed into four white collars (for office tasks) and 23 blue collars (responsible for workshop work), and the building occupied a pavilion of 1000 m2 in total area. Figure 5 depicts the layout of the underlying layers. The office is located on the upper floor such that one can directly observe the workshop below. The energy, water, and transportation distances consumed for each process are shown in Figure 6.
In the satellite dish kit production line, using Formulas (3)–(8), the total carbon emissions were estimated to be 21.49 kg CO2e, where 16.76 kg CO2e was derived from the non-value-added carbon emissions and 4.73 kg CO2e from value-added carbon emissions. Because the manufacturing process was considered as a defined system, in Formula (2), k was set to 1, and the current carbon efficiency was 12.98 s/kg CO2e. From the lean production perspective, there were some wastes, including inventory, transportation, defects, and unbalanced production lines in the production process.
4.2. Future State Analysis and Improvement
Lean and green manufacturing methods should be used to solve problems in the production of satellite dish kits. Appropriate measures must be taken to optimize waste to improve carbon efficiency indicators. Lean improvement practices in the manufacturing process should be the new production operation mode. The process of implementing this new model shifts from the original batch push type to the one-piece flow pull method. In the new product manufacturing mode, the cycle production time of products in the production process must be based on the actual needs of customers determined by customer value, including its beat time or the cycle time of the manufacturing process, and must be produced according to the rhythm of the actual needs of the market. In accordance with the improvement strategy of the lean–green manufacturing perspective, the work improvement team should implement the following improvements:
- (1)
- The production process was analyzed using the lean–green practice improvement tool, and its efficiency and sustainability were identified and quantified using the parameters of the sustainable value stream map (SVSM). Through SVSM combined with the five core values of lean manufacturing theory, the criteria of environment, society, economic development, and cost should be analyzed and considered separately in the improvement process of each production stage. For the analysis of each process, the number of workers, working space, process time, lead time, working time, shift, breaks, stop, product type, batch size, scrap, rework, first-pass rate, ideal cycle time, preparation time, scheduled time, and environmental impact involved in each processing process were analyzed first. Lean is an improvement from the original batch-push production type to the single-piece flow-pull method. In the new product manufacturing mode, the cycle production time of products in the production process was based on the actual needs of customers determined by customer value, including its beat time or the cycle time of the manufacturing process, and was produced according to the rhythm of the actual needs of the market. Combine adjacent operations based on the takt time of the process, where the takt time for each satellite dish kit is 54 s.
- (2)
- The improved production process implements a single-piece flow-pull methodology. Pull production is the technical carrier of “just in time”, one of the two pillars of Toyota’s production mode. Compared with the past push production, the former job “pushes” the parts to the latter job for processing. In pull production, the latter job requires the former job to manufacture the parts needed according to the number of products it needs to process. The production layout was improved according to the continuous flow processing and implementation of cellular manufacturing.
- (3)
- Through direct observation of the processing site, the space for each process is scattered, and the scope of the operation space is large. Simultaneously, a large number of tools were replaced in the operation process, resulting in the loss of productivity and accumulation of inventory materials. Some processes were produced according to their capacity, resulting in excessive production. Through an analysis of the ECRS work improvement principle, we determined the improvement direction of the process flow and conceived a new working method to replace the current working method based on 5W1H analysis. Applying the four principles of ECRS work improvement, namely cancellation, merger, reorganization, and simplification, can help enterprises find better efficiency and better working methods. The production line was balanced based on the calculation of takt time to identify and improve bottlenecks by comparison with the actual cycle time.
- (4)
- To reduce wait time waste and large inventories, improvements were achieved by building Kanban systems and using supermarket pull systems. The production process uses the pull method to implement the new production mode. The system has an advantage in that it cancels the intermediate warehouse. For the intermediate inventory existing between the original processes, excess inventory was accumulated between the workspaces of each process to ensure material flow and prevent material shortages in the process of mass production. Concurrently, in terms of transportation, there is much internal mobile transportation, and frequent transportation will damage the normal production of each process. Identify and remove or significantly reduce waste in a quantitative manner through lean–green approach tools supplemented by the environmental impact of innovation. Each process is currently being optimized to reduce overproduction, and the other processes are not considered. Each process should be performed in strict accordance with the order or shortage of goods in the previous process.
- (5)
- 5S and TPM management systems were established in the workshop and production equipment maintenance, respectively, which have positive lean–green improvement environmental impacts.
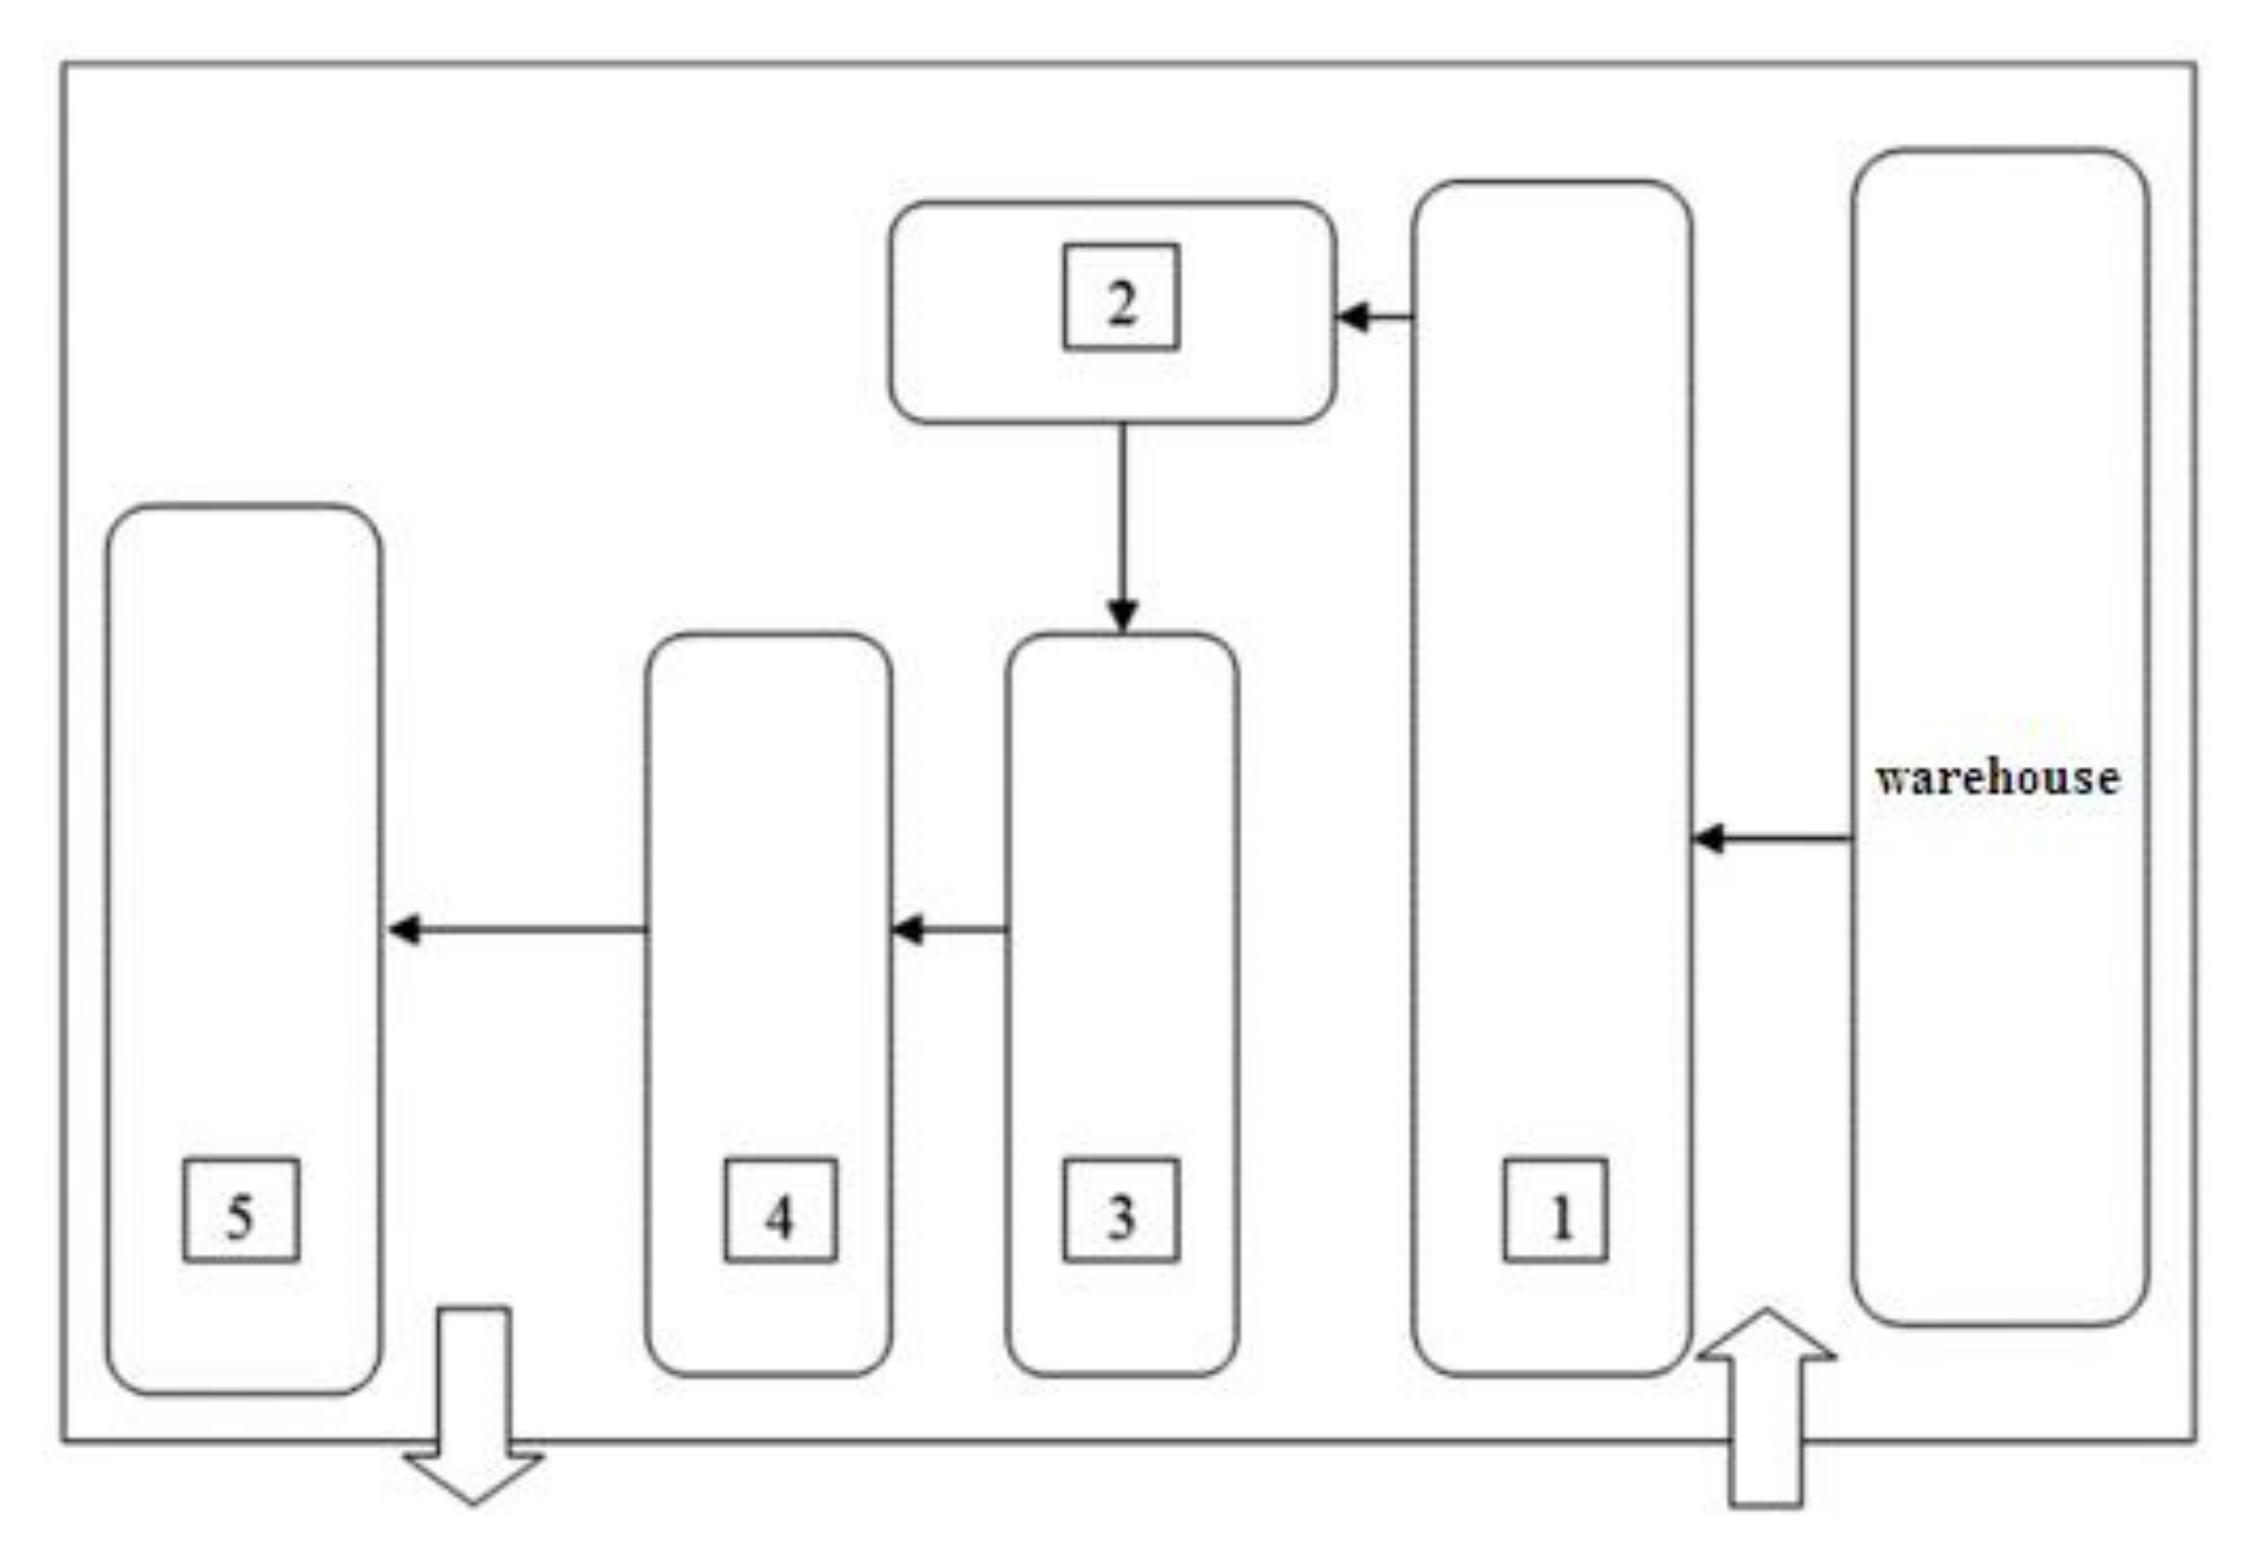
By combining lean thinking and low-carbon manufacturing, the wastes of the current production line and the carbon efficiency indicator will be improved. The process was recombined and reduced from 8 to 5 to achieve continuous-flow processing. This reduced the distance by 77 m. The new layout is shown in Figure 7. The workstations were placed in the following manner: (1) cutting, (2) flaring and welding, (3) punching and bending, (4) checking and washing, and (5) painting. The improved process cycle time for each satellite dish is shown in Figure 8. The consumed energy, water, and transportation distance by each improved process are shown in Figure 9.
The improvements in the production lines of the satellite dish kit are shown in Table 1. The comparisons of the effects are glaring after the improvement. The value-added time was approximately 263 s; the non-value-added time showed a very considerable drop from 14.58 days to 6.08 days. Because the implementation of the new pull production system simplifies current processes and reduces intermediate inventory, it also reduces inventory time at the same time. However, after improvement, using Formulas (3)–(8), the total carbon emissions were 7.24 kgCO2e, and the value-added and non-value-added carbon emissions were 1.29 kgCO2e and 5.65 kgCO2e, respectively. Using Formulas (1) and (2), the after-improvement carbon efficiency increased from 12.98 s/kg CO2e to 36.33 s/kg CO2e in comparison with that before the improvement. The carbon benefit after improvement was 193.92% higher than that before the improvement.
5. Conclusions
The terms sustainability and efficiency reinforce each other. To achieve this goal, a decision model can be established to determine the synergy between sustainable production and efficient manufacturing systems. Through the analysis of the current value flow of satellite dish kits, the 5Why analysis method, the unitized production, the inventory supermarket pulling system, and the existing excess waste and inventory in production were eliminated. Waste of different types, including transportation, waiting, and unbalanced production lines, shortened the production cycle, effectively slowed down carbon emissions in the production process, and improved carbon efficiency indicators.
In this study, the energy flow, material flow, transport flow, and carbon emission flow were comprehensively considered, and the quantified carbon efficiency was used as the index to establish a mathematical model. Using the verified case of the carbon benefit, carbon efficiency, and sustainable value flow chart model established in this study, the company will be able to reduce costs by decreasing the material consumption and energy per unit output, and thereby gain a competitive advantage. The model can also reduce emissions and waste, optimize manufacturing processes, and improve the final inventory. In addition, the reduction in costs and improvement in efficiency will have a positive impact on the company’s revenue. Finally, by reducing the consumption of raw materials and eliminating their negative impact on the environment, this approach shows better social responsibility and environmental sustainability. Therefore, this will be reflected in the increase in the added value of the product. The production process has a direct and significant environmental impact. If the appropriate tools and options are chosen, these methods may help solve environmental problems and lead to sustainable development. Therefore, green engineering and processes are an effective way to eliminate waste, improve carbon benefits and efficiency, and provide guidance and support for sustainable processes, products, and systems, while reducing risks to humans and the environment. Introducing a process that provides adequate environmental protection in a lean production system and realizing “greening” of the process is an essential part of sustainable development of the future society and improving environmental benefits. Therefore, in the new global economic framework of the 21st century, the company must integrate advanced management models to improve the organization’s stand in the highly competitive market and achieve sustainability and efficiency, and introduce the integration of green manufacturing into the lean production system.
The quantitative model presented in this paper was designed for the specified scope of only one manufacturing company, and the framework must be tested in a variety of manufacturing processes to improve practicality. More relevant studies should be conducted to test its general application and limitations. For example, the proposed model can be used to improve not only production operations, but also other types of operations, such as healthcare, logistics and transportation, and services. In the future, augmented models and tools can be developed to visualize and evaluate process KPIs simultaneously from environmental, economic, and social perspectives. At the same time, dedicated expert systems can be developed to perform the analysis automatically. At the same time, the thorough integration of lean production and green manufacturing to achieve a thorough degree of lean–green involves the full cooperation of partner enterprises in the supply chain. Therefore, in future research, the relevant model constructed in this paper can be extended to the whole supply chain rather than limited to a single enterprise.
Author Contributions
Conceptualization, X.Z., Y.X. and G.X.; methodology, X.Z. and Y.X.; formal analysis, Y.X. and G.X.; investigation, X.Z.; writing—original draft preparation, X.Z., Y.X. and G.X.; writing—review and editing, X.Z. and Y.X. All authors have read and agreed to the published version of the manuscript.
Funding
This research was funded by the Natural Science Foundation of Hunan Province, China (Project number: 2022JJ50244); Education Department of Hunan Province (Project number: 21B0695; 21A0475); Project of Hunan social science achievement evaluation committee in 2022 (Project number: XSP22YBC081).
Institutional Review Board Statement
Not applicable.
Informed Consent Statement
Informed consent was obtained from all subjects involved in the study.
Data Availability Statement
Not applicable.
Conflicts of Interest
The authors declare no conflict of interest.
References
- IEA. The Way Forward: Five Key Action to Achieve a Low Carbon Energy Sector [EB/OL]. 2014. Available online: http://www.iea.org/publications/freepublications/publication/The_Way_forward.pdf (accessed on 10 September 2021).
- Galeazzo, A.; Furlan, A.; Vinelli, A. Lean and green in action: Interdependencies and performance of pollution prevention projects. J. Clean. Prod. 2014, 85, 191–200. [Google Scholar] [CrossRef]
- Fercoq, A.; Lamouri, S.; Carbone, V. Lean/Green integration focused on waste reduction techniques. J. Clean. Prod. 2016, 137, 567–578. [Google Scholar] [CrossRef]
- Digalwar, A.K.; Tagalpallewar, A.R.; Sunnapwar, V.K. Green Manufacturing Performance Measures: An Empirical Investigation from Indian Manufacturing Industries. Meas. Bus. Excell. 2013, 17, 59–75. [Google Scholar] [CrossRef]
- Garza-Reyes, J.A. Green lean and the need for six sigma. Int. J. Lean Six Sigma 2015, 6, 226–248. [Google Scholar] [CrossRef]
- Cherrafi, A.; ElFezazi, S.; Govindan, K.; Garza-Reyes, J.A.; Benhida, K.; Mokhlis, A. A Framework for the Integration of Green and Lean Six Sigma for Superior Sustainability Performance. Int. J. Prod. Res. 2017, 55, 4481–4515. [Google Scholar] [CrossRef]
- Garza-Reyes, J.A. Lean and green—A systematic review of the state-of-the-art literature. J. Clean. Prod. 2015, 102, 18–29. [Google Scholar] [CrossRef] [Green Version]
- Green, K.W.; Zelbst, P.J.; Meacham, J.; Bhadauria, V.S. Green Supply Chain Management Practices: Impact on Performance. Supply Chain Manag. Int. J. 2012, 17, 290–305. [Google Scholar] [CrossRef]
- Sartal, A.; Carou, D.; Dorado-Vicente, R.; Mandayo, L. Facing the challenges of the food industry: Might additive manufacturing be the answer? Proc. Inst. Mech. Eng. Part B J. Eng. Manuf. 2019, 233, 1902–1906. [Google Scholar] [CrossRef]
- Baumers, M.; Wildman, R.; Wallace, M.; Yoo, J.; Blackwell, B.; Farr, P.; Roberts, C.J. Using total specific cost indices to compare the cost performance of additive manufacturing for the medical device’s domain. Proc. Inst. Mech. Eng. Part B J. Eng. Manuf. 2019, 233, 1235–1249. [Google Scholar] [CrossRef]
- Zhu, X.-Y.; Zhang, H. Construction of Lean-green coordinated development model from the perspective of personnel integration in manufacturing companies. Proc. Inst. Mech. Eng. Part B J. Eng. Manuf. 2020, 234, 1460–1470. [Google Scholar] [CrossRef]
- Mccarty, T.; Jordan, M.; Probst, D. Six Sigma for Sustainability—How Organizations Design and Deploy Winning Environmental Programs; McGraw-Hill: New York, NY, USA, 2011. [Google Scholar]
- Wong, W.P.; Wong, K.Y. Synergizing an Ecosphere of Lean for Sustainable Operations. J. Clean. Prod. 2014, 85, 51–66. [Google Scholar] [CrossRef]
- Garza-Reyes, J.A.; Villarreal, B.; Kumar, V.; Molina Ruiz, P. Lean and green in the transport and logistics sector—A case study of simultaneous deployment. Prod. Plan. Control 2016, 27, 1221–1232. [Google Scholar] [CrossRef]
- Shah, R.; Ward, P.T. Defining and Developing Measures of Lean Production. J. Oper. Manag. 2007, 25, 785–805. [Google Scholar] [CrossRef]
- Zhu, X.-Y.; Zhang, H. A lean green implementation evaluation method based on fuzzy analytic net process and fuzzy complex proportional assessment. Int. J. Circuits Syst. Signal Process. 2020, 14, 646–655. [Google Scholar]
- Chauhan, G.; Singh, T.P. Measuring Parameters of Lean Manufacturing Realization. Meas. Bus. Excell. 2012, 16, 57–71. [Google Scholar] [CrossRef]
- King, A.; Lenox, M. Lean and Green: An Empirical Examination of the Relationship between Lean Production and Environmental Performance. Prod. Oper. Manag. 2001, 10, 244–256. [Google Scholar] [CrossRef]
- Sergio, A.; Alvarez, R.; Domingo, R. Model of efficient and sustainable improvements in a lean production system through processes of environmental innovation. J. Clean. Prod. 2013, 47, 141–148. [Google Scholar]
- Thanki, S.J.; Govindan, K.; Thakkar, J. An Investigation on Lean-Green Implementation Practices in Indian SMEs Using Analytical Hierarchy Process (AHP) Approach. J. Clean. Prod. 2016, 135, 284–298. [Google Scholar] [CrossRef]
- Carvalho, H.; Govindan, K.; Azevedo, S.; Cruz-Machado, V. Modelling Green and Lean Supply Chain: An Eco-Efficiency Perspective. Resour. Conserv. Recycl. 2017, 120, 75–78. [Google Scholar] [CrossRef]
- EPA. The Lean and Environment Toolkit; Environmental Protection Agency: Washington, DC, USA, 2007. [Google Scholar]
- Womack, J.P.; Jones, D.T.; Roos, D. The Machine that Changed the World; Harper-Collins: New York, NY, USA, 1991. [Google Scholar]
- Womack, J.P.; Jones, D.T. Beyond Toyota: How to root out waste and pursue perfection. Harv. Bus. Rev. 1996, 74, 140–151. [Google Scholar]
- Womack, J.P.; Jones, D.T. Lean Thinking: Banish Waste and Create Wealth in Your Corporation; Free Press: New York, NY, USA, 2003. [Google Scholar]
- Shah, R.; Ward, P.T. Lean manufacturing: Context, practice bundles, and performance. J. Oper. Manag. 2004, 21, 129–149. [Google Scholar] [CrossRef] [Green Version]
- Abdulmalek, F.A.; Rojgopal, J. Analyzing the benefits of lean manufacturing and value stream mapping via simulation: A process sector case study. Int. J. Prod. Econ. 2007, 107, 223–236. [Google Scholar] [CrossRef]
- Dora, M.; Kumar, M.; Gellynck, X. Determinants and barriers to lean implementation in food processing SMEs-a multiple case analysis. Prod. Plan. Control. 2016, 27, 1–23. [Google Scholar] [CrossRef]
- Singh, B.J.; Khanduja, D. SMED: For quick changeovers in foundry SMEs. Int. J. Product. Perform. Manag. 2010, 59, 98–116. [Google Scholar] [CrossRef]
- Wong, W.P.; Ignatius, J.; Soh, K.L. What is the leanness level of your organisation in lean transformation implementation? An integrated lean index using ANP approach. Prod. Plan. Control. 2014, 25, 273–287. [Google Scholar] [CrossRef]
- Wu, L.; Subramanian, N.; Abdulrahman, M.D.; Liu, C.; Lai, K.-H.; Pawar, K.S. The Impact of Integrated Practices of Lean, Green, and Social Management Systems on Firm Sustainability Performance—Evidence from Chinese Fashion Auto-Parts Suppliers. Sustainability 2015, 7, 3838. [Google Scholar] [CrossRef] [Green Version]
- Dües, C.M.; Tan, K.H.; Lim, M. Green as the new lean: How to use lean practices as a catalyst to greening your supply chain. J. Clean. Prod. 2013, 40, 93–100. [Google Scholar] [CrossRef] [Green Version]
- Martinez-Jurado, P.J.; Moyano-Fuentes, J. Lean management, supply chain management and sustainability: A literature review. J. Clean. Prod. 2014, 8, 134–150. [Google Scholar] [CrossRef]
- Piercy, N.; Rich, N. The relationship between lean operations and sustainable operations. Int. J. Oper. Prod. Manag. 2015, 35, 282–315. [Google Scholar] [CrossRef]
- Colicchia, C.; Creazza, A.; Dallari, F. Lean and green supply chain management through intermodal transport: Insights from the fast-moving consumer goods industry. Prod. Plan. Control 2017, 28, 1221–1232. [Google Scholar] [CrossRef]
- Negrao, L.L.L.; Filho, M.G.; Marodin, G. Lean practices and their effect on performance: A literature review. Prod. Plan. Control 2017, 28, 33–56. [Google Scholar] [CrossRef]
- Cherrafi, A.; Elfezazi, S.; Chiarini, A.; Mokhlis, A.; Benhida, K. The Integration of Lean Manufacturing, Six Sigma and Sustainability: A Literature Review and Future Research Directions for Developing a Specific Model. J. Clean. Prod. 2016, 139, 828–846. [Google Scholar] [CrossRef]
- Gandhi, N.S.; Thanki, S.J.; Thakkar, J.J. Ranking of drivers for integrated lean-green manufacturing for Indian manufacturing SMEs. J. Clean. Prod. 2018, 171, 675–689. [Google Scholar] [CrossRef]
- Gandhi, N.S.; Thanki, S.J.; Thakkar, J.J. A model for Lean and Green integration and monitoring for the coffee sector. Comput. Electron. Agric. 2018, 150, 62–73. [Google Scholar]
- Bhattacharya, A.; Nand, A.; Castka, P. Lean-green integration and its impact on sustainability performance: A critical review. J. Clean. Prod. 2019, 236, 117697.1–117697.16. [Google Scholar] [CrossRef]
- Bhattacharya, A.; Nand, A.; Castka, P. Enhancing the Adaptability: Lean and Green Strategy towards the Industry Revolution 4.0. J. Clean. Prod. 2020, 273, 122870. [Google Scholar]
- Leong, W.D.; Teng, S.Y.; How, B.S.; Ngan, S.L.; Rahman, A.A.; Tan, C.P.; Ponnambalam, S.; Lam, H.L. Simulation-based analysis of catalysers and trade-offs in Lean & Green manufacturing—Science Direct. J. Clean. Prod. 2020, 242, 118411–118436. [Google Scholar]
- Kuo, S.Y.; Lin, C.P. Determinants of green performance in container terminal operations: A lean management. J. Clean. Prod. 2020, 275, 123105. [Google Scholar] [CrossRef]
- Touriki, F.E.; Benkhati, I.; Kamble, S.S.; Belhadi, A.; Fezazi, S.E. An integrated smart, green, resilient, and lean manufacturing framework: A literature review and future research directions. J. Clean. Prod. 2021, 319, 128691. [Google Scholar] [CrossRef]
- Cherrafi, A.; Garza-Reyes, J.A.; Belhadi, A.; Kamble, S.S.; Elbaz, J. A Readiness Self-Assessment Model for Implementing Green Lean Initiatives. J. Clean. Prod. 2021, 309, 127401. [Google Scholar] [CrossRef]
- Miguel, L.; da Fonseca, C.M. ISO 14001: 2015: An improved tool for sustainability. J. Ind. Eng. Manag. 2015, 8, 37–50. [Google Scholar]
- Mollenkopf, D.; Stolze, H.; Tate, W.; Ueltschy, M. Green, lean and global supply chains. Int. J. Phys. Distrib. Logist. Manag. 2010, 40, 14–41. [Google Scholar] [CrossRef]
- Sheng, M.L.; Chien, I. Rethinking organizational learning orientation on radical and incremental innovation in high-tech firms. J. Bus. Res. 2016, 69, 2302–2308. [Google Scholar] [CrossRef]
- Verrier, B.; Rose, B.; Caillaud, E. Lean and Green strategy: The Lean and Green House and maturity deployment model. J. Clean. Prod. 2016, 116, 150–156. [Google Scholar] [CrossRef]
- Li, Y.; Cao, H.; Li, H.; Tao, G. The Carbon Emissions Dynamic Characteristic and Two Stage Optimization Scheduling Model for Job Shop. Comput. Integr. Manuf. Syst. 2015, 21, 2687–2693. (In Chinese) [Google Scholar]
- Lv, J.; Peng, T.; Tang, R. Energy modeling and a method for reducing energy loss due to cutting load during machining operations. Proc. Inst. Mech. Eng. Part B J. Eng. Manuf. 2019, 233, 699–710. [Google Scholar] [CrossRef]
- Ng, R.; Low, J.S.C.; Song, B. Integrating and implementing Lean and Green practices based on proposition of Carbon-Value Efficiency metric. J. Clean. Prod. 2015, 95, 242–255. [Google Scholar] [CrossRef]
- Zhu, X.-Y.; Zhang, H.; Jiang, Z.-G. Application of green-modified value stream mapping to integrate and implement lean and green practices: A case study. Int. J. Comput. Integr. Manuf. 2020, 33, 716–731. [Google Scholar] [CrossRef]
- Xiao, Y.; Jiang, Z.; Gu, Q.; Wei, Y.; Wang, R. A novel approach to CNC machining centre processing parameters optimization considering energy-saving and low-cost. J. Manuf. Syst. 2021, 59, 535–548. [Google Scholar] [CrossRef]
- Xiao, Y.; Zhang, H.; Jiang, Z.; Gu, Q.; Wei, Y. Multiobjective optimization of machining center process route: Trade-offs between energy and cost. J. Clean. Prod. 2021, 280, 124171. [Google Scholar] [CrossRef]
- Gutowski, T.; Dahmus, L.; Thiriez, A. Electrical Energy Requirements for Manufacturing Processes, [10 March 2010]. Available online: http://Web.Mit.Edu/ebm/www/publications/CIRP_2006.pdf (accessed on 11 September 2021).
- Ashbly, M.F. Materials and the Environment: Eco-Informed Material Choice; Butterworth Heinemann: Brulington, VT, USA, 2009; pp. 112–291. [Google Scholar]
- Li, X.; Xu, H. Life cycle evaluation of steel based on GaBi. Environ. Prot. Circ. Econ. 2009, 6, 15–18. (In Chinese) [Google Scholar]
- China Energy Saving and Investment Company. China Energy Conservation and Emission Reduction Development Report; China Water Power Press: Beijing, China, 2009. (In Chinese) [Google Scholar]
- 2050 China Energy and CO2 Emission Research Group. 2050 China Energy and CO2 Emission Report; Science Press: Beijing, China, 2009. (In Chinese) [Google Scholar]
Figure 1.
Schematic diagram of the IPO process of the product manufacturing conversion process.

Figure 2.
Classification of carbon emissions during product production.
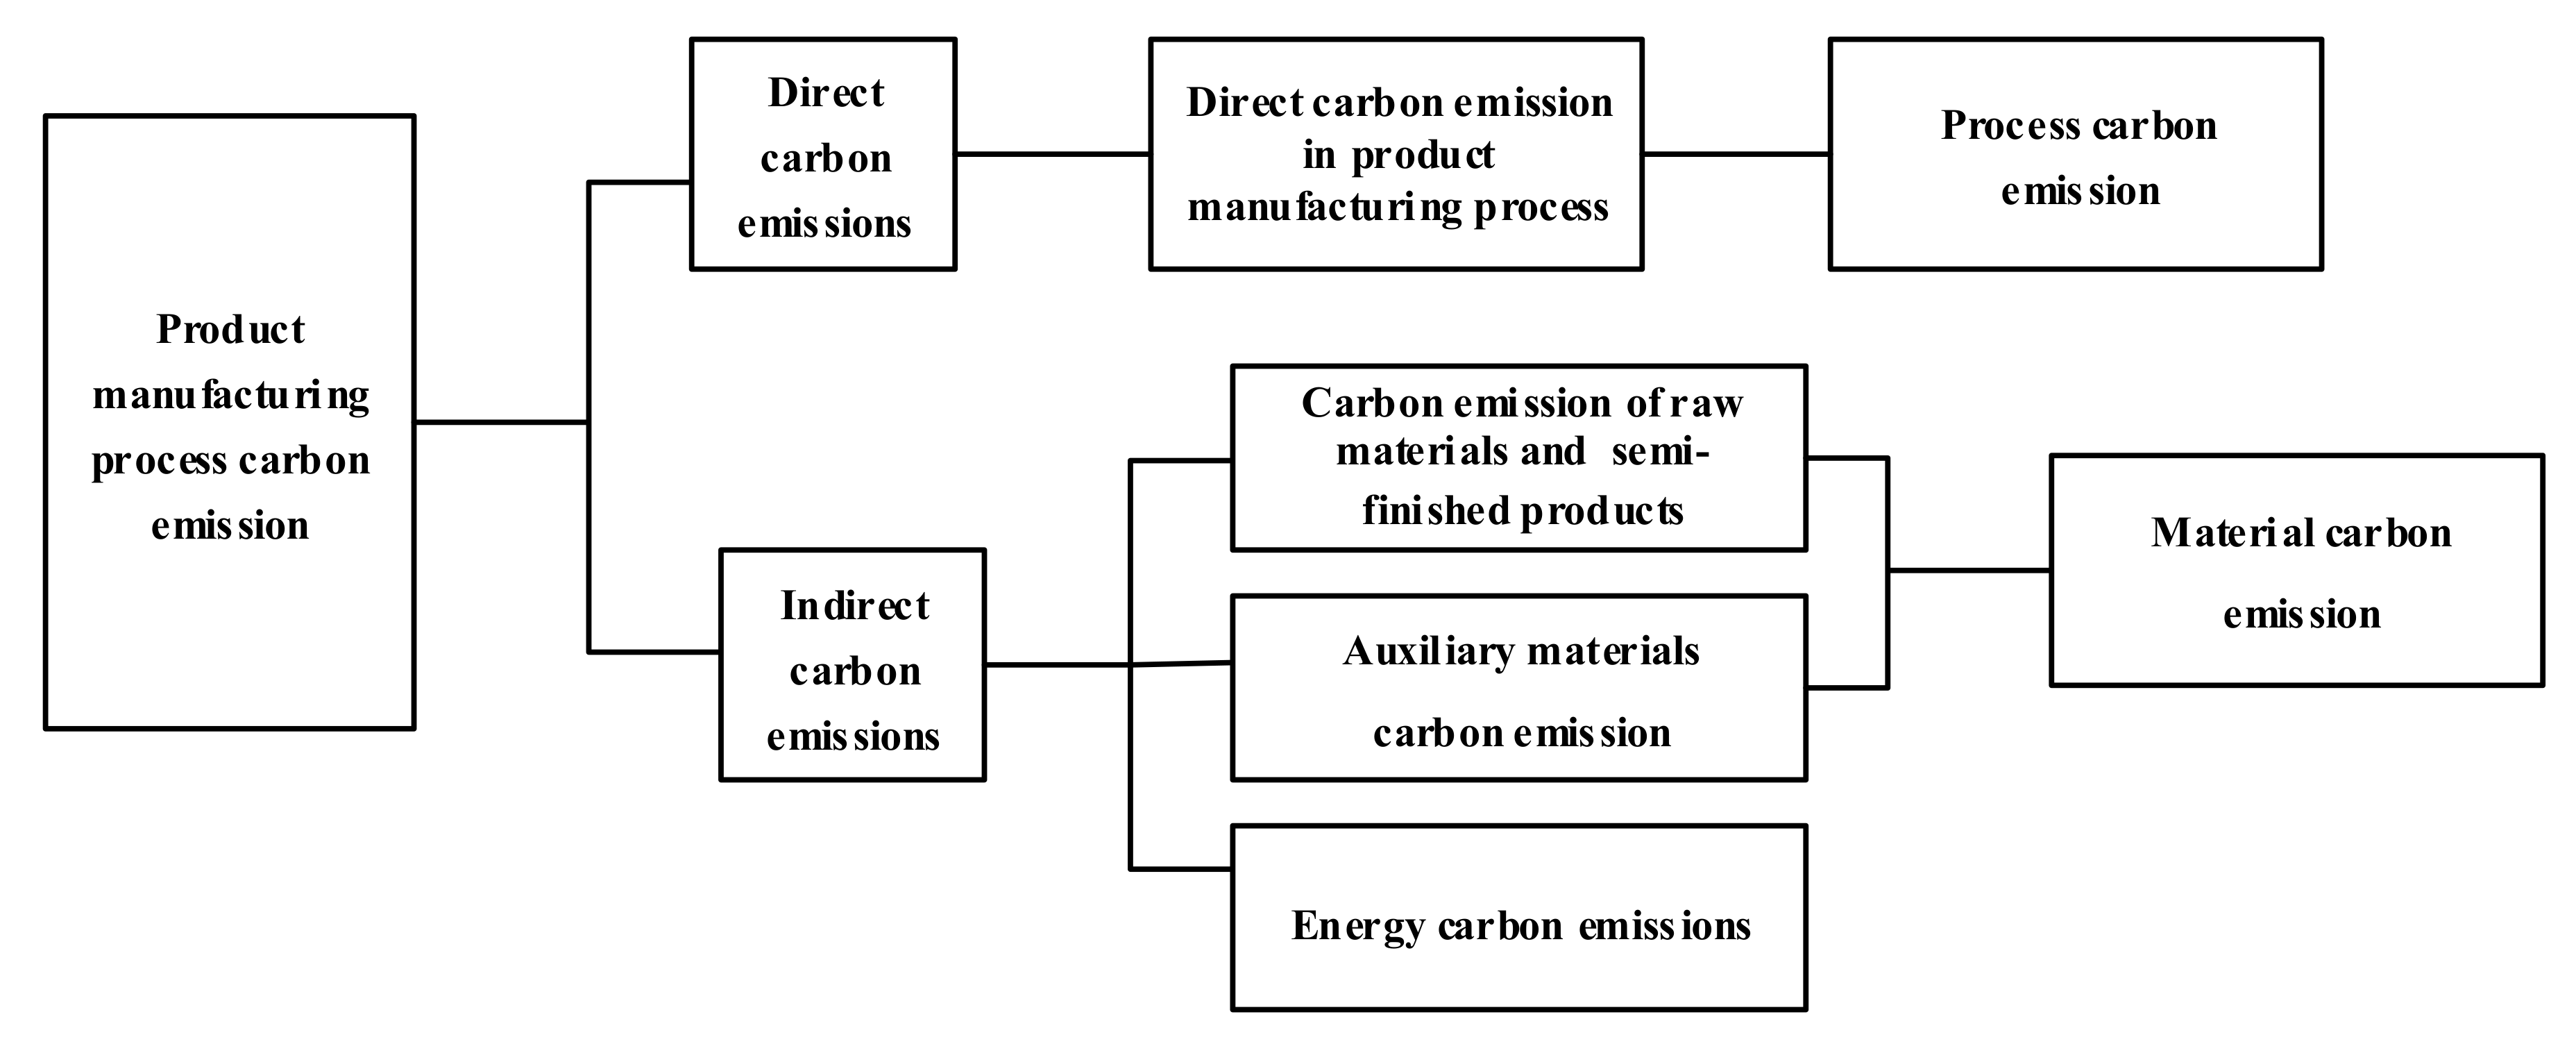
Figure 3.
Process flow of satellite dish kit production line (before improvement).

Figure 4.
Cycle time of each satellite dish kit (before improvement; units: second).
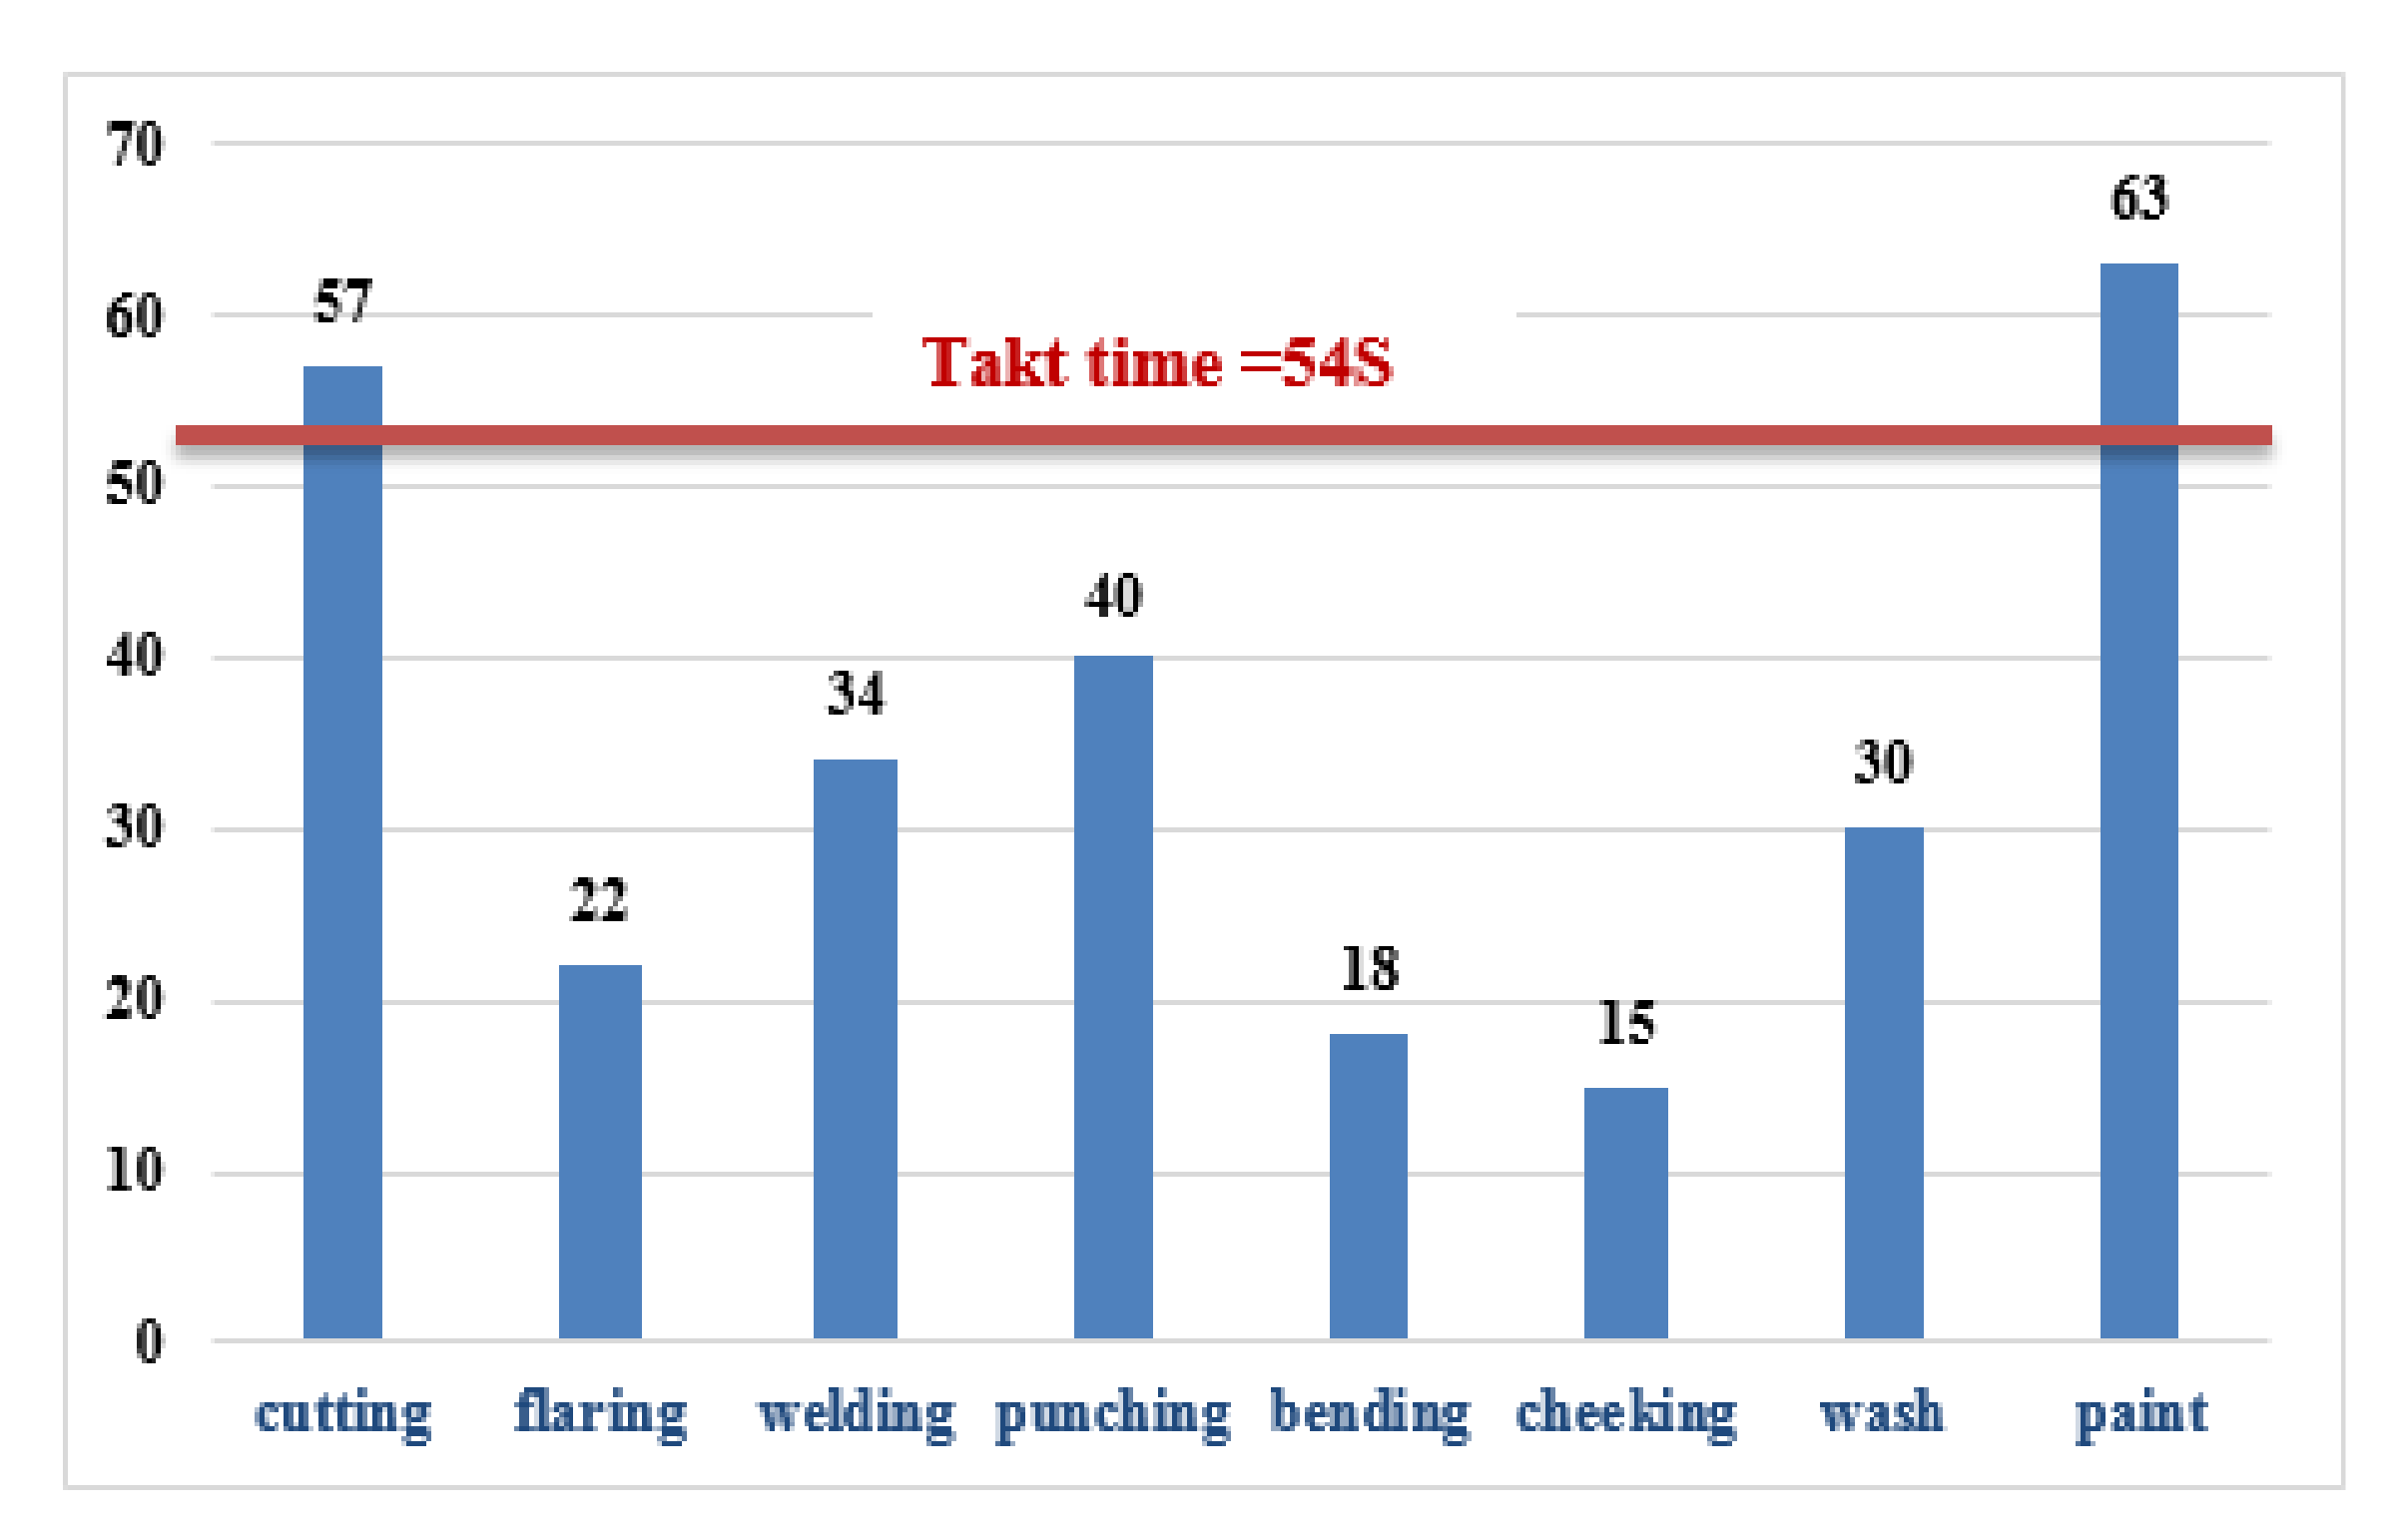
Figure 5.
Initial layout of satellite dish kit production line (before improvement).

Figure 6.
Resource consumption of satellite dish kit production line (before improvement).
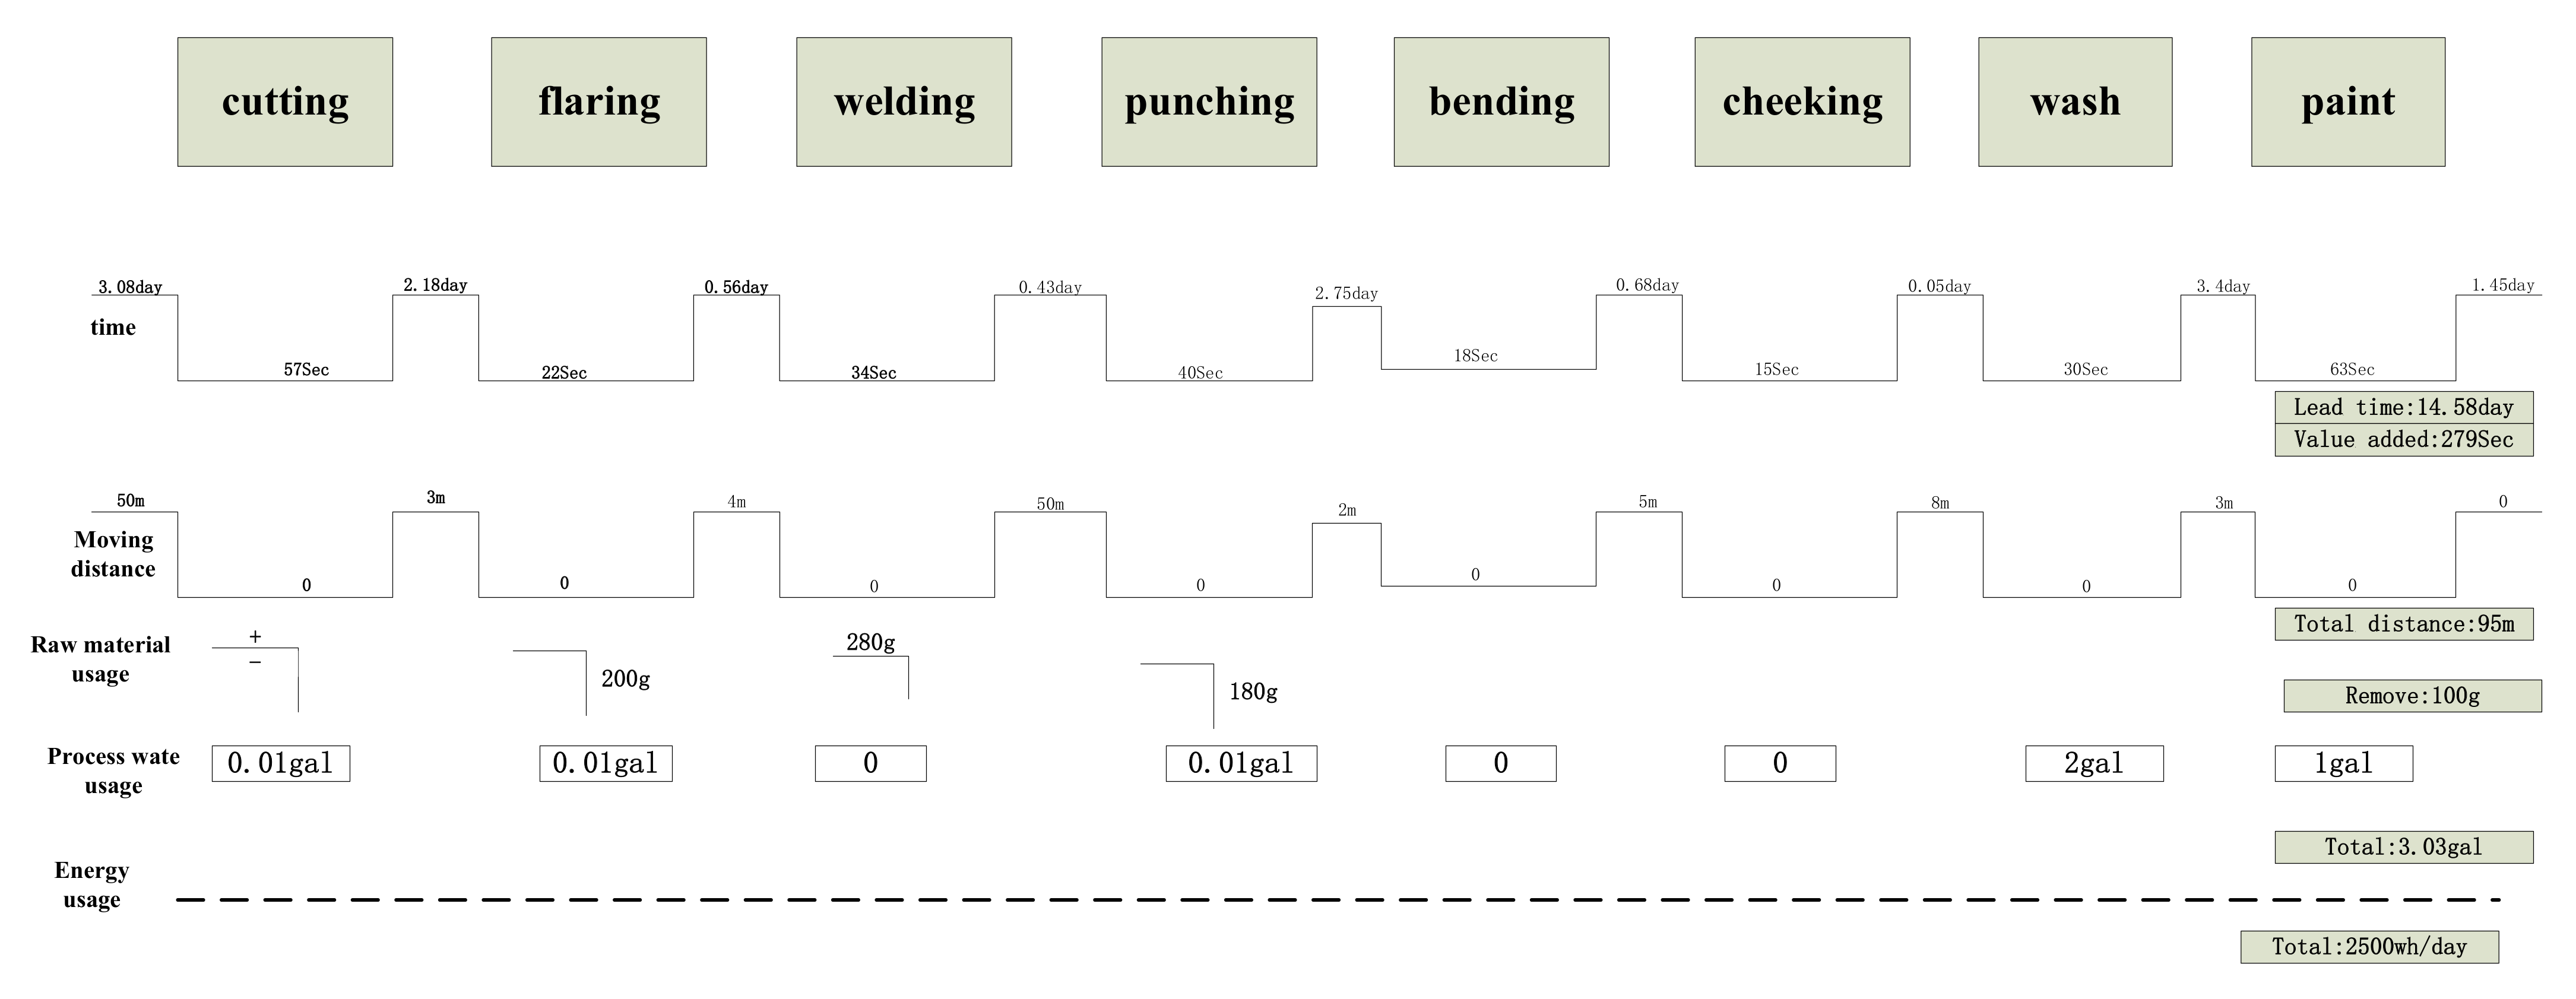
Figure 7.
New layout of satellite dish kit production line (after improvement).

Figure 8.
Improved cycle time of each satellite dish kit (after improvement, units: second).
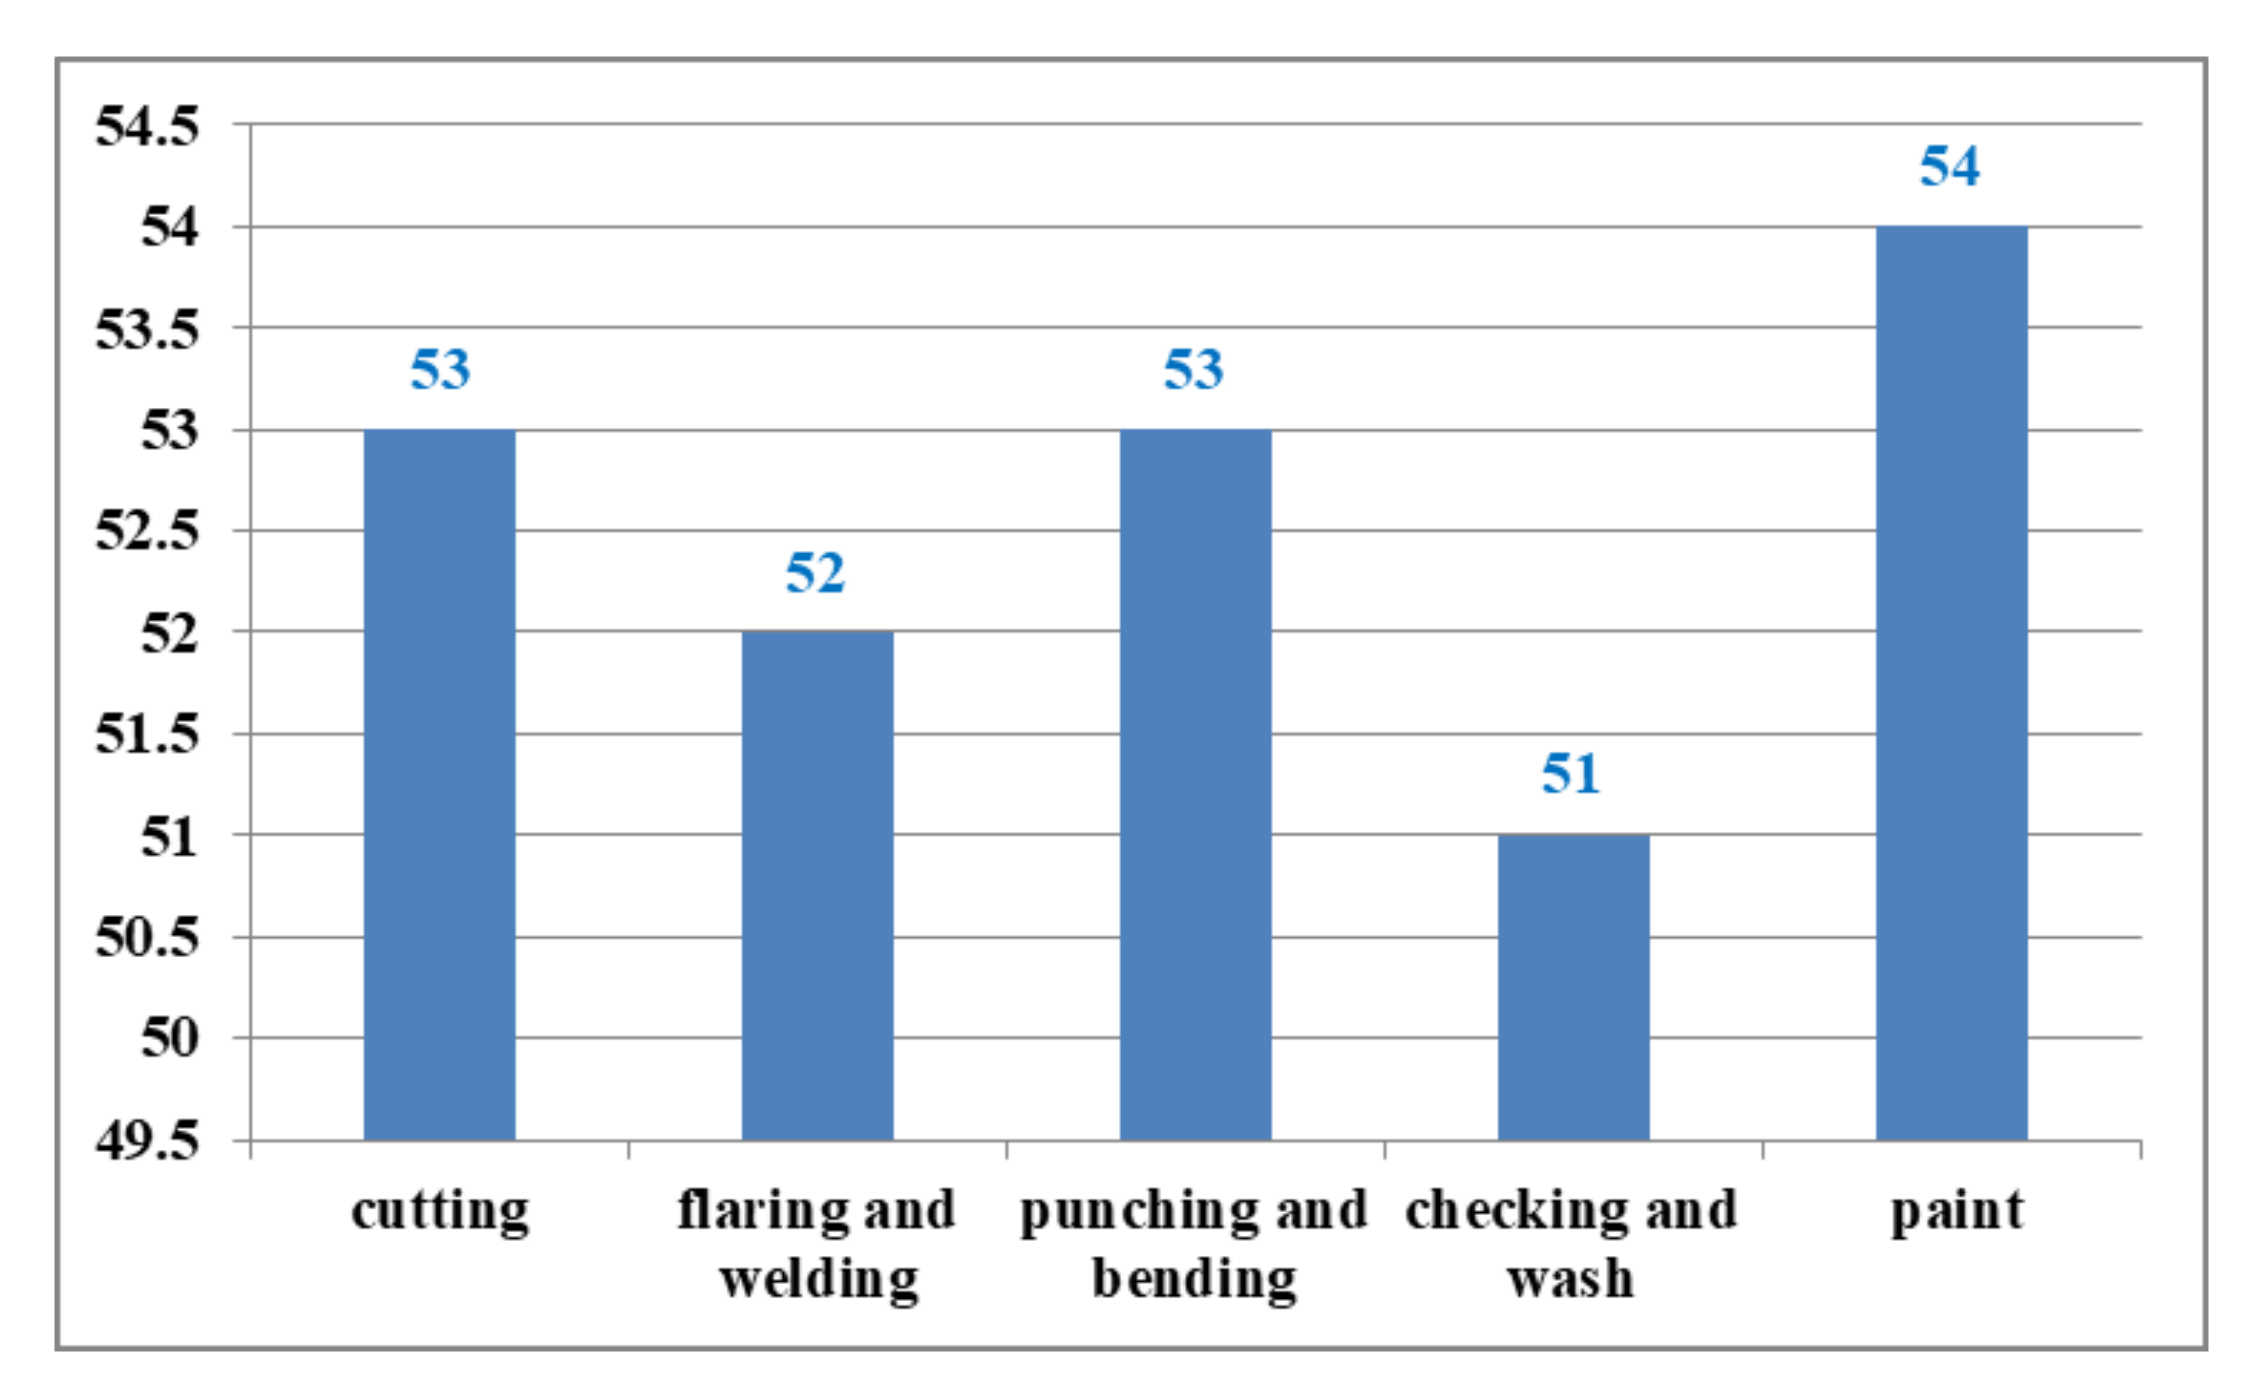
Figure 9.
Resource consumption of satellite dish kit production line (after improvement).


Table 1.
The result of satellite dish kit production line before and after improvement.
| Index | Before Improvement | After Improvement | Improvement (%) |
|---|---|---|---|
| Value-added time (/s) | 279 | 263 | 5.73 |
| Moving distance (m) | 95 | 24 | 74.4 |
| Non-value-added time (/day) | 14.58 | 6.08 | 58.30 |
| Value-added carbon emission (/kg CO2e) | 4.73 | 1.29 | 72.73 |
| Non-value-added carbon emission (/kg CO2e) | 16.76 | 7.24 | 56.80 |
| Total carbon emission (/kg CO2e) | 21.49 | 8.53 | 60.31 |
| Carbon benefit (CB) | 1 | 2.94 | 193.92 |
| Carbon efficiency (/s/kg CO2e) | 12.98 | 36.33 | 179.89 |
Publisher’s Note: MDPI stays neutral with regard to jurisdictional claims in published maps and institutional affiliations. |
© 2022 by the authors. Licensee MDPI, Basel, Switzerland. This article is an open access article distributed under the terms and conditions of the Creative Commons Attribution (CC BY) license (https://creativecommons.org/licenses/by/4.0/).
Share and Cite
MDPI and ACS Style
Zhu, X.; Xiao, Y.; Xiao, G. Decision-Making Model of Mechanical Components in a Lean–Green Manufacturing System Based on Carbon Benefit and Its Application. Processes 2022, 10, 2297. https://doi.org/10.3390/pr10112297
AMA Style
Zhu X, Xiao Y, Xiao G. Decision-Making Model of Mechanical Components in a Lean–Green Manufacturing System Based on Carbon Benefit and Its Application. Processes. 2022; 10(11):2297. https://doi.org/10.3390/pr10112297
Chicago/Turabian StyleZhu, Xiaoyong, Yongmao Xiao, and Gongwei Xiao. 2022. "Decision-Making Model of Mechanical Components in a Lean–Green Manufacturing System Based on Carbon Benefit and Its Application" Processes 10, no. 11: 2297. https://doi.org/10.3390/pr10112297
Note that from the first issue of 2016, this journal uses article numbers instead of page numbers. See further details here.