
Transient Pressure Behavior of Volume Fracturing Horizontal Wells in Fractured Stress-Sensitive Tight Oil Reservoirs

1
CNOOC Research Institute Co., Ltd., Beijing 100020, China
2
College of Petroleum Engineering, Xi’an Shiyou University, Xi’an 710065, China
*
Author to whom correspondence should be addressed.
Processes 2022, 10(5), 953; https://doi.org/10.3390/pr10050953
Submission received: 18 April 2022
/
Revised: 30 April 2022
/
Accepted: 2 May 2022
/
Published: 10 May 2022
(This article belongs to the Special Issue New Challenges in Advanced Process Control in Petroleum Engineering)
Abstract
:Tight oil reservoirs tend to contain more natural fractures, and the presence of natural fractures leads to a greater stress sensitivity in tight oil reservoirs. It is a very challenging task to model the seepage in the volume fracturing horizontal wells considering the stress-sensitive effects. Based on the Laplace transform, Perturbation transform and Stefest numerical inversion, this paper establishes a horizontal well seepage model for volume fracturing in fractured stress-sensitive tight oil reservoirs. This model allows us to analyze and study the effect of stress sensitivity, fracture interference, dual media and complex fracture network on seepage flow in tight oil reservoirs. We apply the model to delineate the seepage stages of volume fracturing horizontal wells, it can be divided into seven seepage stages I wellbore storage flow, II surface flow stage, III transition flow, IV natural fracture system proposed radial flow, V interporosity flow, VI system proposed radial flow and VII stress-sensitive flow stage. Wellbore storage coefficient mainly affects the flow in the wellbore storage stage. The larger the wellbore storage coefficient is, the longer the duration of wellbore storage flow will be. The higher the skin coefficient is, the greater the pressure drop is. The storage capacity ratio has a greater influence on the flow before the occurrence of channeling flow, and the “groove” depth on the derivative curve of dimensionless pressure drop becomes shallower with the increase in storage capacity ratio. The higher the channeling coefficient is, the earlier the channeling occurs from the matrix system to the natural fracture system and the more leftwing the “groove” position is.
1. Introduction
With the gradual decrease in conventional energy sources, the development of tight oil reservoirs, as one of the important alternative energy sources, has attracted the attention of oil companies worldwide [1]. Compared with the numerical simulation of conventional reservoirs, the simulation of seepage in tight oil reservoirs is more complicated [2]. The reasons are as follows: dense reservoir rocks are highly brittle and contain a large number of natural fractures, leading to the formation of complex fracture networks easily during large-scale hydraulic fracturing [3]. As early as the 1950s, scholars studied the stress-sensitive phenomenon in the formation [4,5,6]. Tight oil reservoirs have very low initial permeability and contain a large number of natural fractures, and are therefore highly stress sensitive. In 1971, Vairogs conducted stress-sensitive experiments on cores with different initial permeability, and the results showed that the lower the initial permeability the greater the stress sensitivity of the rock, and the appearance of natural fractures and shale streaks exacerbated the stress-sensitive phenomenon in the cores [7]. A large number of seepage models for volume fracturing horizontal wells in tight oil reservoirs have been established by domestic and foreign scholars, and these models can be classified into three categories: analytical models, semi-analytical models and numerical models.
This paper focuses on the semi-analytical model, and the semi-analytical seepage model for volume fracturing horizontal wells is described in detail below. Semi-analytic models are established based on source functions, and there are three source functions currently used in petroleum engineering to describe oil reservoir seepage: Gringarten source function, Ozkan dual medium source function and Valko volume source function [8,9]. Gringarten source function and Valko volume source function can only simulate single heavy media oil reservoir seepage problems, and Ozkan source function is more suitable for solving seepage problems in tight oil reservoirs containing a large number of natural fractures [10,11,12,13,14]. Scholars have used the Ozkan source function as a theoretical basis to model seepage in a large number of single volume fracturing horizontal wells in tight oil reservoirs [15,16,17,18,19,20,21]. In order to study the seepage pattern of multiple volume fracturing horizontal wells, scholars have developed mathematical models of seepage when multiple volume fracturing horizontal wells are produced simultaneously [22].
However, none of the above models can consider the effect of stress sensitivity of tight oil reservoirs on the seepage of the volume fracturing horizontal wells, and the subsurface fluid continuity equation will become a strongly nonlinear partial differential equation after considering stress sensitivity, which is much more difficult to solve [23]. In this paper, we transform the nonlinear partial differential equation into a linear partial differential equation by using Perturbation transform, and then apply Laplace transform, superposition principle and the “star-triangle” transform to establish a mathematical model of the seepage in volume fracturing horizontal well [24]. Finally, we apply Gauss–Jordan elimination method to obtain the solution of the mathematical model of seepage in Laplace space, and transform the Laplace space solution into a time–space solution by Stefhst (1970) numerical inversion. Using this model, we have systematically studied parameters such as stress sensitivity, capacity storage ratio, skin factor, wellbore storage effect and channeling flow coefficient, etc. The above research results are of great significance to the efficient exploitation of tight oil reservoirs.
2. Materials and Methods
Assuming that the volume fracturing horizontal wells in tight reservoirs contain 24 fractures (as shown in Figure 1), the fracturing horizontal well seepage flow can be divided into three parts: reservoir seepage flow, flow within the complex fracture network and horizontal wellbore variable mass tubular flow. Due to the small pressure drop of the variable mass tubular flow in the horizontal wellbore, it is ignored here [15].
2.1. Mathematical Model of Oil Reservoir Seepage
Tight oil reservoirs are dual media reservoirs, consisting of a natural fracture system as well as a matrix system, and the equation of fluid continuity in the natural fracture system is:
where kf is permeability of natural fracture, μm2; μ is crude oil viscosity, mpa s; r is radius, m; pf is pressure of natural fracture, Pa; φ is porosity, fractional; c is compression coefficient, pa−1; and t is time, s.
Assuming a proposed steady-state channeling flow between the matrix system and the natural fracture system, the matrix system seepage control equation is:
Considering the stress sensitivity of the natural fracture system, the natural fracture permeability can be expressed as [25]:
where α is the stress sensitivity coefficient, fractional.
The single fracture source function is obtained from Perturbation transform, Laplace transform and the mirror principle as [26]:
where lf is fracture length, m and qf is flow rate of natural fracture, m3/s.
Equation (4) can only solve the fracture vertical horizontal wellbore seepage problem. From the principle of coordinate translation and coordinate transformation, we can obtain the source function for the existence of any angle between the fracture and the horizontal wellbore.
where θ is fracture dip angle, °.
Considering that fractures interfere with each other within the volumetric fracture network, according to the superposition principle, the expression for the dimensionless pressure drop for any one fracture in the volume fracturing horizontal well schematic (Figure 1) is of the following form [27]:
The resistance to seepage without considering fractures is:
Limitation requirement for the sum of the dimensionless yields of 1 for each fracture:
2.2. Mathematical Model of Seepage within Complex Fracture Networks
Assuming that the fluid in the fracture satisfies the one-dimensional Darcy seepage, the expression for the seepage in the fracture is given by the “star-triangle” transformation method [28]:
where T is interfracture conductivity; A is fracture intersection area, m2; D is distance between two fracture centers, m; and h is oil reservoir thickness, m.
2.3. Mathematical Model for Coupled Seepage in Volume Fracturing Horizontal Wells of Tight Oil Reservoirs
Combining Equations (6)–(8) and (11), the continuity condition of equal pressure and flow at the boundary yields:
Equation (18) is the volume fracturing horizontal well capacity model in Figure 1. There are 24 fractures in the fracture network, and the unknowns include (), (), , , , , , , , and , a total of 57. The number of equations in the matrix is also 57, so the system of equations is solvable, and the solution of the system of equations can be obtained by the Gauss–Jordan elimination method.
The expression for the pressure drop at the bottom of the well considering stress sensitivity is obtained from the Perturbed inverse transformation:
Equation (15) is the formula for the dimensionless bottomhole pressure drop without considering the wellbore storage and skin coefficient, and the formula for the bottomhole pressure drop considering the wellbore storage and skin coefficient is:
where C is wellbore storage coefficient; S is well skin; and s Laplace variables.
The solution of Equation (16) in time space can be obtained by using the numerical inversion of Stehfest [29].
3. Results
3.1. Seepage Staging of Volume Fracturing Horizontal Well in Tight Oil Reservoir
Taking the volume fracturing horizontal well in Figure 1 as an example, other data for tight oil reservoirs are summarized as shown in Table 1.
The test curves for fracturing horizontal wells in both cases are given in Figure 2. The green line is the test curve when stress sensitivity, wellbore storage and well skin are not considered, and the red line is the test curve when these factors are considered. The well test curve of the first case can be divided into seven seepage stages, which are: linear flow within the fracture, fracture-formation bilinear flow, formation linear flow, transition flow, natural fracture system proposed radial flow, interporosity flow and system proposed radial flow. The well test curve for the second case can be similarly divided into seven seepage stages (as shown in Figure 2): I wellbore storage flow, II surface flow stage, III transition flow, IV natural fracture system proposed radial flow, V interporosity flow, VI system proposed radial flow and VII stress-sensitive flow stage, respectively. Comparing the well test curves for the two cases in Figure 2, when considering wellbore storage, well skin and stress sensitivity, the wellbore storage flow and skin flow phases mask the in-fracture linear flow, fracture-formation bilinear flow, and formation linear flow; the slope of the dimensionless pressure drop derivative in the well test curve is 1. The values of pressure drop and pressure drop derivative of IV natural fracture system proposed radial flow, V interporosity flow, VI system proposed radial flow and VII stress-sensitive flow stage gradually increase due to the reservoir stress sensitivity. It should be noted that the well pressure drop when considering wellbore storage is lower than when not considering wellbore storage, indicating that wellbore storage is a beneficial factor for well production.
3.2. Sensitivity Analysis
To further clarify the influence of each factor on the seepage of volume fracturing horizontal wells, we performed sensitivity analysis on key parameters such as stress sensitivity factor, wellbore storage factor, well skin factor and storage capacity ratio.
3.2.1. Stress Sensitivity Factor Analysis
The oil reservoir base parameters are shown in Table 1, and when the stress sensitivity coefficients are 0.05, 0.08 and 0.10, respectively, the well test curves change as shown in Figure 3. As can be seen from Figure 3, the stress sensitivity factor has no effect on the early seepage, and mainly affects the late stage of well exploitation. The larger the stress sensitivity factor is, the larger the upwarping amplitude of the late well test curve is.
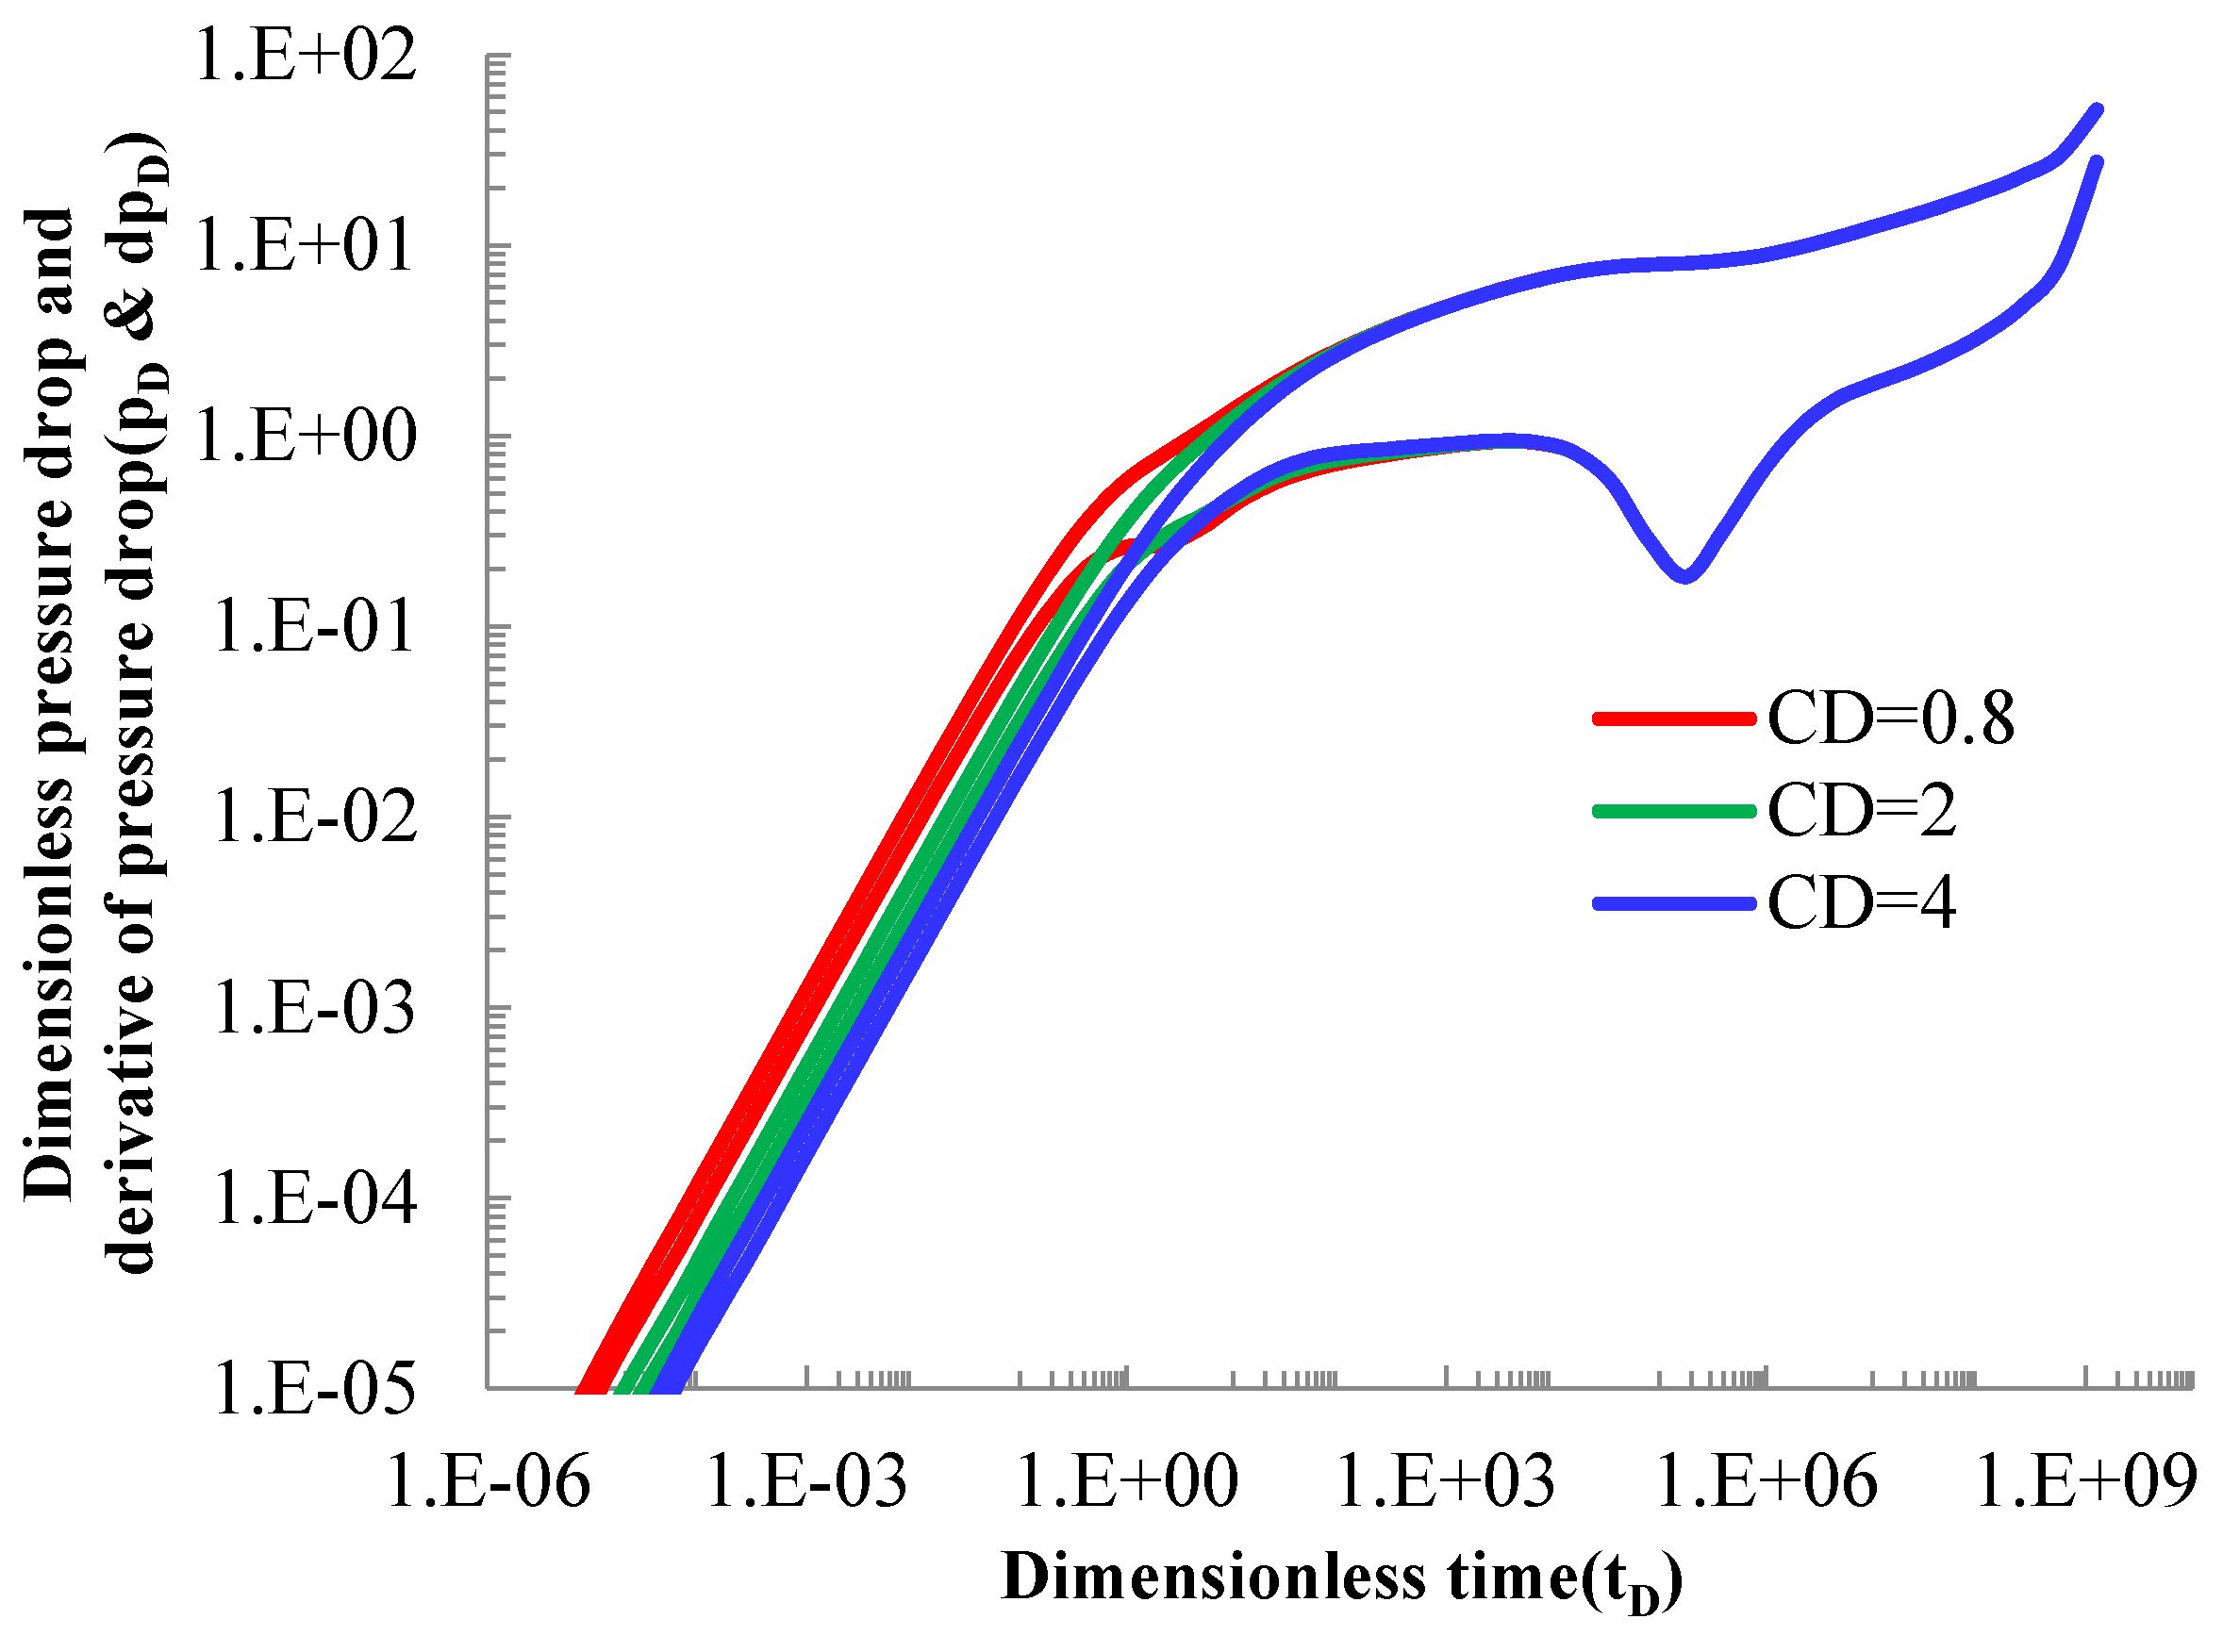
3.2.2. Wellbore Storage Factor Sensitivity Analysis
The oil reservoir base parameters are shown in Table 1, and when the wellbore storage coefficients are 0.8, 2 and 4, respectively, the well test curves change as shown in Figure 4. From Figure 4, it can be seen that the wellbore storage coefficient mainly affects the pre-well seepage flow and has no effect on the post-seepage flow. The larger the wellbore storage coefficient, the longer the duration of the wellbore storage flow phase, even masking the well skin flow phase.
3.2.3. Sensitivity Analysis of Skin Coefficients
The oil reservoir base parameters are shown in Table 1, and when the skin coefficient is 0.5, 1 and 2, respectively, the well test curve changes as shown in Figure 5. As can be seen from Figure 5, the skin coefficient has a greater effect on the later seepage, and the larger the skin coefficient the greater the well pressure drop and the larger the upwarping amplitude of the dimensionless pressure drop derivative curve.
3.2.4. Storage Capacity Ratio Sensitivity Analysis
The oil reservoir base parameters are shown in Table 1, and when the reservoir storage capacity ratio is 0.03, 0.1 and 0.3, respectively, the well test curves change as shown in Figure 6. The storage capacity ratio mainly affects the seepage before the occurrence of interporosity flow, but has no effect on the seepage after the occurrence of channeling flow. The larger the storage capacity ratio, the shallower the “notch” in the channeling stage.
3.2.5. Sensitivity Analysis of Channeling Flow Coefficient
The oil reservoir base parameters are shown in Table 1, and when the interporosity flow coefficient is 10−6, 10−4 and 10−2, respectively, the well test curves change as shown in Figure 7. As can be seen from Figure 7, the channeling flow coefficient mainly affects the timing of fugacity between the matrix system and the natural fracture system. The larger the channeling flow coefficient is, the earlier the channeling flow occurs between the two systems and the more the “notch” position is to the left.
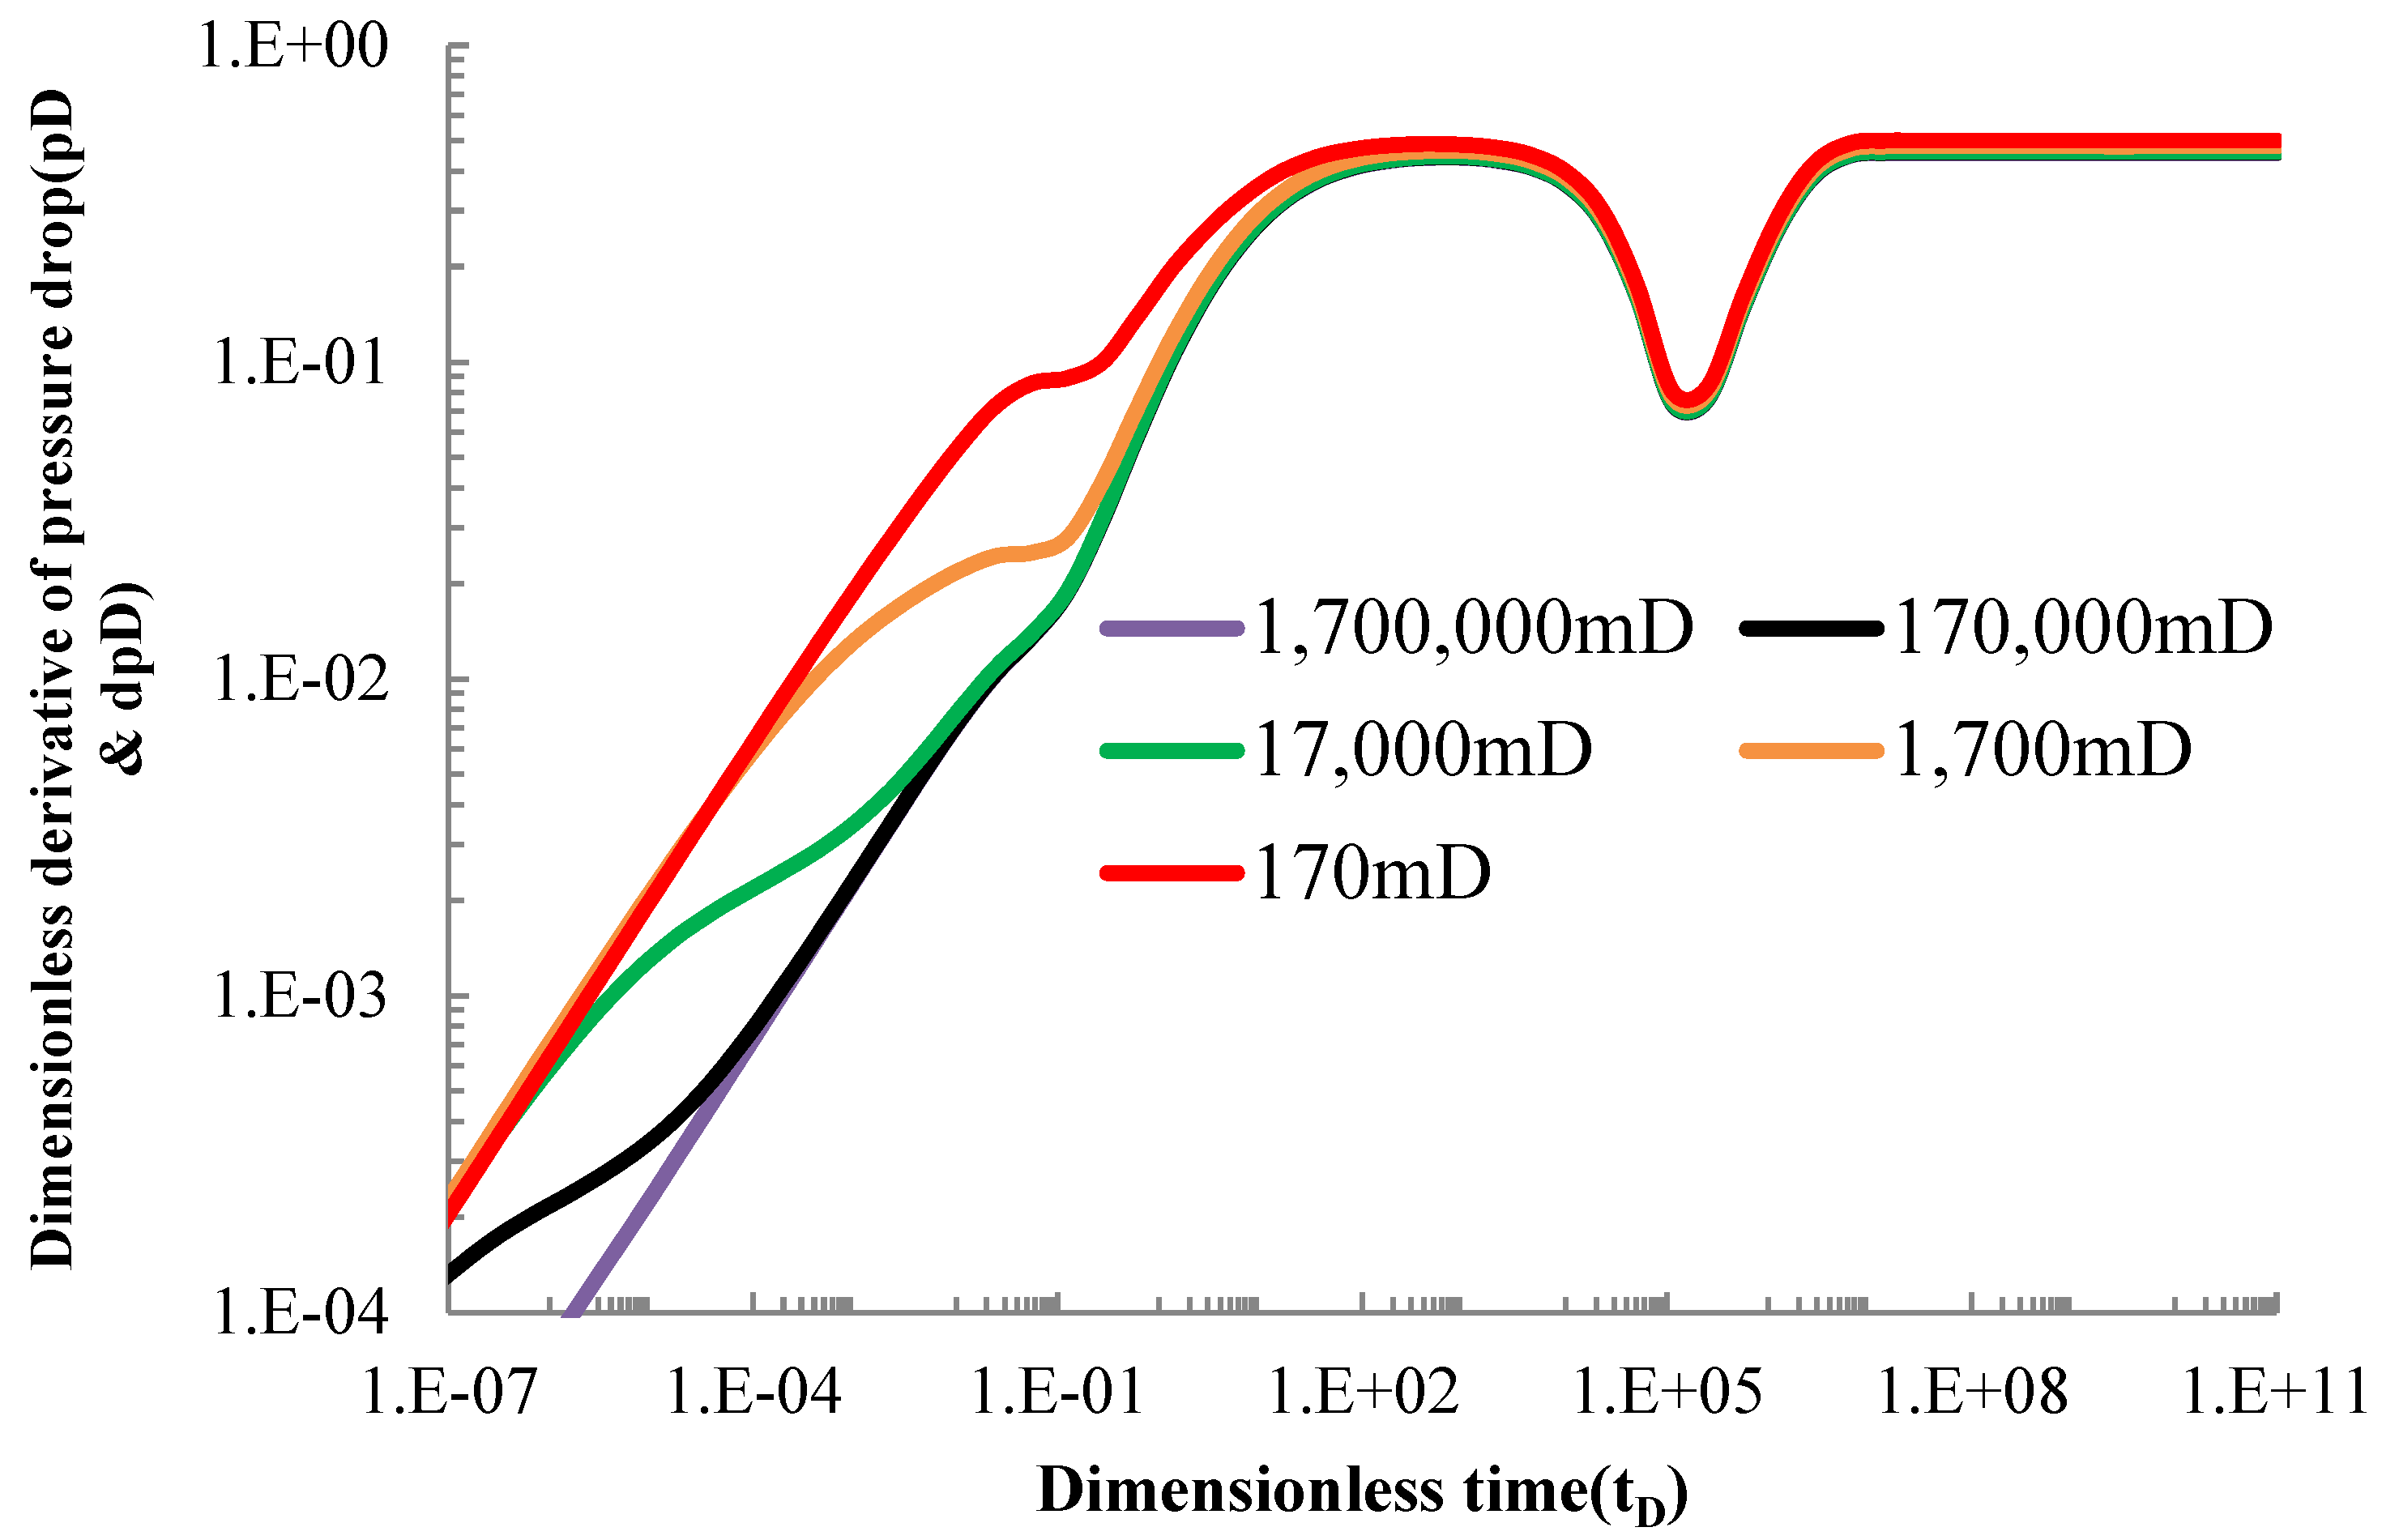
3.2.6. Sensitivity Analysis of Permeability of Volumetric Fracture Network
Assuming that all fractures in the complex fracture network have the same permeability, when fracture permeability is 170 mD, 170 0mD, 17,000 mD, 170,000 mD and 1,700,000 mD, respectively. The derivative of dimensionless pressure drop is shown in Figure 8. It can be seen from Figure 8 that fracture network permeability mainly has a great impact on the first three flow stages. With the increase in permeability, the duration of linear flow and bilinear flow becomes shorter and shorter. When the fracture permeability increases to 1,700,000 mD, the linear flow and bilinear flow disappear. This indicates that the fracture permeability is very high, and the fluid entering the fracture reaches the horizontal wellbore almost instantly.
4. Discussion
The model can be divided into seven stages: linear flow in fracture, bilinear flow between fracture and formation, linear flow in formation, transition flow, quasi-radial flow in natural fracture system, interporosity flow and stress-sensitive flow. In the linear flow stage, most of the fluid comes from inside the fracture. The slope of the well test curve at this stage is 0.5. Bilinear flow between fracture and formation, in this stage the fluid is mainly from the fracture and near the fracture. The slope of the well test curve is 0.25, which is consistent with the results in the literature of Cinco-Ley et al. in 1978 [30]. Formation linear flow, fluid is mainly from the formation. The slope of the well test curve is 0.5, which is consistent with Gringarten and Ramey, 1974a; Gringarten et al., 1974b [8,31]; Horne and Temeng, 1995 [32]; Chu et al., 2019 [33]. The transition flow is between the linear flow of the formation and the quasi-radial flow of the natural fracture system. Natural fracture system quasi-radial flow, at this stage the slope of well test curve is 0. The interporosity phase, in which fluid from the matrix system begins to flow toward the natural fracture system, well test curve appears as a “trough”, consistent with results reported by Chen Zhiming et al., 2015 [10]. Stress sensitivity flow, in this stage stress sensitivity has obvious influence on reservoir pressure drop, and the well test curve is obviously upwarped [34,35,36].
5. Conclusions
The following insights were gained in the course of the study.
- (1)
- The wellbore storage factor mainly affects the wellbore storage phase flow, the larger the wellbore storage factor, the longer the duration of the wellbore storage flow. The well skin has a greater impact on later development; the larger the skin coefficient, the greater the well pressure drop.
- (2)
- Formation stress sensitivity mainly affects the seepage characteristics of wells in the late development period. The larger the stress sensitivity coefficient is, the larger the upwarping amplitude of the dimensionless pressure drop derivative curve is.
- (3)
- The storage capacity ratio has a relatively large impact on the flow before the occurrence of channeling flow, and the depth of the “notch” on the pressure drop derivative curve becomes shallower as the storage capacity ratio increases. The channeling flow coefficient mainly affects the timing of the channeling flow phase. The larger the channeling flow coefficient, the earlier the channeling flow of the matrix system to the natural fracture system, and the more to the left the “notch” position.
Author Contributions
Conceptualization, Z.L. and G.B.; methodology, X.Y.; software, M.W.; validation, N.M. and Z.L.; formal analysis, G.B.; investigation, M.W.; resources, X.Y.; data curation, Z.R.; writing—original draft preparation, Z.L.; writing—review and editing, M.W.; supervision, Z.R.; project administration, N.M.; funding acquisition, G.B. All authors have read and agreed to the published version of the manuscript.
Funding
The authors gratefully acknowledge the support of the National Natural Science Foundation of China (No. 51804258, No. 52104033) and the Natural Science Basic Research Program of Shaanxi Province(2019JQ-807).
Conflicts of Interest
The authors declare no conflict of interest.
References
- Ashraf, U.; Zhang, H.; Anees, A.; Mangi, H.N.; Ali, M.; Zhang, X.; Imraz, M.; Abbasi, S.S.; Abbas, A.; Ullah, Z.; et al. A Core Logging, Machine Learning and Geostatistical Modeling Interactive Approach for Subsurface Imaging of Lenticular Geobodies in a Clastic Depositional System, SE Pakistan. Nonrenewable Resour. 2021, 30, 2807–2830. [Google Scholar] [CrossRef]
- Ashraf, U.; Zhang, H.; Anees, A.; Ali, M.; Zhang, X.; Abbasi, S.S.; Mangi, H.N. Controls on Reservoir Heterogeneity of a Shallow-Marine Reservoir in Sawan Gas Field, SE Pakistan: Implications for Reservoir Quality Prediction Using Acoustic Impedance Inversion. Water 2020, 12, 2972. [Google Scholar] [CrossRef]
- Fisher, M.K.; Heinze, J.R.; Harris, C.D.; Davidson, B.M.; Wright, C.A.; Dunn, K.P. Optimizing horizontal completion techniques in the barnett shale using microseismic fracture mapping. In Proceedings of the SPE Annual Technical Conference and Exhibition, Houston, TX, USA, 26−29 September 2004. [Google Scholar]
- Fatt, I.; Davis, T.H. Reduction in permeability with overburden pressure. J. Pet. Technol. 1952, 4, 16. [Google Scholar] [CrossRef]
- Ali, H.S.; Al-Marhoun, M.A.; Abu-Khamsin, S.A.; Celik, M.S. The effect of overburden pressure on relative permeability. In Proceedings of the Fifth SPE Middle East Oil Show, Manama, Bahrain, 7−10 March 1987. [Google Scholar]
- Gray, D.H.; Fatt, I. The Effect of Stress on Permeability of Sandstone Cores. Soc. Pet. Eng. J. 1963, 3, 95–100. [Google Scholar] [CrossRef]
- Vairogs, J.; Hearn, C.L.; Dareing, D.W.; Rhoades, V.W. Effect of Rock Stress on Gas Production From Low-Permeability Reservoirs. J. Pet. Technol. 1971, 23, 1161–1167. [Google Scholar] [CrossRef]
- Gringarten, A.C.; Ramey, H.J.; Raghavan, R. Unsteady-state pressure distributions created by a well with a single infinite-conductivity vertical fracture. SPE J. 1973, 14, 347–360. [Google Scholar] [CrossRef] [Green Version]
- Valko, P.P.; Amini, S. The method of distributed volumetric sources for calculating the transient and pseudosteady-state productivity of complex well-fracture configurations. In Proceedings of the 2007 SPE Hydraulic Fracturing Technology Conference, College Station, TX, USA, 29−31 January 2007. [Google Scholar]
- Chen, Z.M.; Liao, X.W.; Zhao, X.L.; Lv, S.B.; Zhu, L.T. A semi-analytical approach for obtaining type curves of multiple-fractured horizontal wells with secondary-fracture networks. SPE J. 2016, 21, 538–549. [Google Scholar] [CrossRef]
- Luo, W.J.; Tang, C.F. Pressure-transient analysis of multiwing fractures connected to a vertical wellbore. SPE J. 2014, 20, 360–367. [Google Scholar]
- Jia, P.; Cheng, L.S.; Huang, S.J.; Liu, H.J. Transient behavior of complex fracture networks. J. Pet. Sci. Eng. 2015, 132, 1–17. [Google Scholar] [CrossRef]
- Ren, Z.X.; Wu, X.D.; Liu, D.D.; Ray, R.; Guo, W.; Chen, Z.M.; Zhang, J.M.; Wu, X.J.; Zhang, H.; Tang, Z.G. Semi-analytical model of the transient pressure behavior of complex fracture networks in tight oil reservoirs. J. Nat. Gas Sci. Eng. 2016, 35, 497–508. [Google Scholar]
- Zhao, Y.L.; Zhang, L.H.; Liu, Y.H.; Hu, S.Y.; Liu, Q.G. Transient pressure analysis of fractured well in bi-zonal gas reservoirs. J. Hydrol. 2015, 524, 89–99. [Google Scholar] [CrossRef]
- Zhao, Y.-L.; Xie, S.-C.; Peng, X.; Zhang, L.-H. Transient pressure response of fractured horizontal wells in tight gas reservoirs with arbitrary shapes by the boundary element method. Environ. Earth Sci. 2016, 75, 1220. [Google Scholar] [CrossRef]
- Zhao, Y.L.; Zhang, L.H.; Shan, B.C. Mathematical model of fractured horizontal well in shale gas reservoir with rectangular stimulated reservoir volume. J. Nat. Gas Sci. Eng. 2018, 59, 67–79. [Google Scholar] [CrossRef]
- Xu, J.C.; Sun, B.J.; Chen, B.L. A hybrid embedded discrete fracture model for simulating tight porous media with complex fracture systems. J. Pet. Sci. Eng. 2019, 174, 131–143. [Google Scholar] [CrossRef]
- Al-Alwani, M.A.; Dunn-Norman, S.; Britt, L.K.; Alkinani, H.H.; Al-Hameedi, A.T.T.; Al-Attar, A.M.; Trevino, H.A.; Al-Bazzaz, W.H. Production Performance Evaluation from Stimulation and Completion Parameters in the Permian Basin: Data Mining Approach. In Proceedings of the Asia Pacific Unconventional Resources Technology Conference, Brisbane, Australia, 18−19 November 2019; pp. 995–1008. [Google Scholar]
- Chen, Z.; Shi, L. Parameter estimations of complex fracture networks using pressure transient analysis in fracturing-shutting data from shale oil wells. In Proceedings of the SPE/AAPG/SEG Unconventional Resources Technology Conference, Virtual, 20−22 July 2020. [Google Scholar]
- Cumming, J.A.; Botsas, T.; Jermyn, I.H.; Gringarten, A.C. Assessing the Non-uniqueness of a Well Test Interpretation Model Using a Bayesian Approach. In Proceedings of the 82nd EAGE Annual Conference & Exhibition. European Association of Geoscientists & Engineers, Virtual, 1−3 December 2020; pp. 1–23. [Google Scholar]
- Dong, P.; Chen, Z.; Liao, X.; Yu, W. Application of deep learning on well-test interpretation for identifying pressure behavior and characterizing reservoirs. J. Pet. Sci. Eng. 2021, 208, 109264. [Google Scholar] [CrossRef]
- Jia, P.; Cheng, L.; Clarkson, C.R.; Huang, S.; Wu, Y.; Williams-Kovacs, J.D. A novel method for interpreting water data during flowback and early-time production of multi-fractured horizontal wells in shale reservoirs. Int. J. Coal Geol. 2018, 200, 186–198. [Google Scholar] [CrossRef]
- Jia, P.; Cheng, L.S.; Clarkson, C.R.; Williams-Kovacs, J.D.; Wang, S.; Wang, D. Dynamic coupling of analytical linear flow solution and numerical fracture model for simulating early-time flowback of fractured tight oil wells (planar fracture and complex fracture network). J. Pet. Sci. Eng. 2019, 177, 1–23. [Google Scholar] [CrossRef]
- Ren, Z.X.; Yan, R.F.; Huang, X.; Liu, W.Q.; Yuan, S.B.; Xu, J.P.; Jiang, H.Y.; Zhang, J.M.; Yan, R.T.; Qu, Z. The transient pressure behavior model of multiple horizontal wells with complex fracture networks in tight oil reservoir. J. Pet. Sci. Eng. 2019, 173, 650–665. [Google Scholar] [CrossRef]
- Pedrosa, O.A. Pressure Transient Response in Stress-Sensitive Formations. In Proceedings of the Spe California Regional Meeting, Oakland, CA, USA, 2−4 April 1986. [Google Scholar]
- Ren, Z.X.; Wu, X.D.; Han, G.Q.; Liu, L.Y.; Wu, X.J.; Zhang, G.H.; Lin, H.; Zhang, J.M.; Zhang, X.W. Transient pressure behavior of multi-stage fractured horizontal wells in stress-sensitive tight oil reservoirs. J. Pet. Sci. Eng. 2017, 157, 1197–1208. [Google Scholar]
- Raghavan, R.S.; Chen, C.C.; Bijan, A. An Analysis of Horizontal Wells Intercepted by Multiple Fractures. SPE J. 1997, 2, 235–245. [Google Scholar] [CrossRef]
- Karimi-Fard, M.; Durlofsky, L.J.; Aziz, K. An Efficient Discrete-Fracture Model Applicable for General-Purpose Reservoir Simulators. SPE J. 2004, 9, 227–236. [Google Scholar] [CrossRef]
- Stehfest, H. Numerical inversion of laplace transforms. Commun. ACM 1970, 13, 47–49. [Google Scholar] [CrossRef]
- Cinco, L.; Samaniego, V.; Dominguez, A. Transient pressure behavior for a well with a finite-conductivity vertical fracture. Soc. Petrol. Eng. J. 1978, 18, 253–264. [Google Scholar] [CrossRef] [Green Version]
- Gringarten, A.C.; Ramey, H.J., Jr. Unsteady-state pressure distributions created by a well with a single horizontal fracture, partial penetration, or restricted entry. Soc. Petrol. Eng. J. 1974, 14, 413–426. [Google Scholar] [CrossRef]
- Horne, R.; Temeng, K.O. Relative productivities and pressure transient modeling of horizontal wells with multiple fractures. Middle East Oil Show. OnePetro 1995, 5, 563–574. [Google Scholar]
- Chu, H.; Liao, X.; Chen, Z.; Zhao, X.; Liu, W.; Zou, J. Pressure transient analysis in fractured reservoirs with poorly connected fractures. J. Nat. Gas Sci. Eng. 2019, 67, 30–42. [Google Scholar] [CrossRef]
- Xu, J.; Wu, K.; Li, R.; Li, Z.; Li, J.; Xu, Q.; Chen, Z. Real gas transport in shale matrix with fractal structures. Fuel 2018, 219, 353–363. [Google Scholar] [CrossRef]
- Xu, J.; Wu, K.; Li, R.; Li, Z.; Li, J.; Xu, Q.; Li, L.; Chen, Z. Nanoscale pore size distribution effects on gas production from fractal shale rocks. Fractals 2019, 27, 1950142. [Google Scholar] [CrossRef]
- Xu, J.; Chen, Z.; Li, R. Impacts of pore size distribution on gas injection in intraformational water zones in oil sands reservoirs. Oil Gas Sci. Technol.–Rev. d’IFP Energies Nouv. 2020, 75, 75. [Google Scholar] [CrossRef]
Figure 1.
Schematic diagram of volume fracturing horizontal well.

Figure 2.
Well test curve of volume fracturing horizontal well in tight oil reservoir.(The green line is the test curve when stress sensitivity, wellbore storage and well skin are not considered, and the red line is the test curve when these factors are considered.)
Figure 2.
Well test curve of volume fracturing horizontal well in tight oil reservoir.(The green line is the test curve when stress sensitivity, wellbore storage and well skin are not considered, and the red line is the test curve when these factors are considered.)
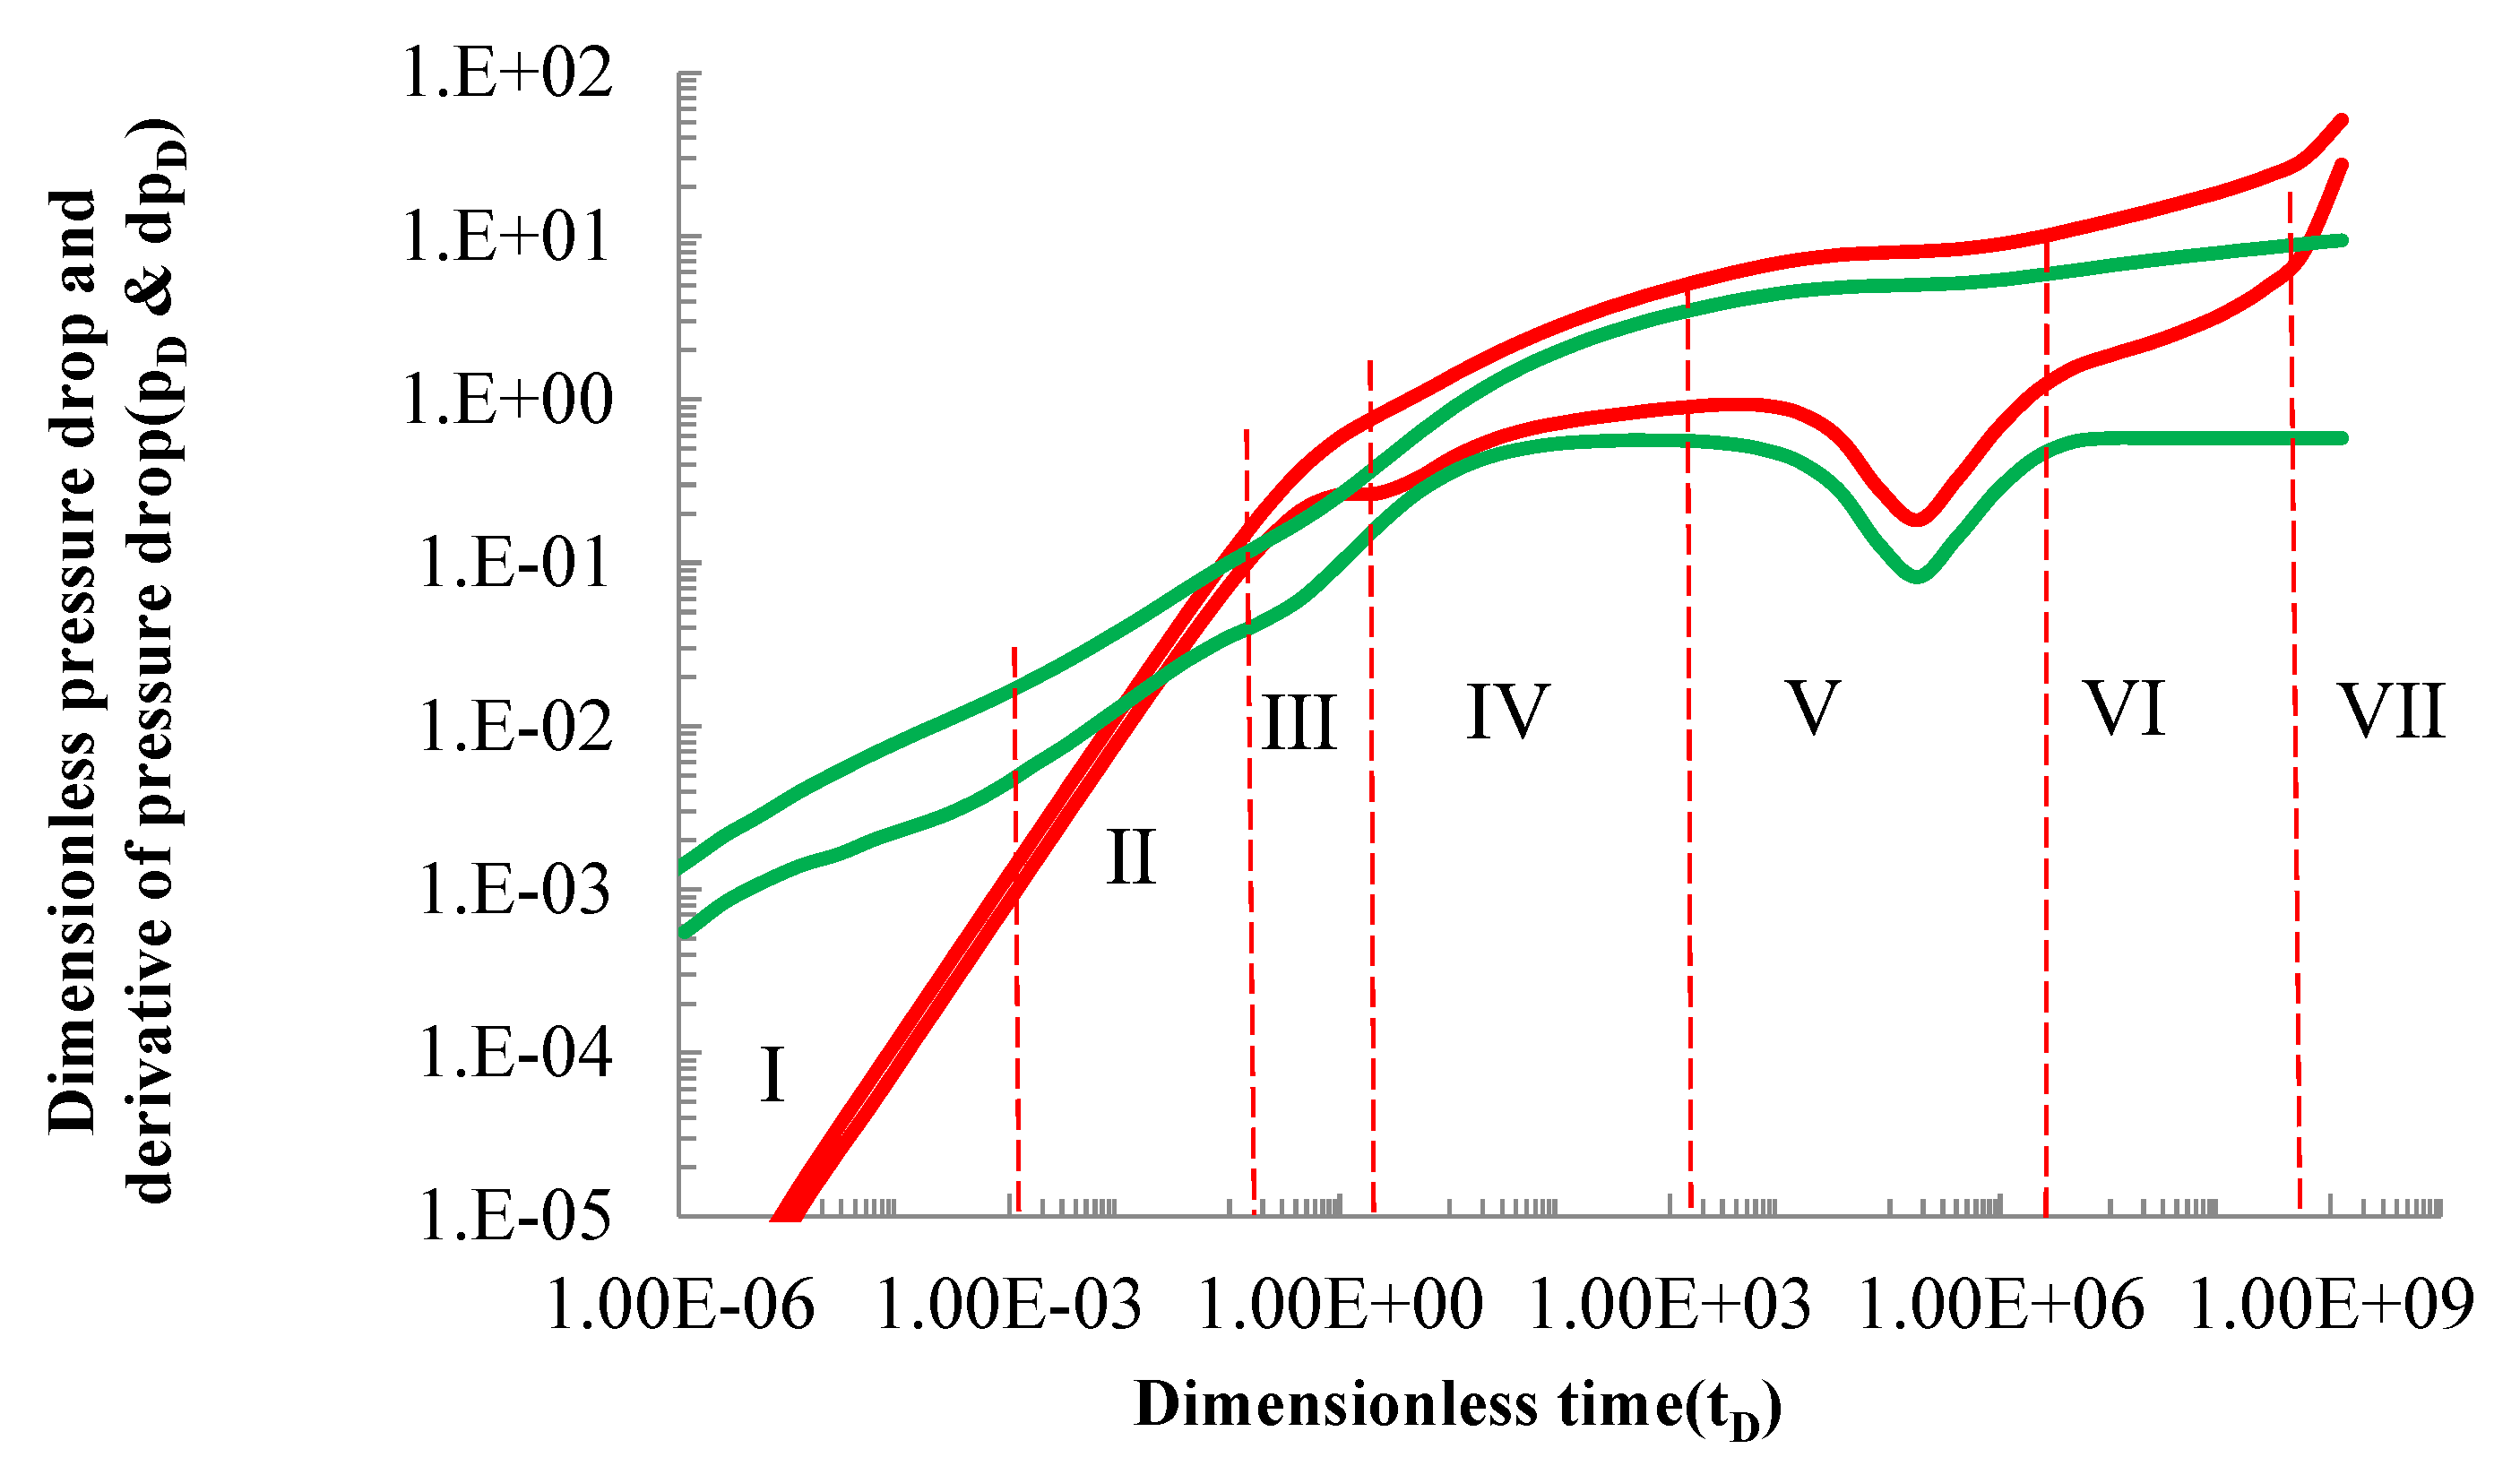
Figure 3.
Well test curve of formation stress sensitivity analysis.
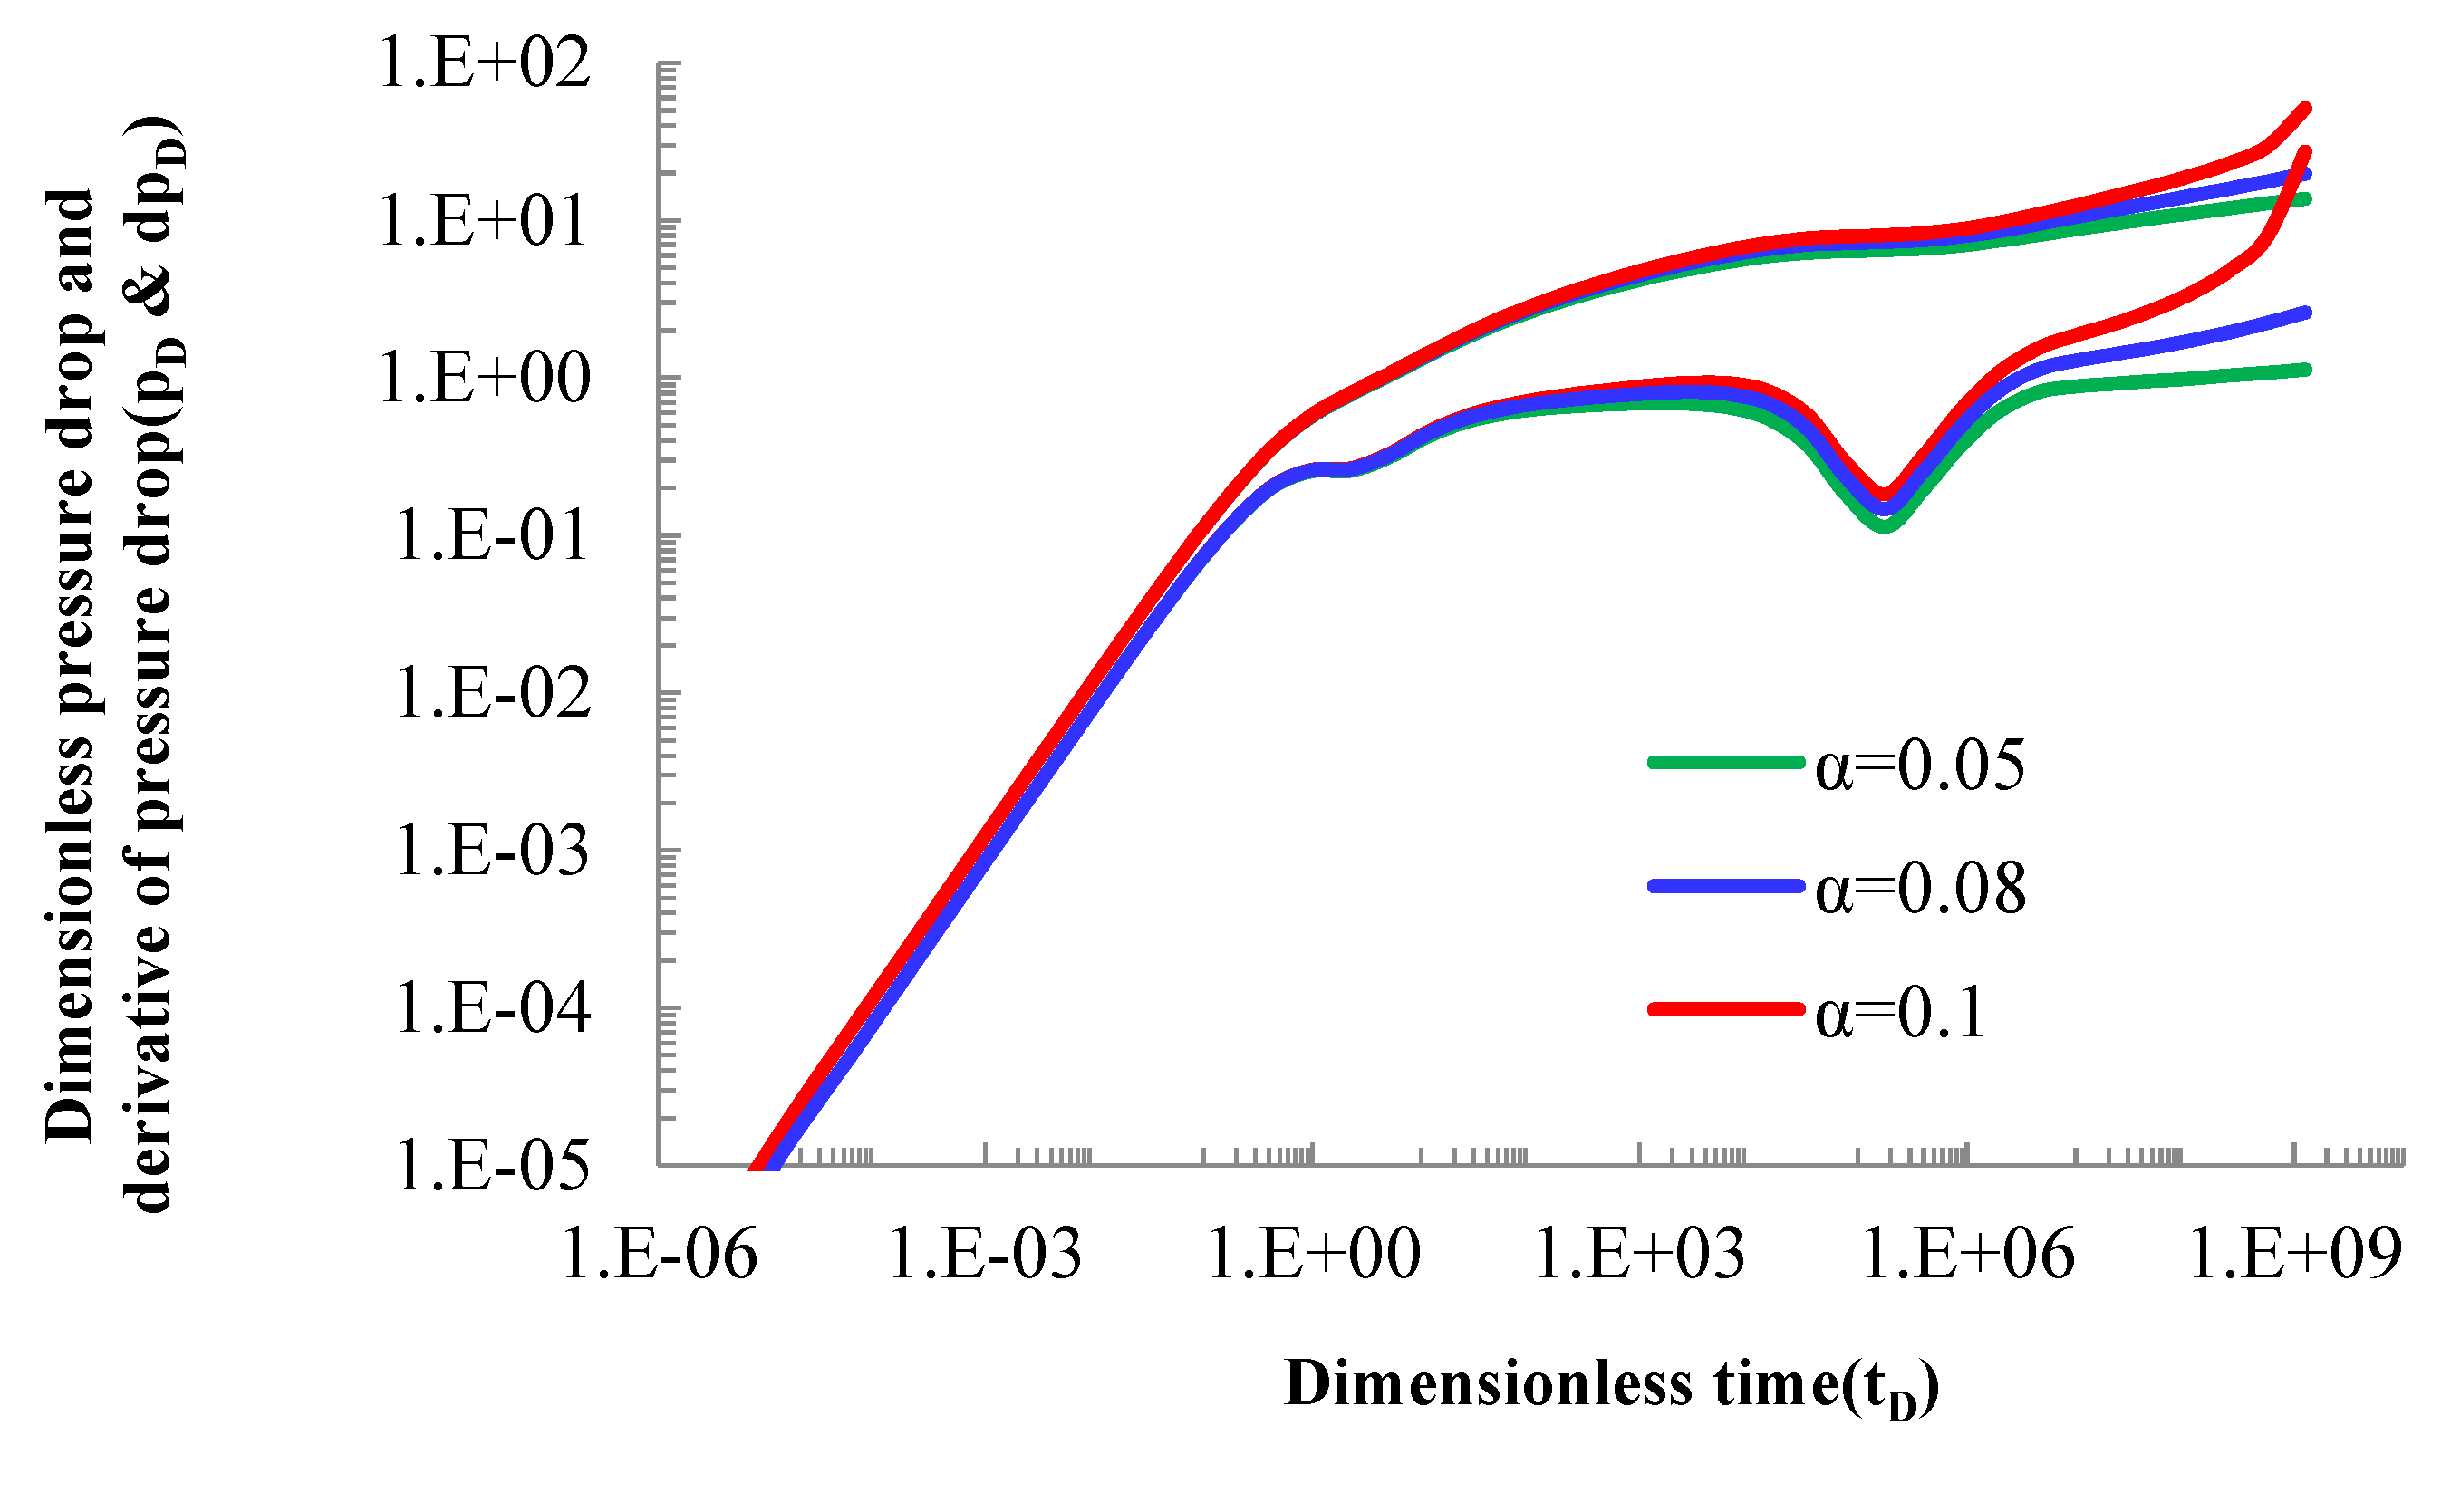
Figure 4.
Well test curve of wellbore storage coefficient sensitivity analysis.

Figure 5.
Well test curve of skin coefficient sensitivity analysis.
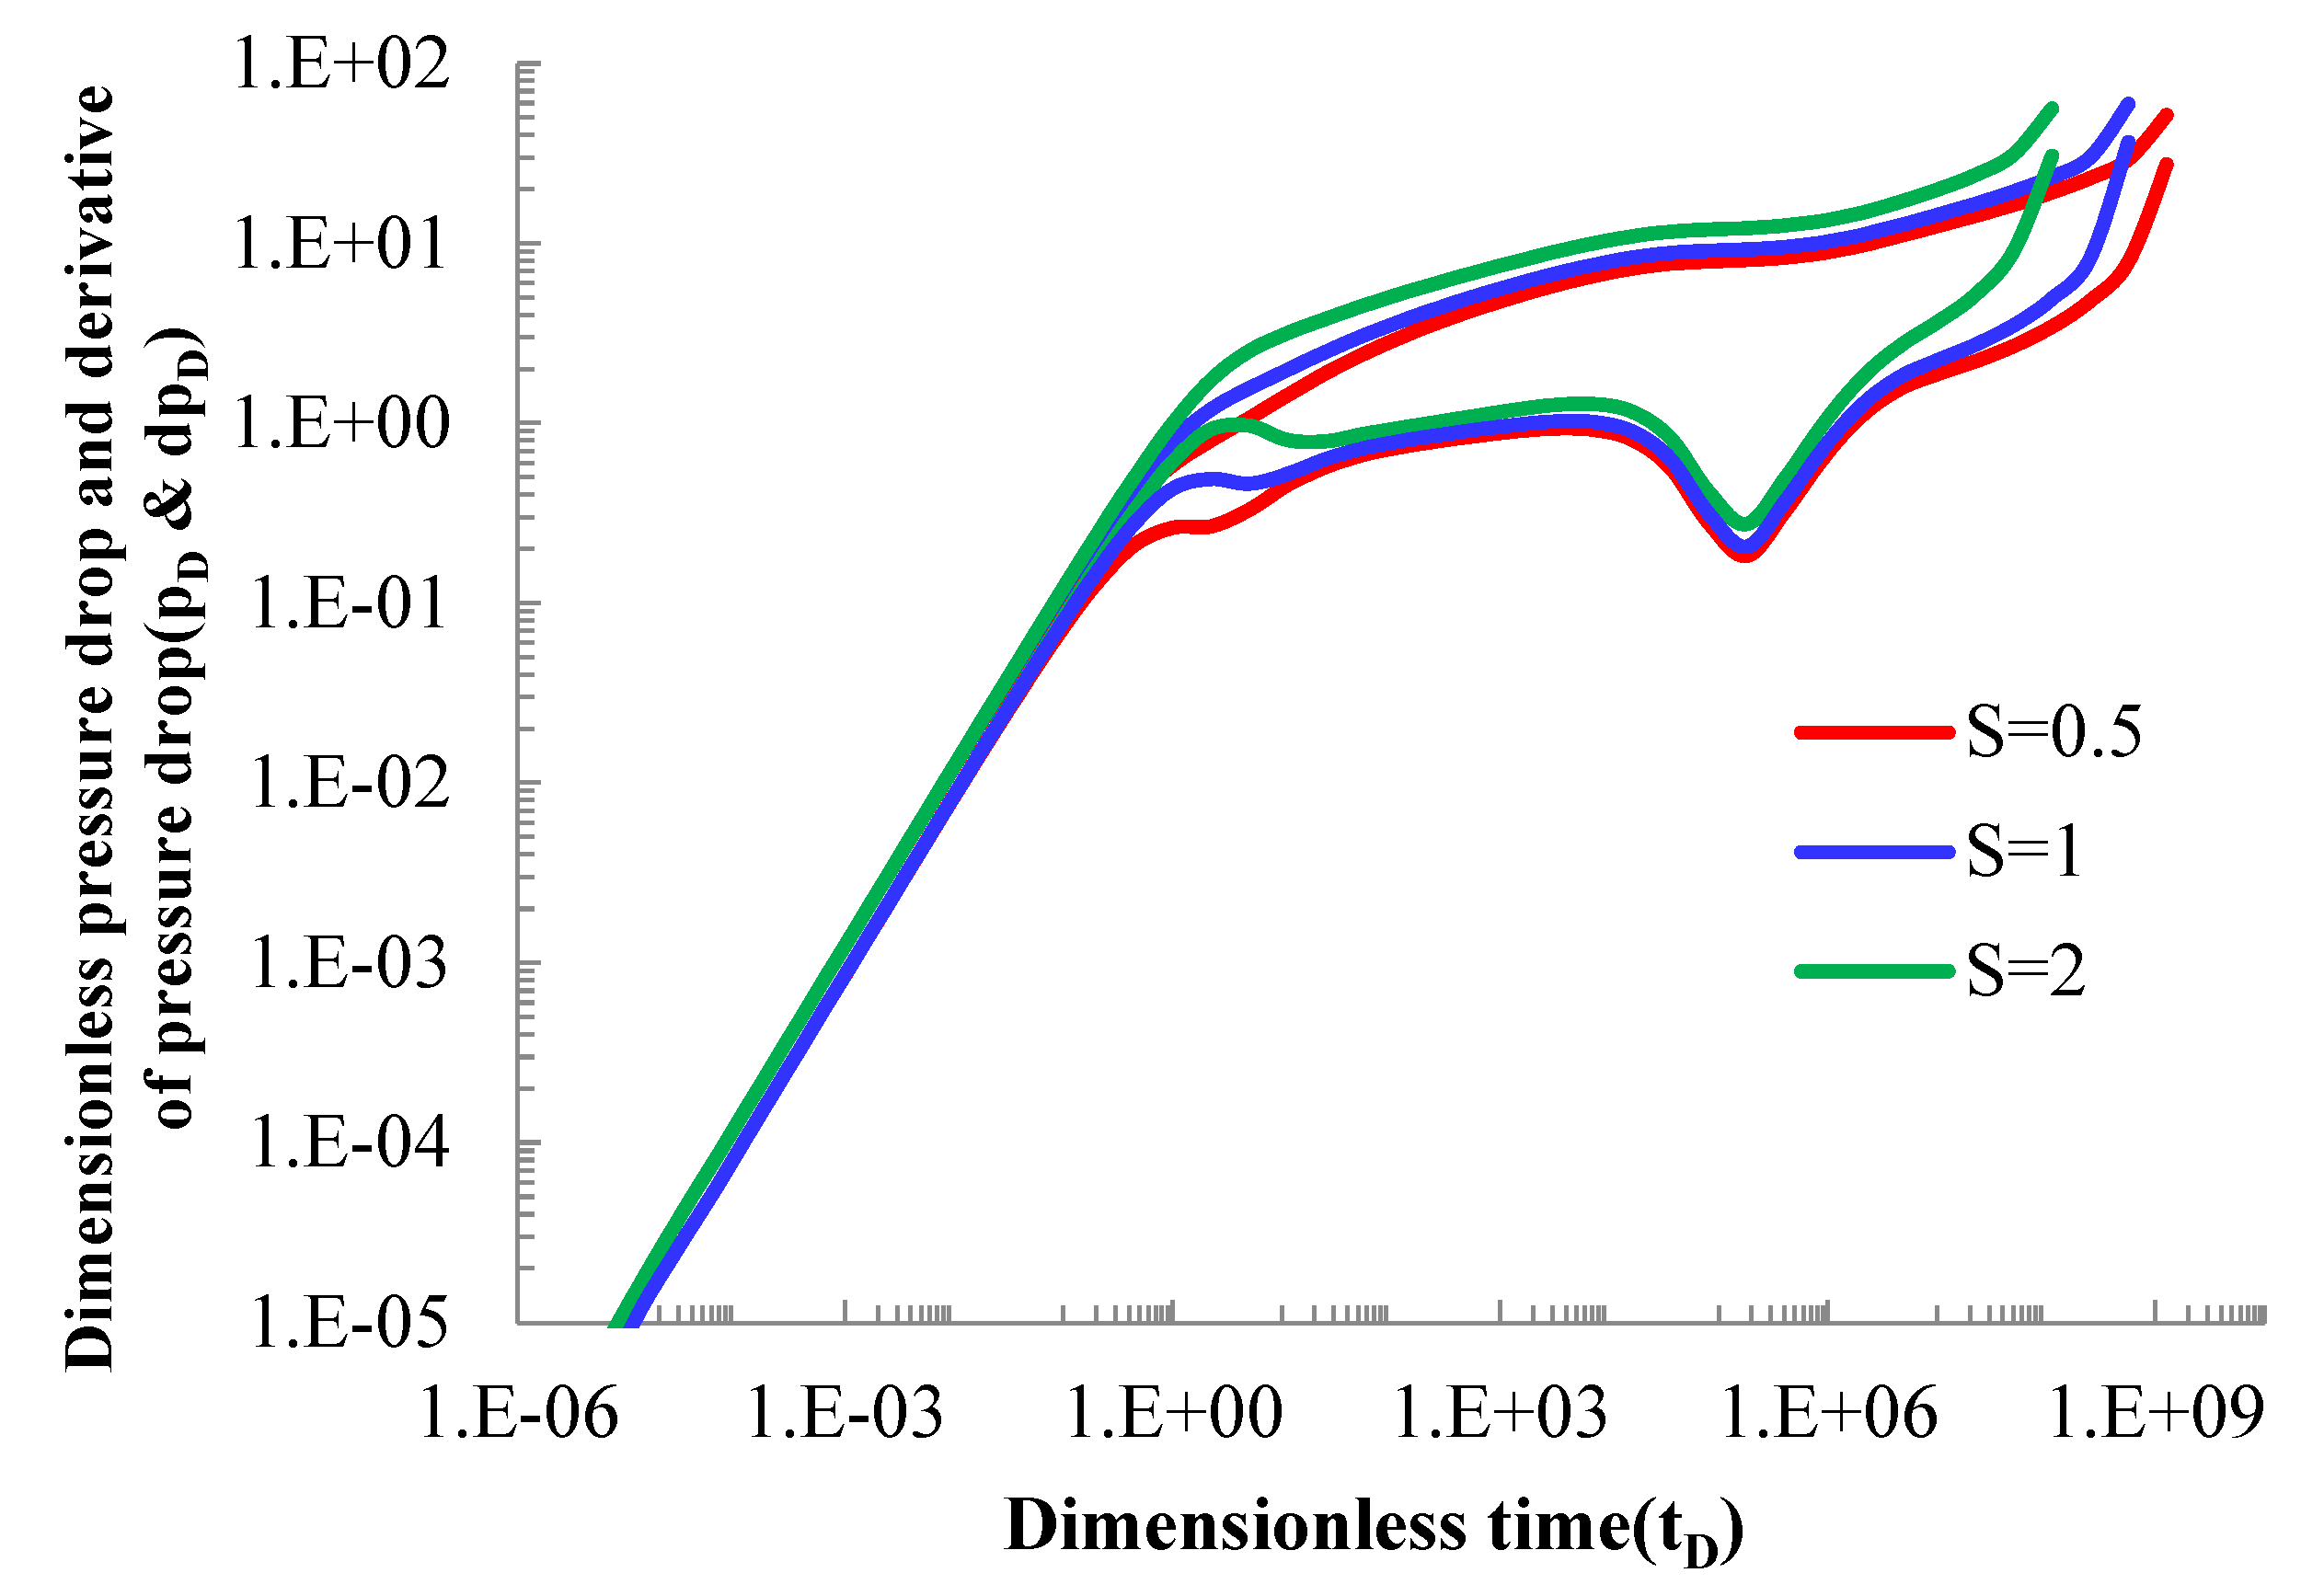
Figure 6.
Well test curve of storage capacity ratio sensitivity analysis.
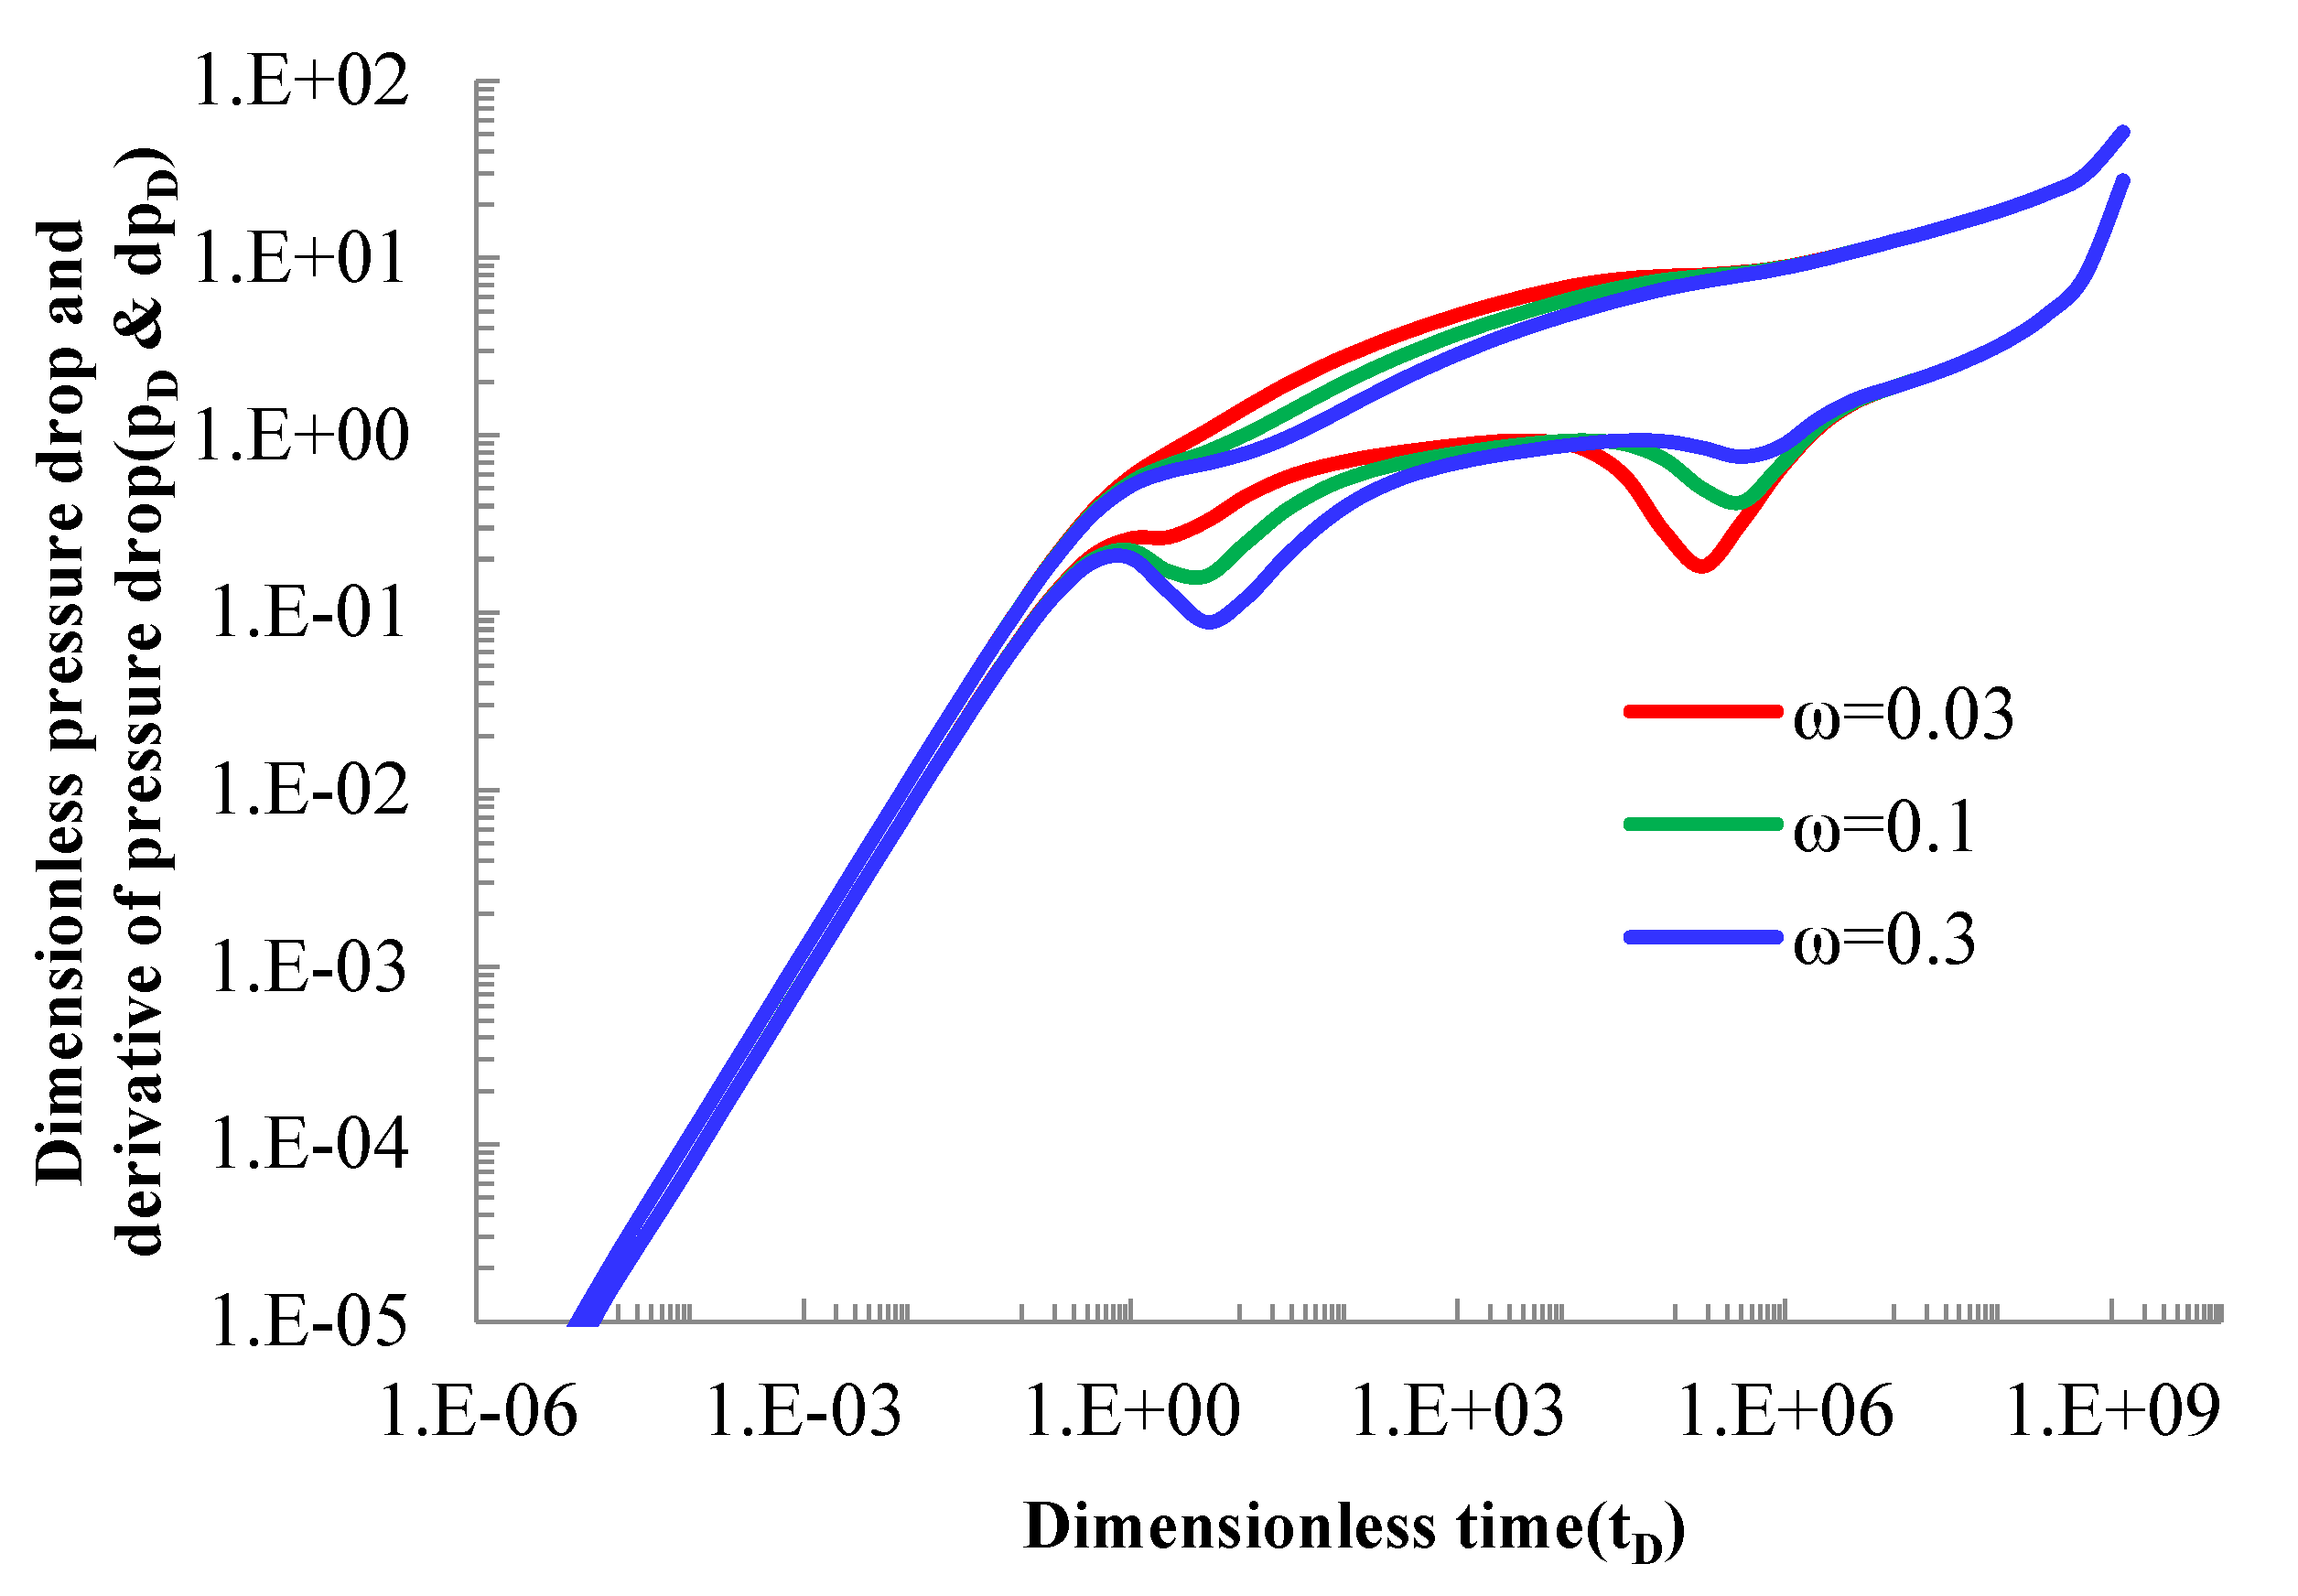
Figure 7.
Well test curve of channeling flow coefficient sensitivity analysis.
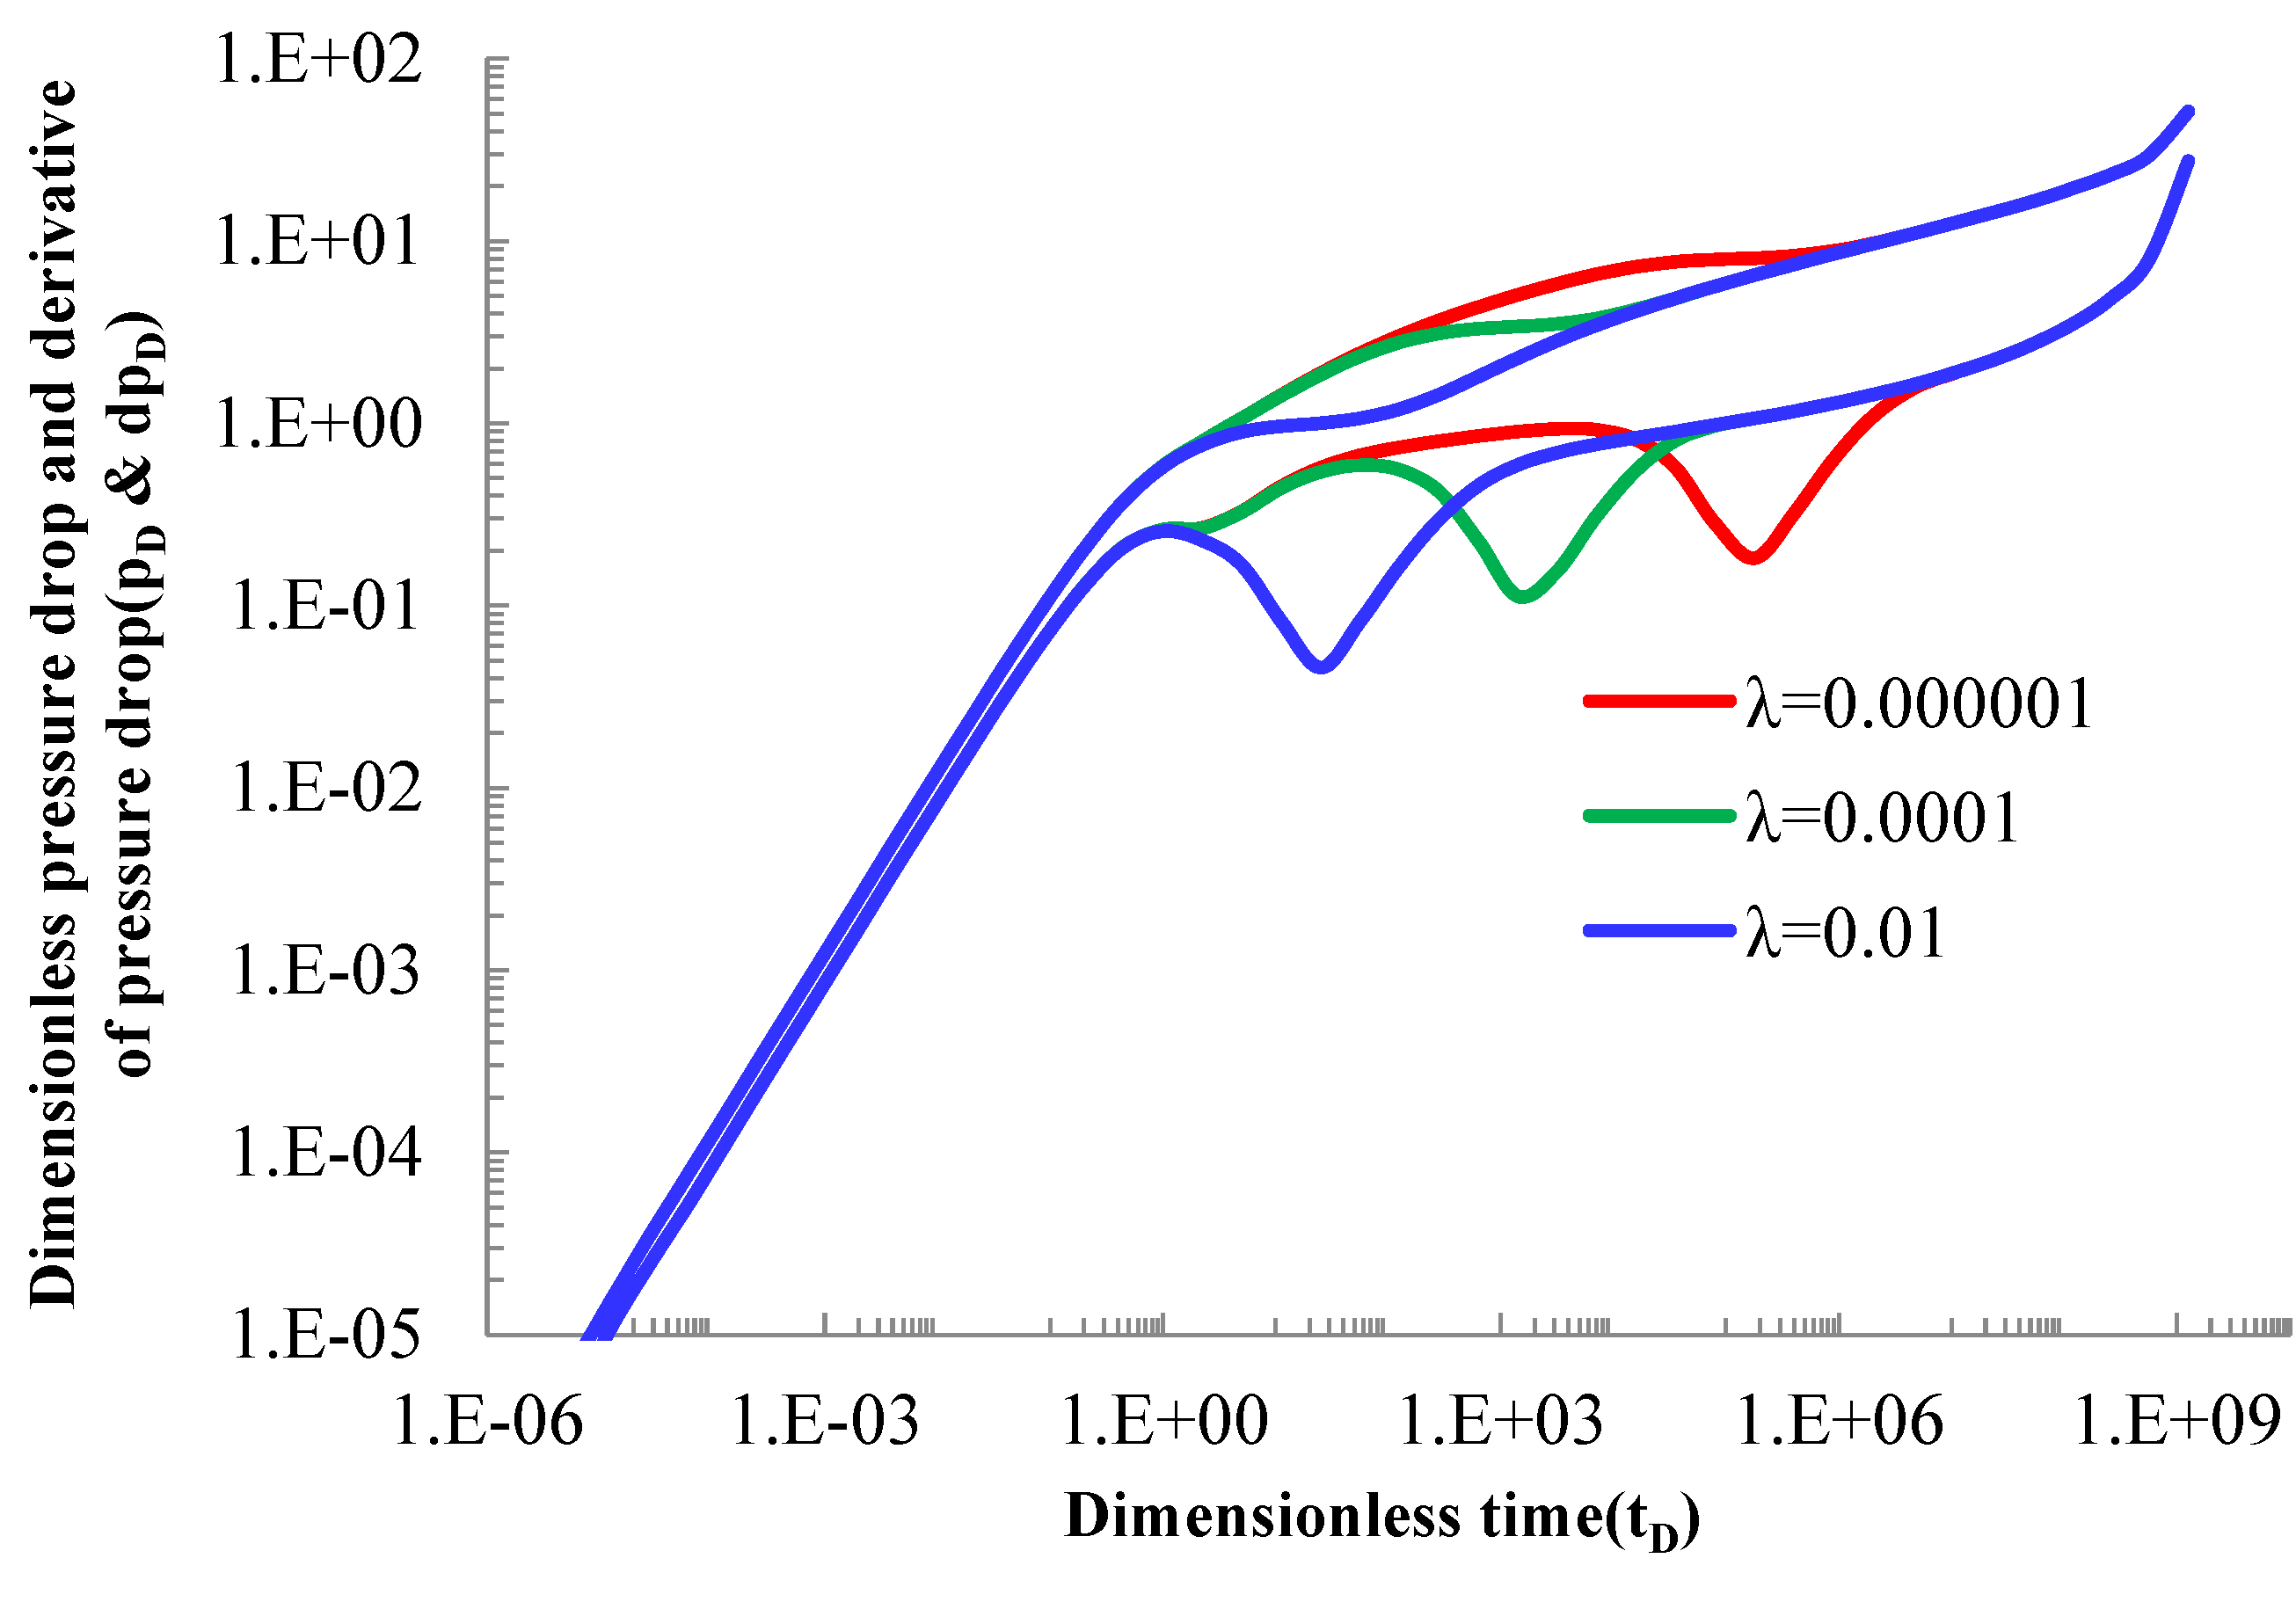
Figure 8.
Sensitivity analysis of permeability of volumetric fracture network.

Table 1.
Basic data of tight oil reservoir.
| Parameters | Values | Unit |
|---|---|---|
| Thickness of oil reservoir | 10 | m |
| Permeability in x-direction | 0.01 | mD |
| Permeability in y-direction | 0.01 | mD |
| Permeability of fracture | 1700 | mD |
| Channeling flow coefficient | 10−6 | Real number |
| Initial pressure of oil reservoir | 12 | MPa |
| Well production | 15.9 | m3/d |
| Porosity of oil reservoir | 0.1 | Real number |
| Volume coefficient | 1 | m3/m3 |
| Viscosity of crude oil | 1 | mPa.s |
| Compression coefficient | 4.35 × 10⁻⁴ | MPa−1 |
| Storage coefficient | 0.03 | Real number |
| Stress sensitivity coefficient | 0.1 | Dimensionless |
| Wellbore storage coefficient | 0.8 | Dimensionless |
| Skin coefficient | 0.5 | Dimensionless |
Publisher’s Note: MDPI stays neutral with regard to jurisdictional claims in published maps and institutional affiliations. |
© 2022 by the authors. Licensee MDPI, Basel, Switzerland. This article is an open access article distributed under the terms and conditions of the Creative Commons Attribution (CC BY) license (https://creativecommons.org/licenses/by/4.0/).
Share and Cite
MDPI and ACS Style
Li, Z.; Yan, X.; Wen, M.; Bi, G.; Ma, N.; Ren, Z. Transient Pressure Behavior of Volume Fracturing Horizontal Wells in Fractured Stress-Sensitive Tight Oil Reservoirs. Processes 2022, 10, 953. https://doi.org/10.3390/pr10050953
AMA Style
Li Z, Yan X, Wen M, Bi G, Ma N, Ren Z. Transient Pressure Behavior of Volume Fracturing Horizontal Wells in Fractured Stress-Sensitive Tight Oil Reservoirs. Processes. 2022; 10(5):953. https://doi.org/10.3390/pr10050953
Chicago/Turabian StyleLi, Zhong, Xinjiang Yan, Min Wen, Gang Bi, Nan Ma, and Zongxiao Ren. 2022. "Transient Pressure Behavior of Volume Fracturing Horizontal Wells in Fractured Stress-Sensitive Tight Oil Reservoirs" Processes 10, no. 5: 953. https://doi.org/10.3390/pr10050953
Note that from the first issue of 2016, this journal uses article numbers instead of page numbers. See further details here.