1. Introduction
Industrial automation consists of governing the activity and evolution of processes without the continuous intervention of a human operator [
1,
2]. The main advantages of automation are: replacing human operators in hazardous environments, monotonous tasks, activities involving great physical wear or beyond human capabilities of size, strength, endurance or speed, and economic improvement for companies or society as a whole [
3,
4].
In this context, the action of replacing a manual process with an automated one in an industry involves relevant progress in two main aspects, production and management, provided that there is an ideal architecture and it is adapted to the processes that allow the elements of the system to work in harmony, fulfilling their activities [
5,
6]. In this sense, in the oil and gas industry, the different production, control, and maintenance activities depend exclusively on information technologies, and only with them is it possible to achieve an efficient level of operation [
7,
8]. In this regard [
9,
10,
11], point out that low-cost automation promotes cost-effective reference architectures and new development approaches to increase the flexibility and efficiency of production operations in the oil industry.
Hydrocarbon industries have been faced with the need to adapt and empower themselves with new technologies to optimize their production processes. For this reason, these industries have focused on keeping crude oil fields operational through techniques that allow them to continue exploiting them and, therefore, guarantee quality standards in the products and services they offer, taking full advantage of the benefits of these advances and being competitive with other companies [
12,
13,
14]
Control systems are present in the exploration, production, refining, transportation, and distribution processes of the oil industry, providing security and reliability, minimizing work accidents and the use of labor [
15,
16,
17]. Automation is an essential element in Petroleos de Venezuela (PDVSA), which uses it mainly for the supervision and control of the operational variables of its processes and facilities. PDVSA for the planning of the exploitation process considers the productivity profiles of each oil and gas production field, as well as the requirement of fluid injection for the maintenance of pressure or artificial lift of the well that becomes necessary when the latter loses pressure causing fluctuations in the flow or natural course of extraction.
Extracting the maximum amount of oil from the reservoir is one of the challenges of this industry. The oil industry makes great efforts to develop new technologies to increase the production of residual oil reserves in an economical and environmentally sustainable way [
18]. In this sense, in the Eastern Production Executive Directorate (EPED), formed by the operational fields Orocual, Furrial, Jusepin, Carito, and Pirital, they operate through the maintenance of reservoir pressure by means of secondary recovery with gas injection. In the case of the Carito and Pirital fields, as a consequence of having the highest production of crude oil and gas, it is necessary to inject more gas to maintain the pressure and replacement factor, and in this way, guarantee the optimum functionality of these fields.
Among the plants that make up the EPED, there is HPGIP I, which is a secondary recovery plant, which is responsible for the operation of the 1, 2, 3, 4, 5, and 6 blocks in order to ensure the operational conditions contained in the structural design of the plants for their optimal performance, such as the static pressure, suction temperature, and flow of condensed gases according to the handling capacity of the equipment.
The secondary recovery system does not have adequate supervision of the processes [
19]; in this sense, the control of the pressures injected into each well is carried out manually, which causes pressure drops and therefore a reduction in the flow of crude oil, generating a reduction in the planned production of crude oil. In HPGIP I, only blocks 1 and 2 operate within its facilities, so the rest are located in a remote geographical area, with a small population and difficulty in access, as is the case of cluster 5. A cluster can be defined as a drilling configuration of wells that are very close on the surface and which, thanks to directional drilling, manage to diversify in the subsoil; it serves to save space, time, costs, and environmental impacts in the drilling process [
20,
21,
22,
23]
Cluster 5 is made up of injection wells MUC 67 and MUC 68 and does not have a gas injection measurement, nor an automatic control that allows for regulating its flow since it only has a manual action valve. The percentage of opening of the gas flow control valve depends on the conditions of the well (temperature and pressure). These conditions change and this demonstrates that a greater or lesser percentage of opening of the control valve is required. Cluster 5, which is 10 km from the PIGAP 1 plant, makes it difficult to open the valve in a timely manner, as personnel have to travel to the site to open it (currently, the valve is opened manually). Additionally, inadequate injection of gas into the well (more or less than required) not only impacts the oil production of the day but also damages the reservoir for future production.
Depending on the conditions of the well, an additional continuous volume of gas equivalent to the gas/liquid ratio would have to be injected, which would represent the optimal injection rate in the hypothetical case where the injection point coincides with the midpoint of the interval drilled, since the analysis refers to the node corresponding to the flow of the bottom hole pressure of the well. An injection below or above the optimum would increase the flow below the well, reducing its production capacity [
24]
In this sense, the objective of the present investigation is to develop an automated system for the supervision and control of operative variables of cluster 5 of the gas injection plant, with the purpose of achieving the control and supervision of the operative variables, with emphasis on the flow that is injected into the reservoirs, with the possibility of regulating the gas injection, thus guaranteeing control in two different states, local and remote, in the valves by configuring them and other control devices. The field complies with PDVSA regulations and rules.
2. Methods
This research is based on field research with a descriptive level and feasible project modality. The feasible project consists of the research, elaboration, and development of a viable operational model to solve problems, requirements, or needs of organizations or social groups [
25]
The development of the proposal was based on the methodology “Management Guidelines for Capital Investment Projects (MGCIP)” developed by PDVSA. The (MGCIP) contains practical guidelines for the execution of a project in a standardized and orderly manner, so that no detail and/or important step is overlooked, and thus guarantees, with a high degree of confidence, that the projects will be successful and meet the corporation’s requirements [
26]. The (MGCIP) is structured in five phases for the development and operation of a project within the Venezuelan oil industry, which are visualization, conceptualization, definition, implementation, and operation.
The project only covered the first four phases, since it is an automation proposal so the final activities of the implementation and operation phase are outside the scope of the project. Each of the phases is described below:
Phase I: Visualization
In this phase, operational and technological requirements were identified and analyzed. Among the activities carried out in this phase are the following:
- -
Description of the production process.
- -
Description of cluster 5.
Phase II: Conceptualization
In this phase, an evaluation of the technologies to be implemented to monitor the operational parameters and variables of the HPGIP I gas injection cluster 5 was carried out. The activities carried out in this phase were as follows:
- -
Evaluation and selection of equipment and components.
- -
Elaboration of the proposal for the system architecture.
Phase III: Definition
The objective of this phase was to develop detailed engineering to carry out the execution of the project. The activities carried out in this phase were as follows:
- -
Elaboration of the system flow diagram.
- -
Carrying out the wiring diagram.
- -
Development of the list of system signals.
- -
Elaboration of the displays for the interface with the SCADA system.
Phase IV: Implementation
In this phase, we started with the integration of the devices, as well as with the construction of the deployments to later link them with the Guardian of the Alba (GALBA) SCADA. GALBA SCADA is a field data acquisition, supervision, and control system [
27,
28] made by PDVSA under free software [
29]. The activities carried out were:
- -
Configuring the equipment and devices.
- -
Connection and testing of the equipment to the data site.
- -
Construction of the control logic.
- -
Development of the deployment for the GALBA SCADA.
3. Results and Discussion
This section can be divided into subheadings. It should provide a concise and precise description of the experimental results, their interpretation, and the experimental conclusions that can be drawn.
3.1. Phase I: Visualize
3.1.1. Description of the Production Process
Secondary recovery methods lie in the injection of fluids into a reservoir in order to maintain pressure; these substances are injected by certain wells known as injectors, with the displacement of a part of the crude towards the other wells being achieved, and they are producers [
20,
21]. Generally, the secondary recovery process is used when the natural flow that exerts pressure on the reservoir does not have enough energy to push the oil, and the main flows that are injected for secondary recovery are water and gas.
This is a process where gas is injected into a reservoir with the purpose of increasing oil recovery from the reservoir [
30,
31], as well as controlling oil production and gas conservation; the main objective is to maintain pressure within the reservoir. Gas injection is an impermeable process, which means that it does not mix with the crude oil unless the gas is enriched with hydrocarbons or injected at high pressure [
32].
This plant is a gas injection giant that raises 156 pressures from 84.37 kg/cm2 to 632.76 kg/cm2. The capacity of compression is 157 injections of 1000 million cubic feet per day. It is composed of five modular trains and turbo compressor units, each one mainly made up of a gas turbine model MS-5002-C, NouvoPignone brand of 50,938.33 kw of power, and three centrifugal compressors in series, model BCL 406/B, BCL 305/C, and BCL305/B. Each train requires a volume of six MMPCFD of gas to feed the turbine which provides the required power to the compressors.
In addition, HPGIP has a multiple discharge network that allows the distribution of gas to six clusters, which are made up of seventeen injector wells that help maintain the production of the Punta de Mata Division. On the other hand, it also has auxiliary systems that collaborate for the correct functioning of the facilities and operations to be carried out, which are indicated below:
Injection network system.
Relief and ventilation system.
Fire protection system.
Instrument air system.
Air system.
Oily water drainage system.
Power supply and electrical distribution system.
Starting gas system.
Fuel gas system.
Process safety system, gas detectors, CO2 unit systems, control room, and UV/IR (alarms).
Mist injection cooling system (osmosis).
Gas injection produces enough energy to pressurize the reservoir of low-production wells located in the vicinity of the injection wells. It is important to mention that the injection wells result from the conversion of production wells in a state of abandonment and/or closed due to low production; for this purpose, work must be carried out on the heads and facilities that are part of the structure of the well [
18].
Figure 1 shows the diagram of the gas injection process in a cluster.
The gas from the turbocompressor units enters the discharge manifold with an approximate pressure of 527.30 kg/cm
2, for the average injection of 1000 MMPCFD through the injection networks, which are distributed in six clusters that supply gas to seventeen gas injection wells. Next,
Table 1 indicates how the wells are distributed with respect to the cluster, with their respective valve opening percentage per well (% choke).
Each of the injection wells has an associated injection manifold through which the well can be opened or closed manually, and the inflow through the injection well can also be regulated. In the gas injection network, it must be determined how much energy is required by a reservoir in order to estimate a flow, which is completed by reservoir engineers using an energy recovery factor.
Therefore, if each reservoir requires an amount of energy and there is a failure in one of the turbocompressor units, the person in charge of safeguarding the clusters has the power to close a well and thus the gas will be distributed to the other clusters that require a high gas injection; on the other hand, they have the ability to regulate the flow that enters a reservoir according to the needs of the reservoir at a given time.
3.1.2. Description of Cluster 5
In spite of belonging to the distribution of wells of the high-pressure gas injection plant (HPGIP I), cluster 5 is located outside these facilities; it is located in a remote area to the west of the Muscar Operational Complex (MOC), on the Punta de Mata-Maturin National Highway, in the municipality of Ezequiel Zamora. This cluster has two associated injector wells, MUC-67 and MUC 68.
As for the operating architecture, it has a control or telemetry house, which includes antennas and communication radios, which are not operational due to theft of the power lines and transformers. It also has a ball valve used by the well operator to regulate the flow of gas or to control the opening and closing of the well. In the fully open position, the valve is approximately 75% of the pipe size in size. There is a Shaffer safety valve which is intended to carry out the emergency shutdown of the well when the fluid exceeds the preset limit, avoiding the explosion of the system in the event of excess pressure; however, this device is currently out of operation, so the emergency shutdown is performed through the ball valve; a manometer, which measures the gas pressure in the pipeline, which is independent of electrical power because it is purely mechanical.
The orifice plate and the manual flow control valve complete the system; the latter regulates the gas injection and, despite being a rigid and transcendental process, it is worn and corroded due to the action of the natural elements and little intervention and maintenance of the system.
3.2. Phase II: Conceptualize
In this phase, the various technologies available on the market are studied in relation to the monitoring and control processes of operational variables.
3.2.1. Identify the Equipment and Devices Available on the Market
The control devices, taking into account the brands, models, and characteristics most used by PDVSA to guarantee the homologation of the platform according to the regulations of the Executive Directorate of Automation, Information Technology, and Telecommunications of PDVSA, the governing body of guaranteeing technological services to the Venezuelan oil industry, are the following:
- -
Controller 1: Linux-based PAC. Inside this device is a 1.33 GHz Intel Atom Z520 Series CPU. This model comes with VGA, USB, RS-232/485, Ethernet modules, and E-8K serial I/O slots designed for a high-performance profile. User programs can be saved to an external storage device, such as a CF card or USB mass storage device. Users can develop applications using the GNU C language. Users can achieve the redundancy function.
- -
Controller 2: Ideal for oil, gas, pipeline, electrical, and industrial combustion applications. They provide support for applications that require wide temperature ranges and low power consumption, and remote applications powered by solar cells or wind power. Among its main features are the following. An advanced 32-bit processor with integrated real-time multitasking, an operating system (RTOS), eight analog inputs (two with a point-to-point HART interface), two analog outputs, eight discrete inputs, four discrete outputs, and three pulse inputs, an integrated Ethernet, two serial ports (RS232/RS485), and one HART port; a multi-drop interface; the Native protocols include Modbus RTU, Modbus ASCII, and Modbus TCP; 6 M Flash, 1 M RAM, and 32 K Ferroelectric RAM for long-term storage of configured parameters.
- -
Controller 3: It has an SD card (secure digital) that provides non-volatile storage in which the user program is permanently stored. Key features include: An integrated 1 gigabit (Gb) Ethernet port which provides high-speed motion and I/O control; a screen which makes it easy to diagnose and solve problems; and increased security and new capabilities. The energy storage module avoids the need for a battery. The controller’s digitally signed firmware provides an additional layer of security. It provides role-based access control to routines and add-on instructions.
Multivariable transmitter technology: Among the most widely used equipment in PDVSA’s operating platform are the following:
- -
Multivariable Transmitter 1: Capable of three process measurements and flow calculations, all integrated into a single device, it allows for changes in process conditions and provides an accurate reading every time. It is compact in size and easily fits into any system due to its features, with 10 years of stability and features such as flow reading up to 0.65% on turndown, differential pressure reading, and a 200:1 differential pressure ratio. It has the HART communication protocol mounted on a 4–20 mA loop.
- -
Multivariable Transmitter 2: This makes optimal use of the unique features of the DPharp sensor to give greater insight into processes and its features include ±0.04% differential pressure accuracy, ±0.1% static pressure accuracy, ± 0.°F external temperature accuracy, 4500 psi MWP, and a HART-type communication protocol. Likewise it has two 4–20 mA loop analog inputs to read two variables, be it differential pressure, static pressure, external temperature, or flow signal.
- -
Multivariable Transmitter 3: This offers accurate measurement of instantaneous flow, cumulative flow, process pressure, differential pressure, and temperature. As a fully digital transmitter, the product offers a built-in choice of Modbus protocol over serial and/or Ethernet communications. It has an optional analog output: 0–20 mA, serial type protocol: Modbus RTU. It is powered with a voltage of 9 to 30 VDC, and has a differential and absolute pressure of ±0.05%, temperature accuracy of ±0.15 °C (±0.27 °F), and Stability of approximately 5 years.
Actuators: The actuators most used by PDVSA are the following:
- -
Actuator 1: This provides a small to medium thrust output for bracket-mounted applications. It includes operation of built-in butterfly valves and turbine valves, louvers, dampers, and other similar equipment. Its type of control is all/nothing and adjustable position control. Linear and spring return form the actuation.
- -
Actuator 2: This responds to signals from electronic processes or remote manual adjustments. It allows manual adjustments when there is no power. It is built on the basis of stepper motor technology, allowing it to travel precisely to any position without overshooting. It has a standard 4–20 mA input and output signal.
- -
Actuator 3: A compact actuator with a quick on–off maneuver and 0–90° rotation to automate the ball, butterfly, and taper plug valves, among others. Among its characteristics are the following: a multivolt power supply of 100–240 V AC (125–320 V DC), 24 V AC/DC, or 400 V tri 50–60 Hz; regulation stops; a digital action command; an on–off action command; manual control in case of emergency; a visual position indicator; 4–20 mA-type proportional control; and maximum rotation under command from 180° to 270°.
Relay 1: They are switching elements between the control system and the actuators and/or sensors, allowing one to connect, separate, control, amplify, or multiply the current or voltage. Among its main features are the type of input voltage: AC/DC and UC; The relay rated current: Max. 10A; the solid-state relay rated current: Max. 10A; Contacts: Max. two normally open changeover contacts; connection technology: a screw, a push-in, and a spring; Bridging: A1, A2, 11, and 14; and it is expandable with logic and time functions in combination with PLC logic, RTU, and other control devices.
3.2.2. Identify the Equipment and Devices Available on the Market
After identifying the technologies, we proceeded the evaluation and selection of the most relevant ones for the control process, which are the ones that will make up the control system in cluster 5.
Criteria for the selection of the control device: We proceeded with the identification of the criteria to be considered for the selection of the control device that will later be used for the proposal of the system architecture; among them are:
Programming: Coding that requires fewer instruction numbers and fewer lines of code. Encoding that contains a structure similar to that of the equipment installed in other facilities.
Communication: The ability of the control device to achieve communication with field devices.
Robustness: The ability to adapt and withstand critical environments.
Technical support and maintenance: The ability to make contact with the manufacturer for the facilitation and availability of materials and user manuals.
Cost: Economical and accessible.
For the selection of the transmitter and actuator, we proceed with the identification of the most relevant criteria; due to the fact that both will be part of the proposal for the system architecture of cluster 5 and are field devices, the same criteria are considered for both among the criteria as follows:
Security.
Communication protocols.
Adaptability.
Maintainability.
Cost.
Margin of error.
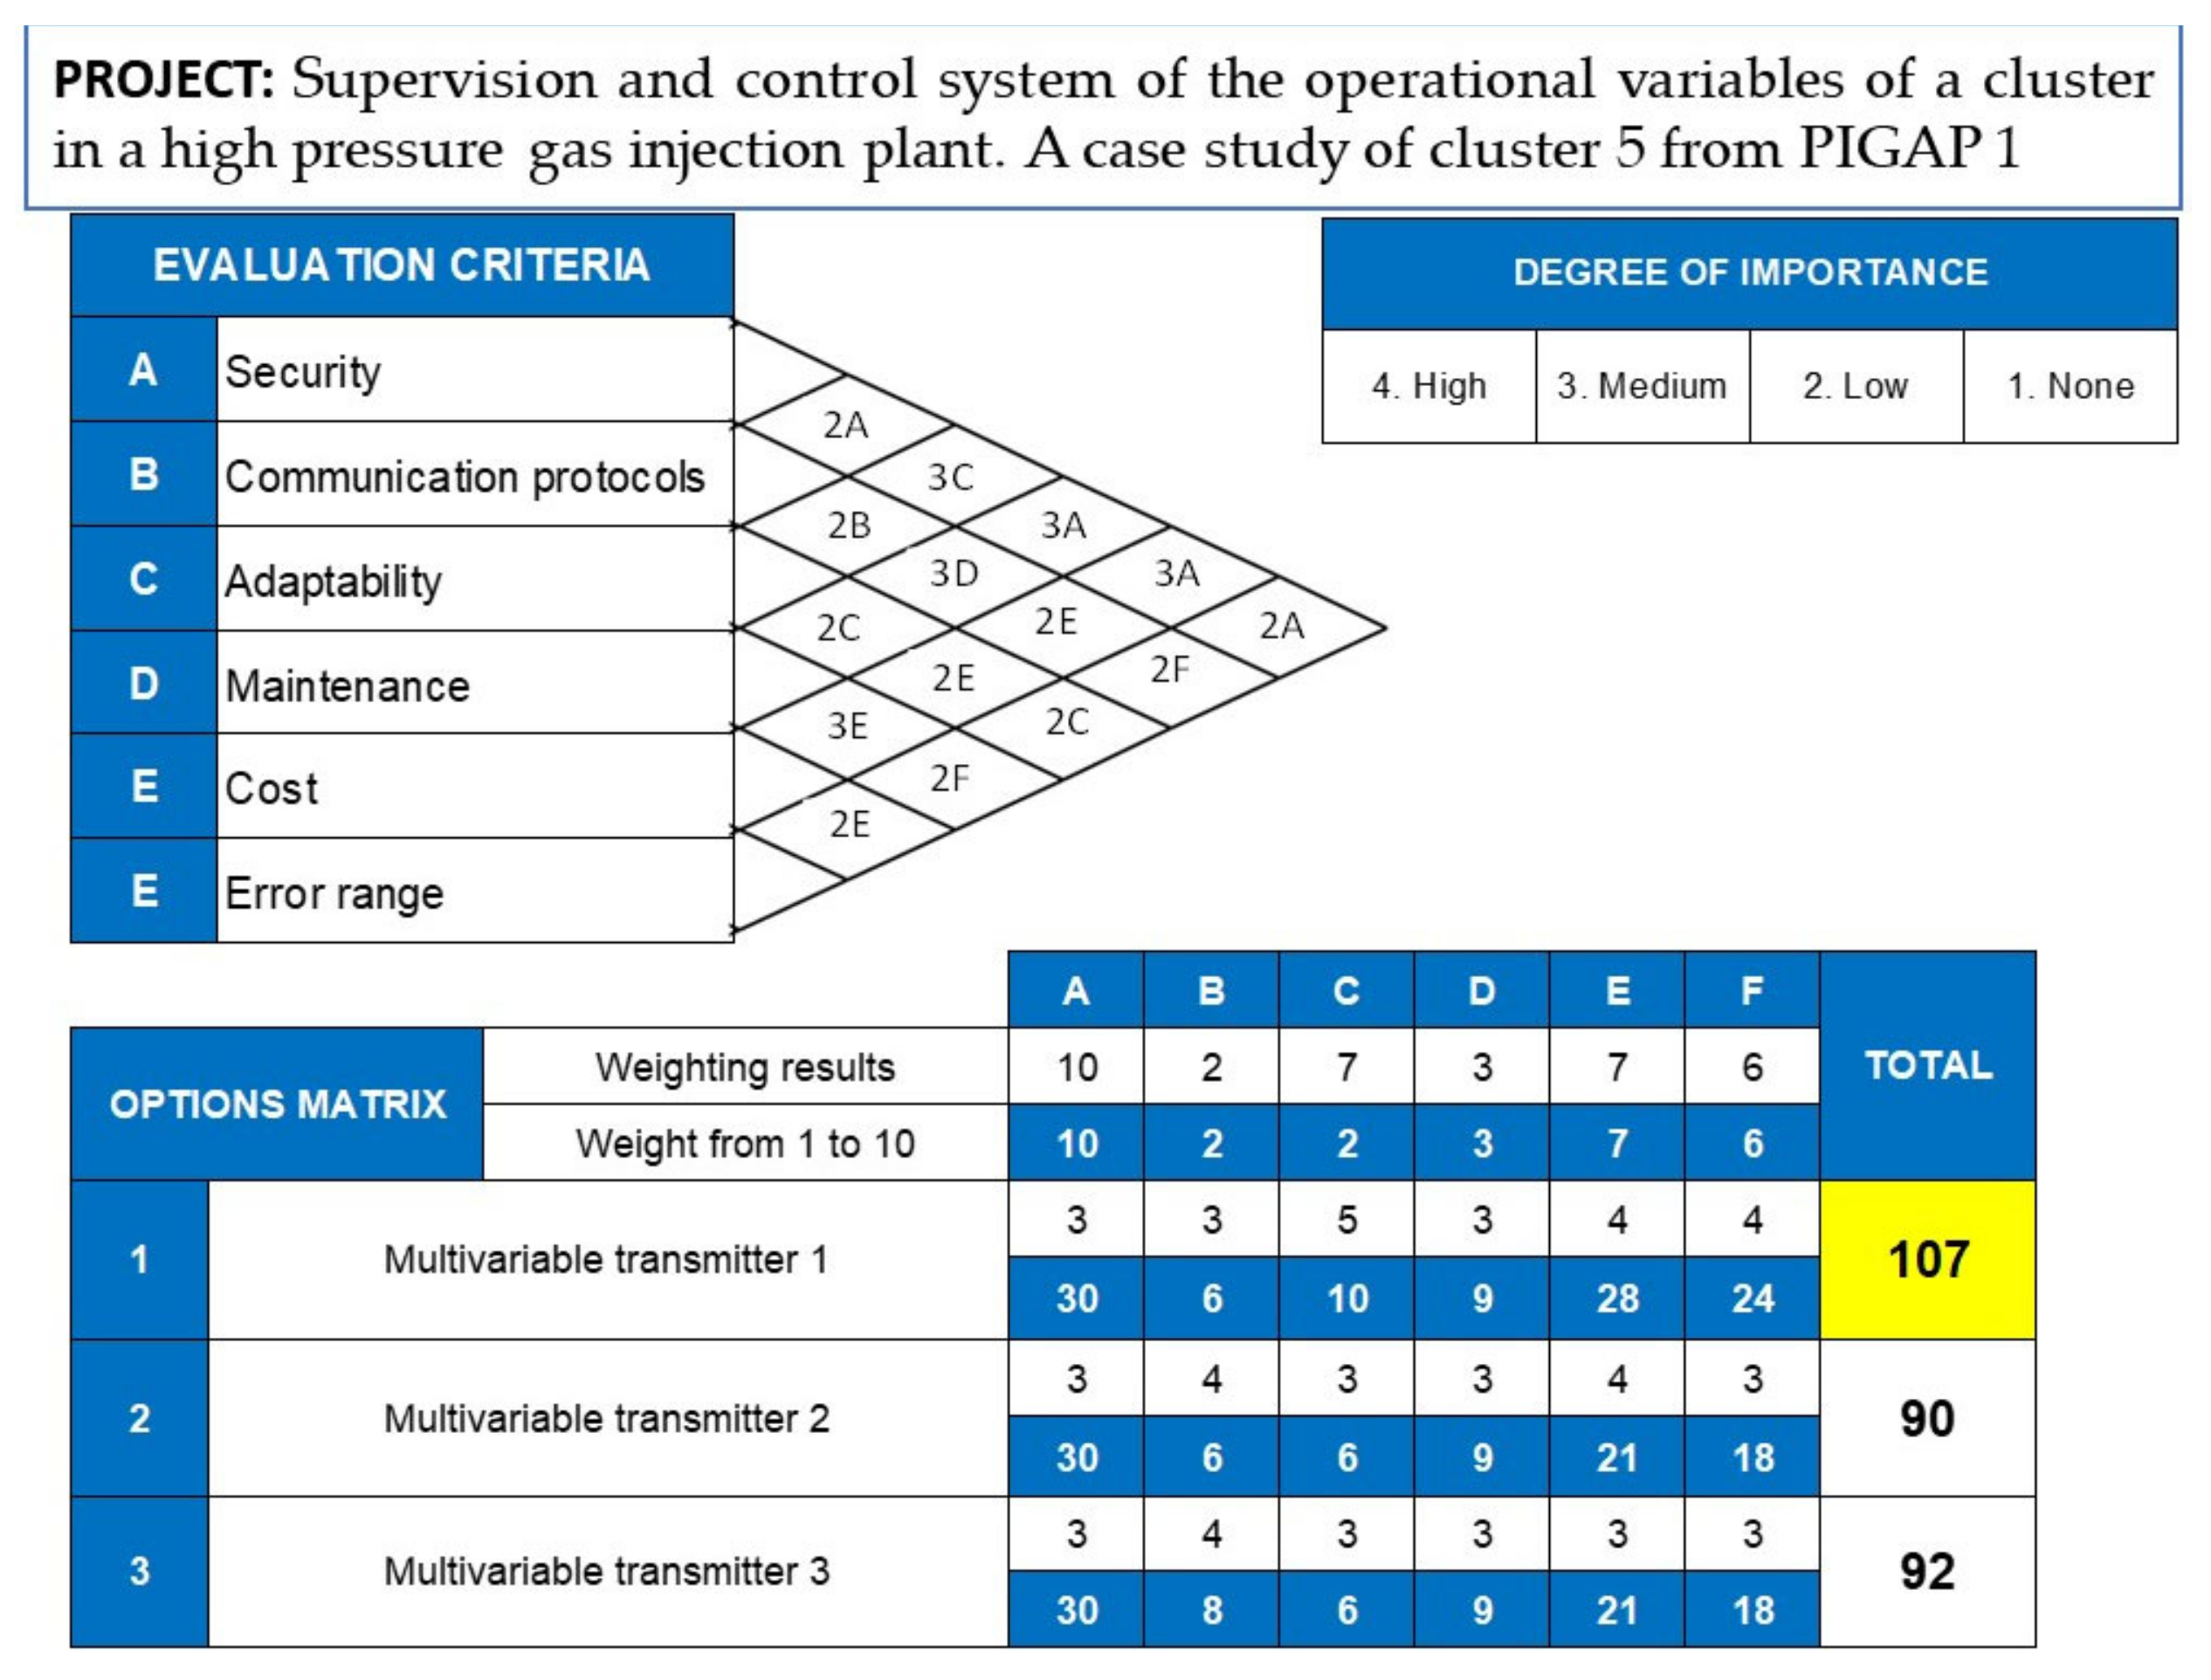
Technical evaluation for the selection of devices and equipment for the system architecture.
The steps to make a comparative matrix are as follows:
Each criterion was associated with a corresponding letter, i.e., row A represents criterion A, row B corresponds to criterion B, and so on.
Subsequently, a weight was assigned to each criterion, selecting the degree of importance of the criterion (1: none; 2: low; 3: medium; 4: high), which is placed in the respective box of the comparison value.
After emptying the matrix of all the comparisons, the points of each criterion were added, and each of them was weighted, with each having a weight of 1 to 10, where 1 is the minimum and 10 is the maximum.
In the lower part of the matrix, each of the options studied was placed with a range of numbers from 1 to 5 to indicate whether the technology is appropriate to meet the evaluation criteria, as shown in the
Figure 2.
According to the comparison made in the table above, it is shown that controller 2 is the one that best meets the proposed requirements, with it obtaining a total of 89.94 points over controllers 1 and 3 with weightings of 78.14 and 87.23, respectively. For the criterion related to programming, controller 2 obtained a score of 24.54 while controller 1 obtained 116.36 points and Controller 3 was the winner of this first criterion with 32.72 points. Because the programming environment of controller 3 is more flexible than the other devices, it is noted that all of the devices comply with the standardized languages in the IEC 1131-3 standard (block diagram, ladder logic, structured text, and instruction list).
The results shown in the
Figure 3 indicate that multivariable transmitter 1 is the most suitable for the architecture of the control system with a final weight of 107.00 points, while multivariable transmitter 2 and multivariable transmitter 3 had scores of 99.00 and 92.00 points, respectively. Multivariable transmitter 1 stands out in certain criteria such as its adaptability and margin of error, elements that are critical due to the moment of selecting a transmitter; it must have the characteristic of easy adaptation to the system and also provide a reading of the same operational variables, which are necessary to take the corresponding actions regarding the control to be exercised in the system.
The results obtained show (See
Figure 4) that actuator 2 is the most ideal and it is indicated for the architecture of the control system, with it reaching a score of 111.00 points, while actuator 1 and actuator 3 reached scores of 103.00 and 97.00 points, respectively. Actuator 2 stands out in the criteria such as its adaptability and costs, with costs being one of the most important factors when selecting equipment that meets the needs of the system in the same way that it contemplates easy adaptability to the process, remembering that the actuator is the equipment that allows the passage of the gas flow towards the injection well.
According to the results obtained in the evaluation of the different devices, it is proposed for the following devices and equipment to be part of the system architecture:
It is considered for use relay 1 to be used since it is one of the most used by the company, PDVSA, and due to its characteristics described above, it supplies the minimum needs for the system architecture, allowing the change in the required logical states, which are local and remote.
3.2.3. Elaboration of the Proposal for the System Architecture
Taking into account the current situation and the needs of the process to be addressed to carry out the supervision of the operational variables and to regulate the flow of gas to be injected into the injector wells of cluster 5, a structure was defined to guarantee the integration of the elements of the system, ensuring the functionality and adaptability to the process. This architecture contemplates the instrumentation to the control system that allows the supervision of the variables. In this order of ideas, the elements of the system architecture are shown in
Figure 5:
As shown in
Figure 5, the proposed architecture contemplates a supervision system, specifically the GALBA SCADA, developed in Venezuela to carry out PDVSA’s supervision processes, through equipment with free software located in the control room, and in the particular case of this study, the software will be managed from AIT’s offices to carry out the corresponding operation and evaluation tests.
In turn, the control level consists of a remote terminal unit (RTU), specifically a data site [
32], which facilitates control actions in harsh and extreme industrial environments, such as oil, gas, pipeline, and electrical applications [
33,
34]. The data site controller can be programmed using Isagraf Workbench software, which allows for the development of control logic according to the programming standards of IE34,35C 61131-3. This software allows for the development of the control logic that will be subsequently transferred or downloaded to the RTU, with it performing the necessary compilations to verify its correct operation.
Finally, for the field level in which the actions or commands are executed, for the control and display of variables ordered by the RTU, it is necessary to establish the instrumentation equipment or field devices, which interact directly with the variable to be measured or regulated. For this reason, the devices to be used in the proposed architecture are listed below:
A multivariate transmitter for MUC 67.
A multivariate transmitter for MUC 68.
An actuator for the flow control valve for MUC 67.
An actuator for the flow control valve for MUC 68.
It is necessary to mention that the installation of both the transmitters and actuators for the flow control valves is carried out with their corresponding instrumentation wiring, and in this process, the devices are tested in the laboratory.
3.3. Phase III: Define
The objective of this phase was the development of detailed engineering to carry out the execution of a project; these details are, among others, the flow diagram of the system, which graphically represents the stages of the process; the connection diagram, which allows for understanding the connection of the different elements and the signal flow of the process; the list of system signals, which identifies and defines how the data transmission is carried out and is taken as a starting point for the elaboration of the GALBA SCADA® database; and finally, the elaboration of the displays that will be used as part of the SCADA system. The following is a description of each of the activities involved in this phase:
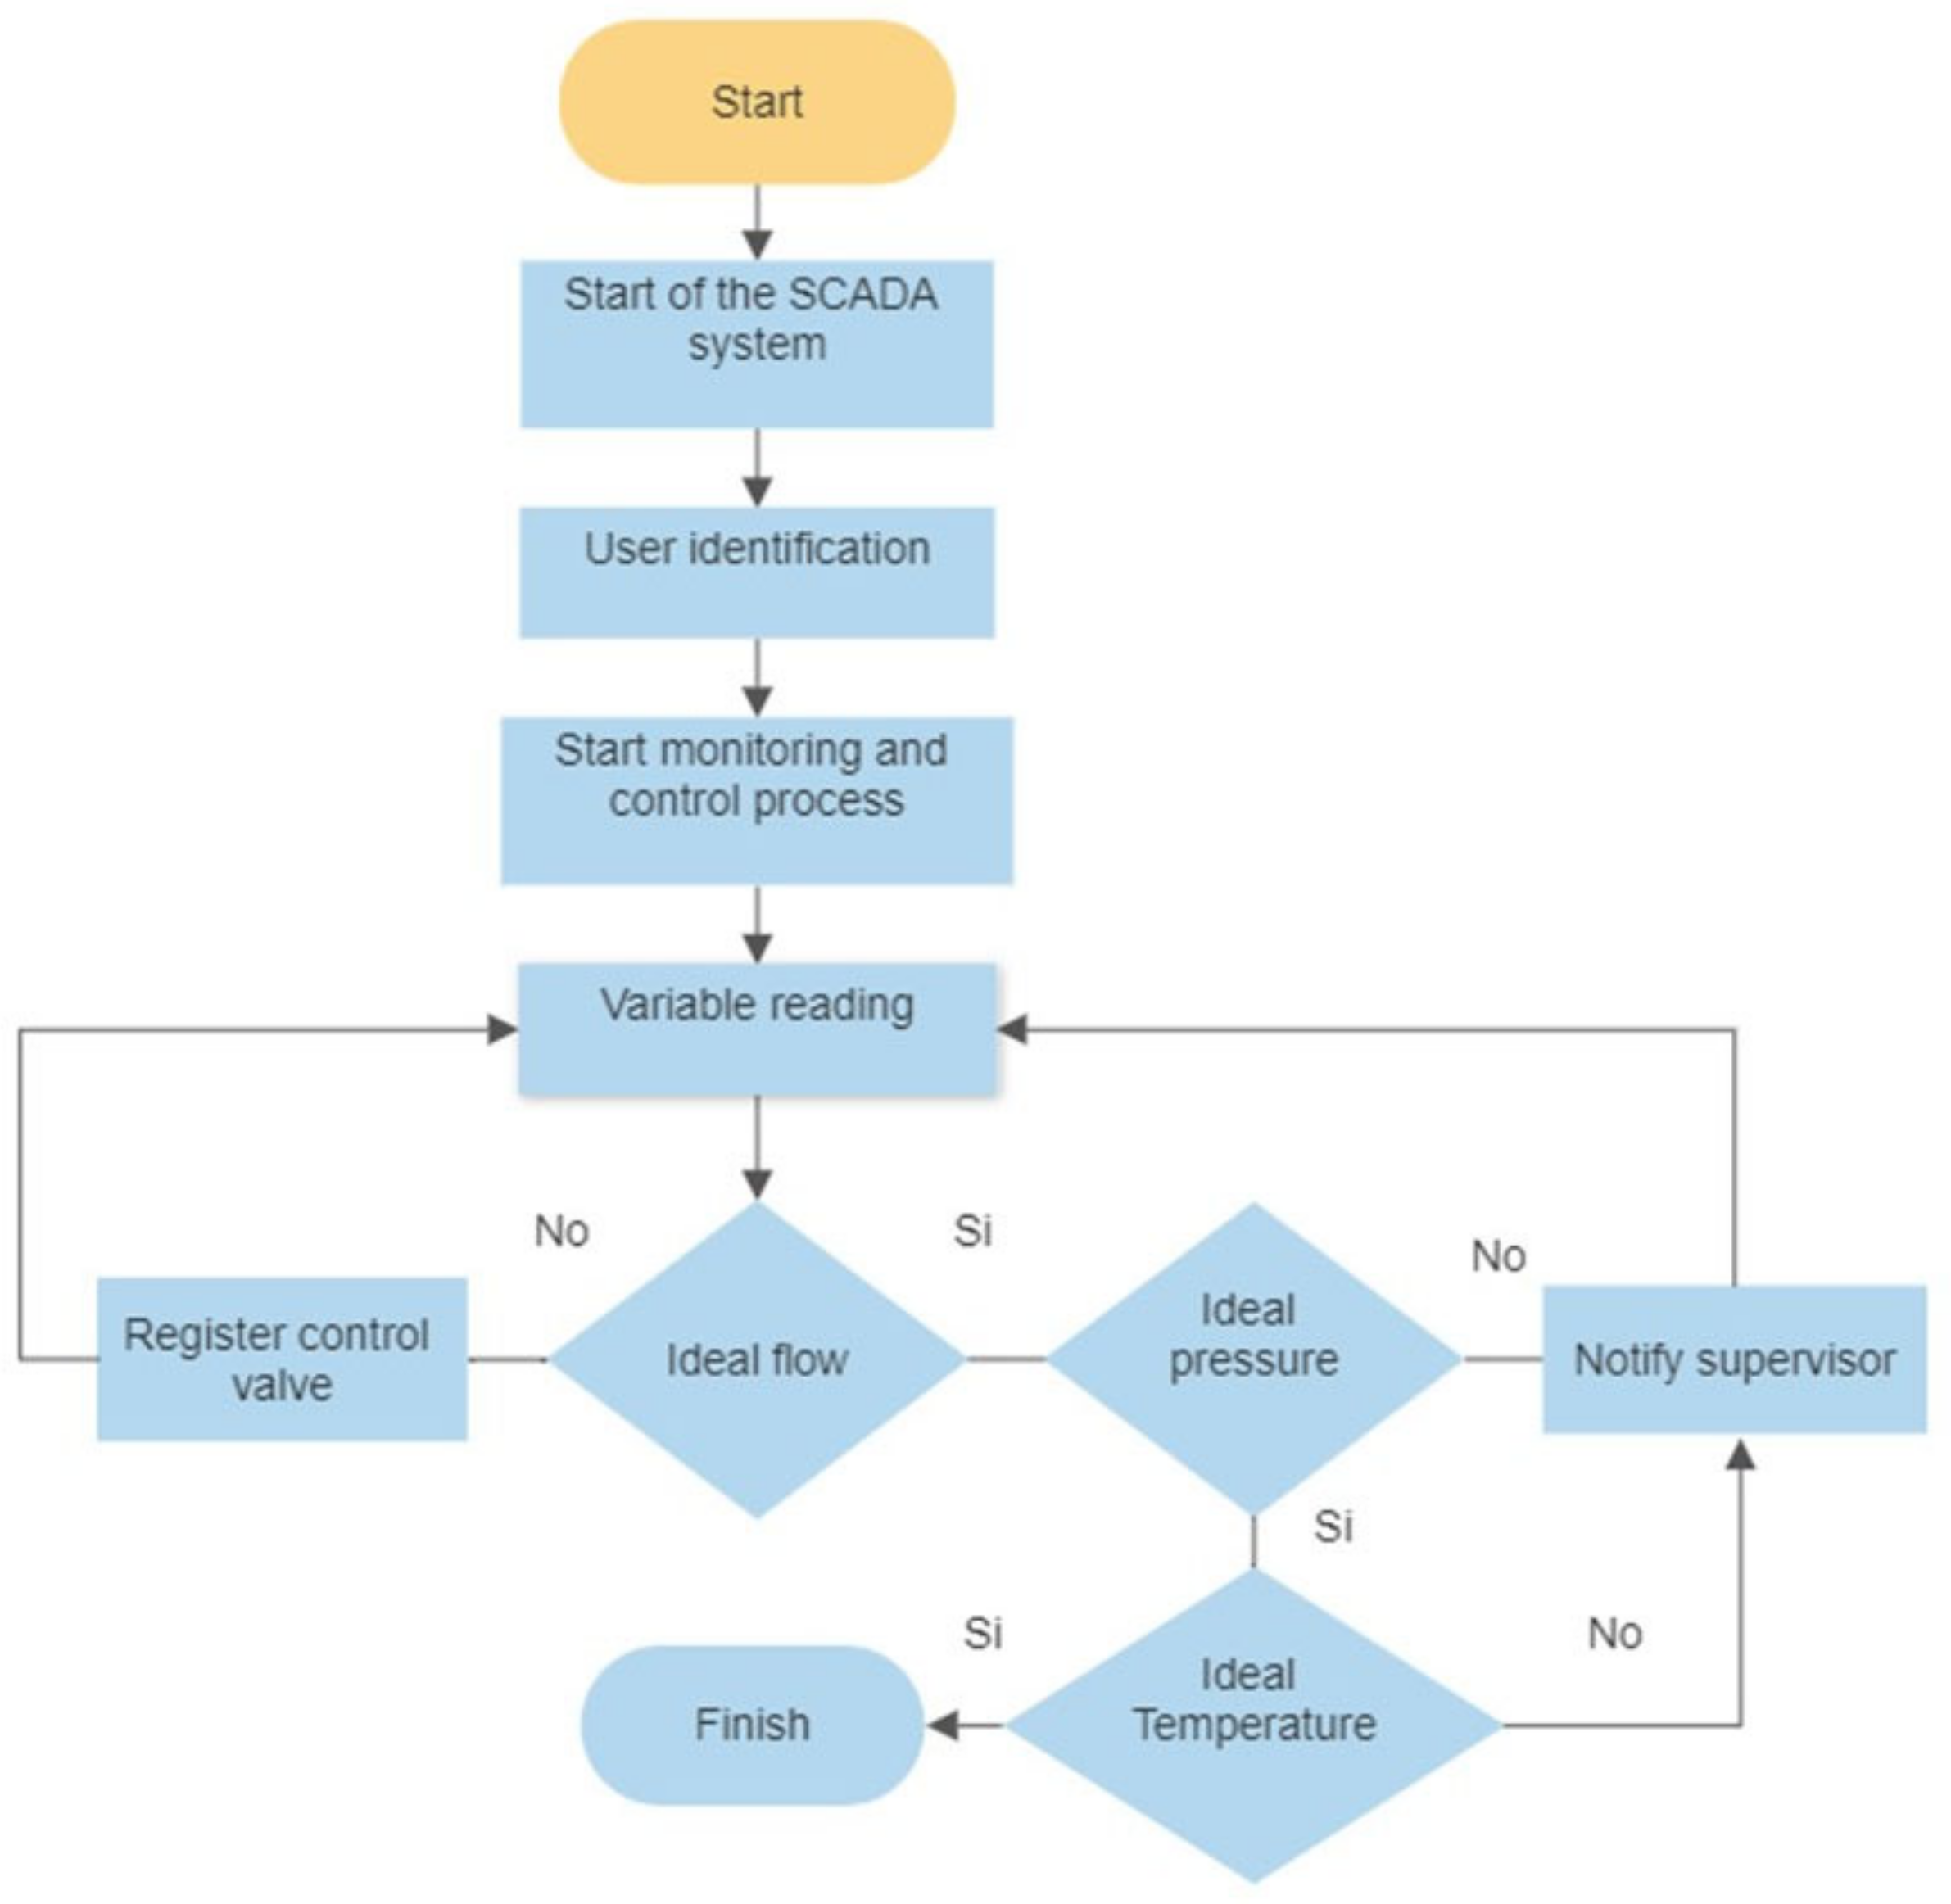
3.3.1. Developing the System Flow Diagram
This diagram shows the relationship of the different elements of the system and, in addition, helps to understand the sequence of steps from the start or access to the GALBA SCADA
® system, user identification that carries out the supervision action of the variables perceived in the field (pressure, temperature, and gas flow), and action that consecutively grants the administrator or operator the option to control the values displayed through the total or partial opening/closing of the control valves, with the purpose of guaranteeing the stability, safety, and productivity of the process.
Figure 6 shows a flow chart of the proposed system.
3.3.2. Making the Connection Diagram
In order to understand the connection of the different elements and the signal flow of the process (analog, digital, and HART), the connection diagram of the system was developed, which shows the wired connections of the data site remote terminal unit with the different actuators and multivariables implemented in the proposed architecture, for which it was necessary to identify the specific location of each of the communication elements of controller 2.
3.3.3. Develop a List of System Signals
Once the proposed system architecture was defined, which represents a generalized vision of the process, it was necessary to identify and define how data transmission is carried out in the system. For this purpose, a list of signals must be elaborated, which represents the basis on which the integration of the proposed structure is achieved.
In this sense, the starting point for the development of the database is the list of signals representative of the process of supervision and control of the operational variables of cluster 5. It is necessary that the signals sent and received by the remote terminal unit used (the data site) are defined in the GALBA SCADA® database, in order to be integrated into the displays, considering the TAGS or tags in addition to the registers or addresses of the devices.
3.3.4. Development of the Displays for Interfacing with the SCADA System
For the development of this activity, the 3D design software Blender® was used, since it is the one used by PDVSA for the elaboration of displays and graphic representations of devices and equipment, to achieve a visual integration that allows for contemplation of a general scheme of the process. Graphic representations of each of the devices and equipment that will be part of the representative scheme of cluster 5 were made.
This section presents an overview and graphic representation of cluster 5, which has two gas injector wells and a gas injection manifold that is fed through HPGIP I.
Figure 7 shows the operational display of cluster 5 where the upper part of the collector is focused, the section where the control action is executed. The operational screen allows for detailed observation of the distribution of the instruments in the field; finally, this screen will be converted into a PNG format image that represents the visual part of the SCADA
® system.
Subsequently, animations were assigned to the control valves, since they are the devices in the field that will change their status according to actions carried out by the operator; for graphic purposes, when the actuator is red, this indicates the total closure of the valve; on the other hand, when the actuator is green, the valve is partially or totally open.
3.4. Phase IV: Deploy
3.4.1. Configure Equipment and Devices
In this phase the corresponding configuration of each of the multivariable transmitters was performed; then, the configurations for the RTU data site were established. The following is a list of the configurations performed.
- -
Configuration of the multivariable transmitters: This activity starts with the configuration of the transmitters for the assignment of a HART address to the device, which is carried out with a tool called hand help. Subsequently, a TAG previously created in the signal list is associated with it, which is nothing more than a tag that associates a specific variable read by the transmitter.
- -
Configuration of the HART address: The HART address identifies the device, in order to bring a sequence of the arrival of signals to the control device and an order of membership through which the HART address is associated with the device.
3.4.2. Connection and Testing of the Devices to the Data Site
Once the equipment was configured, it proceeded to connect them, taking as a starting point and reference the connection diagram previously made. First, the multivariable transmitter is identified and connected to the RTU data site, with it locating the corresponding pins, then the actuators are connected to the corresponding outputs to finally start testing the devices through MODSCA® software, which has an interface that allows reading and/or writing in the data site registers. First, the communication between the control device and the MODSCAN® must be established through the Modbus TCP protocol.
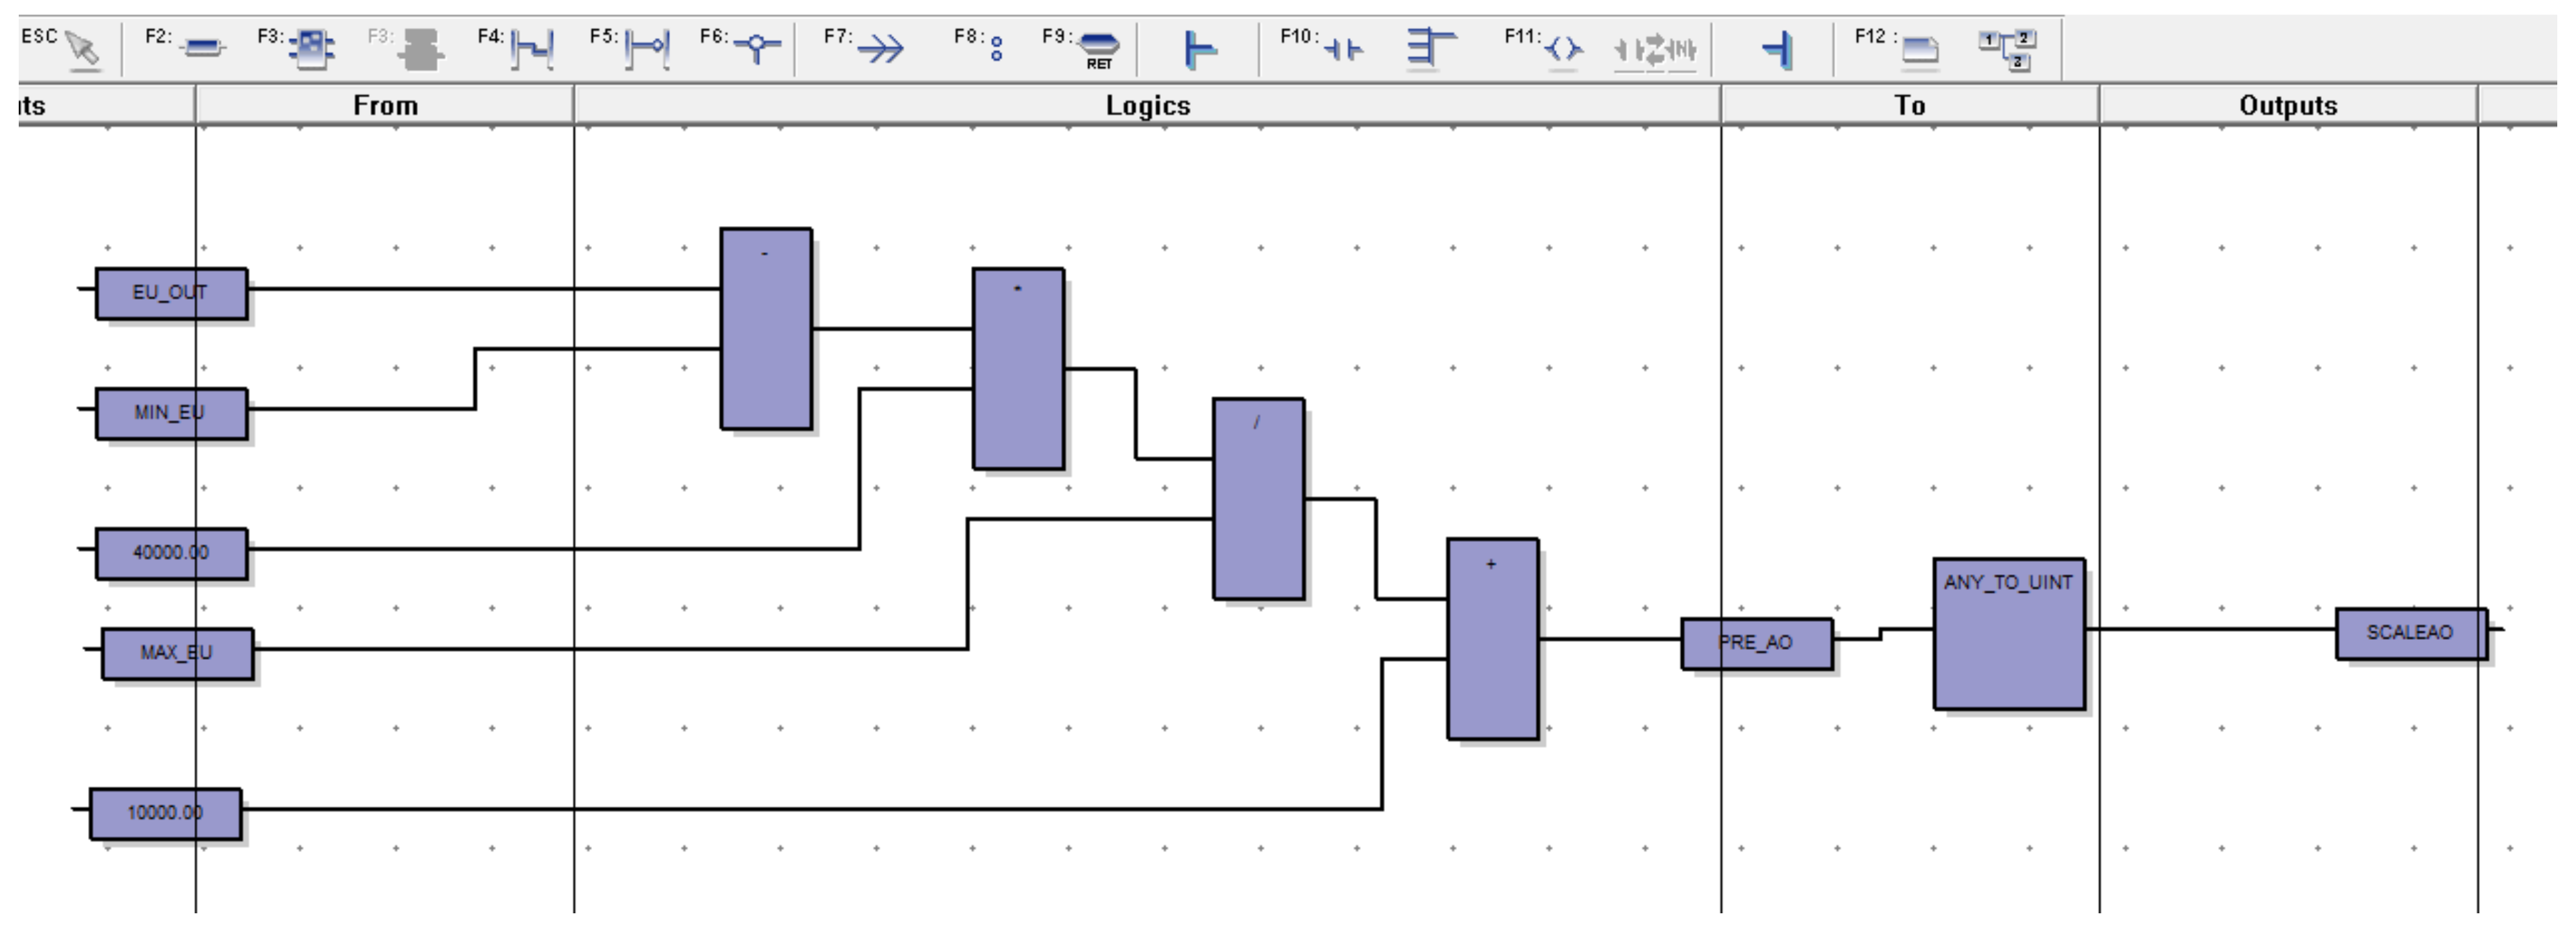
3.4.3. Construction of the Control Logic
Once the connection of the equipment has been made, the communication between the RTU and the computer has been established, and the signals are identified in the signal list, we proceed with the construction of the control logic of the RTU data site; the development of the same is completed with DATASITE WORKBENCH® software in version 5.22 distributed by Rockwell Automation, with this being the default software for the development of control logic.
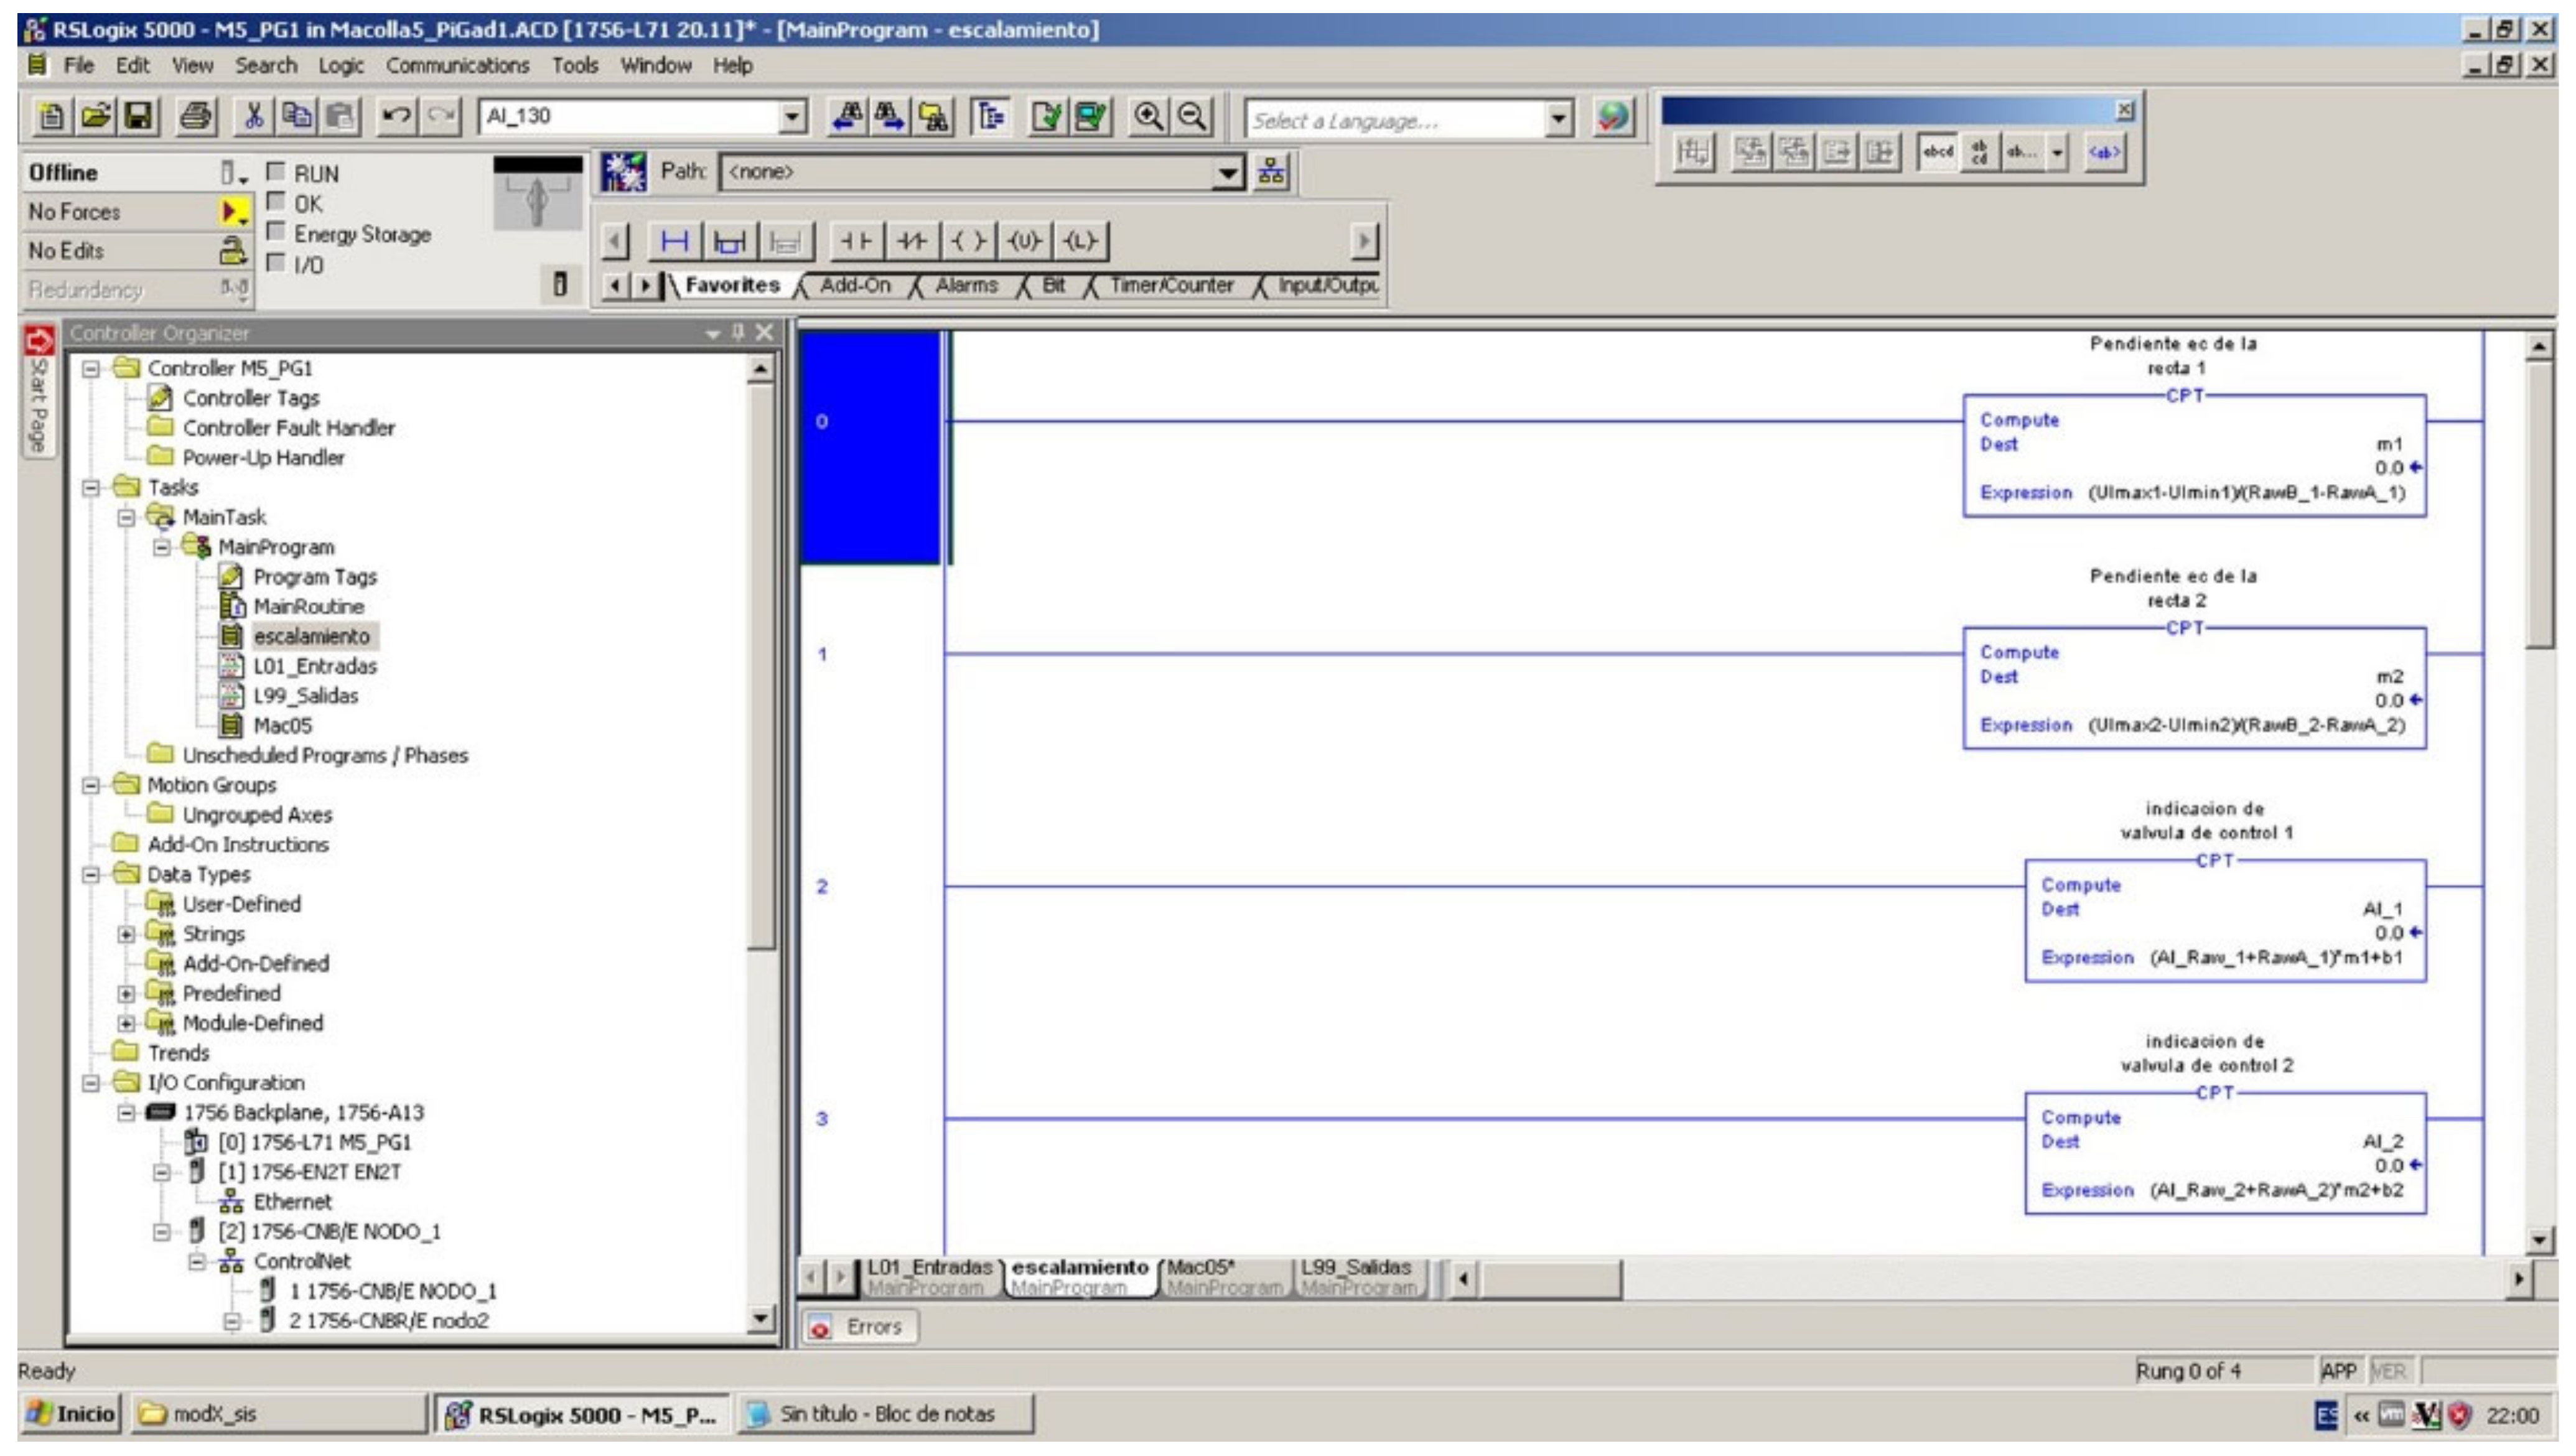
Actuator logic: For the elaboration of the actuator control logic, we proceeded the construction of a scaling of the write and read values to be interpreted, remembering that the write and read from the MODSCAN environment are from 10,000 to 50,000, where 10,000 represents 0% (valve fully closed) and 50,000 represents 100% (valve fully open); the logic was developed in the functional block diagram language, as shown in
Figure 8.
Once the scaling was created, both the writing and reading of data were restricted, denoting that the maximum value that the operator can write to regulate the control valve actuator is 100% and the minimum value is 0% in the same way for reading data. If the operator enters a value greater than the established value, the logic will interpret it as 100%; otherwise, if they enter a negative value, the control logic will interpret it as 0%. Finally, all of the logic presented above is a set of subroutines that are mentioned in the main program. See
Figure 9 and
Figure 10. Later in
Figure 11, we can see the logic for remote and local status control.
The logic presented above allows the reading of the analog input signal, which the operator manipulates in the local state, to become the valve position command when it returns to the remote state.
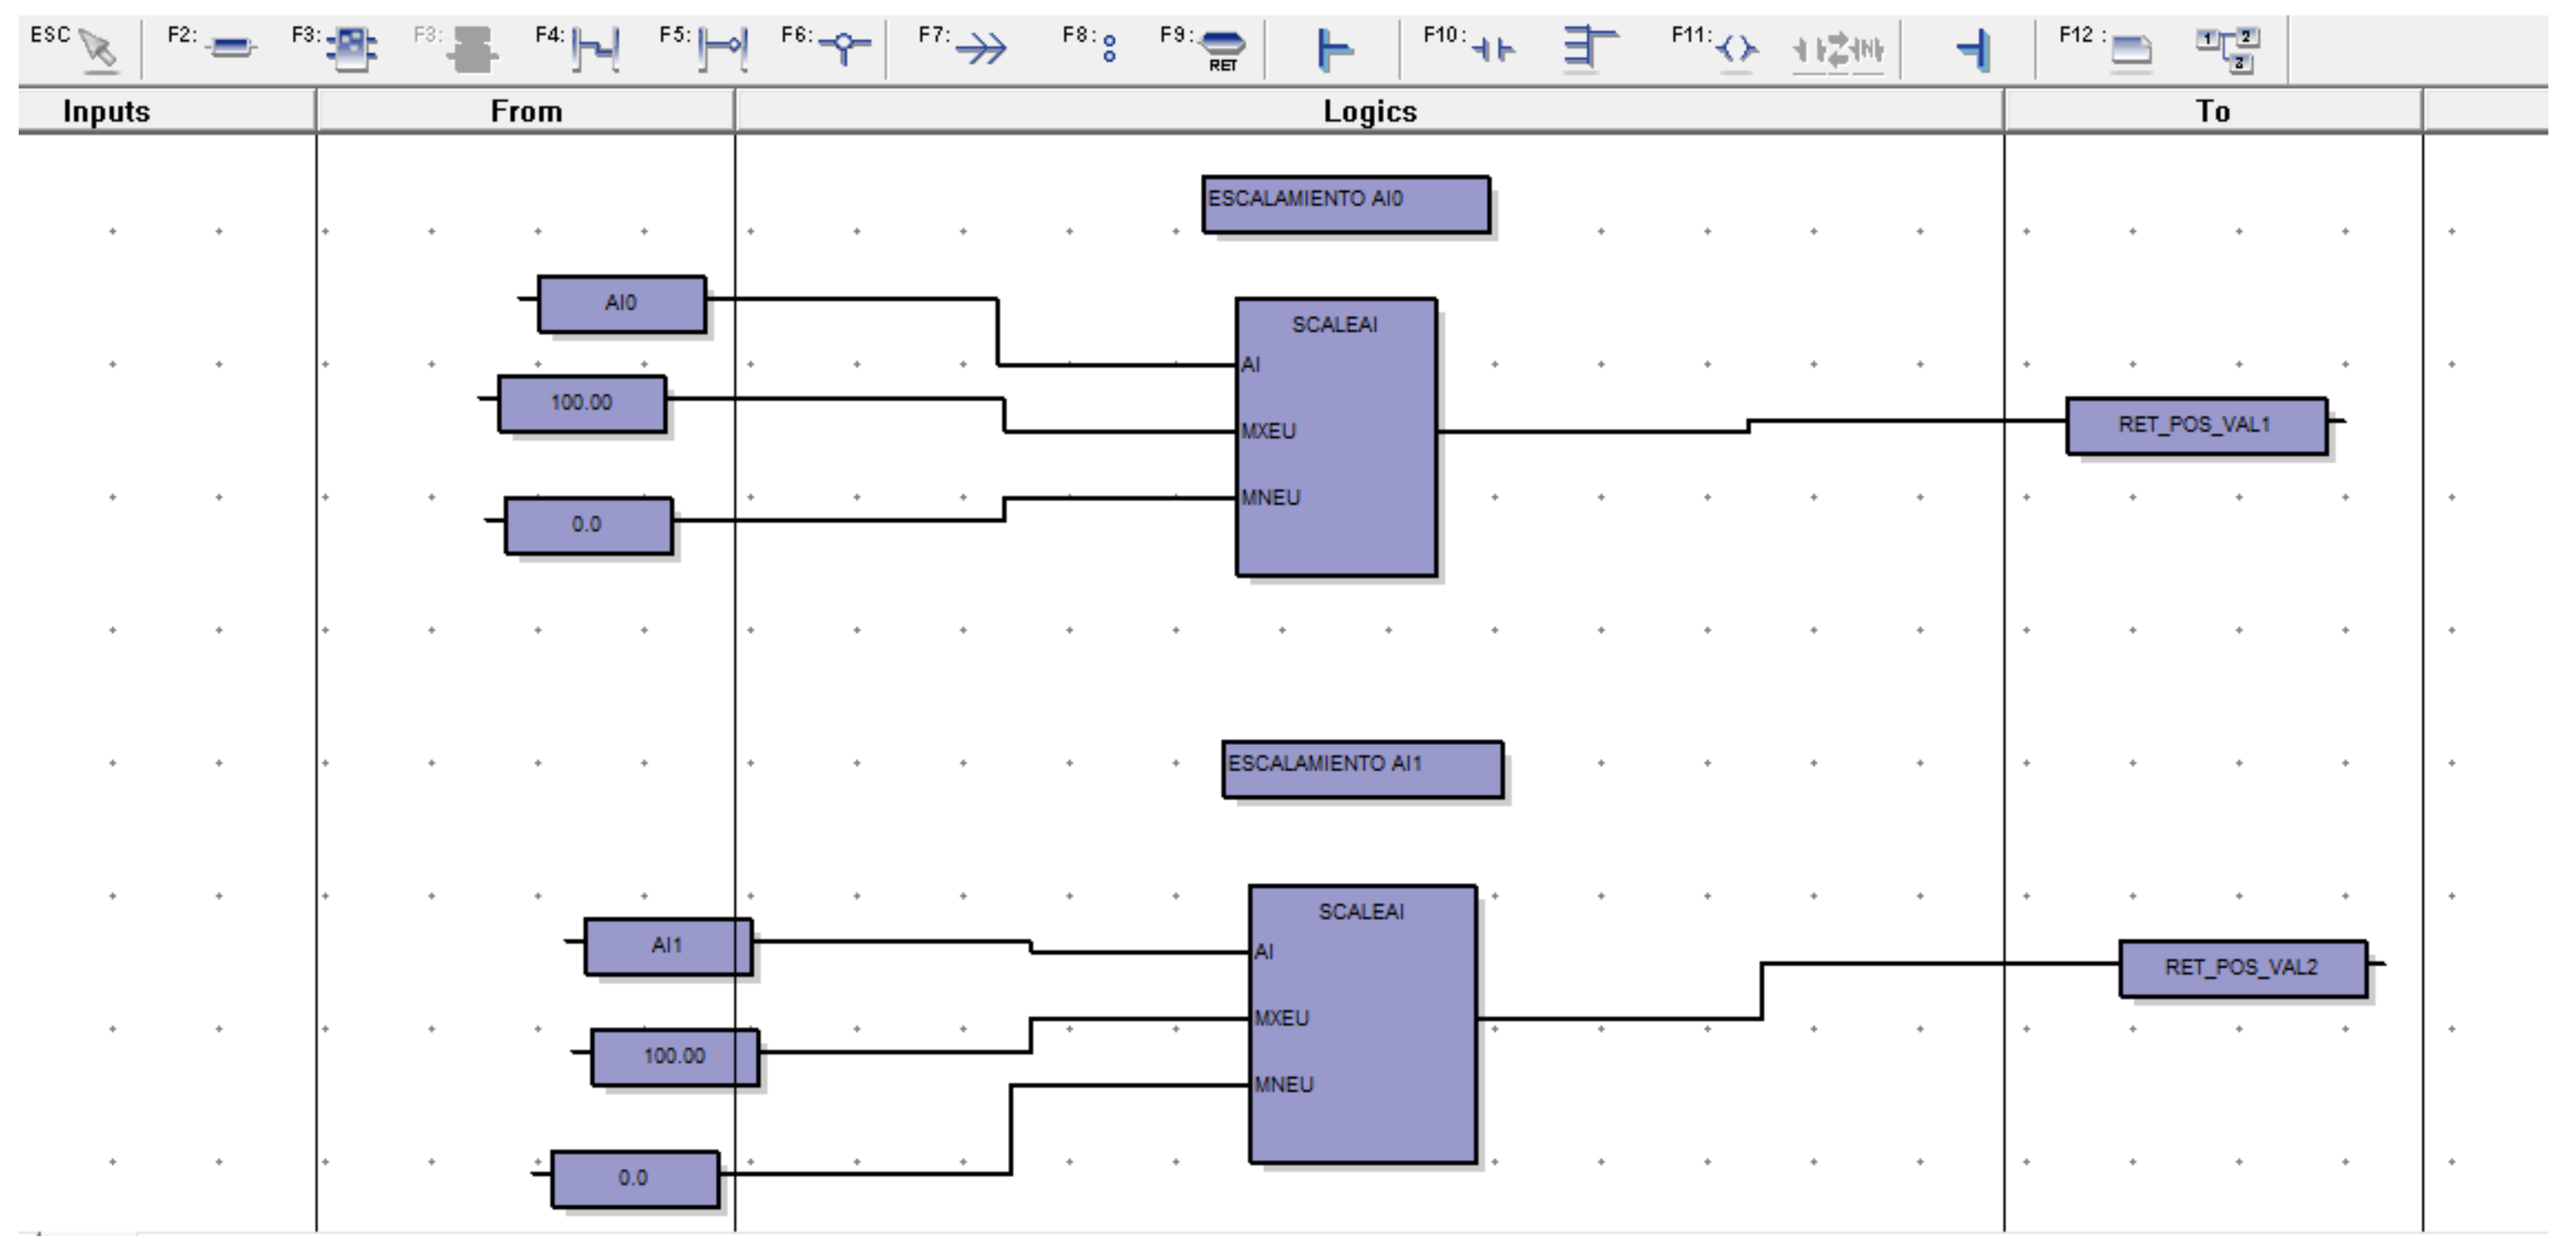
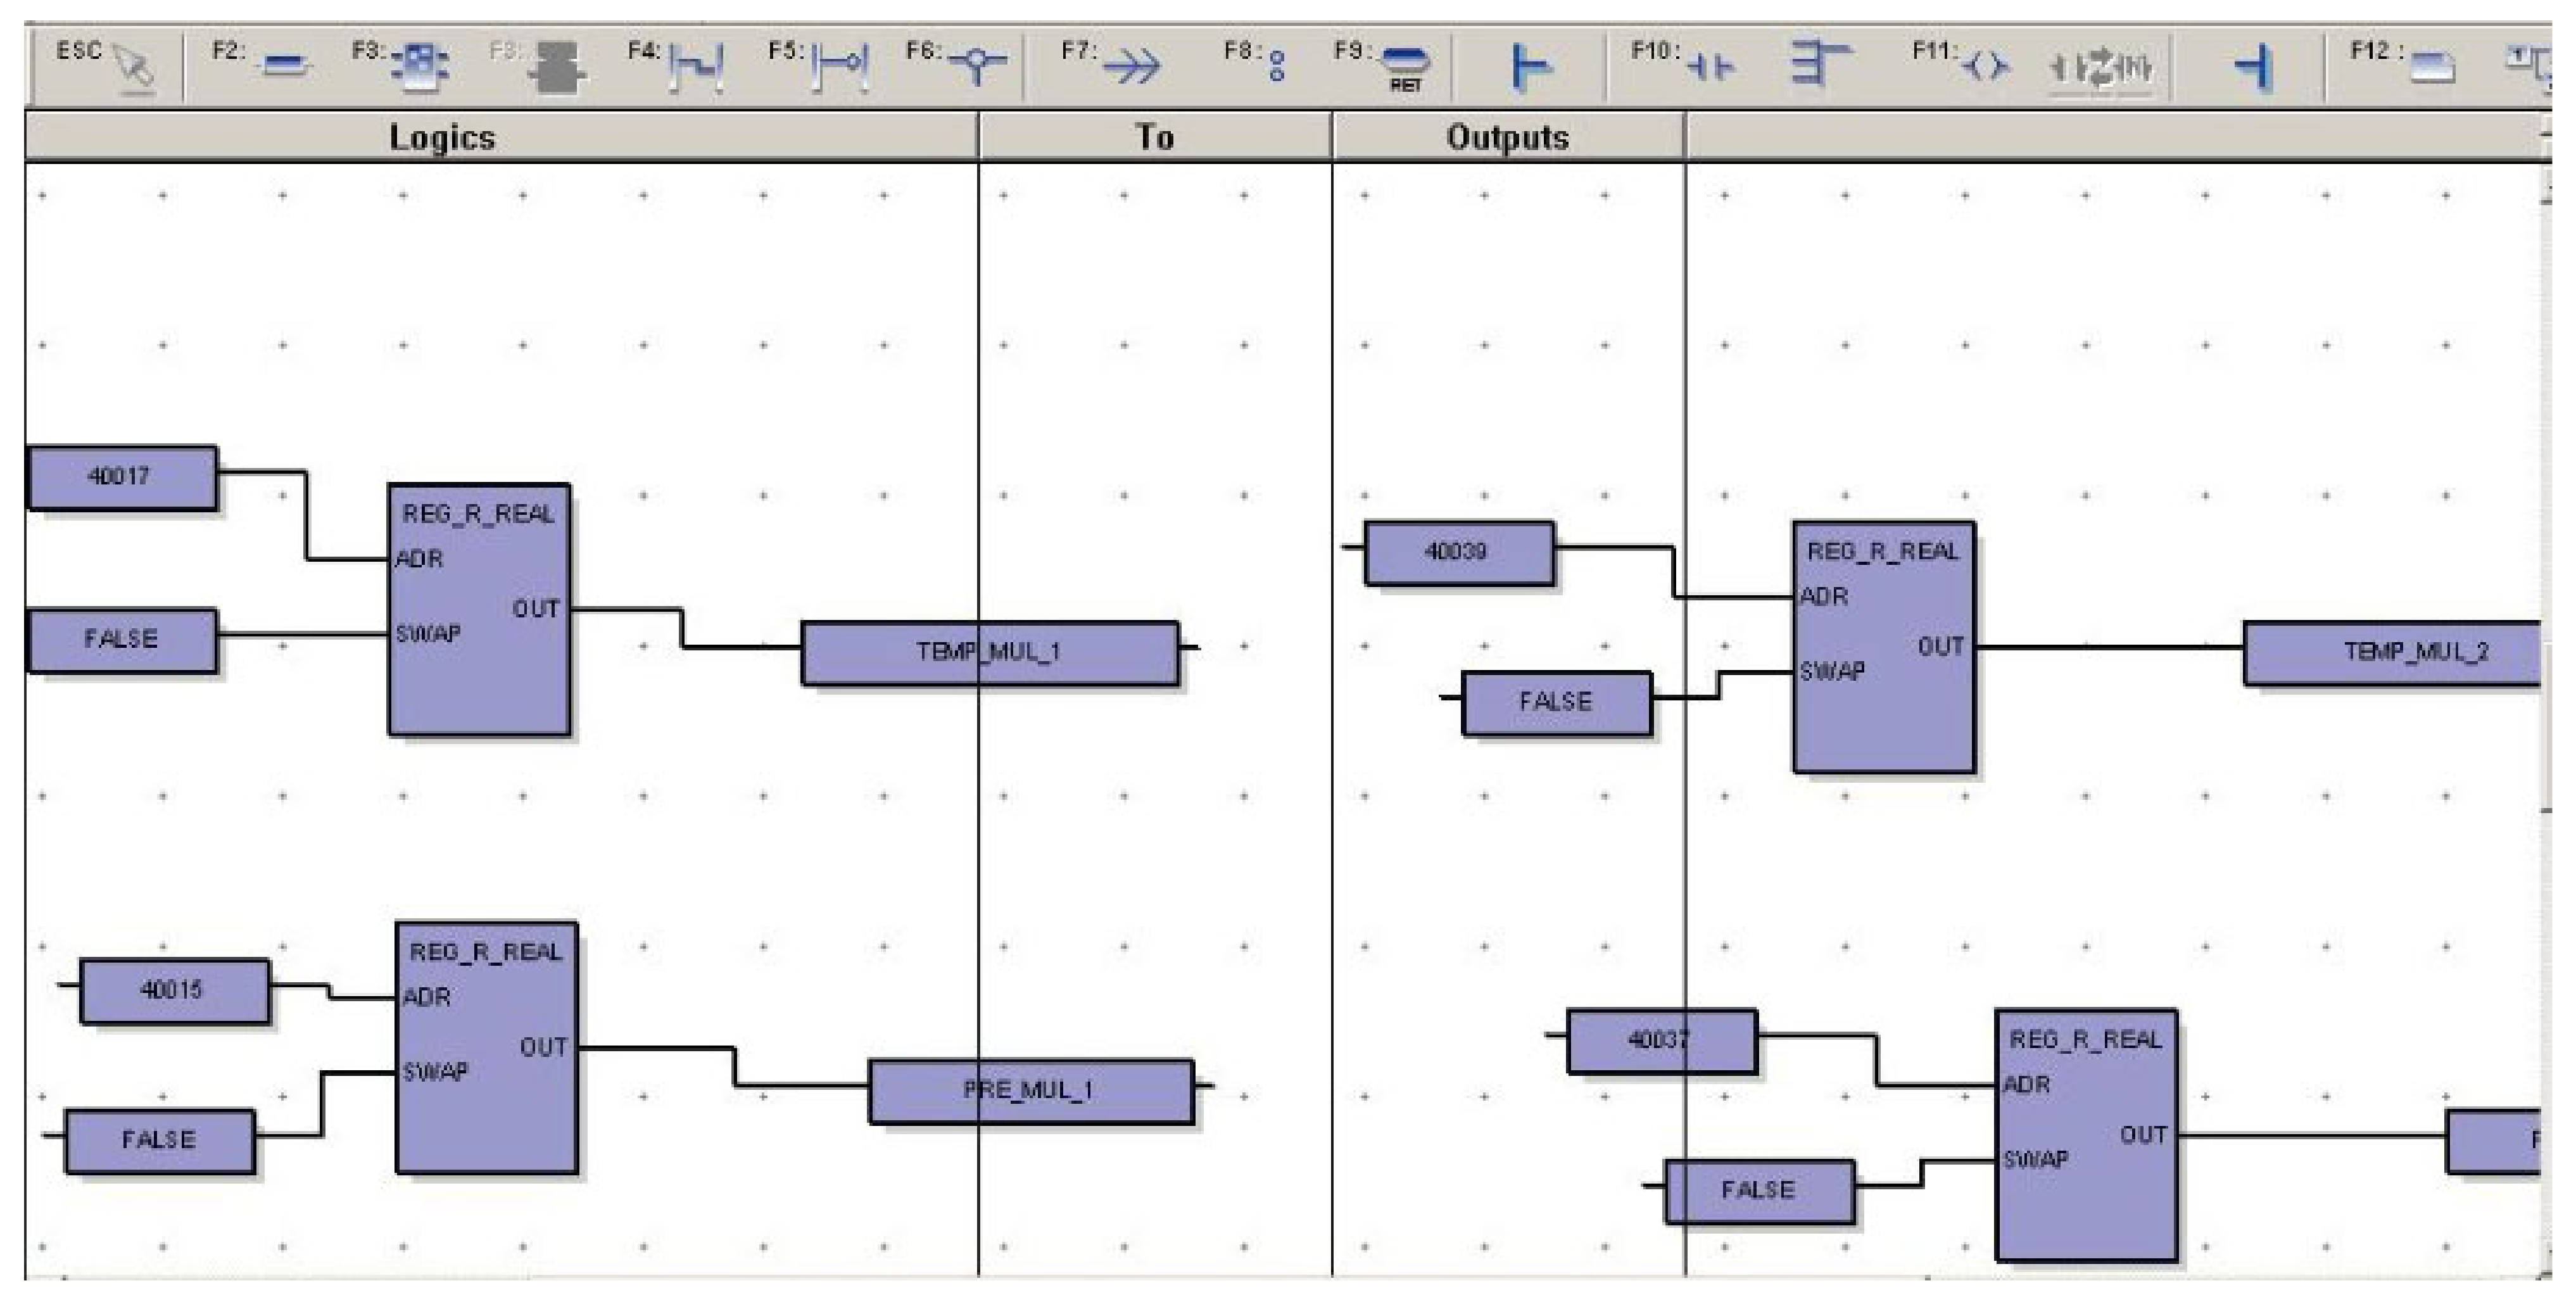
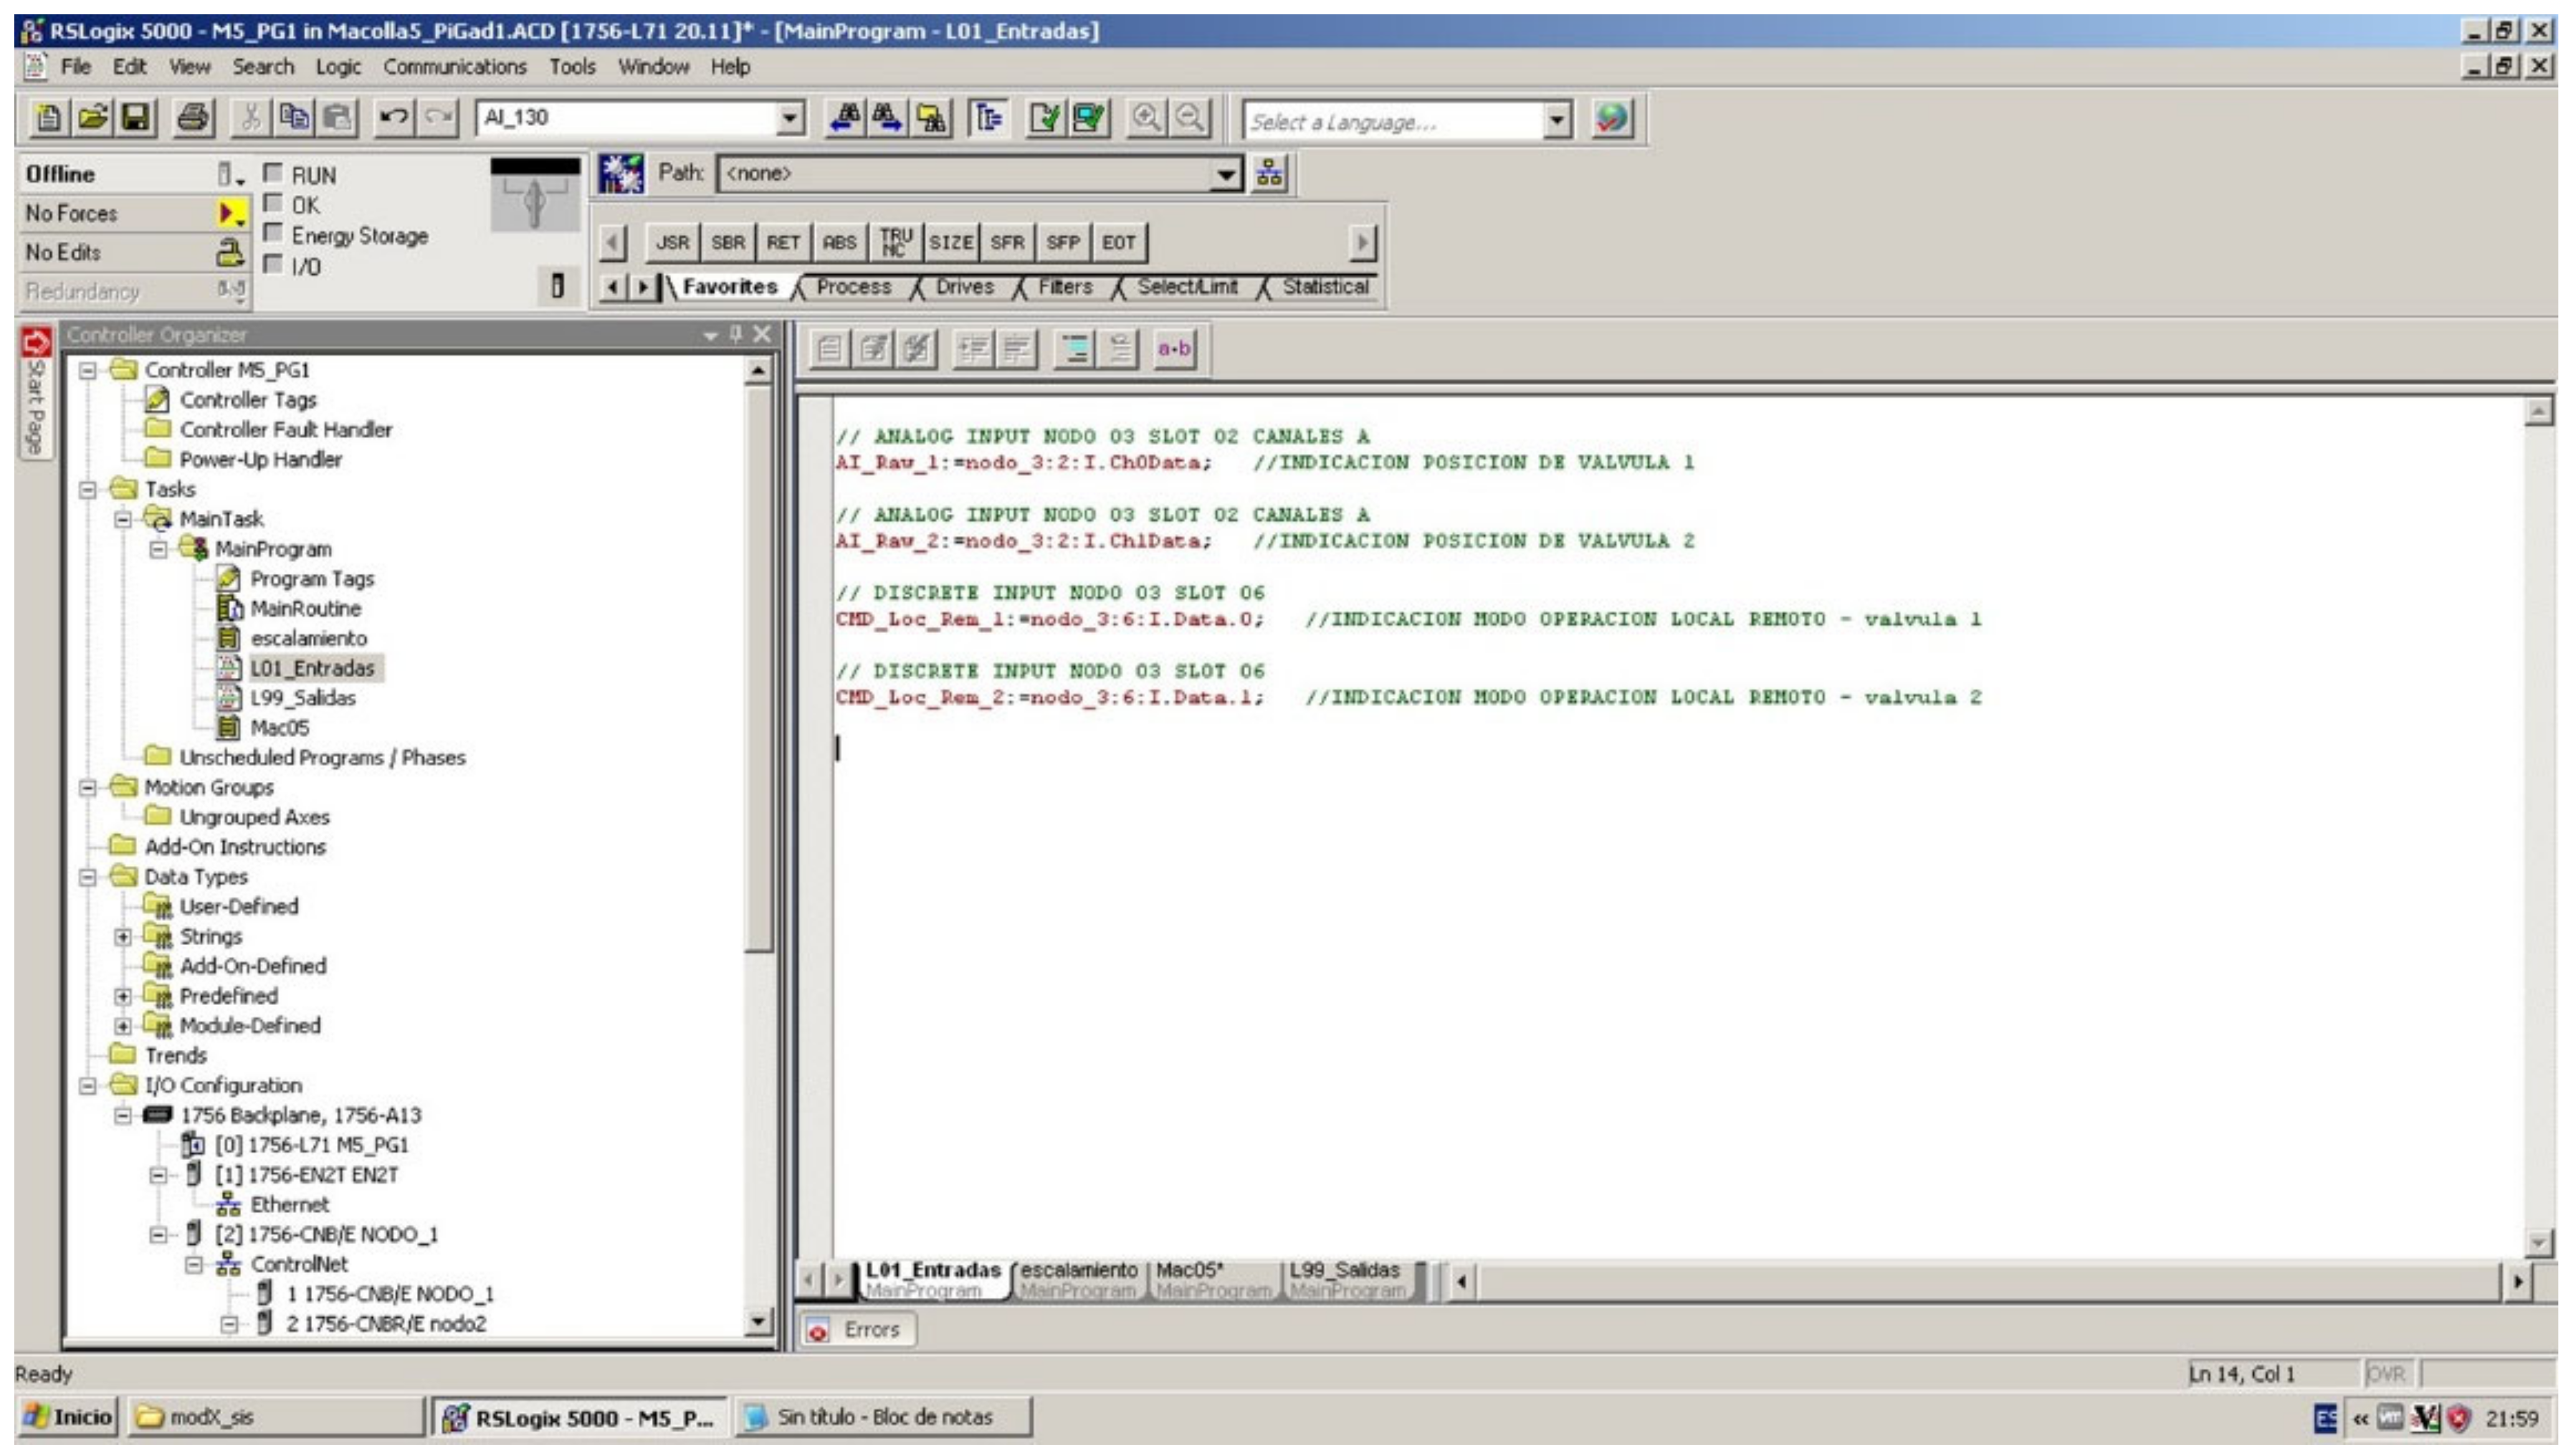
Reading of operational variables: To obtain the operational variables from the register to which they are associated, the DS settings software allows for assigning of an address in a range in which the variables can be observed; for this case, we want to monitor the pressure, temperature, and flow. Through the logic shown in the
Figure 12, you can obtain the reading of the variables and associate them with an output address.
Simulation of the control logic: Once the control logic is completed, we proceed to verify if it works correctly; first, a compilation of the logic was performed. Usually the programming software indicates if any error occurs in the programming when compiling the same; if it was verified that no error had occurred, we proceed to the simulation of the control logic as shown in
Figure 13.
Next, in
Figure 14, the programming in the ladder diagram carried out in the PLC of the main execution routine is shown; in it, the call of the different subroutines is integrated for its subsequent execution. Later in
Figure 15, the programming is shown to obtain the scaling of the signals.
Figure 16 details the programming for assigning the analog and digital input to the operation variables and
Figure 17 shows the corresponding programming for the selection of the operation that needs to be performed.
3.4.4. GALBA SCADA Deployment Development
For the development of the GALBA SCADA®, first, a new project must be created through JCONFIG, which is assigned the name CLUSTER_5; then, a user is created, which will be used to enter the JDESKTOP later on. Then, we proceeded to the creation of the controller to which the signals to be integrated into the database will be associated once the device is configured as shown in the following figure, where a name is assigned to the device DATASITE_ETHERNET and the IP address with which it is connected to the network is assigned.
Subsequently, the analog and digital signals were integrated into the JCONFIG database; this process can be carried out in two ways: the first one is through the creation of a document with the extension. csv where all the necessary data for the database can be stored, one document for the analog signals and another one for the digital signals to be imported to the database. Then, in the JEDITION environment, we proceeded to configure and design all of the elements for the GALBA SCADA® in order to obtain a screen for supervision and control of the processes, which is nothing more than a man-machine interface of cluster 5.
The
Figure 18 shows the reading of the operational variables and the corresponding MeterEx to the perform control actions on the actuator.
Through the interface offered by SCADA GALBA®, it will be possible to facilitate the work of operators in the field and it will be possible to regulate the amount of gas injected into each of the gas injection wells by opening or closing the actuator, a process that is carried out in the PDVSA industry.
4. Conclusions
The evaluation of the current situation, through the operating philosophy of PDVSA, allowed for the establishment of comparisons of the process and, at the same time, highlighted the existing problems in terms of reading the parameters associated with gas injection, in order to understand and face situations by diagnosing needs, which allowed for development of a proposal to optimize the process and consequently reduce operating costs.
The identification of the technology used in the production process, in addition to the necessary requirements, suggested a technological architecture proposal for the supervision of variables such as flow, temperature, and pressure, while it is possible to control the pressure of the gas injected into the wells. The instruments chosen for the measurement and/or control of the operating variables have the necessary characteristics adapted to the PDVSA process.
Regarding the architecture design and its technical specifications, two multivariate transmitters were used that encapsulate a HART communication protocol, which allows for its multipoint connection, which is ideal for the characteristics of the remote terminal unit of the site of data; in the case of the actuators, they handle a protocol of 4–20 mA. The use of relays in the system allows the change of local–remote status through digital signals.
The connection and adaptation of the different equipment, such as multivariable transmitters and actuators to the remote terminal unit, made it possible to apply functional tests with satisfactory results. Among these results, the measurement of variables and the regulation or opening/closing of the actuator stand out for the design and development of the control logic for the two process states, including the local one, so that the corresponding field operator of cluster 5 performs corrective actions manually, and the remote one, in which supervision and control of the parameters are carried out performed from the control room.
The proposed system allows us to control the opening percentage of the gas flow control valve, the opening percentage depends on the well conditions (flow, temperature, and pressure). These conditions change and this generates the need for a greater or lesser opening percentage of the control valve. With manual valves, an operator adjusts the flow measurement and the opening necessary for its control, and they need to carry out on-site monitoring at each key point in the system. The opening and closing of the valve is carried out manually until a proper balance is achieved with variations of two to five percent precision, with the variation affecting the diameter of the pipe which directly affects the injection of gas, causing the affectation of the crude fluid and ther affectation of the reservoir. Currently, the MUC-67 and MUC-68 wells that make up cluster 5 require a control valve opening of 20% and 5%, respectively, and this percentage is directly affected by the average valve opening error when performed in the manual way. Cluster 5 is located 10 km from the HPGIP 1 plant, which makes it difficult to open the valve on time. Automatic opening allows timely decisions to improve well production without affecting the useful life of the reservoir. The present investigation serves as a reference for the implementation of a technological architecture that allows for the supervision of variables such as the flow, temperature, and pressure of the wells, while it is possible to control the pressure of the gas injected into the wells, through the automatic opening of the control valves proposed for gas injection wells present in the oil industry, specifically in high-pressure gas injection plants.
In PDVSA, the study can be replicated in other clusters that contain gas injection wells as a secondary recovery method, since the Venezuelan oil industry maintains an approved homologated platform where the equipment considered takes into account the standards established by PDVSA. Oil companies that use secondary recovery processes through gas injection may replicate the study considering the nature and particularity of their platform, which could lead to the use of the proposed control logic and possible change in the equipment and/or devices used in the present investigation.


 ,
, 


