Article

Performance of a Solar-Driven Photocatalytic Membrane Reactor for Municipal Wastewater Treatment

by
Mirela Alina Constantin
1,
Lucian Alexandru Constantin
1,
Ioana Alexandra Ionescu
1,
Cristina Mihaela Nicolescu
2,
Marius Bumbac
2,3 and
Olga Tiron
1,*
1
National Research and Development Institute for Industrial Ecology-ECOIND, 57-73 Drumul Podu Dambovitei, District 6, 060652 Bucharest, Romania
2
Valahia University of Targoviste, Institute of Multidisciplinary Research for Science and Technology, 13 Aleea Sinaia, 130004 Targoviste, Romania
3
Valahia University of Targoviste, Faculty of Science and Arts, 13 Aleea Sinaia, 130004 Targoviste, Romania
*
Author to whom correspondence should be addressed.
Processes 2024, 12(3), 617; https://doi.org/10.3390/pr12030617
Submission received: 7 February 2024 / Revised: 15 March 2024 / Accepted: 18 March 2024 / Published: 20 March 2024
(This article belongs to the Special Issue Photocatalysis Application in Environment Science)

Abstract

:
The increasing demand for efficient wastewater treatment technologies, driven by global population growth and industrialisation, highlights the necessity for advanced, reliable solutions. This study investigated the efficacy of a slurry photocatalytic membrane reactor (PMR) for the advanced removal of organic pollutants, quantified via chemical oxygen demand (COD), under natural and simulated solar light irradiation. Employing two variants of iron-doped titania as photocatalysts and a polysulfone-based polymeric membrane for the separation process, the investigation showcased COD removal efficiencies ranging from 66–85% under simulated solar light to 52–81% under natural sunlight over a 7 h irradiation period. The overall PMR system demonstrated COD removal efficiencies of 84–95%. The results confirmed the enhanced photocatalytic activity afforded by iron doping and establish solar-powered slurry PMRs as an effective, low-energy, and environmentally friendly alternative for the advanced treatment of municipal wastewater, with the research providing valuable insights into sustainable water management practices.

1. Introduction

One of the present challenges in the field of water/wastewater treatment is represented by the development of low-cost advanced treatment methods able to degrade/remove hazardous, non-biodegradable pollutants.
Most conventional municipal wastewater treatment plants (MWWTPs) use activated sludge treatment as a secondary treatment step to remove organics, suspensions, and nutrients, but are inefficient at removing refractory contaminants such as pharmaceuticals and personal care compounds, endocrine disruptors, pesticides, additives, and microplastics, as well as their degradation intermediates [1,2]. Exposure to such organic compounds has been proven to negatively affect both human and living organisms. Even if complex organic compounds are difficult to degrade using conventional biological methods, advanced oxidation processes such as photocatalysis are capable of removing them relatively easily. The photocatalytic process involves three main steps: (i) the photo generation of charge carriers, (ii) the diffusion of charge carriers to the catalyst surface, and (iii) redox reactions on the catalyst surface. Moreover, if compared with other conventional wastewater treatment methods, such as coagulation–flocculation, ion exchange, or adsorption, the process presents the advantage of being environmentally friendly due to its mineralisation capability.
On the other hand, the most advanced MWWTP uses membrane-based processes as a tertiary treatment step to achieve outflow quality indicators suitable for reuse for various purposes [3], but faces problems related to membrane fouling and the associated decrease in membrane operational life and increase in membrane cleaning operations and costs related to its replacement. Since organic compounds are important contributors to membrane fouling, advanced oxidation processes (including heterogeneous photocatalysis) have been investigated to improve membrane separation performance and lifetime.
The coupling of membrane-based processes with heterogeneous photocatalysis (photocatalytic membrane reactors—PMRs) has proven to be an efficient and effective alternative for municipal wastewater treatment. Among the two mains PMR configurations, the slurry PMR system showed promising results compared with both the PMR design with an immobilized catalyst and other tertiary treatment processes such as chlorination, constructed wetlands, microalga cultivation, ozonation, and photo-Fenton methods [4].
Several authors have investigated the coupling of membrane filtration with photocatalysis to overcome issues related to membrane fouling and the need to remove some pollutants from the permeate water [5,6]. The advantages of heterogeneous photocatalysis among other advanced oxidation processes are represented mainly by the good reaction rate and efficiencies. The most widely used photocatalyst is TiO2, which is chosen for its chemical inertness, low cost, availability, non-toxicity, and recyclability. However, TiO2 photocatalyst is inactive under visible light due to its wide band gap (3.2 eV), rapid recombination of holes/electrons pairs, and limited adsorption range in visible light (only about 4% of the solar spectrum). In this context, TiO2 doping with metals is one of the most investigated and studied methods to improve the photocatalytic activity of TiO2 and to ensure that its adsorption spectrum shifts towards the visible domain. This approach has been proven to be a useful tool for improving the visible light response of the catalyst and can be easily implemented by using the well-known sol–gel method.
The majority of investigated PMRs operate under UV irradiation [7,8], but there are research studies aimed at testing PMRs under visible light and/or simulated solar light as a sustainable method to solve environmental problems, of which the following are mentioned: photocatalytic membrane fouling control in wastewater treatment [3]; the degradation of various organic compounds using a visible-light-driven photocatalytic membrane [9,10,11,12,13]; the development of new visible light active photocatalysts for the advanced degradation of refractory organic compounds from wastewater systems [14,15,16,17,18,19,20,21,22].
The use of solar-light-driven PMRs for the advanced removal of organic loadings may offer the advantages of using visible light as a renewable irradiation source and having an increased lifetime for the polymeric membrane, but there are relatively few studies using real wastewater, the vast majority focused on the degradation of emerging organic pollutants from synthetic solutions [3,4].
In this context, the present work attempts to investigate the performance potential of a solar-driven PMR with a suspended catalyst, using an Fe-doped TiO2 photocatalyst and a polysulfone-based membrane, for the advanced treatment of municipal wastewater.

2. Materials and Methods

Iron-doped catalysts were synthesised via the sol–gel method (alkoxide route) using titanium isopropoxide (Sigma Aldrich Chemie GmbH, Steinheim, Germany) and FeCl3 (Sigma Aldrich). Ethanol (Chimreactiv, Bucharest, Romania) was used as a solvent. Titanium isopropoxide was dissolved in ethanol at room temperature under continuous stirring, and then a mixture of ultrapure water and ethanol was added to perform the hydrolysis step. Afterward, the solution of FeCl3 in ethanol was added dropwise (in small portions under vigorous stirring). Resulted solutions were maintained under vigorous stirring for 3 h at room temperature. The resulting sols were converted into gels by drying at 80 °C for 24 h [23,24], and then thermally treated at 300 °C (catalyst sample FT1) and 400 °C (catalyst sample FT2) for 2 h. Titanium dioxide anatase form (Merck, Darmstadt, Germany) was used as a reference for the assessment of prepared catalyst photocatalytic activity.
The polysulfone-based membrane was prepared via a phase inversion process, an immersion precipitation technique using polysulfone (Psf) Mw = 35,000 g/mol (Sigma Aldrich) as the base polymer, and 1-methyl- 2-pyrrolidone (NMP), purity >99.5% (Merck), as a solvent. Polyvinylpyrrolidone (PVP) K30 (40,000 g/mol) (Fluka, Paris, France) and polyethylene glycol (PEG) 400, Mw = 3500–4000 g/mol (Scharlau, Hamburg, Germany) were used as additives [25]. Ultrapure water was obtained using Milli—Q Integral 15 (Merck, Millipore, Darmstadt, Germany) equipment and was used as a non-solvent in the coagulation bath. Then, 96% purity ethanol (Chimreactiv) and 99.5% glycerine (Chempur, Karlsruhe, Germany) were selected for the post-treatment and conditioning of the membranes. The membrane was obtained as follows: Psf and additives were dissolved in NMP under continuous stirring (at room temperature, for 24 h); the polymeric solution was cast onto a flat glass sheet using a “doctor blade” device with a 300 µm slot (speed 1 m/min); the casted membrane was immersed in an ultrapure water coagulation bath (for 5 min); the resulting membrane was repeatedly washed with ultrapure water and subjected to conditioning (using a 10% ethanol solution); membranes were stored in 10% glycerine solution and, prior to use, were immersed in 10% ethanol solutions for 2 h and repeatedly washed with ultrapure water.
A scanning electron microscope, FEI Quanta FEG 250 (Thermo Fischer, Waltham, MA, USA), was used for morphological characterisation and EDX (energy dispersive X-ray spectroscopy) analyses. Dimensional analysis was performed using Mastersizer 2000 (Malvern, Malvern, UK) equipment, which provides a comprehensive report of sample data on particle size distribution, specific surface area, surface-weighted mean, and volume-weighted mean. X-ray Fluorescence analyses were conducted using an X-ray fluorescence spectrometer Rigaku NEX CG EDXRF (Applied Rigaku Technologies Inc., Cedar Park, TX, USA).
The X-ray diffraction (XRD) technique was applied for the microstructural analysis of the catalyst samples. The samples studied were ground to powder form and then placed in the standard quartz trays of the diffractometer. Data acquisition was performed with the Ultima IV diffractometer (Rigaku, Tokyo, Japan) using monochromatic Cu Kα radiation (λ = 1.54056 Å) from a fixed anode X-ray tube operated at a voltage of 40 kV and a current of 30 mA. Diffractograms were recorded for the angular 2-theta range of 10–90 degrees, in Bragg–Brentano geometry, in continuous scan mode, at a speed of 1 degree/minute, with a step width of 0.02 degrees. The crystal microstructure analysis was performed using the functionalities of PDXL software version 2.2. and ICDD database PDF4+ version 2022.
Complementary techniques of Fourier transform infrared spectroscopy (FTIR) and Raman spectroscopy were used to evaluate the changes in the molecular structures of the studied TiO2-based as-synthesised catalysts, and these were compared with the control sample of TiO2 anatase. Infrared spectra were recorded on a Vertex 80 infrared spectrometer (Bruker, Ettlingen, Germany) in the wave number range from 4000 cm−1 to 400 cm−1, with 32 scans per sample and a resolution of 4 cm−1. Measurements were performed in reflectance mode, using the automated total reflectance (ATR) instrumentation of the spectrometer, and powder samples were scanned without further preparation. Raman spectra were recorded at 1064 nm on a Xantus 2 spectrometer (Rigaku, Tokyo, Japan) in the wavelength range of 200–2000 cm−1 with a spectral resolution of 7–10 cm−1. The total exposure time to collect the Raman spectra was 2500 milliseconds, and the applied laser power was 50 mW. The instrument was calibrated with pure benzonitrile before each set of measurements. Triplicate powder samples were scanned, and the average Raman spectra were taken as the result for further comparisons.
An LED lamp with 35 W power consumption, a wavelength of 380–800 nm, and a luminous flow of 1000 lumens was used to simulate solar radiation. Provided light irradiance (µmol/m2/s) was measured with a full-spectrum meter, Apogee MQ 500 (Apogee Instruments, Logan, UT, USA). The tests were performed during the winter period, with a mean daylight irradiance below 500 µmol/m2/s. In the case of photo degradation tests carried out under simulated solar light, the light irradiance was adjusted to match the intensity of natural daylight.
A custom-made installation was operated for the photocatalytic degradation tests. A CPC (component parabolic collector) reactor configuration was chosen due to its advantages in terms of good degradation efficiencies and lower energy losses [3,4,10]. The installation (presented in Figure 1) consists of the following main elements:
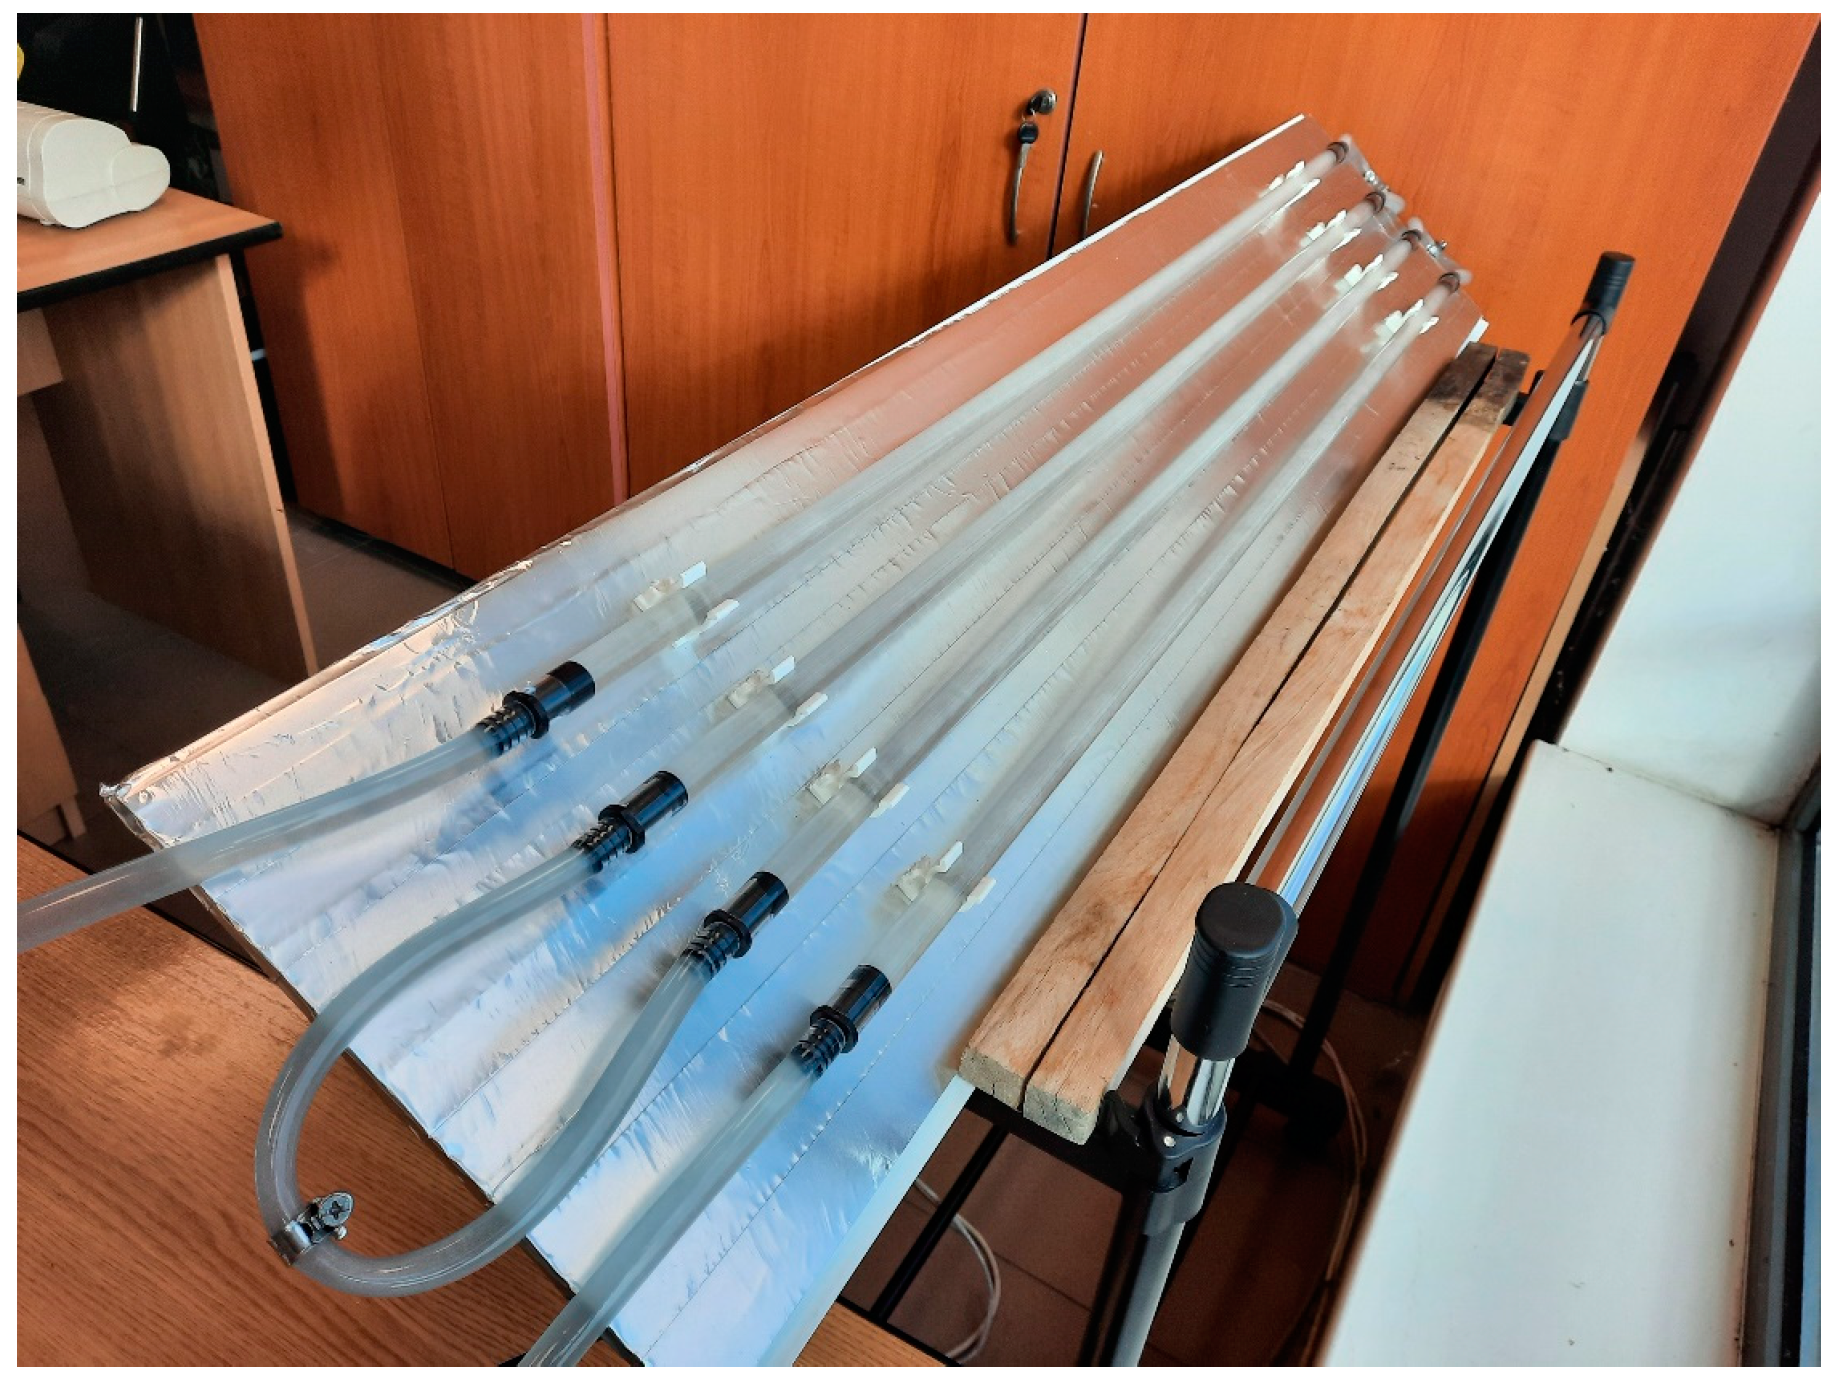
  • Four transparent PETG (polyethylene terephthalate glycol) tubes with an outer diameter of 16 mm, an inner diameter of 12 mm, and a length of 1 m. The dimensions of the tubes were chosen to give the CPC reactor a total capacity of 2 litres.
  • A submerged feed/recirculation pump (with the possibility to adjust the flow). A constant recirculation flow of approximately 1 L/min was used during the degradation tests. Recirculation flow was chosen to ensure a turbulent regime within the reactor tubes.
  • A portable aeration pump with a flow of 1 L/min. Aeration was operated using a 30 min ON/30 min OFF algorithm.
  • A feed/recirculation vessel with a capacity of 2 L.
The membrane separation step was performed using a KMS Laboratory Cell—CF2 system (Koch Membranen GmbH, Rimsting, Germany) operating in tangential flow at a working pressure of 2.5 bar. The membrane module presents the following main characteristics: maximum operating volume: 600 mL; minimum operating volume: 50 mL; effective membrane surface: 28 cm2; maximum operation pressure (without nitrogen pressurisation): 6 bar.

3. Results and Discussion

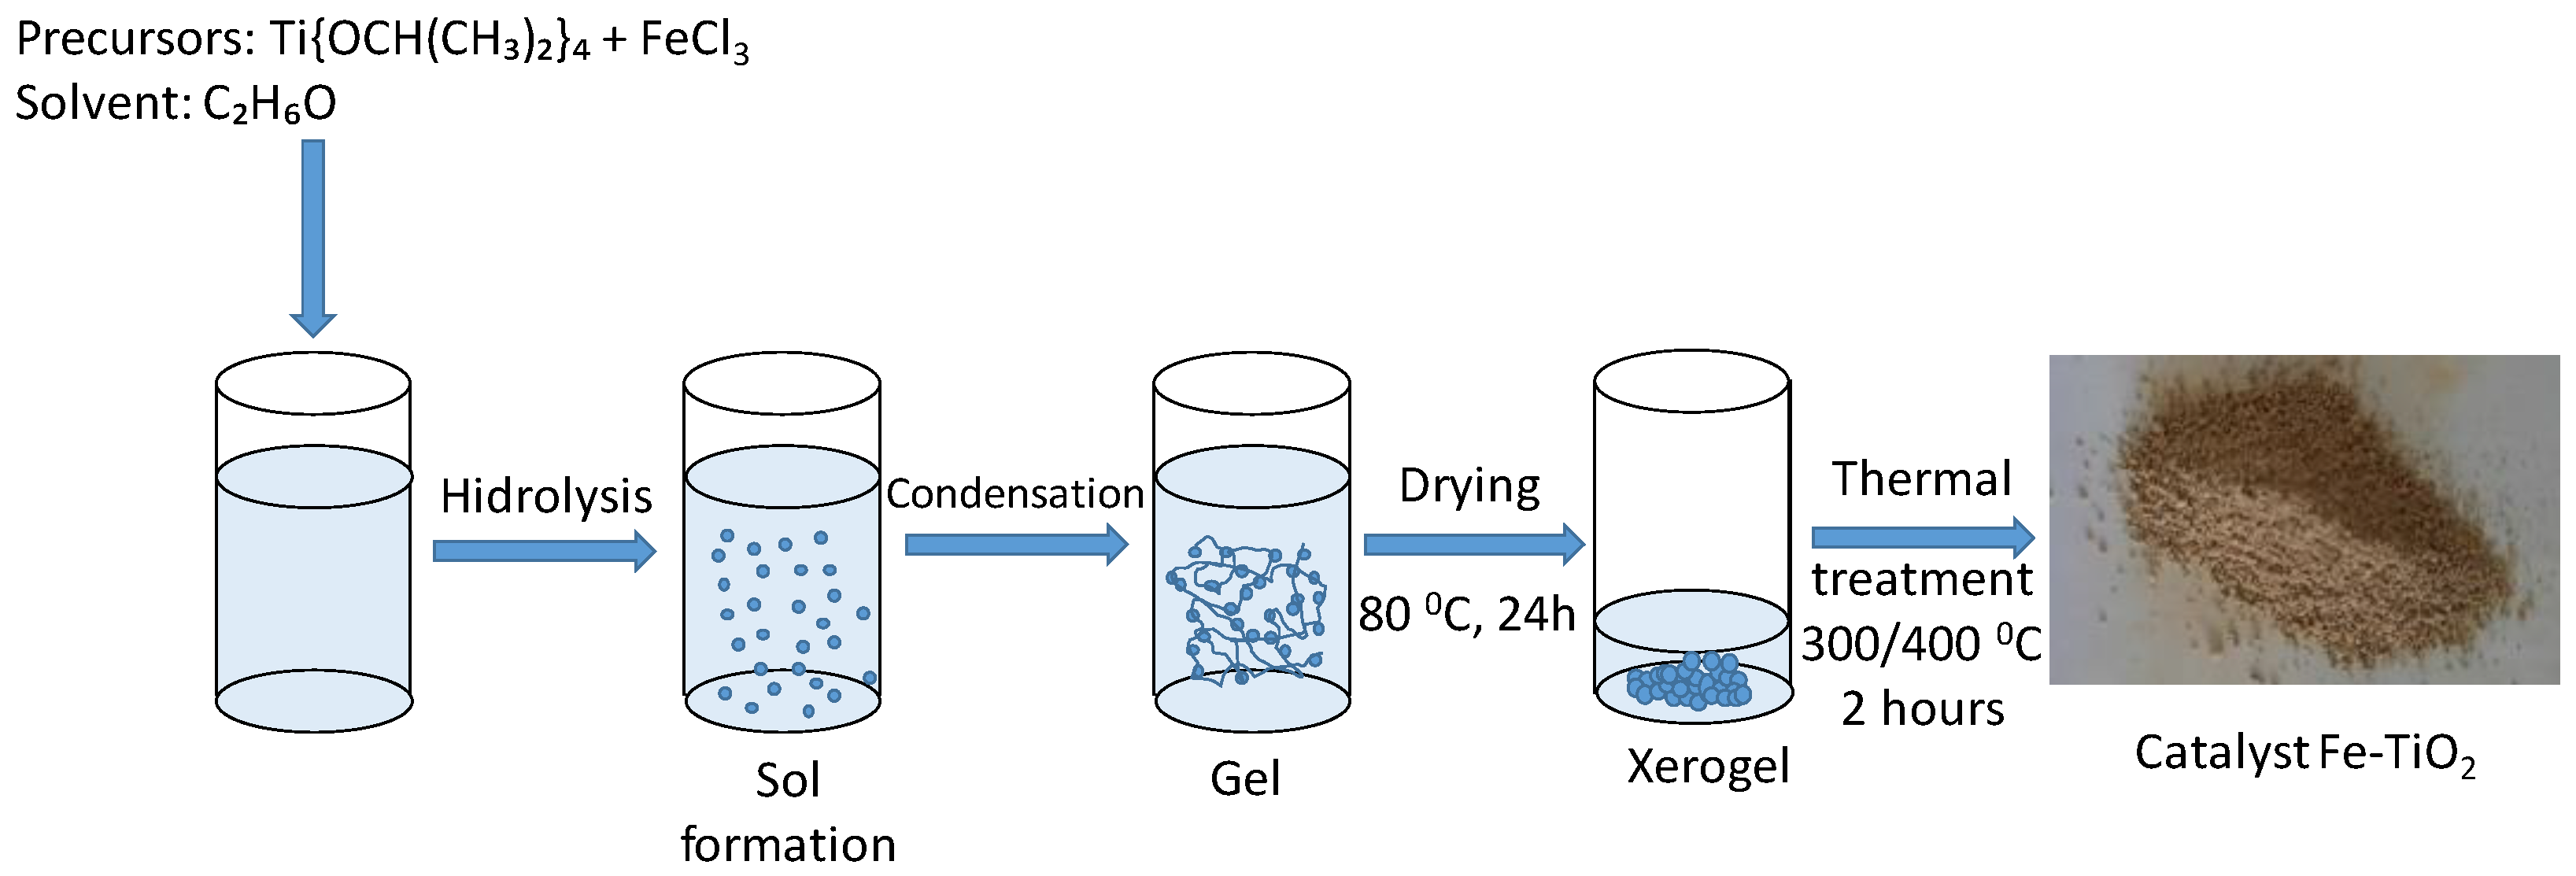
3.1. Photocatalyst Synthesis and Characterisation

Fe-doped TiO2 catalysts were synthesised using a well-known sol–gel method [23,24,26,27], following the steps presented in Figure 2.

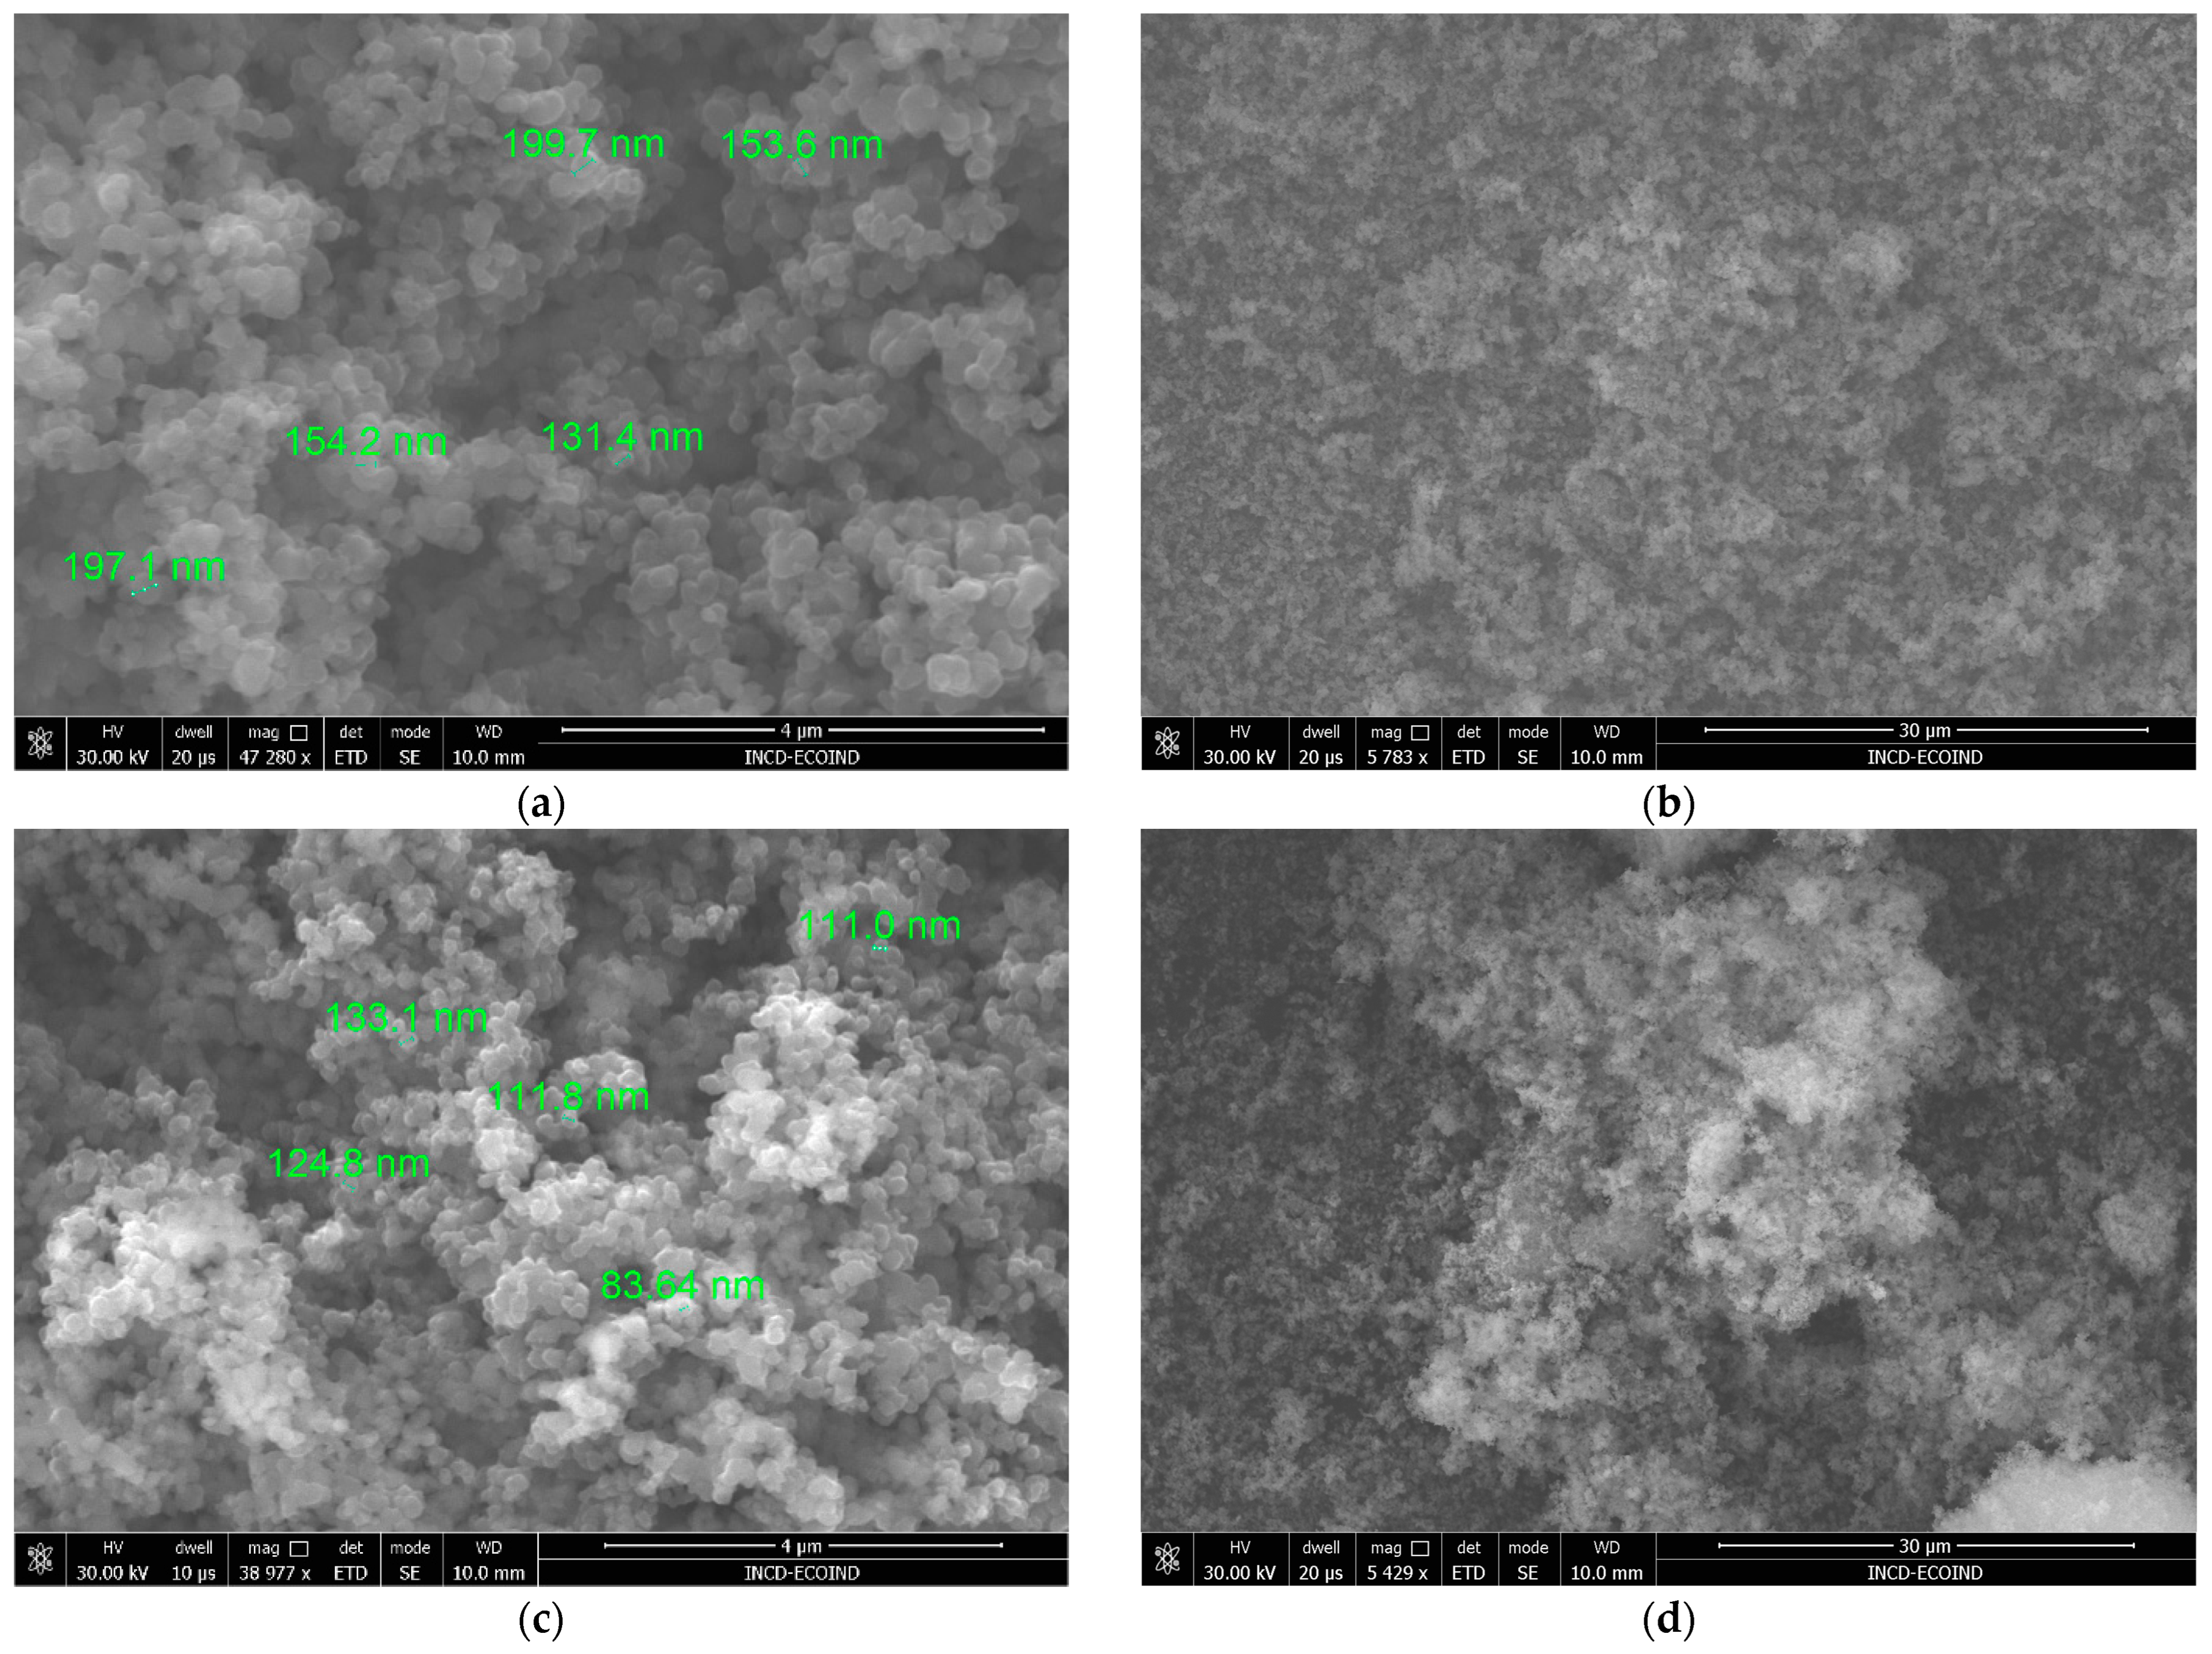
3.1.1. Scanning Electron Microscopy (SEM)

Morphological analysis of the catalyst powders revealed that the FT1 catalyst presents dimensions varying between 130 and 200 nm and that the FT2 particles have dimensions in the range of 80–135 nm (Figure 3). These results agree with the outcomes of other studies, which have shown that increasing the thermal treatment temperature results in smaller particle dimensions [23,26,27].

3.1.2. Dimensional Analyses of Fe–TiO2 Catalysts

Dimensional analysis of the prepared catalyst showed that FT1 and FT2 have similar particle size distributions (Figure 4) with the following values: d(0.1) = 177 nm, d(0.5) = 332 nm, and d(0.9) = 640 nm for FT1, and d(0.1) = 177 nm, d(0.5) = 332 nm, and d(0.9) = 633 nm for FT2. On the other hand, the specific surface area is slightly higher for FT1 compared with that of FT2.

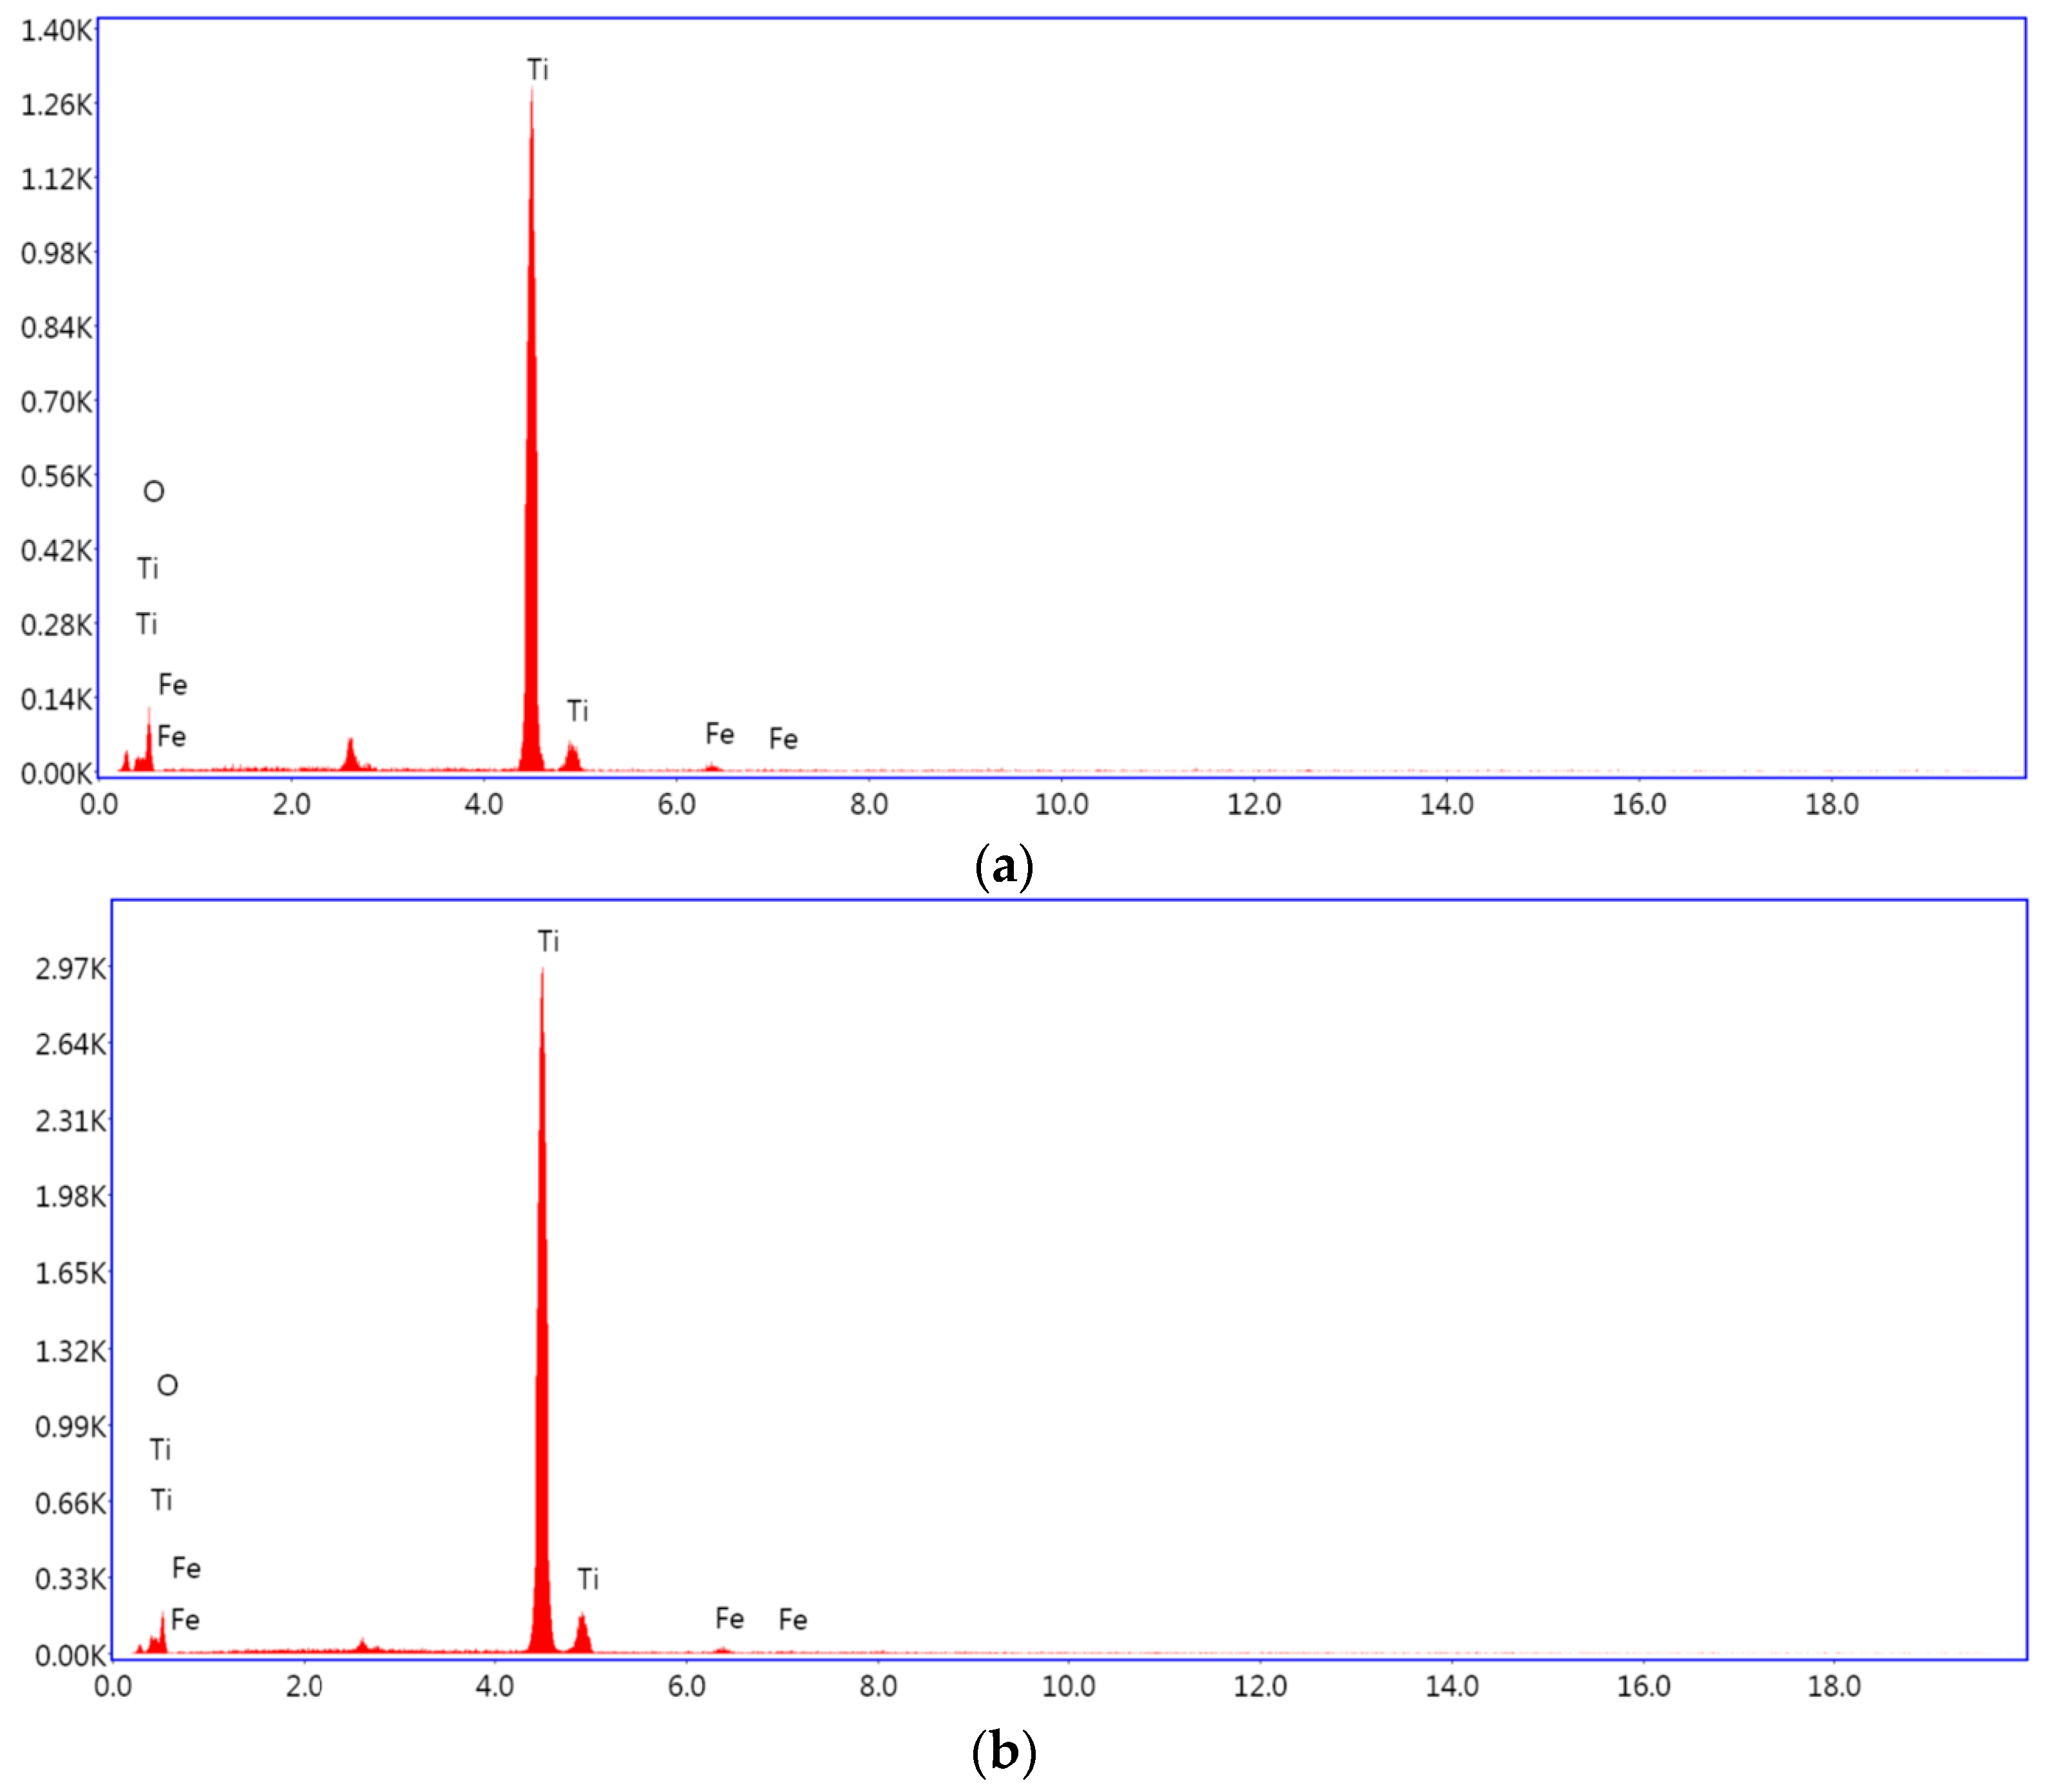
3.1.3. Energy-Dispersive X-ray Spectroscopy (EDX)

EDX analysis confirmed the presence of Fe within the catalyst structure (Figure 5) with a weight percentage of about 1% compared with that of TiO2 (see Table 1). The atomic percentages also confirm the Ti/O ratio of about 1 to 2 (Table 1).

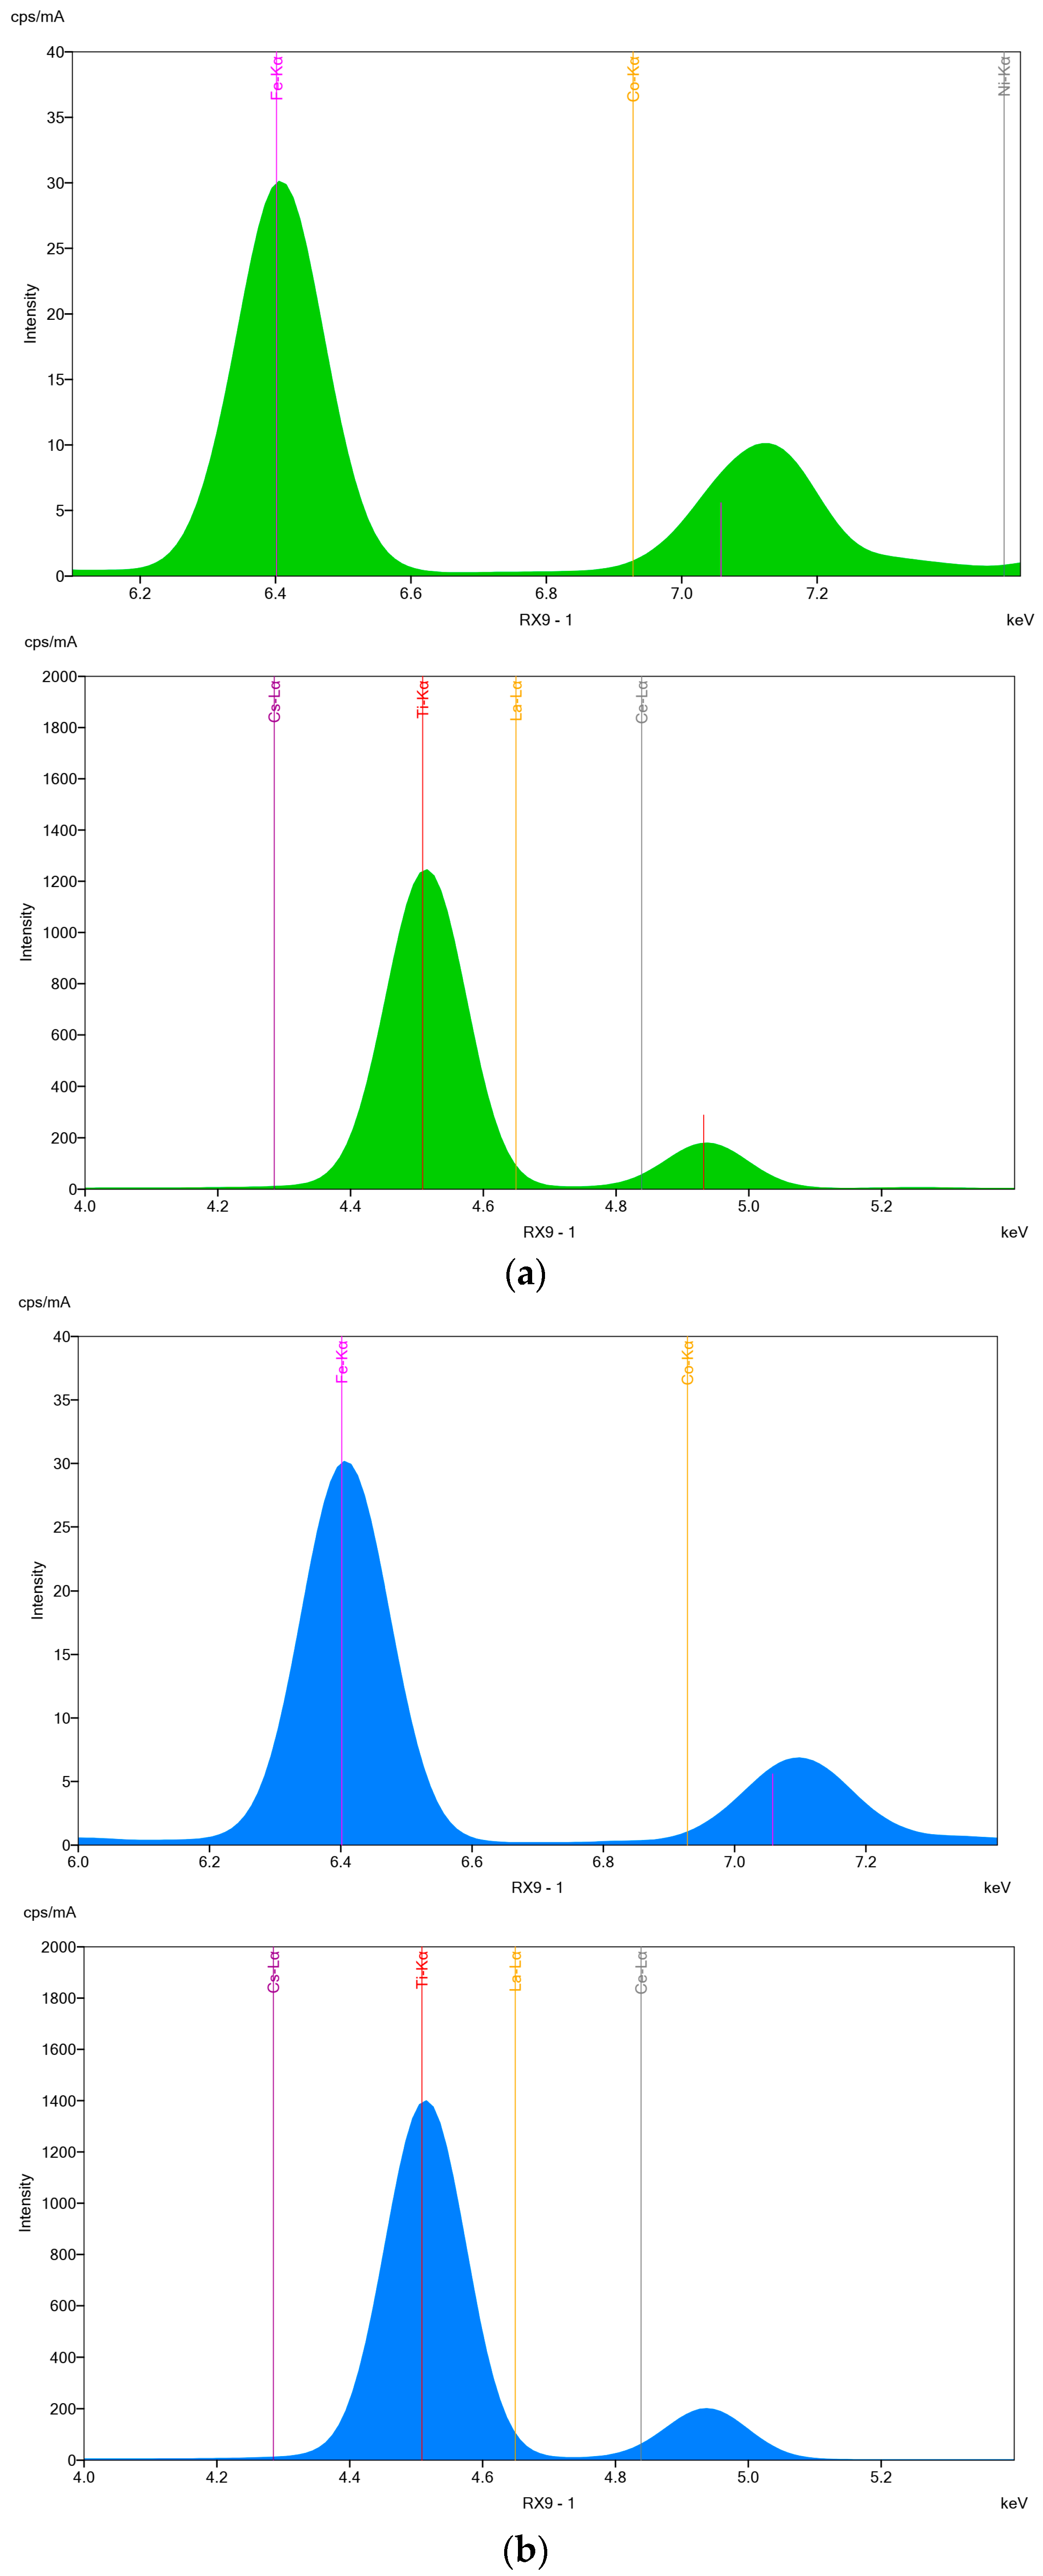
3.1.4. X-ray Fluorescence Analyses (XRF)

X-ray fluorescence analysis also confirmed the presence of the Fe dopant in the structure of the FT1 and FT2 catalysts (see Figure 6).

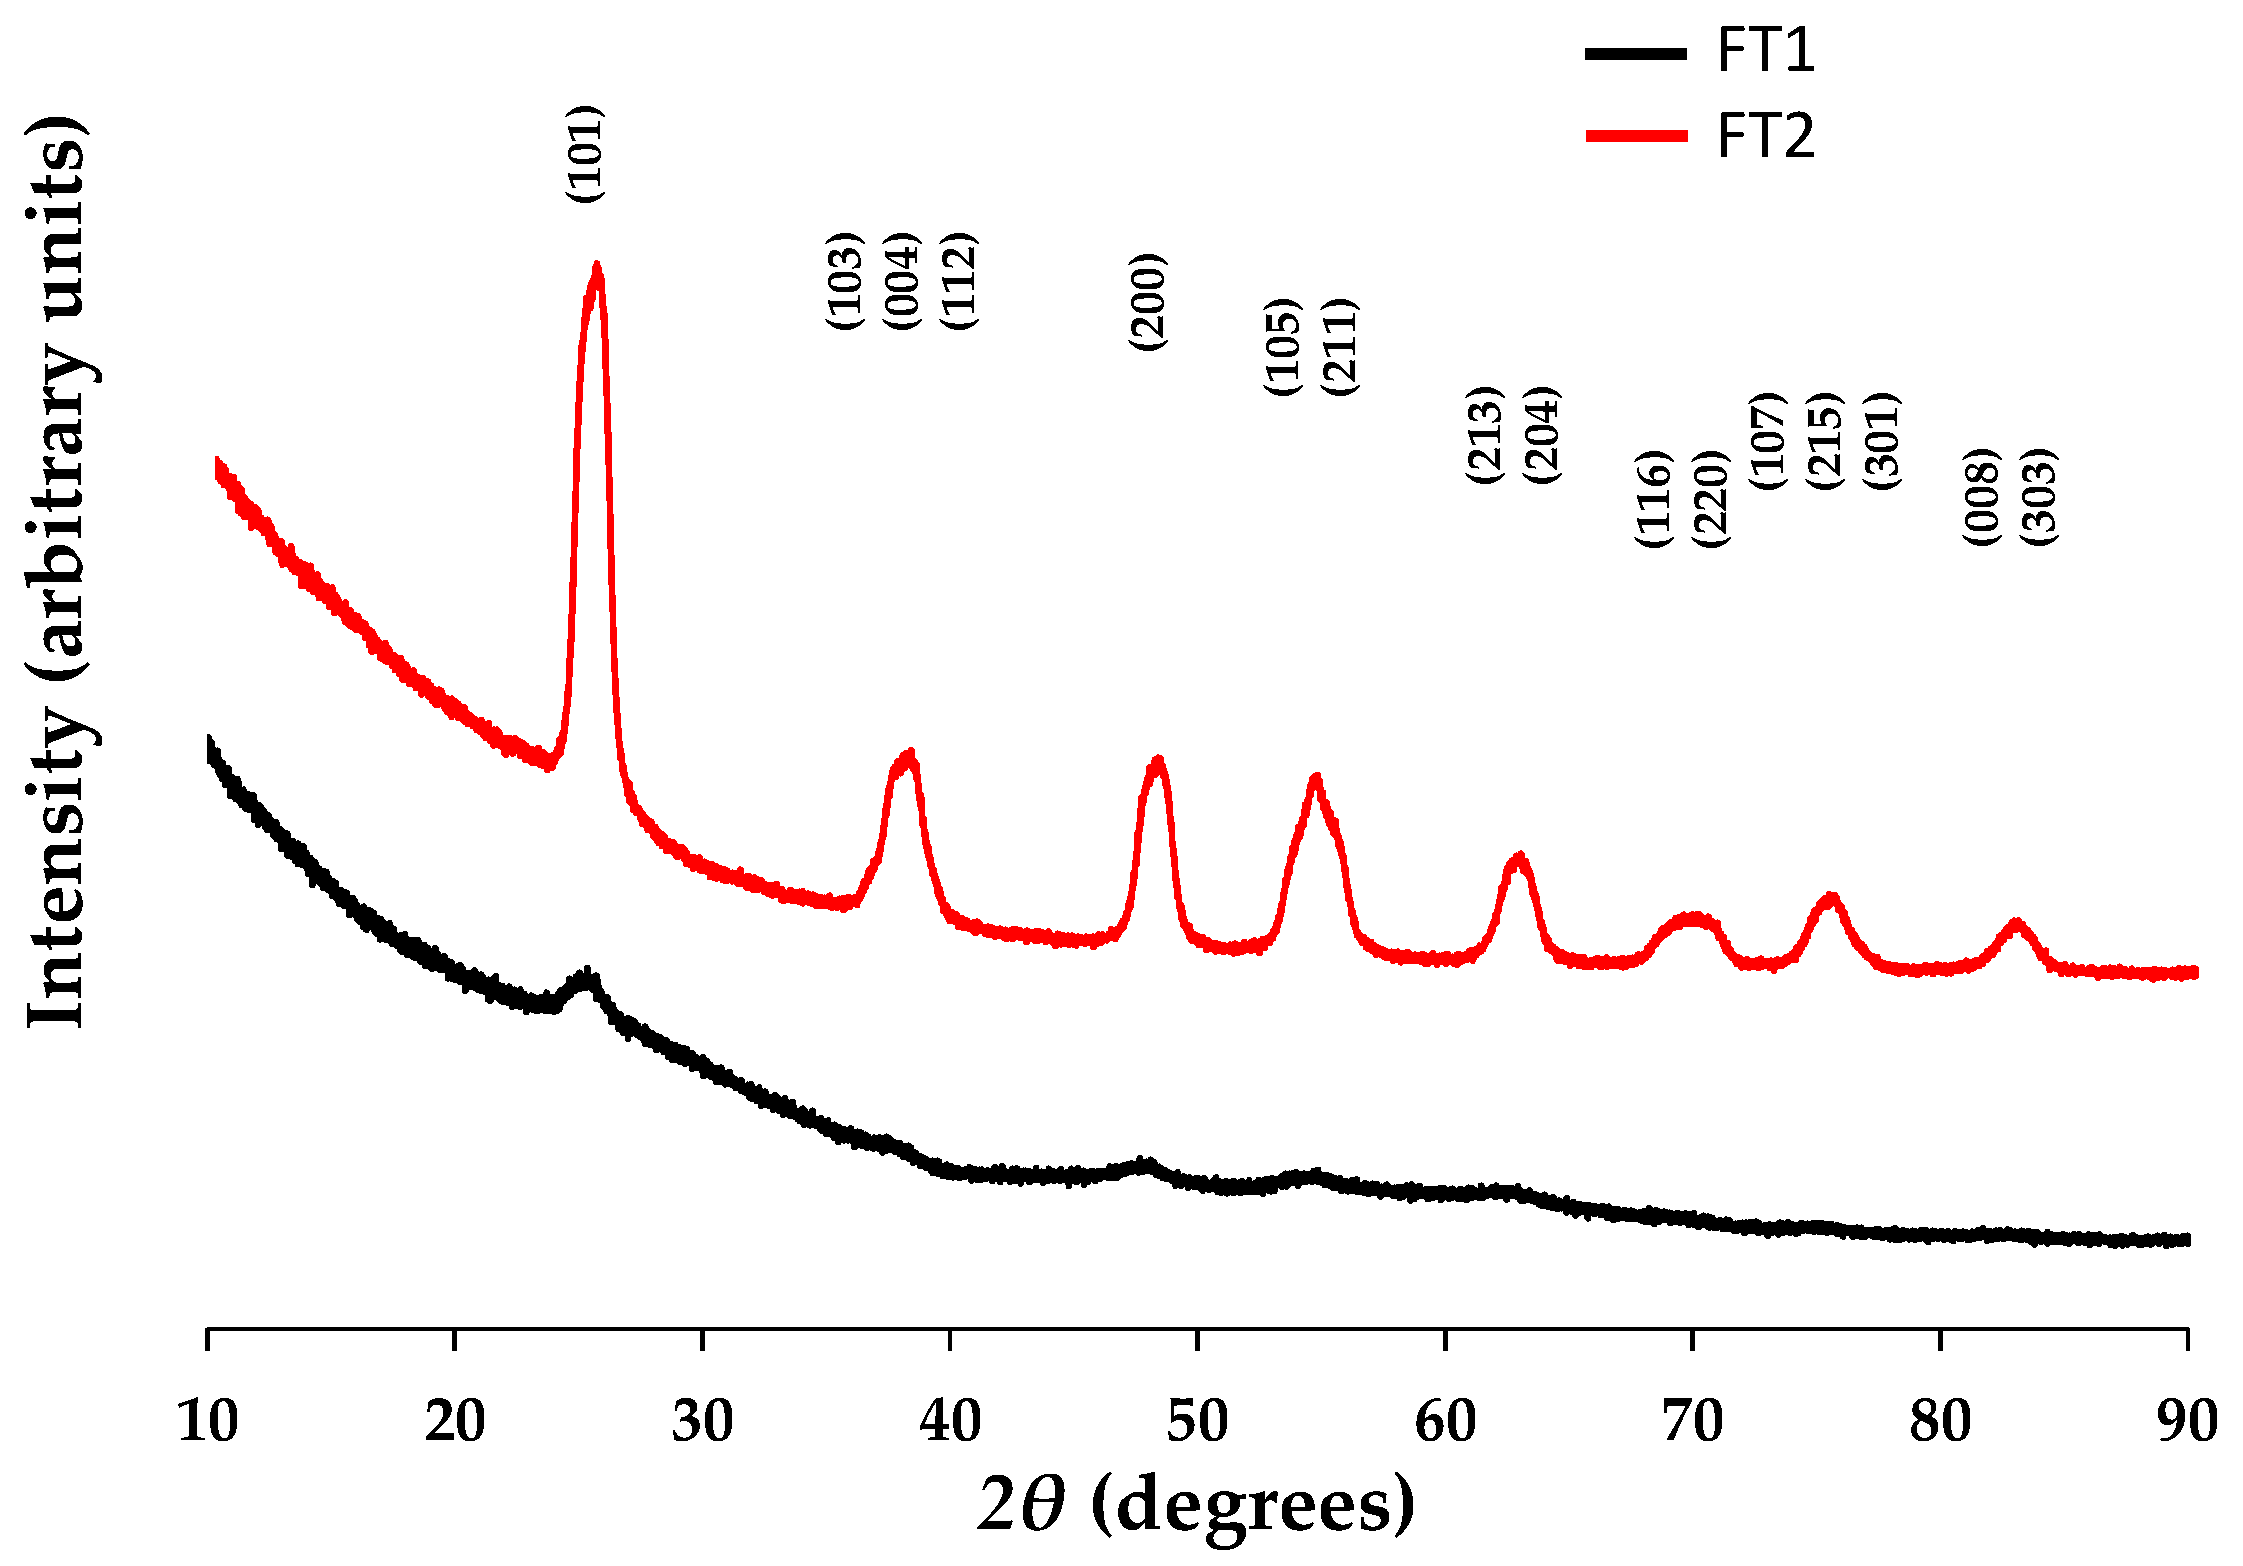
3.1.5. X-ray Diffraction (XRD)

The raw data from the XRD scans were transferred to PDXL software for Rietveld analysis. This method refines the crystal structure parameters by fitting a calculated pattern obtained from lattice parameters, crystal system, atomic coordinates, etc. to a measured diffraction pattern using the least squares method. Crystal models were built using information from ICDD, 00-064-0863 (TiO2—anatase), and 01-079-6031 (TiO2—rutile).
According to the shape of the X-ray patterns recorded for the catalyst (illustrated in Figure 7), it can be observed that the sample thermally treated at 300 °C seemed to develop an amorphous XRD structure. Samples with the same composition but annealed at 400 °C show a clear crystalline structure with the characteristic peaks of TiO2 anatase at two theta values around 25, 38, 48, 54, 63, 69, 75, and 82 degrees [23,24]. Increasing the annealing temperature from 300 to 400 °C promotes crystallisation, which is reflected in the appearance of sharper and well-defined diffraction peaks. For example, the characteristic peaks (1 0 3), (0 0 4), and (1 1 2) for the anatase phase, located close to 38 degrees, can only be observed for the catalyst treated at 400 °C (FT2).
Table 2 presents the microstructural data recorded as a result of the XRD analysis of the prepared catalysts. The XRD analysis showed that the recorded diffraction peaks were assigned to the tetragonal anatase phase of titanium dioxide with the space group indicated in Table 2. This can be considered, on the one hand, as a confirmation of the TiO2 anatase crystalline phase in all the synthesised samples, and, on the other hand, as a confirmation that, despite some microstructural changes (i.e., D spacings), the structure of the anatase titanium dioxide in the catalysts studied is maintained at both temperatures. Experiments showed a decrease in FWHM values with increasing synthesis temperature for all three peaks analysed. For instance, the FWHM value decreases from 7.41 degrees at 300 °C to 1.401 at 400 °C for the (2 0 0) peak (at 2θ of 48°), or from 5.23 degrees at 300 °C to 1.78 at 400 °C for the (0 0 4) peak. The peaks broadening correlate with crystallite dimensions below than 1000 Å.
Depending on the desired properties of the synthesised materials (i.e., catalytic activity, efficiency, etc.), this experimental finding may lead to the conclusion that the choice of thermal treatment temperature is essential to achieve the aimed functionalities. Thus, higher temperatures may result in better-organised microstructures, while lower temperatures may lead to materials with various defects (dislocations, vacancies, interstitials, substitutional, or others). It is worth mentioning that for crystallites smaller than 30 Å, the X-ray diffraction peaks become so broad and low that they are indistinguishable. However, from the perspective of ensuring the good contact of the catalyst with the reaction environment, smaller particle dimensions offer a higher contact surface, and thus synthesis at lower temperatures may be advantageous for the doped TiO2 compositions studied in the present research. Implicitly, the synthesis procedures may be closer to green chemistry principles.
On the other hand, when looking at the crystallite size evaluated via the Williams–Hall method (full XRD patterns) in Table 2, it can be observed that the average crystallite size values for samples synthesised at 400 °C are higher than those for the same situation at 300 °C. This is evidence that a higher annealing temperature is responsible for the crystallite size increase, suggesting an increase in lattice order [23].
It is important to note that the crystallite sizes of the Fe-doped TiO2 treated at both 300 °C and 400 °C were found to be lower than those of the commercial TiO2 catalysts used as reference material. However, these results contradict those obtained via scanning electron microscopy.

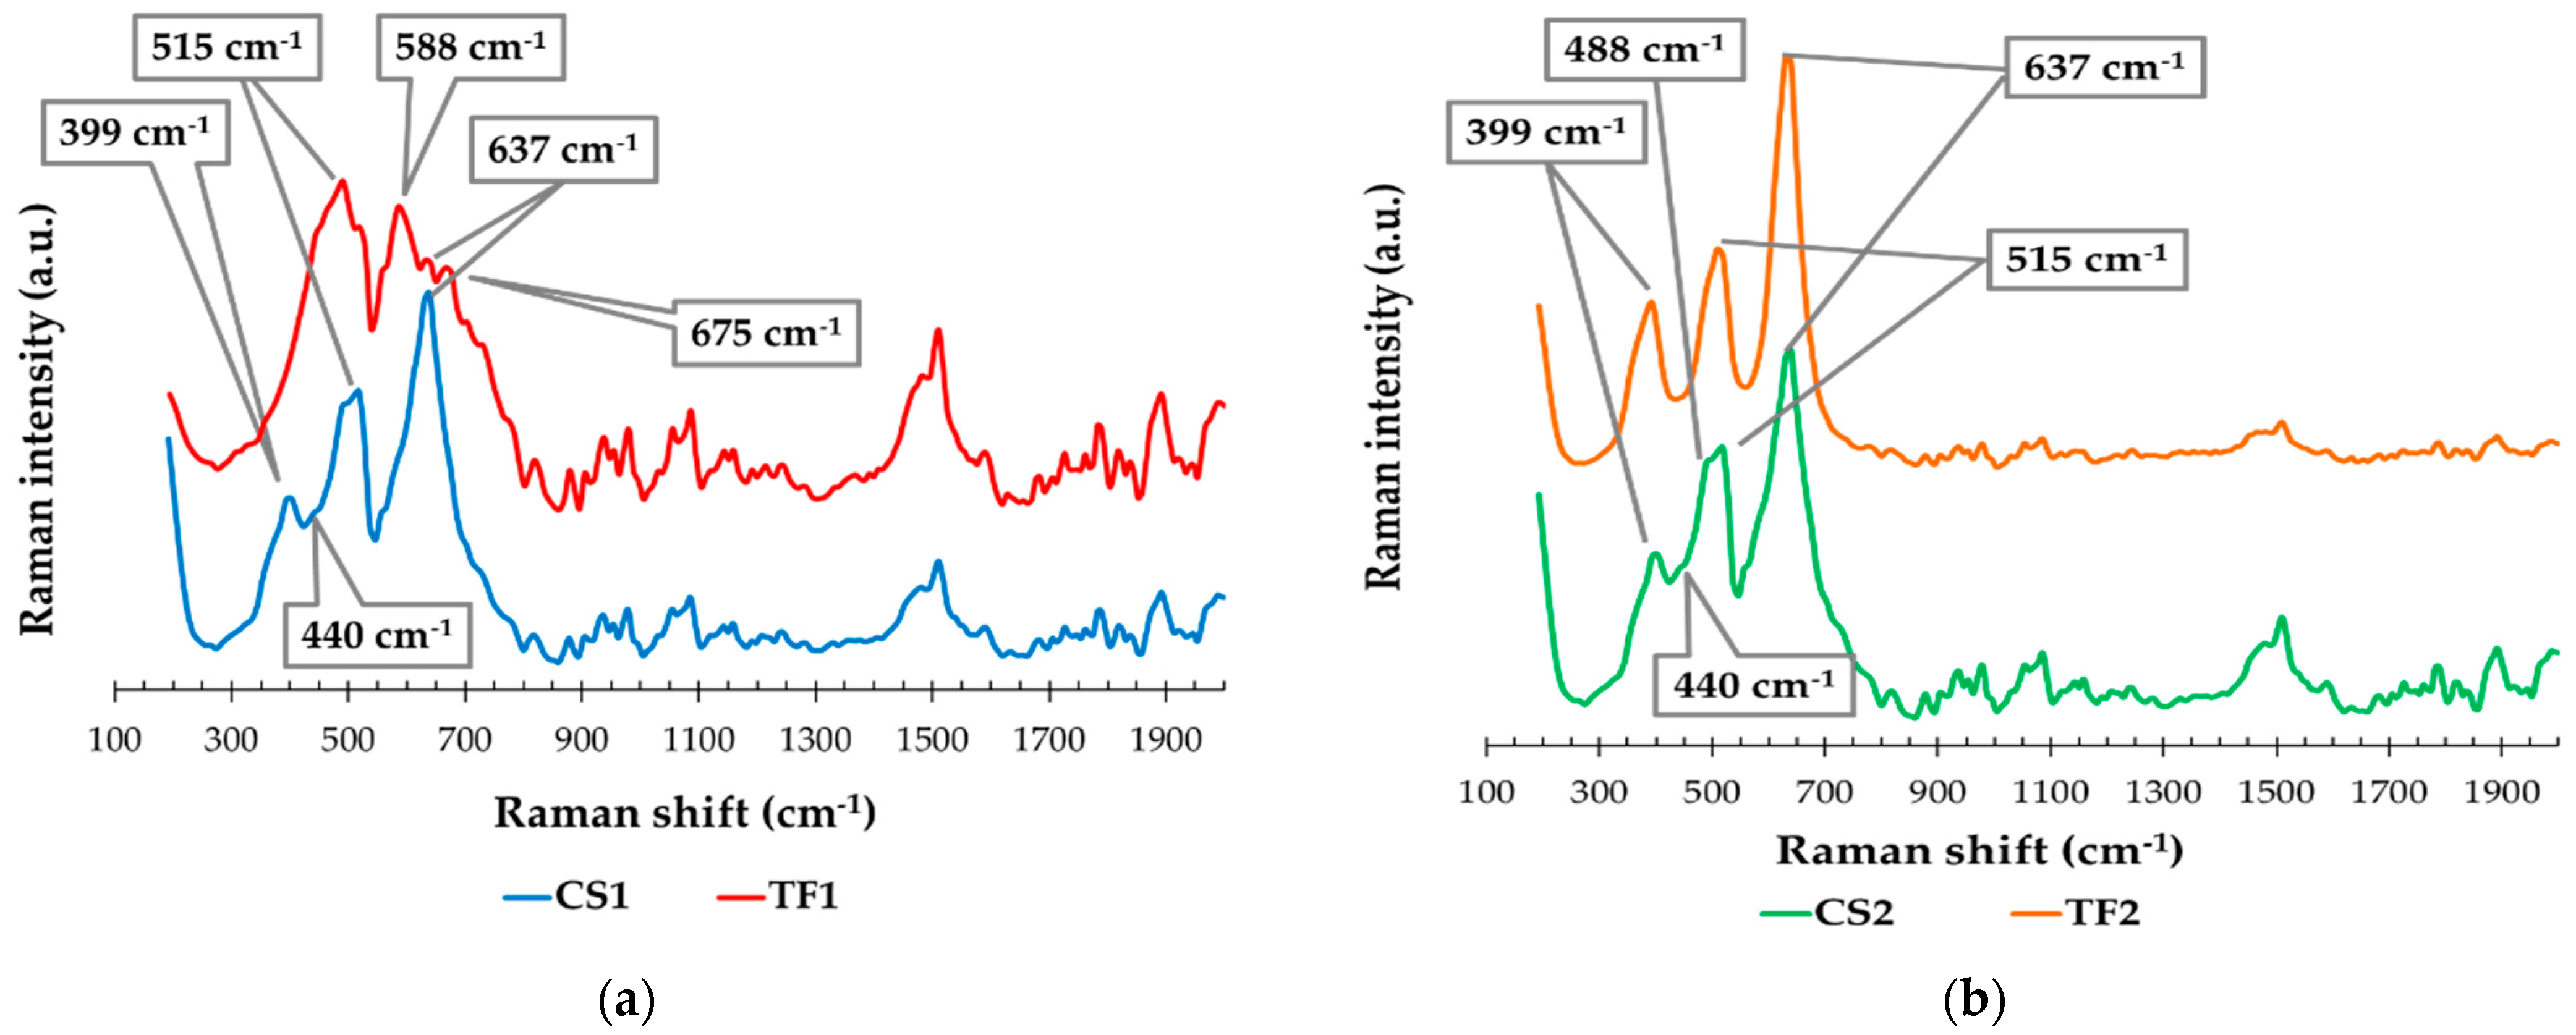
3.1.6. Raman Spectra

The Raman spectroscopy of TiO2 in its anatase form is a well-studied area given its significance in various applications, ranging from photocatalysis to solar cells [28]. Anatase TiO2 is known for its distinct Raman active modes, mainly due to its tetragonal crystal structure. In pristine anatase TiO2, the Raman spectrum typically exhibits several prominent peaks. The main peaks observed are at 399 cm1 (B1g mode), 519 cm1 (A1g mode), and 639 cm1 (Eg mode) (Figure 8). These modes are characteristic of the anatase phase and are related to the vibrations of the Ti–O bonds in the crystal lattice. Some changes in the Raman spectra of heated TiO2, particularly the splitting of bands in the 200–600 cm1 region, may indicate changes in the crystal structure or the presence of defects induced by the heating process. Heating can introduce oxygen vacancies and other defect sites into the crystal lattice, changing the local symmetry and potentially leading to the splitting or shifting of Raman bands. The splitting of bands could indicate changes in the local environment around the Ti atoms, possibly due to oxygen vacancies or interstitial defects. The Raman spectra of TiO2 can also be affected by particle size, especially as the particles approach nanoscale dimensions [28,29].
In addition to the vibrations highlighted in Table 3, another peak at 488 cm1 was noted in Figure 8b, which is only observed in the Raman spectrum of the control sample TiO2 heated to 400 °C, CS2. Moreover, the FT1 catalyst showed a distinct band at 588 cm1, which is not present in the Raman spectra of the other materials studied. This band may be related to structural defects in the material, probably caused by the presence of Fe, a phenomenon that was not recorded in the FT2 catalyst.

3.1.7. Fourier Transform Infrared Spectroscopy

Figure 9a,b present the infrared spectra of the Fe-doped TiO2 catalysts, FT1 and FT2, and compare them with control samples CS1 and CS2, represented by TiO2 nano-catalysts synthesised at temperatures of 300 °C and 400 °C, respectively. In addition, the comparison includes a reference sample of TiO2 anatase.
In these spectra, including details in the insets, characteristic peaks corresponding to the vibration of the Ti–O bond can be observed at 405 cm1, 430 cm1, and 642 cm1 [30]. Significant changes can also be seen in the spectra of samples FT1 and FT2. To facilitate an objective analysis of these changes, particularly for the characteristic peak at 405 cm1, absorbance values were calculated for each sample. These values were then divided against the absorbance value of the same peak in the TiO2 anatase reference sample, resulting in the absorbance ratios, which are compared and presented in Figure 9c. The resulting outcomes indicate a significant decrease in the intensity of the vibrational arms of the Ti–O bond when Fe was added to the TiO2 catalyst, in both cases at annealing temperatures of 300 °C and 400 °C.
Also, in Figure 9a,b, the specific peaks of the O–H stretching vibration and O–H bending vibrations can be observed at the wavenumbers indicated in the insets. Comparing the IR spectra of the CS1 and CS2 samples with those of the reference TiO2 anatase, it can be observed that the heating of the TiO2 catalyst samples, at both annealing temperatures studied, leads to a slight shift in the absorption maxima for the O–H characteristic peaks, together with a broadening of the band. These changes may indicate a reorganisation of the molecular structures of the materials upon heating, with effects on the atomic arrangements and, consequently, on the number and organisation of the hydrogen bonds formed in the catalyst structures. For Fe-doped TiO2 catalyst samples FT1 and FT2, the same effect (even stronger) of peak shifts and peak broadening can be observed for the O–H characteristic infrared peaks.
Figure 9d shows a comparison of the absorbance ratios calculated for the studied samples, reference TiO2 anatase, control samples with TiO2 synthesised at 300 °C and 400 °C (CS1 and CS2), and Fe-doped TiO2 (FT1 and FT2), by dividing the O–H stretching peak wavenumber by the O–H bending vibration peak. The recorded results highlight that the absorbance ratio decreased significantly for the Fe-doped TiO2 catalysts. This experimental observation is correlated with a visible broadening of the O–H stretching and O–H bending bands in these samples compared with the TiO2 anatase reference.

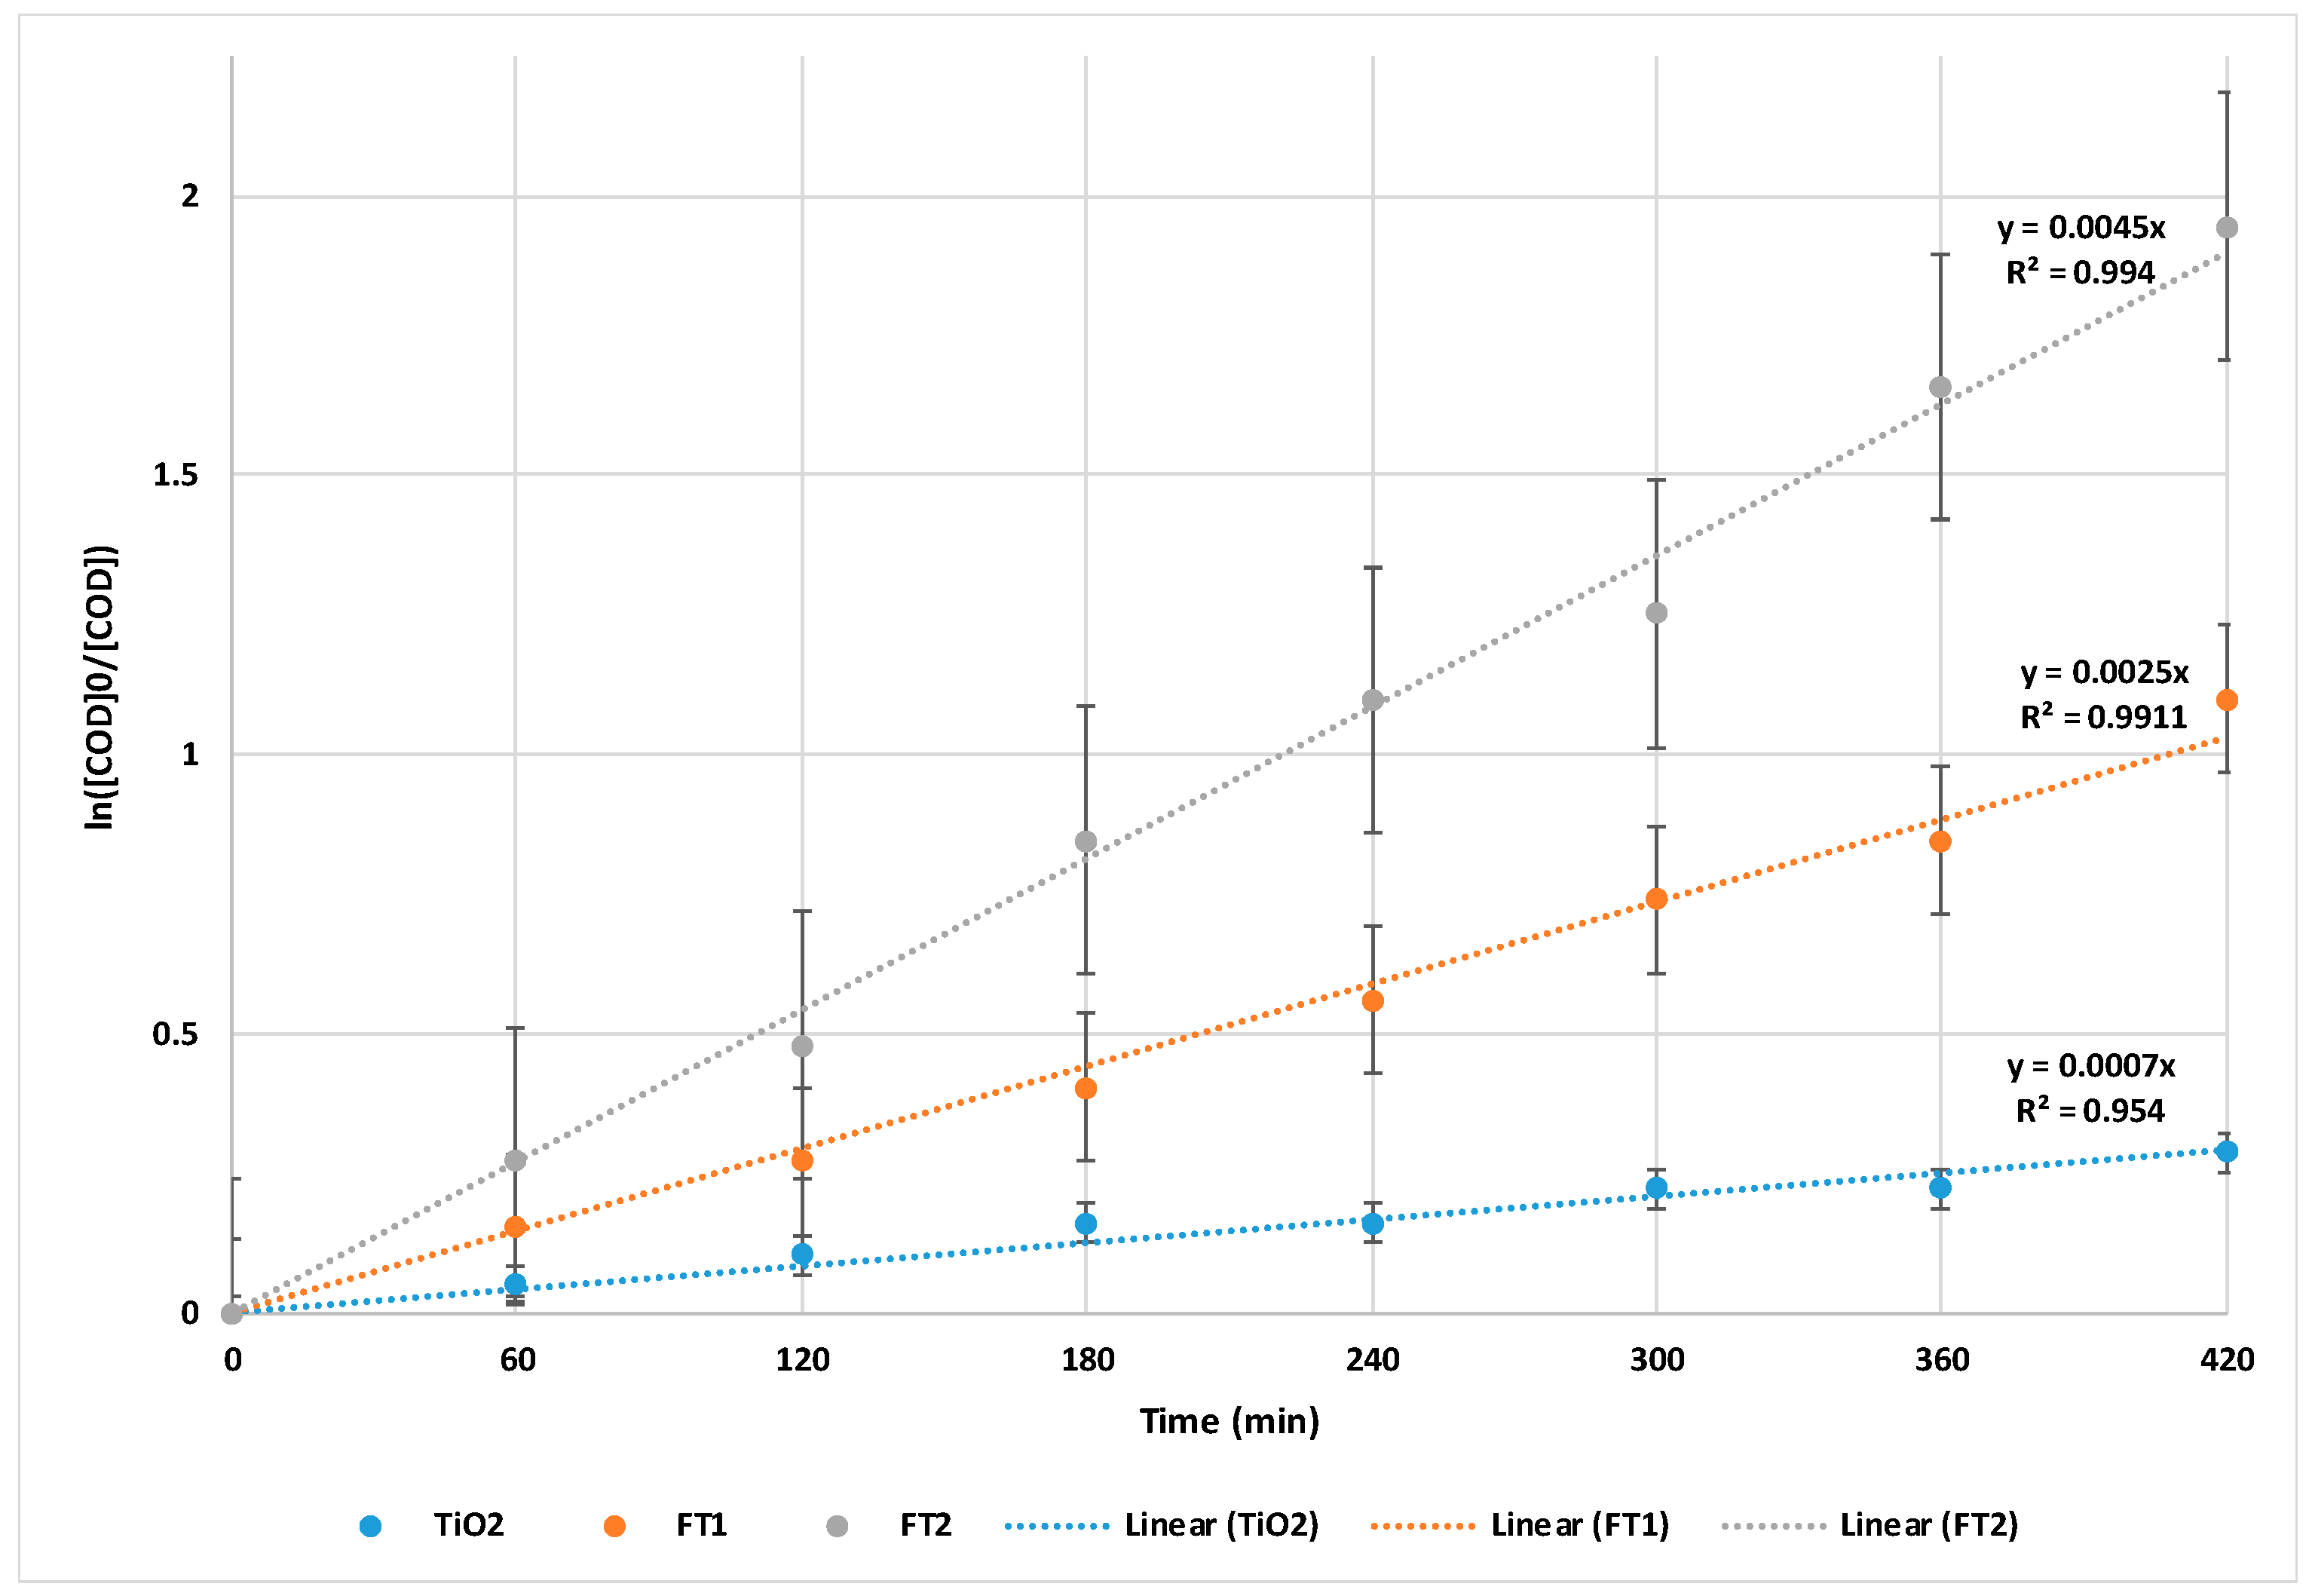
3.2. Experimental Photodegradation Tests

The photocatalytic activity of the prepared photocatalysts was evaluated using both natural and simulated solar light and is expressed as COD removal efficiency, with organic loading analysed in accordance with the standard SR ISO 6060:1996 [31]. The presence of an iron dopant increases the photocatalytic activity of titanium dioxide.
Experimental tests were performed using real wastewater sampled from a municipal wastewater treatment plant and stored at 4 ± 1 °C until use. The initial COD of the influent wastewater was in the range of 167.2–193.6 mgO2/L. For all tests, the irradiation period was kept constant at 7 h (from 9 a.m. to 4 p.m.). The irradiated wastewater samples were analysed for COD determination over 1 h (seven samples per degradation test). The initial photocatalyst concentration was kept constant at 100 mg/L for all degradation experiments.
Since the photocatalytic degradation of organic compounds was shown to follow a pseudo-first-order kinetic [26,27], COD degradation can be described by a first-order kinetic (Equation (1)), which can be linearised according to Equation (2):
C O D = C O D 0 × e k t
ln C O D 0 C O D = k t
where [COD]0 = initial COD of the wastewater sample; [COD] = COD of the wastewater sample at a given time; k = apparent kinetic rate constant of the first order reaction model; t = reaction (irradiation) time.
The following formula was used to calculate the ultrapure water and separation flows for the membrane process:
J = V S × T
where J = ultrapure water flow or separation flow; V = volume of ultrapure water or wastewater sample passing through the membrane; S = effective membrane area (in this particular case = 28 cm2); T = time in which V, volume, was collected.

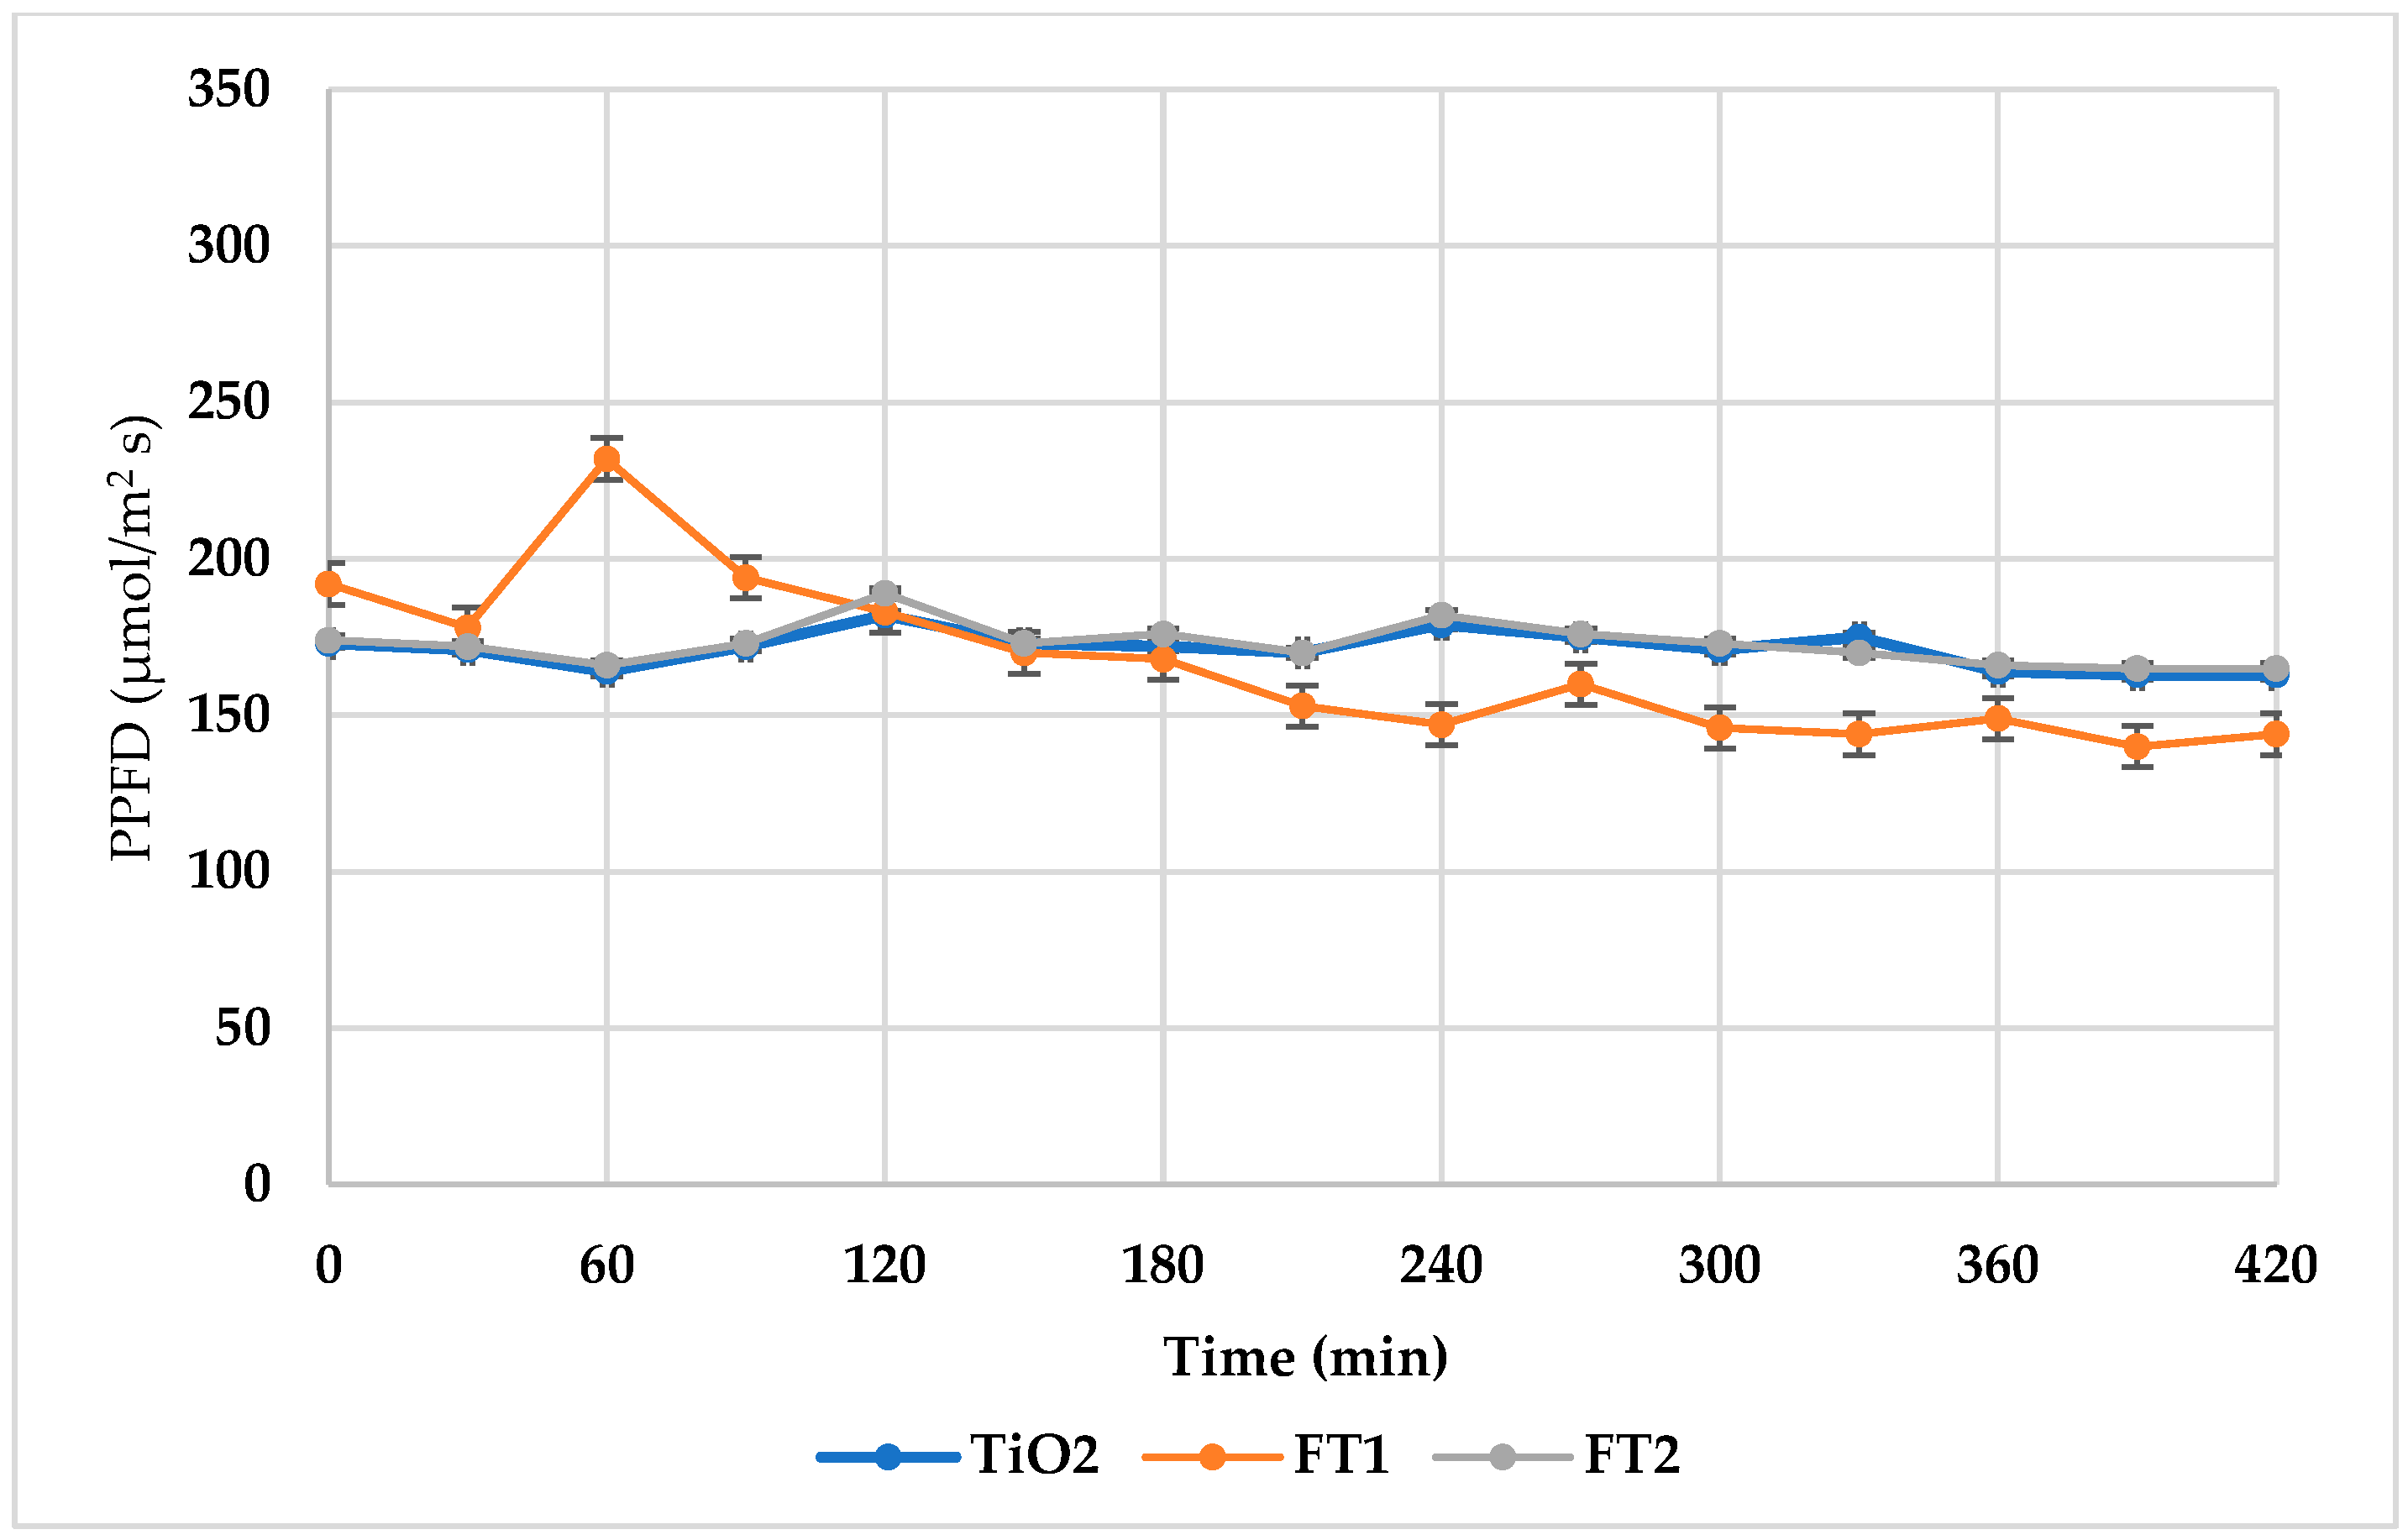
3.2.1. Experimental Photodegradation Tests Using Simulated Solar Light

Experiments were carried out over a period of 7 h. Samples were analysed in 1 h intervals, and the COD value of the outflow was recorded. Experiments were also performed with a commercial TiO2 anatase form as a reference for comparison with iron-doped catalysts. The initial catalyst concentration was kept constant at 100 mg/L for all degradation tests. PPFD (photosynthetic photon flux density) was monitored in half-hour intervals (presented in Figure 10). The initial COD concentration varied between 176 and 184.8 mg O2/L.
The iron-doped catalyst thermally treated at 400 °C—FT2—proved to achieve the highest COD removal efficiency (85.71%) after 7 h of irradiation compared with the FT1 sample (annealed at 300 °C), which achieved a COD removal efficiency of 66.67% (see Table 4). Both synthesised doped catalysts exhibit higher efficiencies compared with commercial TiO2, for which a COD removal efficiency of only 25.00% was reached after 7 h of irradiation. The results are in good correlation with previous research on the degradation of organic compounds using Fe-doped TiO2 catalysts [25].
This fact is also supported by the linearised pseudo-first-order kinetic equations concerning COD removal (presented in Figure 11). The pseudo-first-order rate constants for the simulated sunlight experiments were calculated from the slope of the linear plots (under Equations (1) and (2)) and varied in the following order: kFT2 = 7.50 × 10⁻⁵ s−1 > kFT1 = 4.17 × 10⁻⁵ s−1 > kTiO2 = 1.17 × 10⁻⁵ s−1.
It can be observed that both the apparent rate constant and the degradation efficiency increase with the increase in annealing temperature from 300 to 400 °C. This behaviour can be explained by the increase in crystallite size with temperature, resulting in more active sites available for degradation.

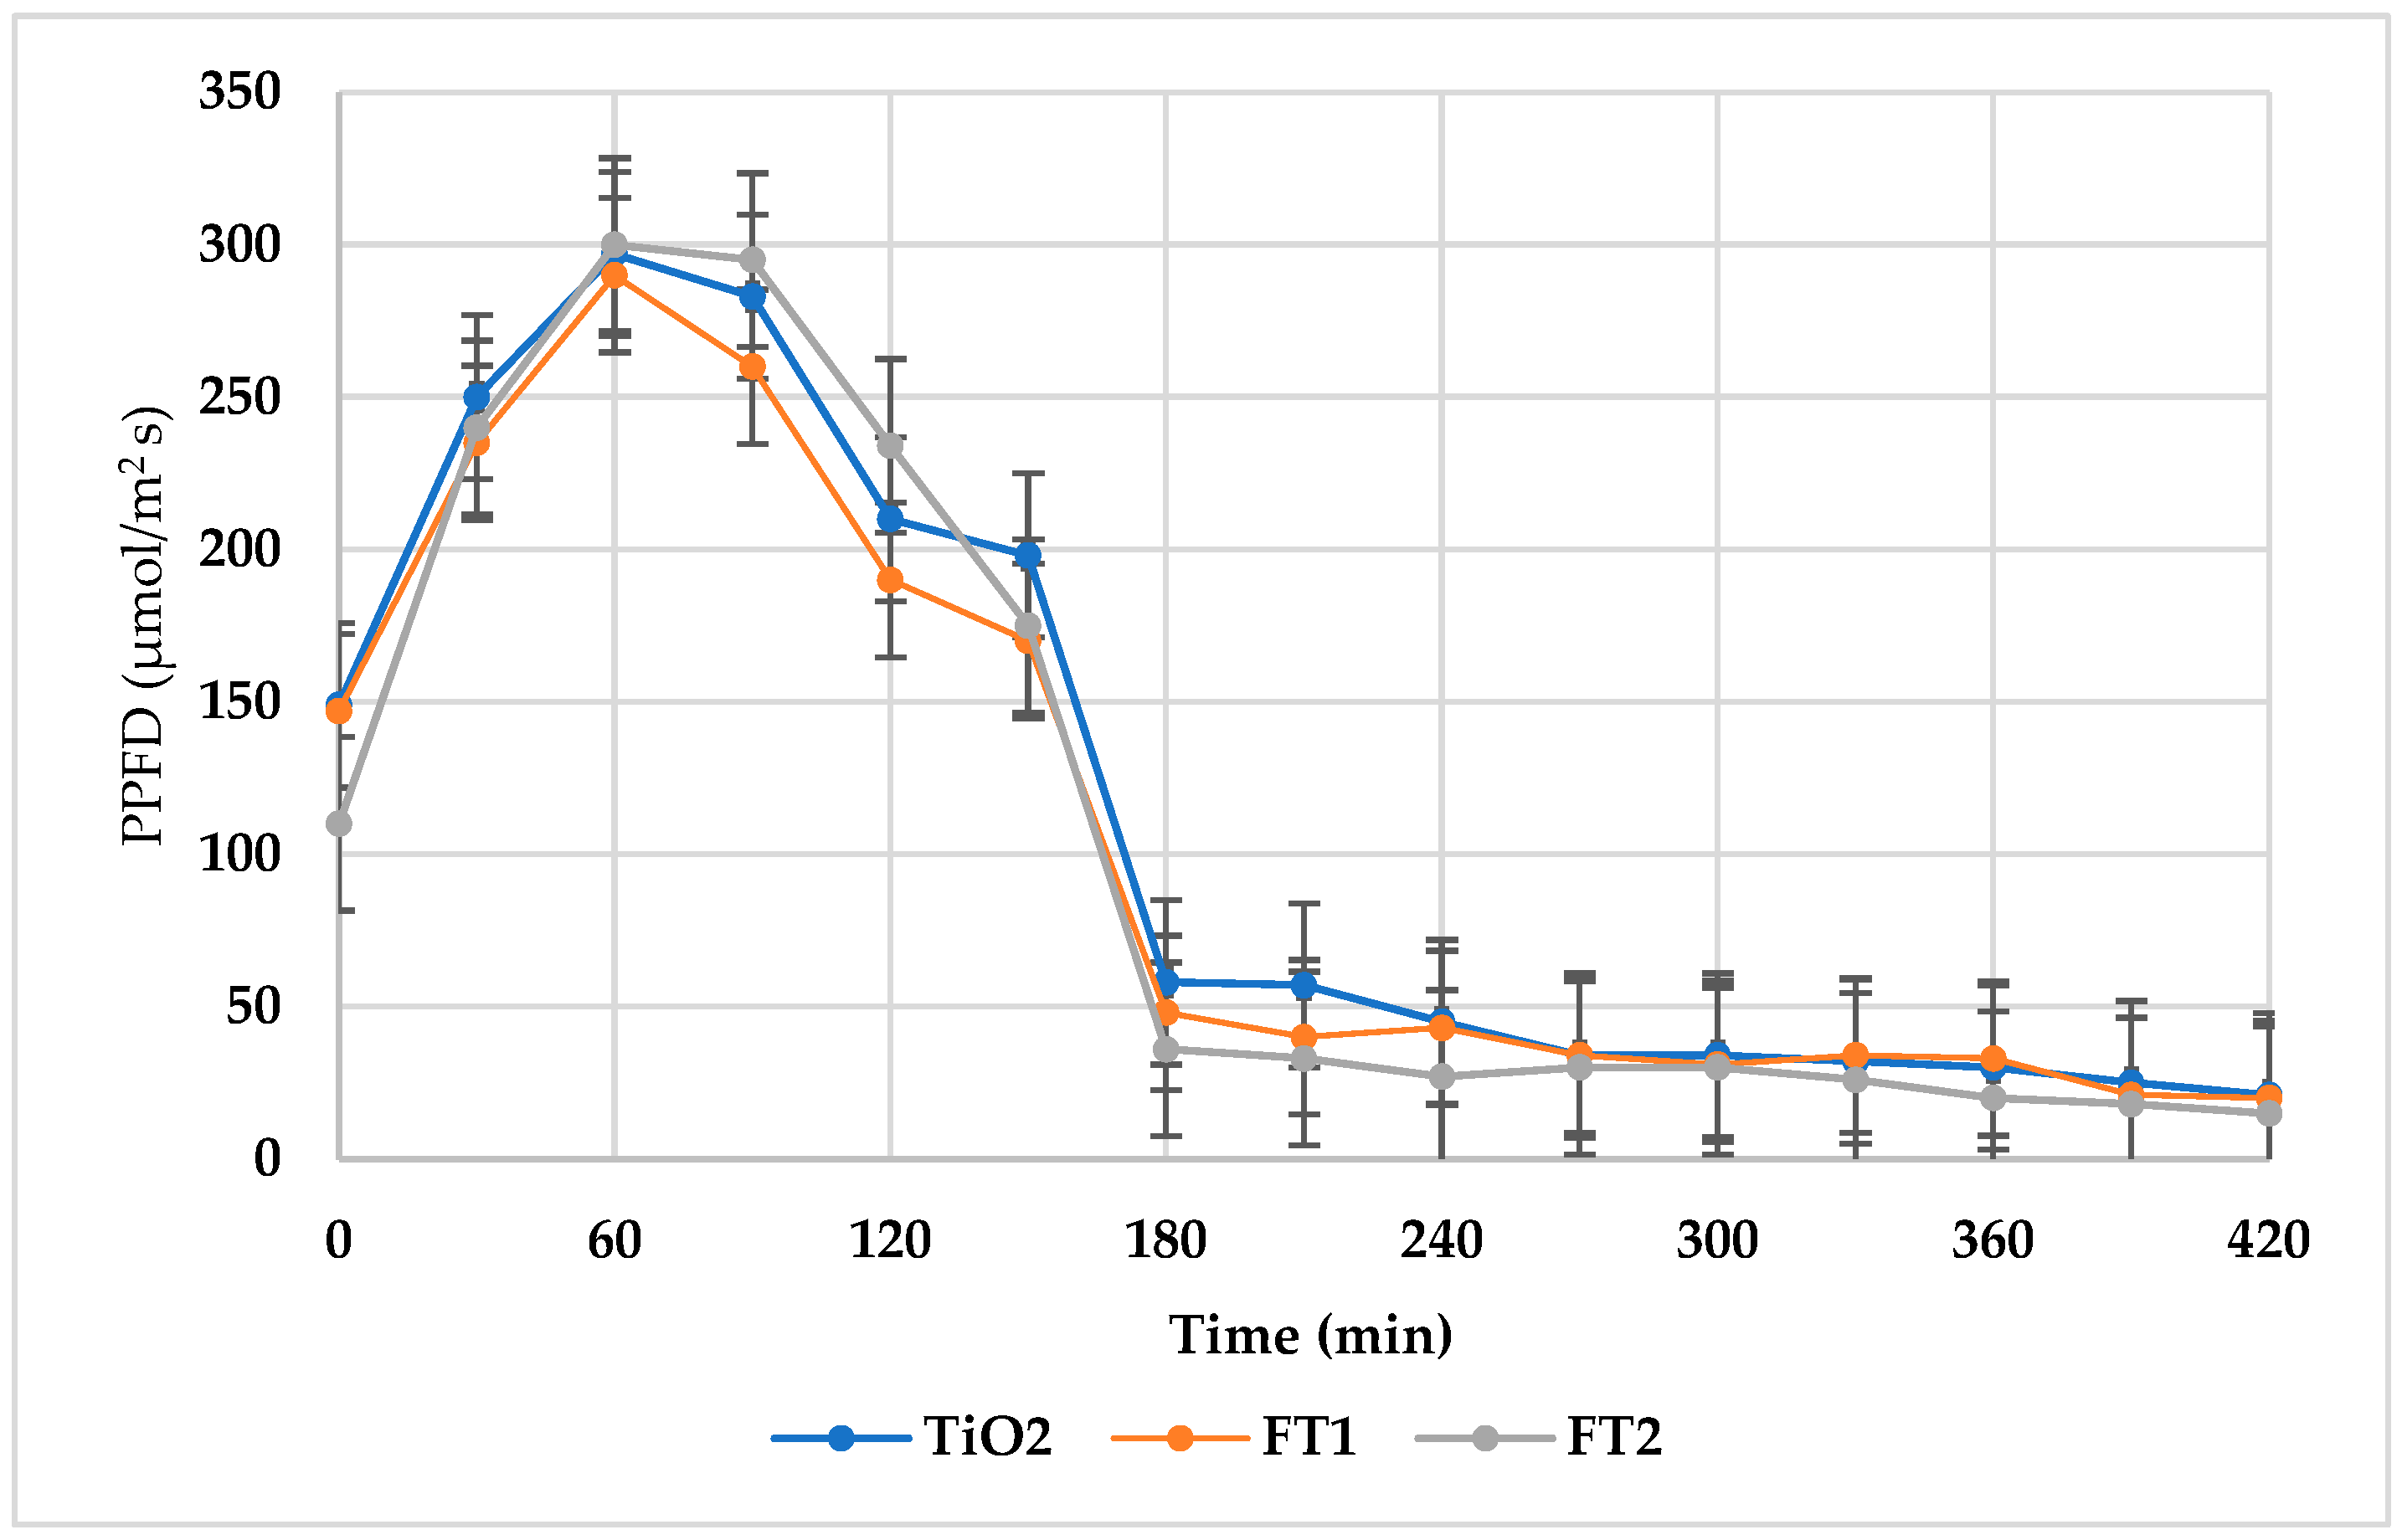
3.2.2. Experimental Photodegradation Tests Using Natural Solar Light

The experimental degradation tests were carried out under the same conditions as for simulated sunlight (samples analysed for COD at 1 h intervals, with an initial photocatalyst dose of 100 mg/L). As the experiments were performed in winter, the recorded PPFD varied considerably during the 7 h test period (Figure 12). However, the profile of PPFD versus time of day presented a similar pattern for all degradation tests. The initial COD concentration varied in the range 167.2–193.6 mg O2/L.
The best COD removal efficiency was also achieved by the FT2 catalyst with a value of 81.82% after 7 h of irradiation (close to that obtained using simulated solar light). The FT1 catalyst led to a COD removal efficiency of up to 52.63% (Table 5), while the use of commercial TiO2 resulted in a COD removal efficiency of only 21.05%. Linearised pseudo-first-order kinetic equations (following Equations (1) and (2)) also supported the fact that FT2 proved to be more efficient for COD removal compared with FT1 and TiO2 (presented in Figure 13).
The pseudo-first-order rate constants for the natural solar light experiments were calculated from the slope of the linear plots and were found to vary in the following order: kFT2 = 6.33 × 10⁻⁵ s−1 > kFT1 = 3.00 × 10⁻⁵ s−1 > kTiO2 = 1.00 × 10⁻⁵ s−1. Similar to what was observed in the simulated solar light experiments, both the apparent rate constant and the degradation efficiency increased as the annealing temperature increased from 300 °C to 400 °C.

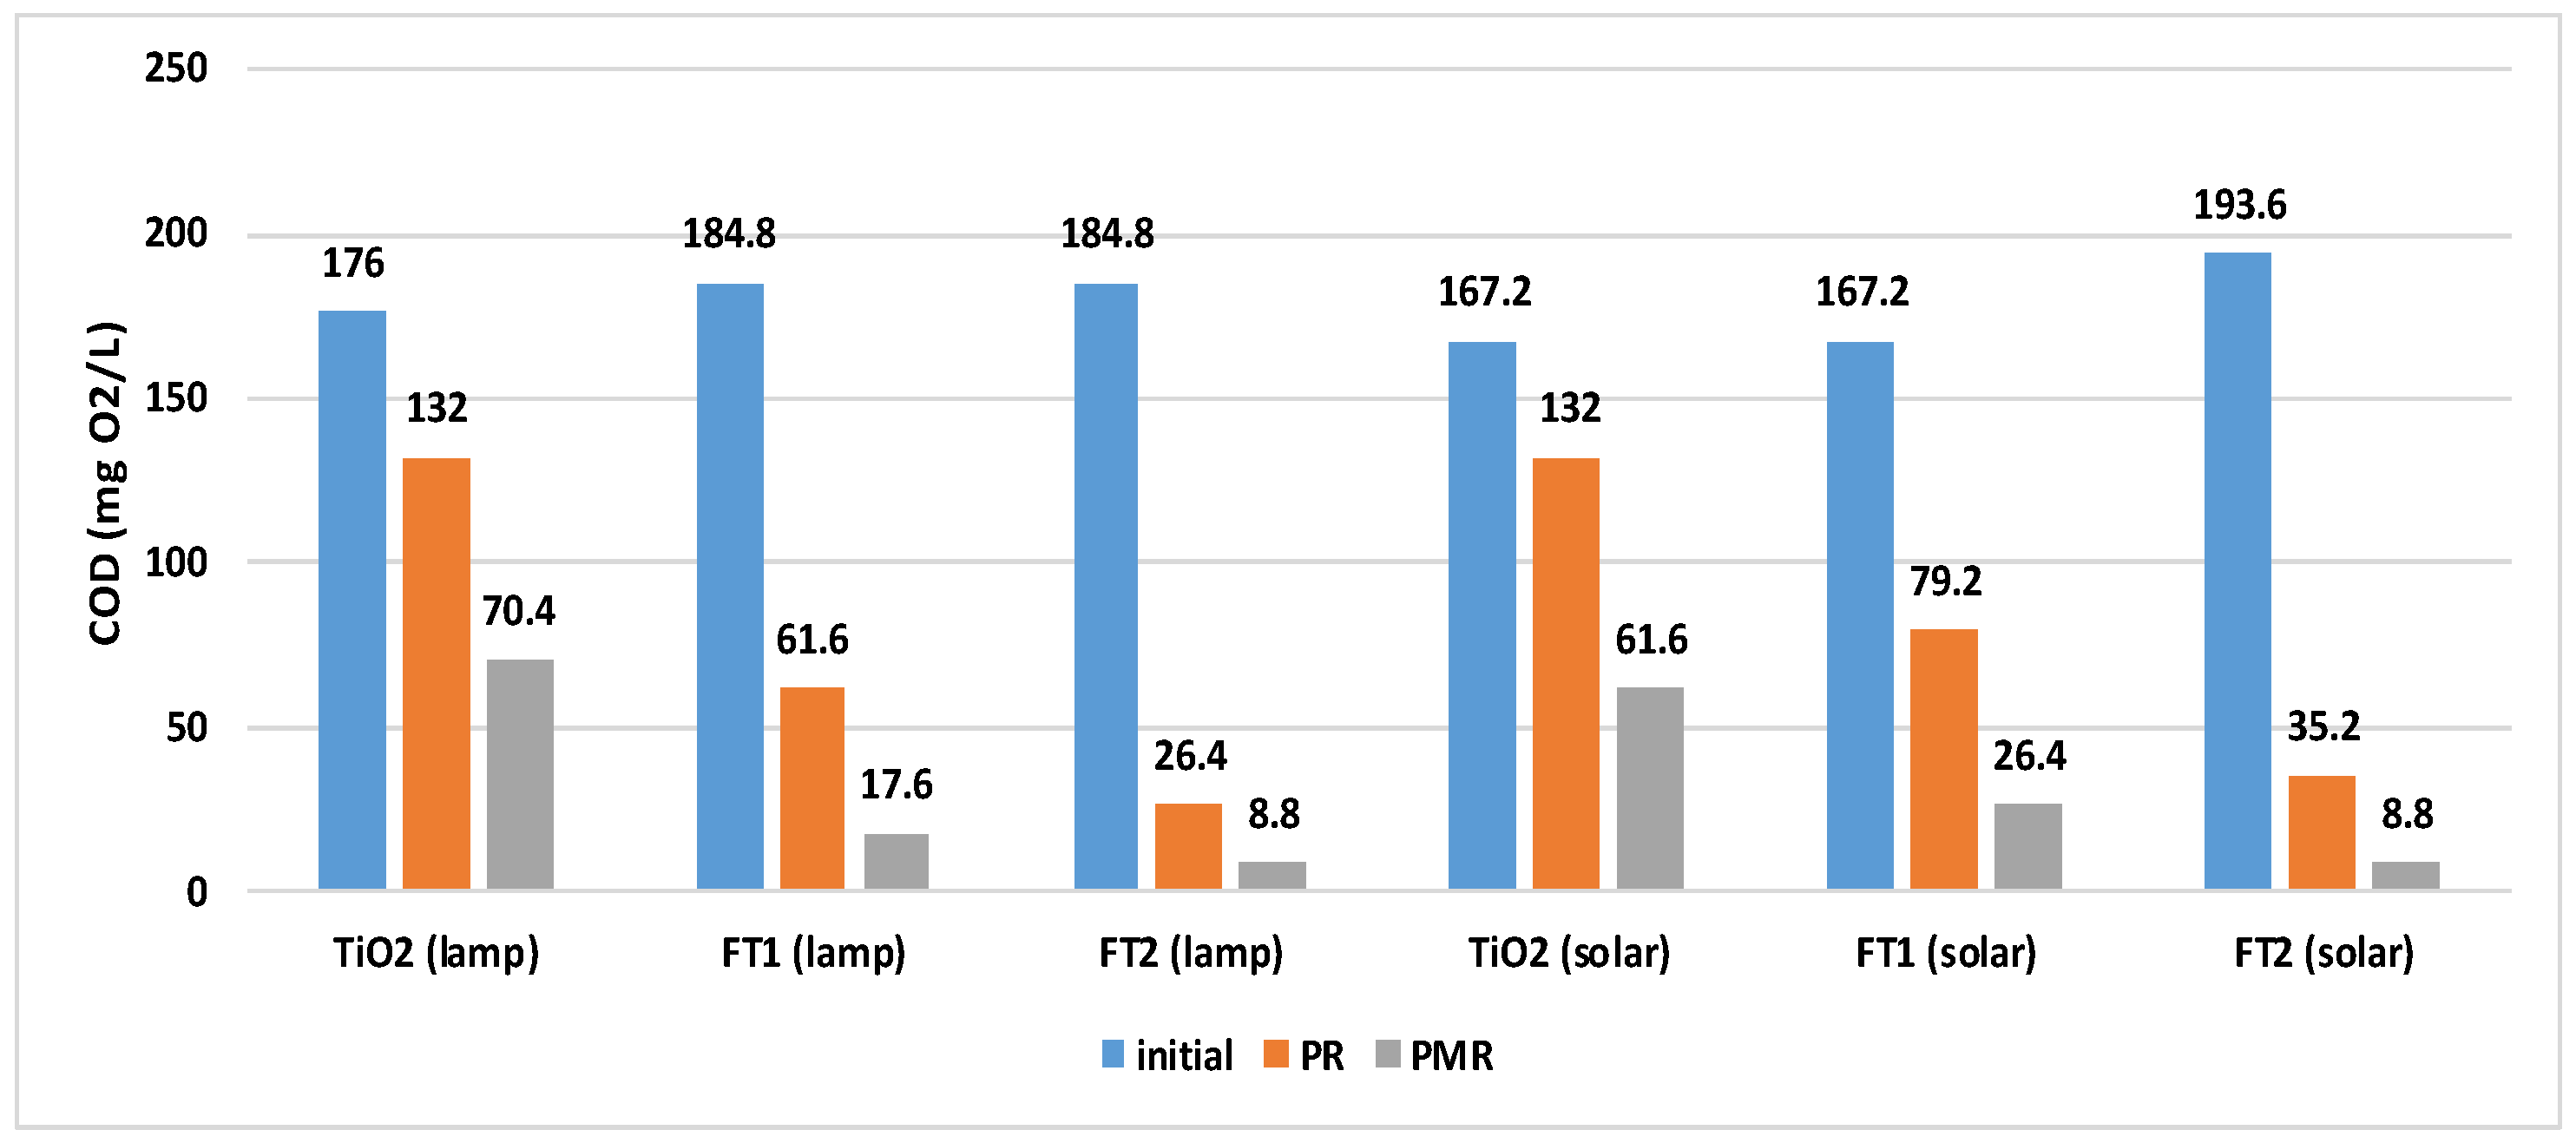
3.3. Overall COD Removal Efficiency of Solar PMR

The polymeric membrane used in all separation experiments was obtained from a 10% polysulfone (Psf) solution (see Figure 14).
The working pressure was maintained at 2.5 bar. All outflow volumes resulting from the photocatalytic step were subject to a membrane separation process at a concentration ratio of 1 to 2. Experimental results from the membrane separation step revealed that the membrane also acted as a barrier to organic compounds, with the overall COD removal efficiency reaching 95.24% (for the simulated solar light PMR) and 95.45% (for the solar-driven PMR), compared with 85.71% and 81.82%, respectively, when only the photocatalytic step was used. As expected, the best results were obtained for wastewater treated with the FT2 catalyst (residual COD = 8.8 mg O2/L). The FT1 catalyst also exhibited good results in terms of COD removal, reaching efficiencies of 90.48% (for simulated solar light) and 84.21% (for the solar-driven PMR) (see Table 6). The use of commercial TiO2 resulted in overall PMR COD removal efficiencies situated in the range of 60–64% (see Figure 15).
To assess membrane fouling, the ultrapure water flow rate was determined initially and after each separation flow (using Equation (3)), and the results obtained (presented in Figure 16) proved that the membrane could be used for at least six catalyst separation cycles, although membrane fouling was emphasised by the SEM images (Figure 17).
All the ultrapure water flows determined after the separations are in the range of 115–135 L/m2 h, with an overall difference of less than 16% and an average value of 124.43 L/m2 h.
On the other hand, all the separation flows were determined to be between 90 and 120 L/m2 h (with a total difference less than 25%; average value: 101.89 L/m2 h), proving that the photocatalytic step prolongs the membrane lifetime and avoids the issues related to membrane fouling.
It should be stressed that the overall COD removal efficiency is comparable to similar results obtained for solar-driven advanced oxidation, membrane-based, or hybrid processes that can be found in the literature [3,4,31,32,33,34] (see Table 7).
Therefore, the proposed hybrid PMR system using a visible active photocatalyst in A suspension-coupled and polymeric membrane process seems to be a viable alternative for the tertiary treatment of municipal wastewater, especially when the treated effluent is intended to be reused for various purposes.

4. Conclusions

A solar-driven slurry PMR using Fe-doped TiO2 photocatalysts and a 10% Psf membrane was tested for COD removal using real wastewater under both simulated and natural solar light.
Iron-doped titania catalysts were synthesised via the well-known sol–gel method and characterised via SEM, dimensional analysis, EDX, XRF, XRD, Raman spectroscopy, and FTIR. The Fe–TiO2 photocatalyst annealed at 400 °C was found to be more efficient than the one annealed at 300 °C. Both synthesised iron-doped titania photocatalysts exhibited improved photocatalytic performance compared with that of TiO2 for the degradation of organic compounds from real wastewater. The iron acceptance by the anatase lattice in the prepared catalysts was demonstrated by the catalyst characterisation analyses. Photodegradation experiments using real wastewater showed that the iron doping of TiO2 resulted in a higher efficiency and rate of degradation of organic compounds compared with those for commercial TiO2 (anatase form). A polymeric membrane was prepared using the phase inversion method, an immersion precipitation technique starting from a 10% Psf solution, and used in all separation experiments.
COD removal efficiencies reached values up to more than 95% under both simulated and natural solar light (for iron-doped titania catalyst annealed at 400 °C). The small difference between the COD removal efficiencies obtained under natural sunlight after the photocatalytic step (81.82%) compared with the COD removal efficiency obtained under simulated sunlight (85.71%) proved that solar PMRs represent a suitable alternative for the advanced removal of organic loads, especially in areas with longer daylight hours. On the other hand, the combination of solar photocatalysis with photovoltaics represents an attractive alternative to reduce process energy requirements. The photocatalytic step prevented membrane fouling after six catalyst separation cycles and also acted as a barrier to some organic compounds.
The experimental results proved that the slurry-type solar-driven PMR should be a suitable alternative for the tertiary treatment of municipal wastewater, but further tests on pilot PMR are needed to obtain data related to its sustainability compared with other processes already used in the tertiary step of wastewater treatment (especially for visible light-driven PMRs).

Author Contributions

Conceptualisation, M.A.C., L.A.C. and O.T.; methodology, M.A.C.; investigation, C.M.N., M.B. and I.A.I.; data curation, L.A.C.; writing—original draft preparation, O.T., M.A.C. and L.A.C.; supervision, M.A.C.; writing—revision O.T., L.A.C., M.A.C., C.M.N. and M.B. All authors have read and agreed to the published version of the manuscript.

Funding

This work was carried out under the Nucleu Program within the National Research Development and Innovation Plan 2022–2027 with the support of the Romanian Ministry of Research, Innovation and Digitalisation, contract no. 3N/2022, project code: PN 23 22 03 01 and PN 23 22 04 01.

Data Availability Statement

Data will be made available on request.

Conflicts of Interest

The authors declare no conflicts of interest.

References

  1. García, J.; García-Galán, M.J.; Day, J.W.; Boopathy, R.; White, J.R.; Wallace, S.; Hunter, R.G. A review of emerging organic contaminants (EOCs), antibiotic resistant bacteria (ARB), and antibiotic resistance genes (ARGs) in the environment: Increasing removal with wetlands and reducing environmental impacts. Bioresour. Technol. 2020, 307, 123228. [Google Scholar] [CrossRef]
  2. Sharma, A.; Pandit, P.P.; Chopade, R.L.; Nagar, V.; Aseri, V.; Singh, A.; Awasthi, K.K.; Awasthi, G.; Sankhla, M.S. Eradication of microplastics in wastewater treatment: Overview. Biointerface Res. Appl. Chem. 2023, 13, 223. [Google Scholar]
  3. Ali, N.S.; Kalash, K.R.; Ahmed, A.N.; Albayati, T.M. Performance of a solar photocatalysis reactor as pretreatment for wastewater via UV, UV/TiO2 and UV/H2O2 to control membrane fouling. Sci. Rep. 2022, 12, 16782. [Google Scholar] [CrossRef] [PubMed]
  4. Molinari, R.; Severino, A.; Lavorato, C.; Argurio, P. Which configuration of photocatalytic membrane reactors has a major potential to be used at an industrial level in tertiary sewage wastewater treatment? Catalysts 2023, 13, 1204. [Google Scholar] [CrossRef]
  5. Argurio, P.; Fontananova, E.; Molinari, R.; Drioli, E. Photocatalytic membranes in photocatalytic membrane reactors. Processes 2018, 6, 162. [Google Scholar] [CrossRef]
  6. De Filpo, G.; Pantuso, E.; Armentano, K.; Formoso, P.; Di Profio, G.; Poerio, T.; Fontananova, E.; Meringolo, C.; Mashin, A.I.; Nicoletta, F.P. Chemical vapor deposition of photocatalyst nanoparticles on PVDF membranes for advanced oxidation processes. Membranes 2018, 8, 35. [Google Scholar] [CrossRef]
  7. Khader, E.H.; Mohammed, T.J.; Albayati, T.M.; Harharah, H.N.; Amari, A.; Saady, N.M.C.; Zendehboudi, S. Current trends for wastewater treatment technologies with typical configurations of photocatalytic membrane reactor hybrid systems: A review. Chem. Eng. Process 2023, 192, 109503. [Google Scholar] [CrossRef]
  8. Szymański, K.; Grzechulska-Damszel, J.; Mozia, S. Application of a submerged photocatalytic membrane reactor with ultrafiltration membrane for ketoprofen removal during long term process: Impact of feed matrix. J. Water Process Eng. 2024, 59, 104953. [Google Scholar] [CrossRef]
  9. Roso, M.; Boaretti, C.; Bonora, R.; Modesti, M.; Lorenzetti, A. Nanostructured active media for volatile organic compounds abatement: The synergy of graphene oxide and semiconductor coupling. Ind. Eng. Chem. Res. 2018, 57, 16635–16644. [Google Scholar] [CrossRef]
  10. Zhang, Q.; Quan, X.; Wang, H.; Chen, S.; Su, Y.; Li, Z. Constructing a visible-light-driven photocatalytic membrane by g-C3N4 quantum dots and TiO2 nanotube array for enhanced water treatment. Sci. Rep. 2017, 7, 3128. [Google Scholar] [CrossRef]
  11. Nguyen, T.P.; Tran, Q.B.; Ly, Q.V.; Hai, L.T.; Le, D.T.; Tran, M.B.; Ho, T.T.T.; Nguyen, X.C.; Shokouhimehr, M.; Vo, D.-V.N.; et al. Enhanced visible photocatalytic degradation of diclofenac over N-doped TiO2 assisted with H2O2: A kinetic and pathway study. Arab. J. Chem. 2020, 13, 8361–8371. [Google Scholar] [CrossRef]
  12. Hu, C.; Wang, M.-S.; Chen, C.-H.; Chen, Y.-R.; Huang, P.-H.; Tung, K.-L. Phosphorus-doped g-C3N4 integrated photocatalytic membrane reactor for wastewater treatment. J. Membr. Sci. 2019, 580, 1–11. [Google Scholar] [CrossRef]
  13. Athanasekou, C.P.; Moustakas, N.G.; Morales-Torres, S.; Pastrana-Martínez, L.M.; Figueiredo, J.L.; Faria, J.L.; Silva, A.M.T.; Dona-Rodriguez, J.M.; Romanos, G.E.; Falaras, P. Ceramic photocatalytic membranes for water filtration under UV and visible light. Appl. Catal. B 2015, 178, 12–19. [Google Scholar] [CrossRef]
  14. Ashar, A.; Bhatti, I.A.; Ashraf, M.; Tahir, A.A.; Aziz, H.; Yousuf, M.; Ahmad, M.; Mohsin, M.; Bhutta, Z.A. Fe3+@ZnO/polyester based solar photocatalytic membrane reactor for abatement of RB5 dye. J. Clean. Prod. 2020, 246, 119010. [Google Scholar] [CrossRef]
  15. Sun, T.; Liu, Y.; Shen, L.; Xu, Y.; Li, R.; Huang, L.; Lin, H. Magnetic field assisted arrangement of photocatalytic TiO2 particles on membrane surface to enhance membrane antifouling performance for water treatment. J. Colloid Interface Sci. 2020, 570, 273–285. [Google Scholar] [CrossRef] [PubMed]
  16. Lv, Y.; Zhang, C.; He, A.; Yang, S.-J.; Wu, G.-P.; Darling, S.B.; Xu, Z.-K. Photocatalytic nanofiltration membranes with self-cleaning properties for wastewater. Adv. Funct. Mater. 2017, 27, 1700251. [Google Scholar] [CrossRef]
  17. Liu, G.; Han, K.; Zhou, Y.; Ye, H.; Zhang, X.; Hu, J.; Li, X. Facile synthesis of highly dispersed Ag doped graphene oxide/titanate nanotubes as a visible light photocatalytic membrane for water treatment. ACS Sustain. Chem. Eng. 2018, 6, 6256–6263. [Google Scholar] [CrossRef]
  18. Alyarnezhad, S.; Marino, T.; Parsa, J.B.; Galiano, F.; Ursino, C.; Garcìa, H.; Puche, M.; Figoli, A. Polyvinylidene fluoride-graphene oxide membranes for dye removal under visible light irradiation. Polymers 2020, 12, 1509. [Google Scholar] [CrossRef]
  19. Nassseh, N.; Taghavi, L.; Barikbin, B.; Nasseri, M.A. Synthesis and characterisation of a novel FeNi3/SiO2/CuS magnetic nanocomposite for photocatalytic degradation of tetracycline in simulated wastewater. J. Clean. Prod. 2018, 179, 42–54. [Google Scholar] [CrossRef]
  20. Lin, L.; Wang, H.; Xu, P. Immobilized TiO2-reduced graphene oxide nanocomposites on optical fibers as high performance photocatalysts for degradation of pharmaceuticals. Chem. Eng. J. 2017, 310, 389–398. [Google Scholar] [CrossRef]
  21. Kamaludin, R.; Rasdi, Z.; Othman, M.H.D.; Kadir, S.H.S.A.; Nor, N.S.M.; Khan, J.; Zain, W.N.W.M.; Ismail, A.F.; Rahman, M.A.; Jaafar, J. Visible-light active photocatalytic dual layer hollow fiber (DLHF) membrane and its potential in mitigating the detrimental effects of bisphenol A in water. Membranes 2020, 10, 32. [Google Scholar] [CrossRef]
  22. Nitoi, I.; Constantin, L.A.; Oancea, P.; Cristea, I.; Crisan, M. TiO2 solar light photocatalysis a promising treatment method for wastewater with trinitrotoluene content. In Proceedings of the 15th International Multidisciplinary GeoConferences SGEM, Albena, Bulgaria, 18–24 June 2015. [Google Scholar]
  23. Crişan, M.; Răileanu, M.; Drăgan, N.; Crişan, D.; Ianculescu, A.; Niţoi, I.; Oancea, P.; Şomăcescu, S.; Stănică, N.; Vasile, B.; et al. Sol-gel iron-doped TiO2 nanopowders with photocatalytic activity. Appl. Catal. A Gen. 2015, 504, 130–142. [Google Scholar] [CrossRef]
  24. Vasiljevic, Z.Z.; Dojcinovic, M.P.; Vujancevic, J.D.; Jankovic-Castvan, I.; Ognjanovic, M.; Tadic, N.B.; Stojadinovic, S.; Brankovic, G.O.; Nikolic, M.V. Photocatalytic degradation of methylene blue under natural sunlight using iron titanate nanoparticles prepared by a modified sol-gel method. R. Soc. Open Sci. 2020, 7, 20078. [Google Scholar] [CrossRef] [PubMed]
  25. Constantin, L.A.; Constantin, M.A.; Ionescu, I.A.; Puiu, M.D. Polysulfone and cellulose acetate–based membranes’ potential application to photocatalytic membrane reactors. Rom. J. Ecol. Environ. Chem. 2023, 5, 5–16. [Google Scholar] [CrossRef]
  26. Constantin, L.A.; Ionescu, I.A.; Constantin, M.A.; Stefanescu, M.; Marin, N.M. Metal–titanium dioxide doped catalysts for wastewater treatment under simulated solar light. In Proceedings of the 26th International Symposium “The Environment and the Industry” SIMI, Bucharest, Romania, 27–29 September 2023. [Google Scholar]
  27. Nitoi, I.; Oancea, P.; Raileanu, M.; Crisan, M.; Constantin, L.; Cristea, I. UV-VIS photocatalytic degradation of nitrobenzene from water using heavy metal doped titania. J. Ind. Eng. Chem. 2015, 21, 677–682. [Google Scholar] [CrossRef]
  28. Mohammed, S.; Elnoor, M.; Hamad, I. The Structural properties of iron oxides using Raman spectroscopy. J. Sci. Eng. Res. 2018, 5, 183–187. [Google Scholar]
  29. Perevedentseva, E.; Lin, Y.-C.; Karmenyan, A.; Wu, K.-T.; Lugovtsov, A.; Shirshin, E.; Priezzhev, A.; Cheng, C.-L. Raman spectroscopic study of TiO2 nanoparticles’ effects on the Hemoglobin state in individual red blood cells. Materials 2021, 14, 5920. [Google Scholar] [CrossRef]
  30. Raguram, T.; Rajni, K.S. Synthesis and analysing the structural, optical, morphological, photocatalytic and magnetic properties of TiO2 and doped (Ni and Cu) TiO2 nanoparticles by sol–gel technique. Appl. Phys. A 2019, 125, 288. [Google Scholar] [CrossRef]
  31. SR ISO 6060; Water Quality—Determination of the Chemical Oxygen Demand. Romanian Standards Association: Bucharest, Romania, 1996.
  32. Joy, V.M.; Feroz, S.; Dutta, S. Solar nanophotocatalytic pretreatment of seawater: Process optimization and performance evaluation using response surface methodology and genetic algorithm. Appl. Water Sci. 2021, 11, 18. [Google Scholar] [CrossRef]
  33. Aslam, T.; Masindi, V.; Ahmad, A.A.; Chatzisymeon, E. Valorization of acid mine drainage into an iron catalyst to initiate the solar photo-Fenton treatment of municipal wastewater. Environments 2023, 10, 132. [Google Scholar] [CrossRef]
  34. Manaserro, A.; Satuf, M.L.; Alfano, O.M. Photocatalytic reactors with suspended and immobilised TiO2: Comparative efficiency evaluation. Chem. Eng. J. 2017, 326, 29–36. [Google Scholar] [CrossRef]
  35. Tasso Guaraldo, T.; Wenk, J.; Mattia, D. Photocatalytic ZnO foams for micropollutant degradation. Adv. Sustain. Syst. 2021, 5, 2000208. [Google Scholar] [CrossRef]
Figure 1. Solar photocatalytic installation used for PMR slurry photocatalytic step.
Processes 12 00617 g001
Figure 2. Synthesis of Fe–TiO2 catalysts.
Processes 12 00617 g002
Figure 3. SEM images taken for prepared Fe–TiO2 catalysts: FT1 at a 4 µm (a) and 30 µm scale (b); FT2 at a 4 µm (c) and 30 µm scale (d).
Processes 12 00617 g003
Figure 4. Dimensional analyses of (a) FT1 and (b) FT2.
Processes 12 00617 g004
Figure 5. EDX peaks of FT1 (a) and FT2 (b).
Processes 12 00617 g005
Figure 6. XRF peaks: (a) FT1; (b) FT2.
Processes 12 00617 g006
Figure 7. XRD diagram patterns recorded in Bragg–Brentano geometry for Fe–TiO2 photocatalyst samples FT1 and FT2.
Processes 12 00617 g007
Figure 8. Raman spectra for prepared Fe-doped TiO2 catalysts (FT)’ control sample-synthesised TiO2 (CS), for the two temperatures studied: (a) 300 °C and (b) 400 °C.
Processes 12 00617 g008
Figure 9. Infrared spectra for Fe-doped TiO2 catalysts (FT), TiO2 control samples (CS), and reference TiO2 anatase recorded at temperatures of 300 °C (a) and 400 °C (b); (c) absorbance ratios calculated at 405 cm1 for each sample compared with those for the reference TiO2 anatase; (d) the ratio of absorbance at the peak of the O–H stretching band to that at the O–H bending band.
Processes 12 00617 g009
Figure 10. PPFD recorded for degradation experiments using simulated solar light.
Processes 12 00617 g010
Figure 11. Pseudo-first-order kinetics of COD removal using simulated solar light.
Processes 12 00617 g011
Figure 12. PPFD recorded for degradation experiments using natural solar light.
Processes 12 00617 g012
Figure 13. Pseudo-first-order kinetic of COD removal using natural solar light.
Processes 12 00617 g013
Figure 14. Preparation of 10% polysulfone membrane.
Processes 12 00617 g014
Figure 15. Total COD removal (PR—after photocatalytic step; PMR—after membrane step).
Processes 12 00617 g015
Figure 16. Ultrapure water flow and separation flow for each catalyst separation cycle.
Processes 12 00617 g016
Figure 17. SEM image of 10% Psf membrane after six separation cycles.
Processes 12 00617 g017
Table 1. Prepared photocatalyst composition resulting from EDX analysis.
ElementWeight %Atomic %
FT1
O K43.9170.16
Ti K54.9029.30
Fe K1.190.54
FT2
O K37.4564.24
Ti K61.6835.34
Fe K0.870.43
Table 2. Microstructural data for prepared catalysts.
SampleTemp
(°C)
D Spacing
(Å)
Lattice ParametersV
(unit cell vol.)
FWHM
(Degrees)
Crystallite Size,
Williams–Hall Method
(1 0 1)(2 0 0)(0 0 4)a (Å)c (Å)Ratio c/a3)(1 0 1)(2 0 0)(0 0 4)(nm)
TiO2
anatase (PDF
00-064-0863)
2353.516161.892682.373393.78536 (24)9.4936 (7)2.508136.03n/an/an/a<100 nm
FT1 3003.510 (4)1.887 (4)2.842 (6)3.60 (8)11.1 (3)3.083145 (6)2.68 (4)7.41 (12)5.23 (12)17 (4)
FT24003.4833 (6)1.8934 (3)2.3751 (5)3.767 (14)9.42 (4)2.501133.7 (9)0.912 (9)1.401 (6)1.780 (7)69 (15)
Table 3. Vibrational modes present in the Raman spectra of prepared Fe-doped TiO2 catalysts (FT), and the corresponding control sample (CS), synthesised TiO2, for the two temperatures studied, 300 °C and 400 °C (green squares confirm the band in the Raman spectra shown in Figure 8 at the indicated wavenumber).
Wavenumber (cm−1)SampleVibration Modes
CS1CS2FT1FT2
399 Anatase—B1g mode
(symmetric bending vibration of O-Ti-O)
440 Rutile—Eg mode
(symmetric stretching vibration of O-Ti-O)
515 Anatase Ti–O A1g mode
(anti-symmetric bending vibration of O-Ti-O)
637 Anatase Ti–O Eg mode
(symmetric stretching vibration of O-Ti-O)
Table 4. COD removal efficiency using simulated solar light.
Time (h)COD Removal Efficiency (%)
FT1FT2
114.2923.81
223.8138.10
333.3357.14
442.8666.67
552.3871.43
657.1480.95
766.6785.71
Table 5. COD removal efficiency using natural solar light.
Time (h)COD Removal Efficiency (%)
FT1FT2
115.7918.18
221.0536.36
331.5850.00
436.8454.55
536.8463.64
647.3777.27
752.6381.82
Table 6. COD removal efficiency.
CatalystCOD Removal Efficiency (%)
After Photocatalytic StepPMR Overall
Simulated solar light
TiO225.0060.00
FT166.6790.48
FT285.7195.24
Natural solar light
TiO221.0563.16
FT152.6384.21
FT281.8295.45
Table 7. Comparison with other studies.
ProcessResultsConditionsReferences
Solar photocatalysis reactor by UV,
UV/H2O2 and UV/TiO2
UV: TOC = 20%
UV/H2O2: TOC = 30%
UV/TiO2: TOC = 50%
Reaction time = 6 h[3]
UV-VIS photocatalytic reactor with suspended TiO2 for clofibric acid degradation k = 0.00326 min−10.5 g/L TiO2
20 mg/L clofibric acid
[4,34]
Photocatalytic ZnO foams for
carbamazepine degradation
k = 0.0033 min−10.5 g/L ZnO
10 mg/L carbamazepine
[4,35]
Solar nanophotocatalytic
pretreatment of seawater
TOC: 76.5%
COD: 63.9%
2.94–3.89 mg/L TOC
4.9–5.78 mgO2/L COD
[32]
Solar photo Fenton treatment
of municipal wastewater
COD: 99%Reaction time = 1.5 h
255 mg/L COD
[33]
Solar PMR for wastewater treatmentSimulated solar light:
COD = 85.71%, k = 0.0045 min−1
after photocatalytic step
COD = 95.24% PMR
Natural solar light:
COD = 81.82%, k = 0.0038 min−1
after photocatalytic step
COD = 95.45% PMR
Reaction time = 7 h
100 mg/L Fe-doped TiO2
167.2–193.6 mgO2/L COD
This study
Disclaimer/Publisher’s Note: The statements, opinions and data contained in all publications are solely those of the individual author(s) and contributor(s) and not of MDPI and/or the editor(s). MDPI and/or the editor(s) disclaim responsibility for any injury to people or property resulting from any ideas, methods, instructions or products referred to in the content.

