Article

Evaluation of Deep Coalbed Methane Potential and Prediction of Favorable Areas within the Yulin Area, Ordos Basin, Based on a Multi-Level Fuzzy Comprehensive Evaluation Method

1
School of Energy Resources, China University of Geosciences, Beijing 100083, China
2
Coal Reservoir Laboratory of National Engineering Research Center of CBM Development & Utilization, China University of Geosciences, Beijing 100083, China
*
Author to whom correspondence should be addressed.
Processes 2024, 12(4), 820; https://doi.org/10.3390/pr12040820
Submission received: 1 March 2024 / Revised: 16 April 2024 / Accepted: 16 April 2024 / Published: 18 April 2024
(This article belongs to the Special Issue Shale Gas and Coalbed Methane Exploration and Practice)

Abstract

:
The research on the deep coalbed methane (CBM) in the Ordos Basin is mostly concentrated on the eastern margin of the basin. The geological resources of the Benxi Formation in the Yulin area, located in the central-eastern part, cover 15,000 × 108 m3, indicating enormous resource potential. However, the characteristics of the reservoir distribution and the favorable areas are not yet clear. This research comprehensively performed data logging, coal rock experiments, and core observations to identify the geological characteristics of the #8 coal seam, using a multi-level fuzzy mathematics method to evaluate the favorable area. The results indicate the following: (1) The thickness of the #8 coal in the Yulin Block ranges from 2.20 m to 11.37 m, with depths of between 2285.72 m and 3282.98 m, and it is mainly underlain by mudstone; the gas content ranges from 9.74 m3/t to 23.38 m3/t, showing a northwest–low and southeast–high trend. The overall area contains low-permeability reservoirs, with a prevalence of primary structural coal. (2) A multi-level evaluation system for deep CBM was established, dividing the Yulin Block into three types of favorable areas. This block features a wide range of Type I favorable areas, concentrated in the central-eastern, northern, and southwestern parts; Type II areas are closely distributed around the edges of Type I areas. The subsequent development process should prioritize the central-eastern part of the study area. The evaluation system established provides a reference for selecting favorable areas for deep CBM and offers theoretical guidance for targeted exploration and development in the Yulin area.

1. Introduction

Deep coalbed methane (CBM) has become a key focus in China to achieve substantial future increases in natural gas reserves and production. China’s CBM resources at depths of 2000 m and below are estimated to total 40.71 × 10¹² m3 [1], indicating enormous resource potential. The deep CBM resources in the Ordos Basin are estimated to exceed 20 × 1012 m3 [2], featuring a wide range of coal-bearing areas and burial depth variations. Scholars have also conducted various degrees of research on deep CBM in the Ordos Basin. Li et al. [3] found that the deep CBM in the Daning–Jixian Block exhibits the characteristics of “extensive hydrocarbon generation, high gas content, high saturation, high pressure bound free gas and adsorption gas coexistence”. Xu et al. [2] further clarified the evolutionary laws of deep CBM accumulation based on this and proposed three accumulation models. With further theoretical research on the mechanisms of deep CBM storage, the process of methane accumulation and the laws governing differentiated enrichment, coupled with the continuous optimization of deep CBM extraction techniques, new breakthroughs [2,4,5] have also been achieved with pioneering exploration and development experiments. Among these, well JS14-5Ping02 in the Daning–Jixian Block has achieved a gas production total of 2800 × 104 m3 within 358 days of production [4], making it the highest-producing well for deep CBM in China, and it continues to maintain stable production rates.
However, previous studies have mostly focused on the eastern margin of the basin [6,7,8,9,10,11,12], including areas such as Daning–Jixian, Yanchuan, and Linxing–Shenfu. However, different deep CBM fields exhibit varying enrichment laws and levels of exploration potential; currently, research on the deep CBM in the central-eastern part of the Ordos Basin, especially in the Benxi Formation, is relatively scarce. Zhao et al. [13] pointed out that the Benxi Formation’s coal resources in the Ordos Basin are abundant, with favorable enrichment conditions, estimating that the CBM resources in the Benxi Formation buried deeper than 2000 m exceed 12.33 × 10¹² m3. Among them, the Yulin Block was found to contain Class I favorable areas, with its geological resources reaching 15,000 × 108 m3. This indicates that the Yulin area has great resource potential; however, due to being in the early stage of the exploration and development of deep CBM and due to the unclear reservoir characteristics and enrichment storage laws, it is imperative to clarify the distribution characteristics of the deep CBM reservoirs in this area, as well as the enrichment mechanisms. Further in-depth evaluations of the favorable areas in the Yulin area will provide theoretical support for further exploration and development efforts.
In selecting favorable areas for coal reservoirs, scholars from both domestic and international backgrounds are continuously deepening their research on parameter selection principles and methods. There are numerous factors influencing the geological selection of CBM areas, making the analysis and selection of the parameters for favorable areas particularly crucial. With the deepening of CBM research, the evaluation parameter indicators continue to become more complex [14,15,16,17]. Various parameters such as tectonic movement, CBM accumulation characteristics, and hydrogeological conditions are continuously added to the evaluation indicator system. Although different parameters can be selected, a consensus has been reached on important indicators such as the gas content and permeability. With the introduction of mathematical methods [18,19,20], more effective methods have been provided for the quantitative characterization of the selected areas. Currently, the mathematical methods used in CBM area selection include fuzzy mathematics, grey theory methods, and Monte Carlo methods. Among them, multi-level fuzzy mathematics methods can be used to comprehensively evaluate the parameters and establish evaluation functions. On the other hand, by considering different reservoir conditions, experts have gradually refined the optimal selection processes of geologically favorable areas into multi-stage and multi-classification methods [14,21]. These methods have been successfully applied in the division of favorable areas for low- and medium-rank CBM in the Ordos Basin. Li et al. [22] used a fuzzy mathematics comprehensive evaluation method to predict that Wubu–Liulin belongs to the favorable area on the eastern edge of the Ordos Basin.
However, the current division system for favorable areas mostly focuses on shallow CBM [7,16,23,24,25], and even the studies performing deep CBM reservoir evaluations have used relatively generalized selection methods for the evaluation indicators and system establishment process. Due to the significant differences in the geological characteristics between deep CBM and mid-to-shallow CBM, the classification process is not only about the depth, but also about various distinct geological features. Regarding the selection of favorable areas for deep CBM in the Benxi Formation of the Yulin Block, due to its “one deep, ten high” characteristics [13], there is a need for the further discussion and validation of how parameter indicators can be scientifically established for deep coalbed reservoirs with characteristics such as deep burial areas, high coal ranks, high temperatures, and high pressure levels, and whether traditional geological zoning methods such as multi-level fuzzy analysis approaches are equally applicable.
In conclusion, this study comprehensively utilized core observation, logging, drilling, and coal rock testing data to systematically conduct a large amount of basic research on the #8 coal seam, which is the main coal seam of the Benxi Formation in the central-eastern part of the Ordos Basin. Based on an in-depth analysis of the reservoir characteristics of the deep CBM in the Yulin area, a comprehensive geological feature evaluation system suitable for the #8 coal in the study area was established by combining a multi-level analysis with fuzzy mathematics, aiming to analyze and demonstrate favorable areas for early development and to provide theoretical guidance for the deployment of exploration and engineering technologies for deep CBM in the Yulin area, thereby allowing the further efficient development of deep CBM in the central-eastern part of the basin.

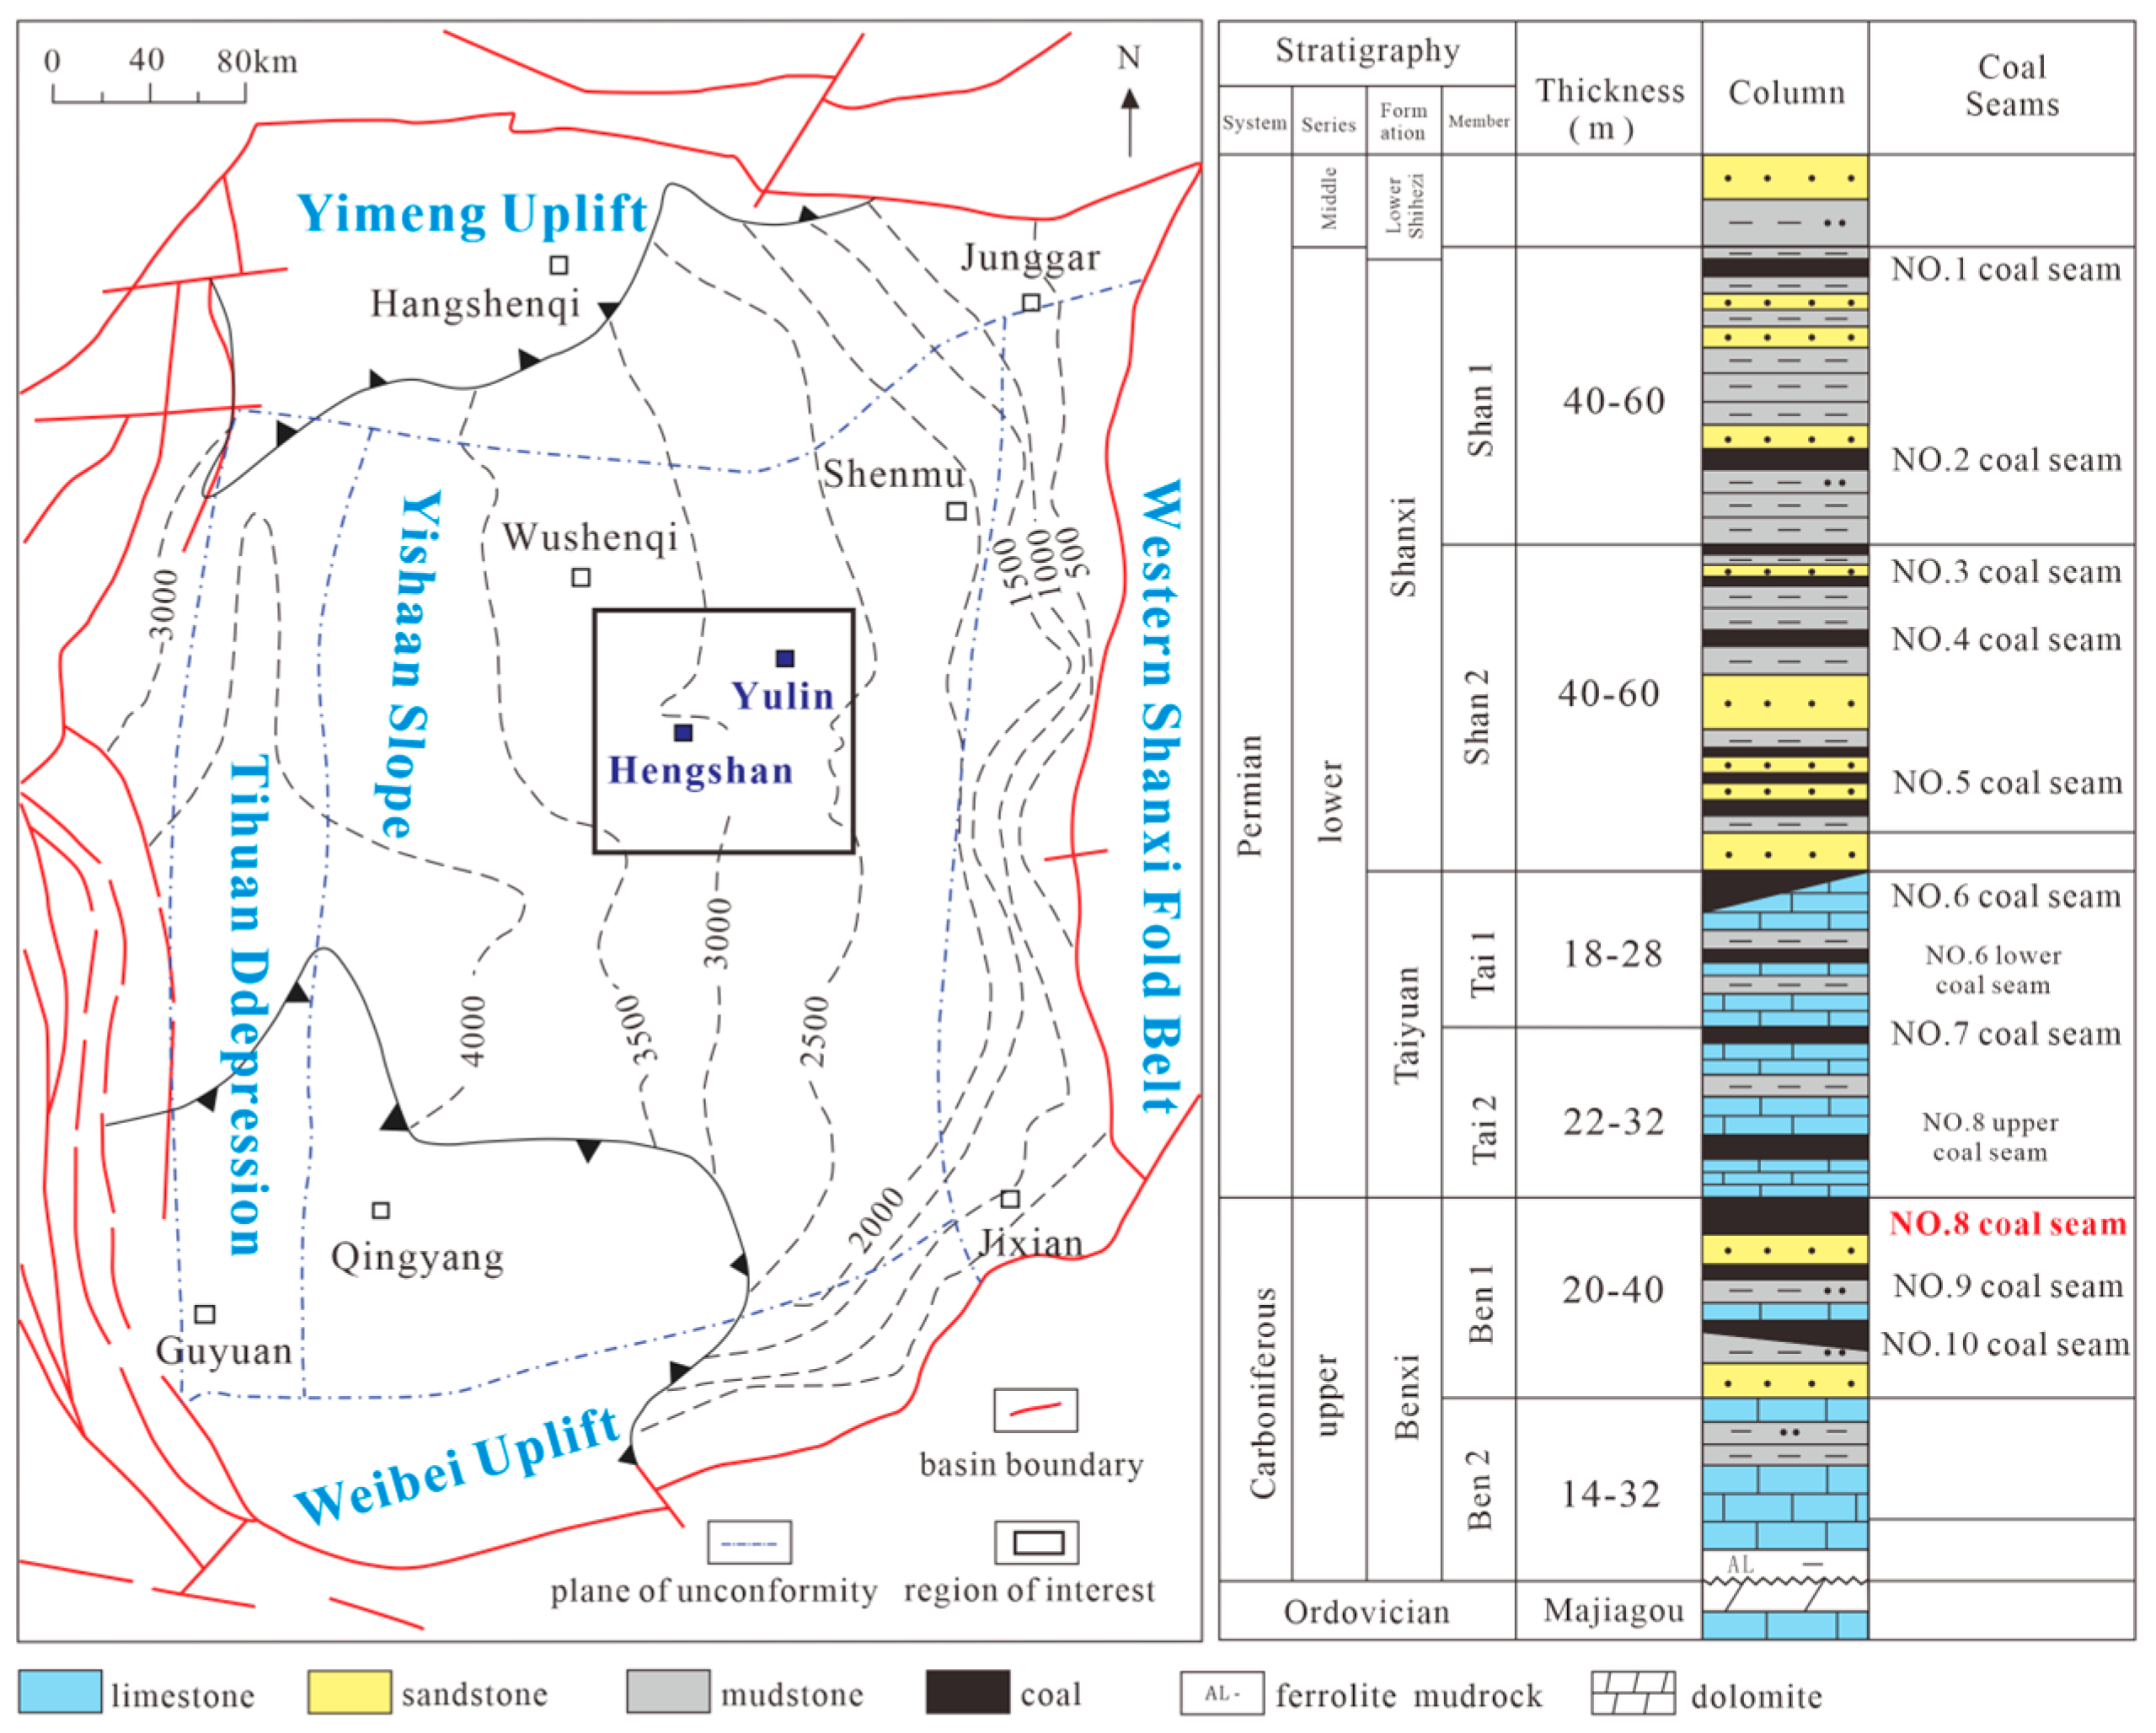
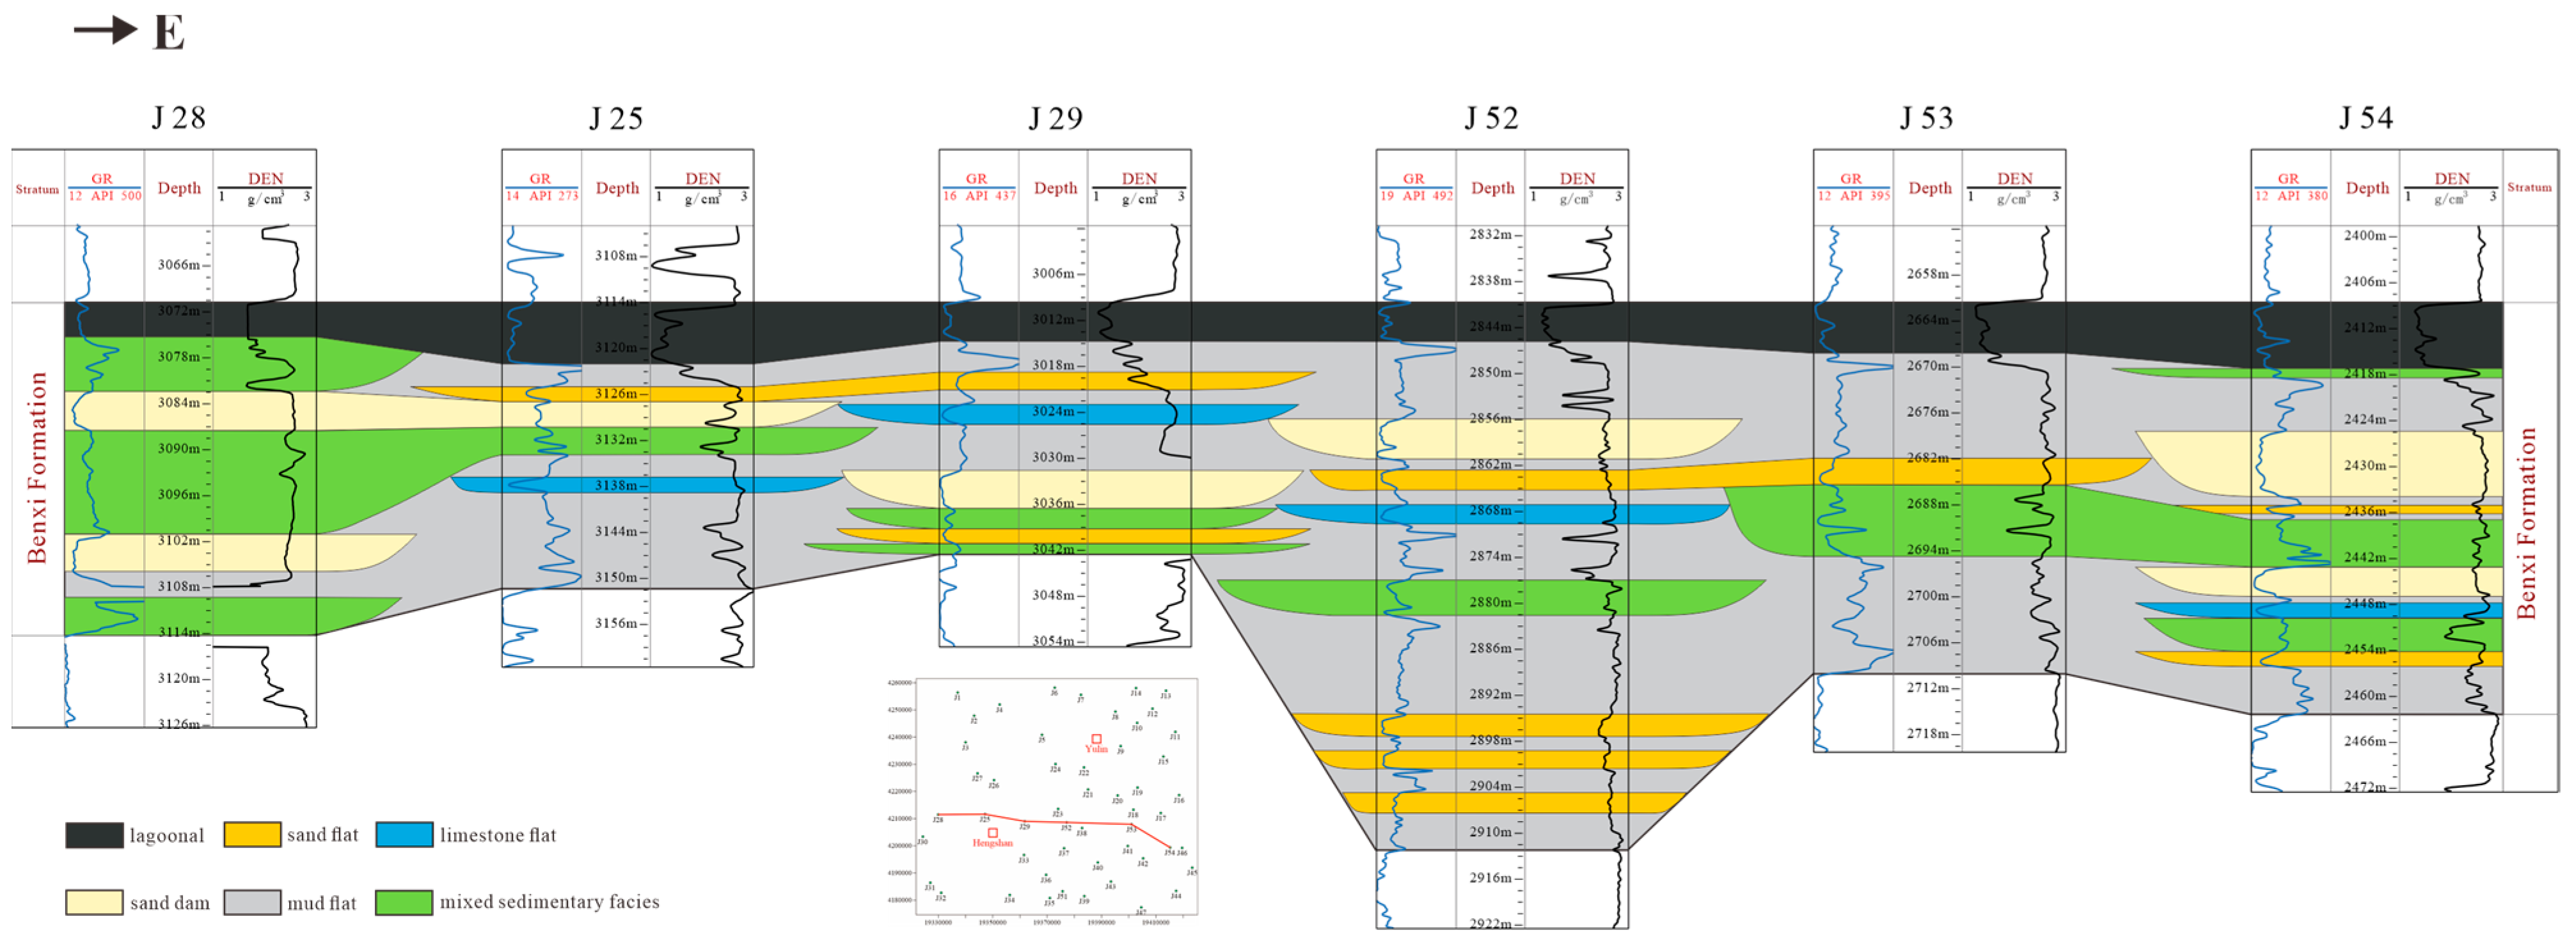
2. Geological Background

The Yulin Block is located in the mid-eastern area of the Ordos Basin (Figure 1), within the territories of the Shaanxi and Shanxi Provinces. Tectonically, it belongs to the eastern part of the Yishan slope of the Ordos Basin [26], involving monoclinic tectonics with a NNE trend. The overall geological structure of the block is simple, with fewer fractures and folds in the area, and its geological activities are relatively stable.
The sedimentary formations [13] that have developed, from bottom to top, in the study area are the Benxi Formation of the Carboniferous system and the Taiyuan and Shanxi Formations of the Permian system, with the sedimentary environment transitioning from marine–continental interactions to continental. The Shanxi Formation includes the development of #1–#5 coal seams, interspersed with sandstone and mudstone. The Taiyuan Formation mainly comprises #6, #6lower, #7, and #8upper coal seams, distributed between the sandstone of the Shanxi Formation base and the limestone of the Taiyuan Formation. The top of the Benxi Formation consists of limestone and iron–aluminum rock, covering the Majiagou top unconformity surface. The Benxi Formation includes the development of #8, #9, and #10 coal seams, with the top #8 coal seam being the most stable in distribution across the entire area; this is located above the limestone of the Benxi Formation and below the limestone of the Taiyuan Formation. The thicknesses range from 2 to 22 m, with the local thickness exceeding 15 m; meanwhile, the depths range from 2000 to 3200 m. The deep CBM exploration and development potential is the greatest, serving as the target layer for this study.

3. Databases and Methods

3.1. Data Collection

3.1.1. Logging Data

In this study, a total of 69 wells were selected to collect logging data for the Benxi Formation, including acoustic (AC), density (DEN), compensated neutron logging (CNL), natural gamma ray (GR), spontaneous potential (SP), deep investigate double lateral resistivity logging (RLLD), and shallow investigate double lateral resistivity logging (RLLS) curves. The coal seam burial depth, thickness, and other data can be directly obtained from the logging curves.

3.1.2. Gas Content Test Data

In this study, based on Chinese National Standards GB/T 19559-2021 [27], on-site gas content tests were conducted on five wells (J27, J42, J48, J49, J50) at different locations in the study area. Wells J42 and J48 were tested using pressure-retained cores, while the remaining three wells were tested using sealed cores. The gas content testing of coal rock is conducted by extracting coal rock cores from the core retrieval vessel and placing them in a desorption vessel, where the desorbed gas content is measured using a graduated cylinder or a flowmeter in a constant-temperature water bath at 70 °C. When the desorbed gas content is less than 10 mL continuously for seven days, the desorption vessel is opened and the residual gas content is calculated by pulverizing the rock core using a ball mill. It is important to note that pressure-retained core retrieval involves measuring the gas volume in the core retrieval vessel using a flowmeter before opening it, while the conventional and sealed-core retrieval methods use the USBM method to calculate the lost gas quantity, thereby obtaining the total gas content of the coal rock. Some of the sample test results are shown in Table 1. The final average gas contents were as follows: J27 well—20.18 m3/t; J42 well—23.38 m3/t; J48 well—9.98 m3/t; J49 well—18.72 m3/t; and J50 well—13.39 m3/t.

3.1.3. Vitrinite Reflectance Test Data

The reflectance of vitrinite in this study refers to the maximum vitrinite reflectance. The acquisition of the maximum vitrinite reflectance (Ro,max) value is based on the Chinese National Standards GB/T 6948-2008 [28] experimental standard, where under white light, a photometer system is used in an oil immersion apparatus to observe polished coal rock that is magnified 500 times for petrological observations (500 points) and then to obtain the average value. In this way, on-site vitrinite reflectance tests were conducted on nine wells at different locations. The results are shown in Table 2.

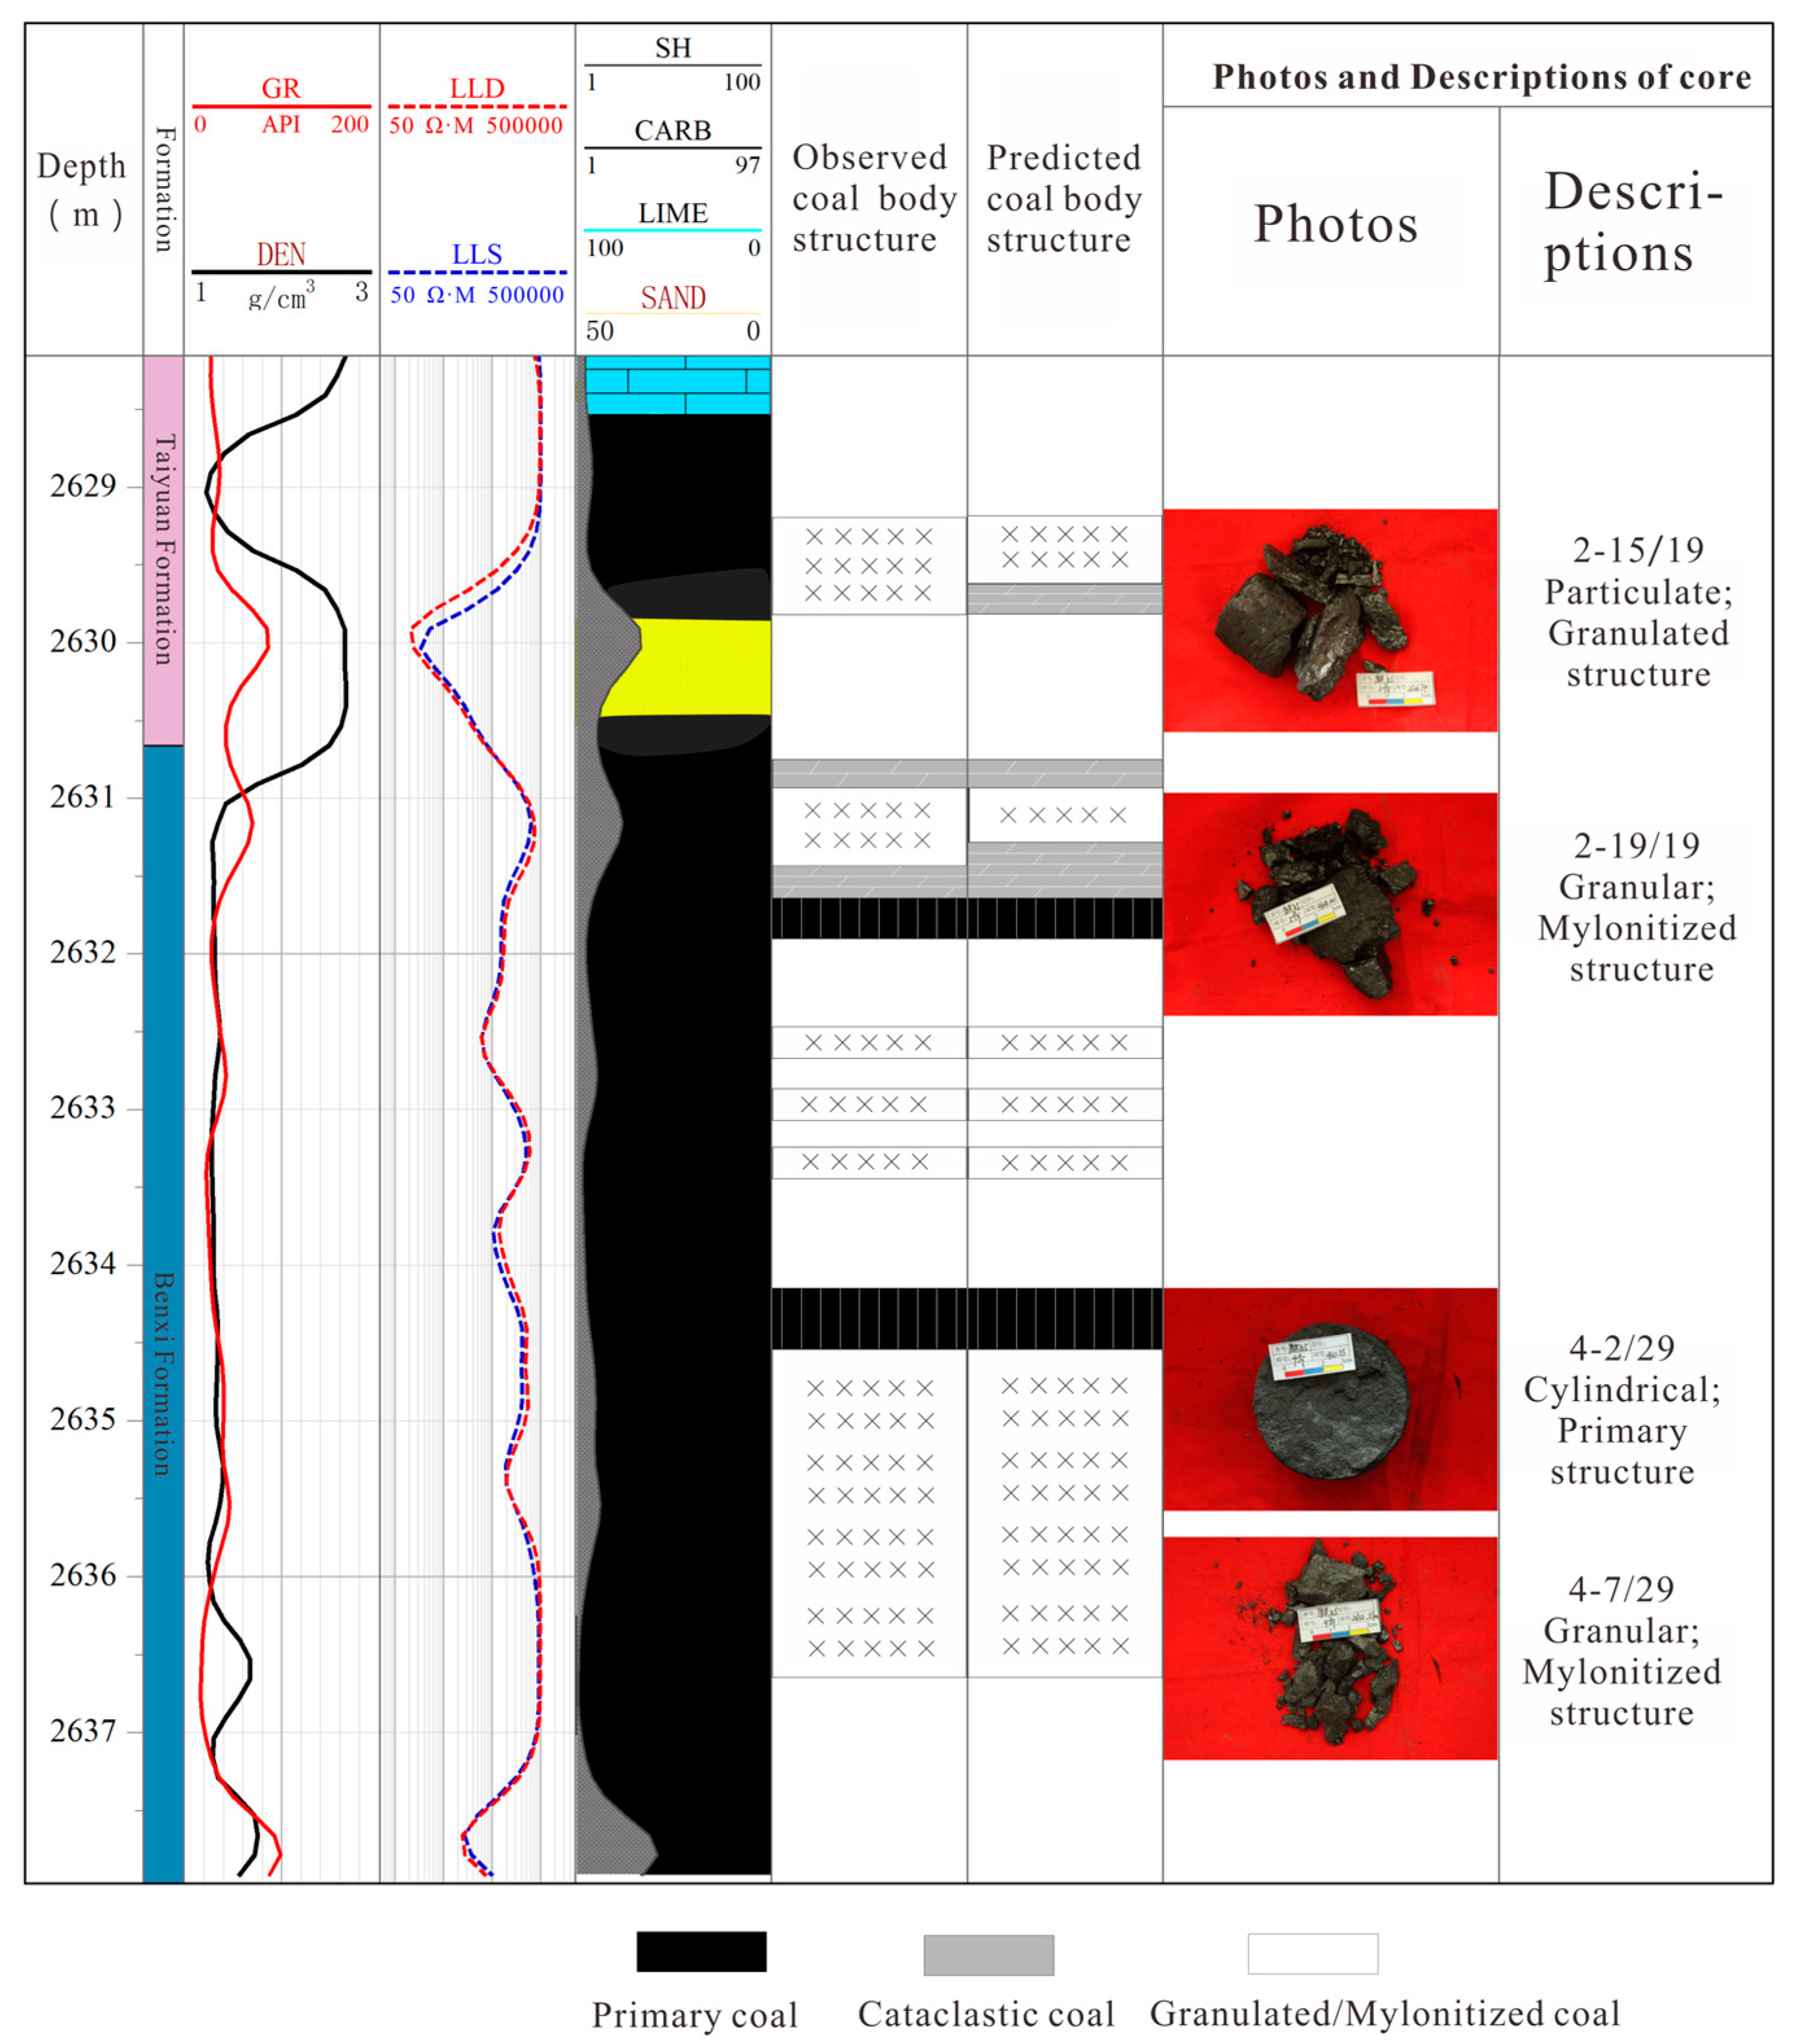
3.1.4. Core Observation Record

A total of 7 wells (J10, J27, J31, J39, J42, J43, J51) were selected for on-site core observations. Through core observations, the coal structure of each well section could be clearly understood, and combined with logging interpretation data, a comprehensive coal structure prediction model was established for the entire area.

3.2. Multi-Level Fuzzy Comprehensive Evaluation Method

Multi-level fuzzy comprehensive evaluation is a method used to transform a qualitative analysis into a quantitative analysis [24], which can be used to reflect the different levels between the elements of objective things with the aim of solving the evaluation problems of the multi-level and multi-index systems. This method divides the evaluation factors into different categories according to the relevant attributes, and the membership function is established in this way. According to the ordering from low to high, the results of the bottom evaluation indexes are used as the fuzzy relation matrix of the upper level, then the weight assignment of the upper layer index is calculated until reaching the highest level; finally, the quantitative evaluation results of the whole system are obtained. Based on the geological overview of the #8 coal seam in the Yulin area, the establishment of this evaluation system can be divided into the below four steps.
(a)
Determination of the influence factor set of the evaluation object
The objective of this study was to evaluate the comprehensive geological characteristics of the reservoir and select favorable exploration and development areas. Therefore, comprehensive reservoir evaluation index A was defined as the first-level evaluation system, representing the exploration and development potential of the deep CBM in this block. A higher value of A indicates better geological conditions, greater potential for deep CBM retrieval, and stronger production prospects. The development and utilization of deep CBM resources depend not only on the geological resource conditions, but also on the closely related development conditions. Based on the comprehensive study [23,29,30] of previously used area evaluation index systems, the secondary evaluation indexes of this system focused on the resource conditions (A1), preservation conditions (A2), and development conditions (A3). Additionally, considering key geological features such as the large burial depth, the thicknesses of the coal seams, and the relatively complete coal structure in the #8 coal reservoir in the Yulin area, while referring to Chinese National Standards NB/T 10013-2014 [31], a total of 7 key indexes were selected as the third-level evaluation indexes used in this study. The vitrinite reflectance (A11), gas content (A12), and coal thickness (A13) affect the CBM resource conditions in different ways, while the burial depth (A21) and roof lithology (A22) ensure that the conditions are preserved for the CBM. The coal structure index (A31) and coal seam permeability (A32) are two key indexes used to ensure CBM extraction. The evaluation index system for the Yulin Block was established based on these factors (Table 3).
(b)
Determination of the weight of each evaluation index
After establishing the hierarchy, based on the two major principles of the objectivity and specificity of the evaluation subjects, a judging matrix was constructed by using a pairwise comparison of the indexes at the same level [30]. Combined with the basic geological overview of the study area, in order to better distinguish their importance, in this study, the scale of 0 to 5 was used to assign importance coefficients. The value range is shown in Table 4. MATLAB was used to calculate the maximum characteristic root and the corresponding characteristic vector, and after normalization, the relative weight coefficients of each index were obtained (Table 5).
In order to ensure the objectivity and rationality of the calculation results, in this study, the consistency test proposed by Saaty T.L. [32] was adopted:
C . I . = ( λ m a x n ) / ( n 1 )
C . R . = C . I . / R . I .
where n represents the order of the matrix; R . I . is the mean random consistency index, which can be directly obtained by referencing the table; C . I . is the consistency index; and C . R . is the random consistency ratio. When C . R . < 10%, this indicates that the results of the judging matrix exhibit acceptable consistency and pass the test.
After testing, the random consistency ratios of the four judging matrices in the study area were all 0%. The test confirmed that the results could be used for block selection. Using this method, the weights of various evaluation indexes in the Yulin area were calculated (Table 6). The calculation results showed that the gas content was the most important influencing factor among the many evaluation indexes, with a weight of 0.301. The roof lithology was the least important factor affecting the coalbed gas preservation conditions, with a weight of 0.053.
(c)
Determination of the degree of affiliation of each influence index
The determination of the degree of affiliation makes the evaluation approach quantitative [33]. A higher value is more favorable for the selection process. In this study, the fuzzy statistical method was used to determine these values. In Section 4.2, this article details the degree of affiliation for each evaluation index. The degree of affiliation for each index is also shown in Table 7.
(d)
The comprehensive evaluation results
Based on the weight and degree of affiliation for each main control index, all wells in the study area were scored; that is, the comprehensive evaluation index A values were determined. According to the score results, the difference mapping was carried out and the favorable area containing #8 deep coal reservoirs in Yulin Block was divided.

4. Results and Discussions

4.1. Evaluation Indexes
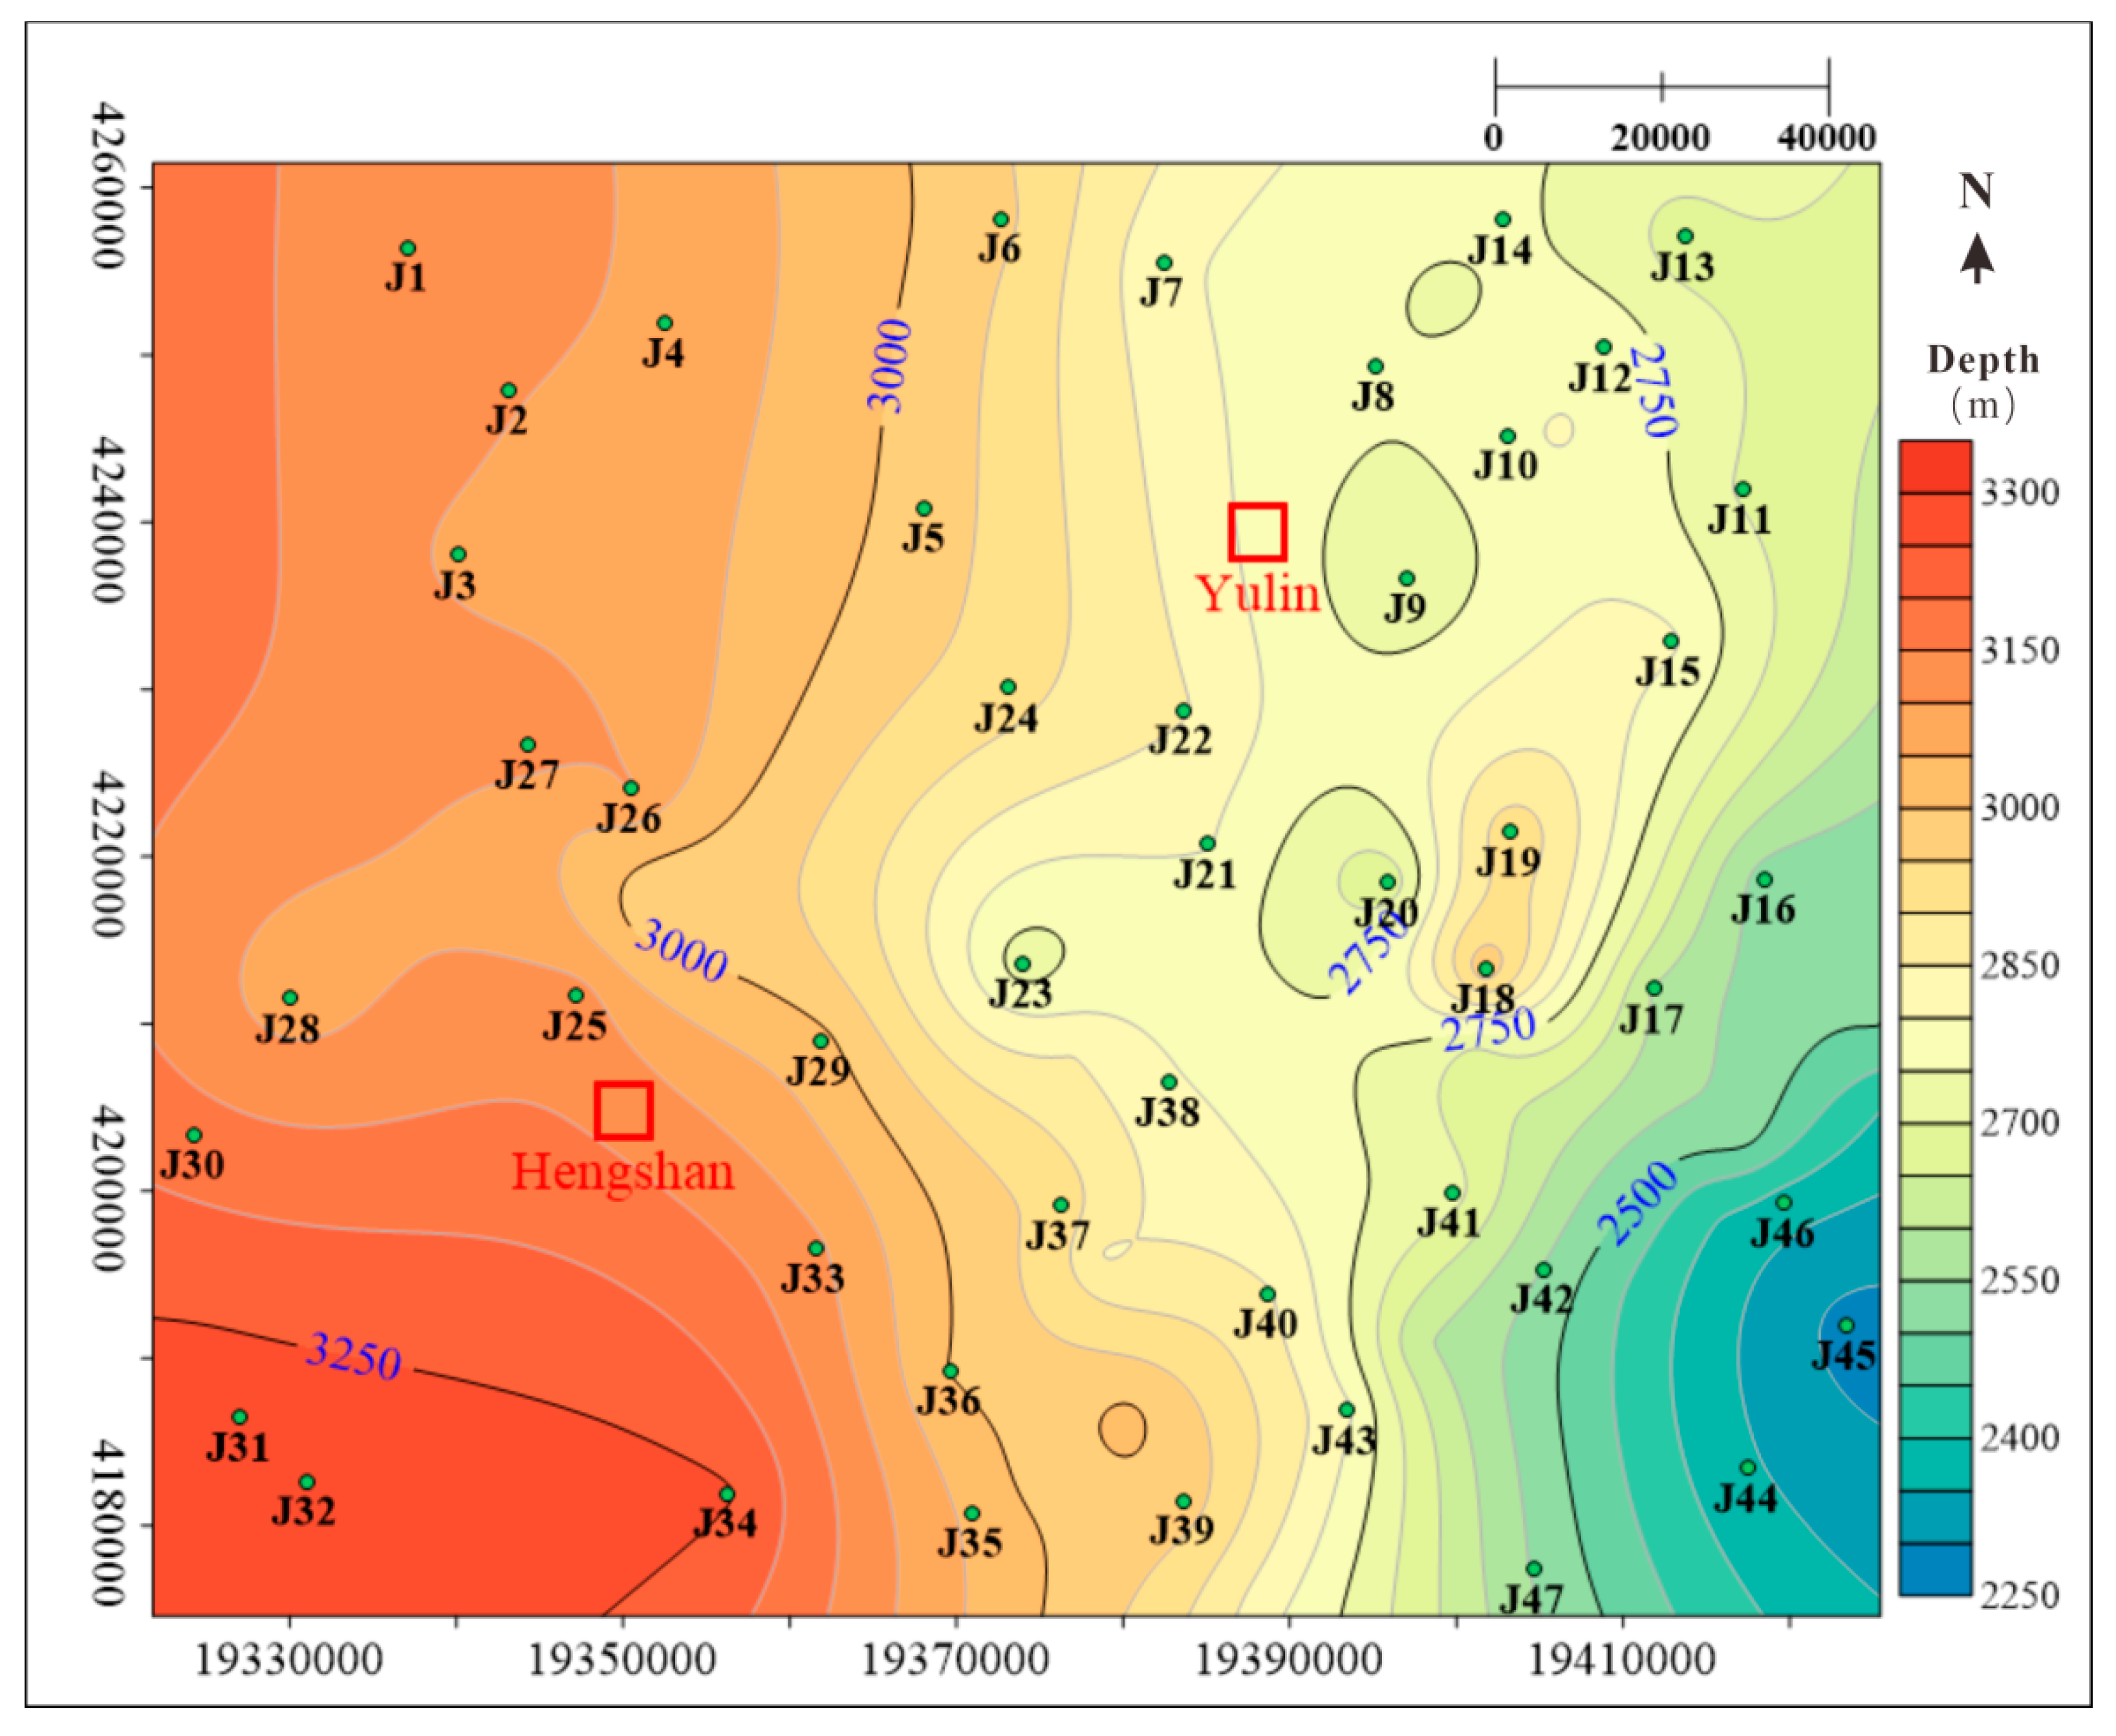
4.1.1. Burial Depth

The burial depth plays a key role in the preservation of CBM. With an increase in burial depth, the thickness of the overlying strata increases continuously. When the vertical stress of the overlying strata is greater than the horizontal stress, the state of the in situ stress is transformed and the horizontal principal stress difference decreases [34]. In this situation, the coal seam is compressed over three axes and the fissure tends to close, which is conducive to the preservation of the CBM. In addition, the change in the coal seam burial depth leads to dynamic changes in the coal reservoir temperature and pressure. The pressure and temperature are the key factors controlling the adsorption and desorption of CBM [35]. Therefore, the controlling function of the buried depth of the coal seam on the CBM is reflected in its influence on the storage of CBM. The No. 8 coal reservoir in the Yulin Block is deep CBM. The temperature of the deep CBM reservoir plays a dominant role in the adsorption of CBM, and the adsorption of methane in the coal bed decreases with increases in temperature. When exceeding a certain critical depth, the adsorbed gas in the coal seam is converted to free gas, causing a reduction in the CBM content. Therefore, for the deep CBM in this study area, a shallower burial depth provides a greater CBM content and is more conducive to gas preservation.
The burial depths of the No. 8 coal seam in the study area range from 2285.72 m to 3282.97 m, with an average of 2852.56 m. The distribution characteristics of the coal seam are related to the geological structure. The Yulin Block is located in the eastern part of the Yishan slope, while the western part is in the West Shanxi flexure zone, with the structure showing a trend of being high in the west and low in the east (Figure 2). The No. 8 coal seam is deeply affected by this geological structure, and the overall burial depth gradually becomes shallower from west to east, with a maximum depth of 3300 m in the southwest.

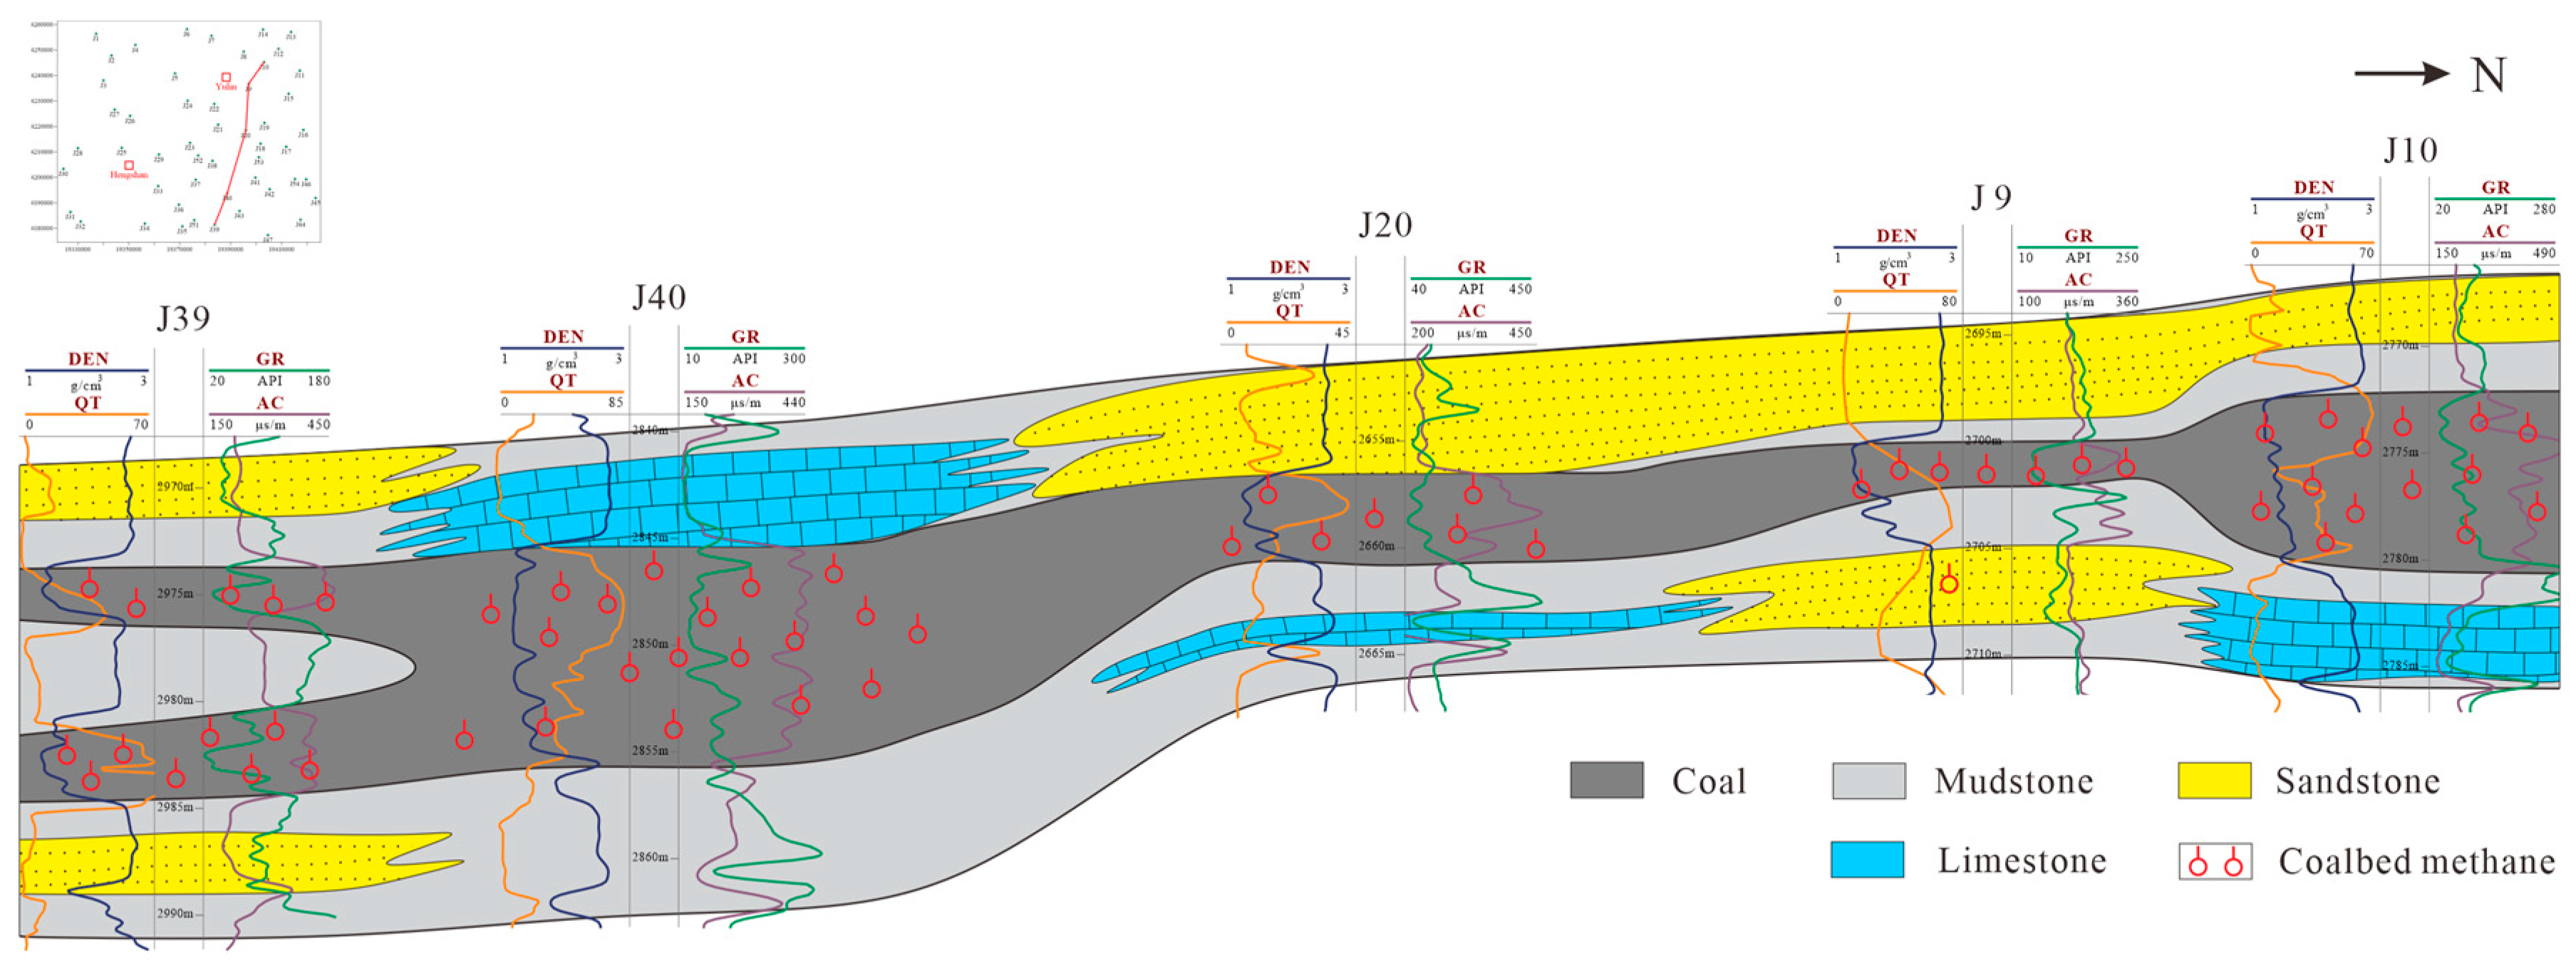
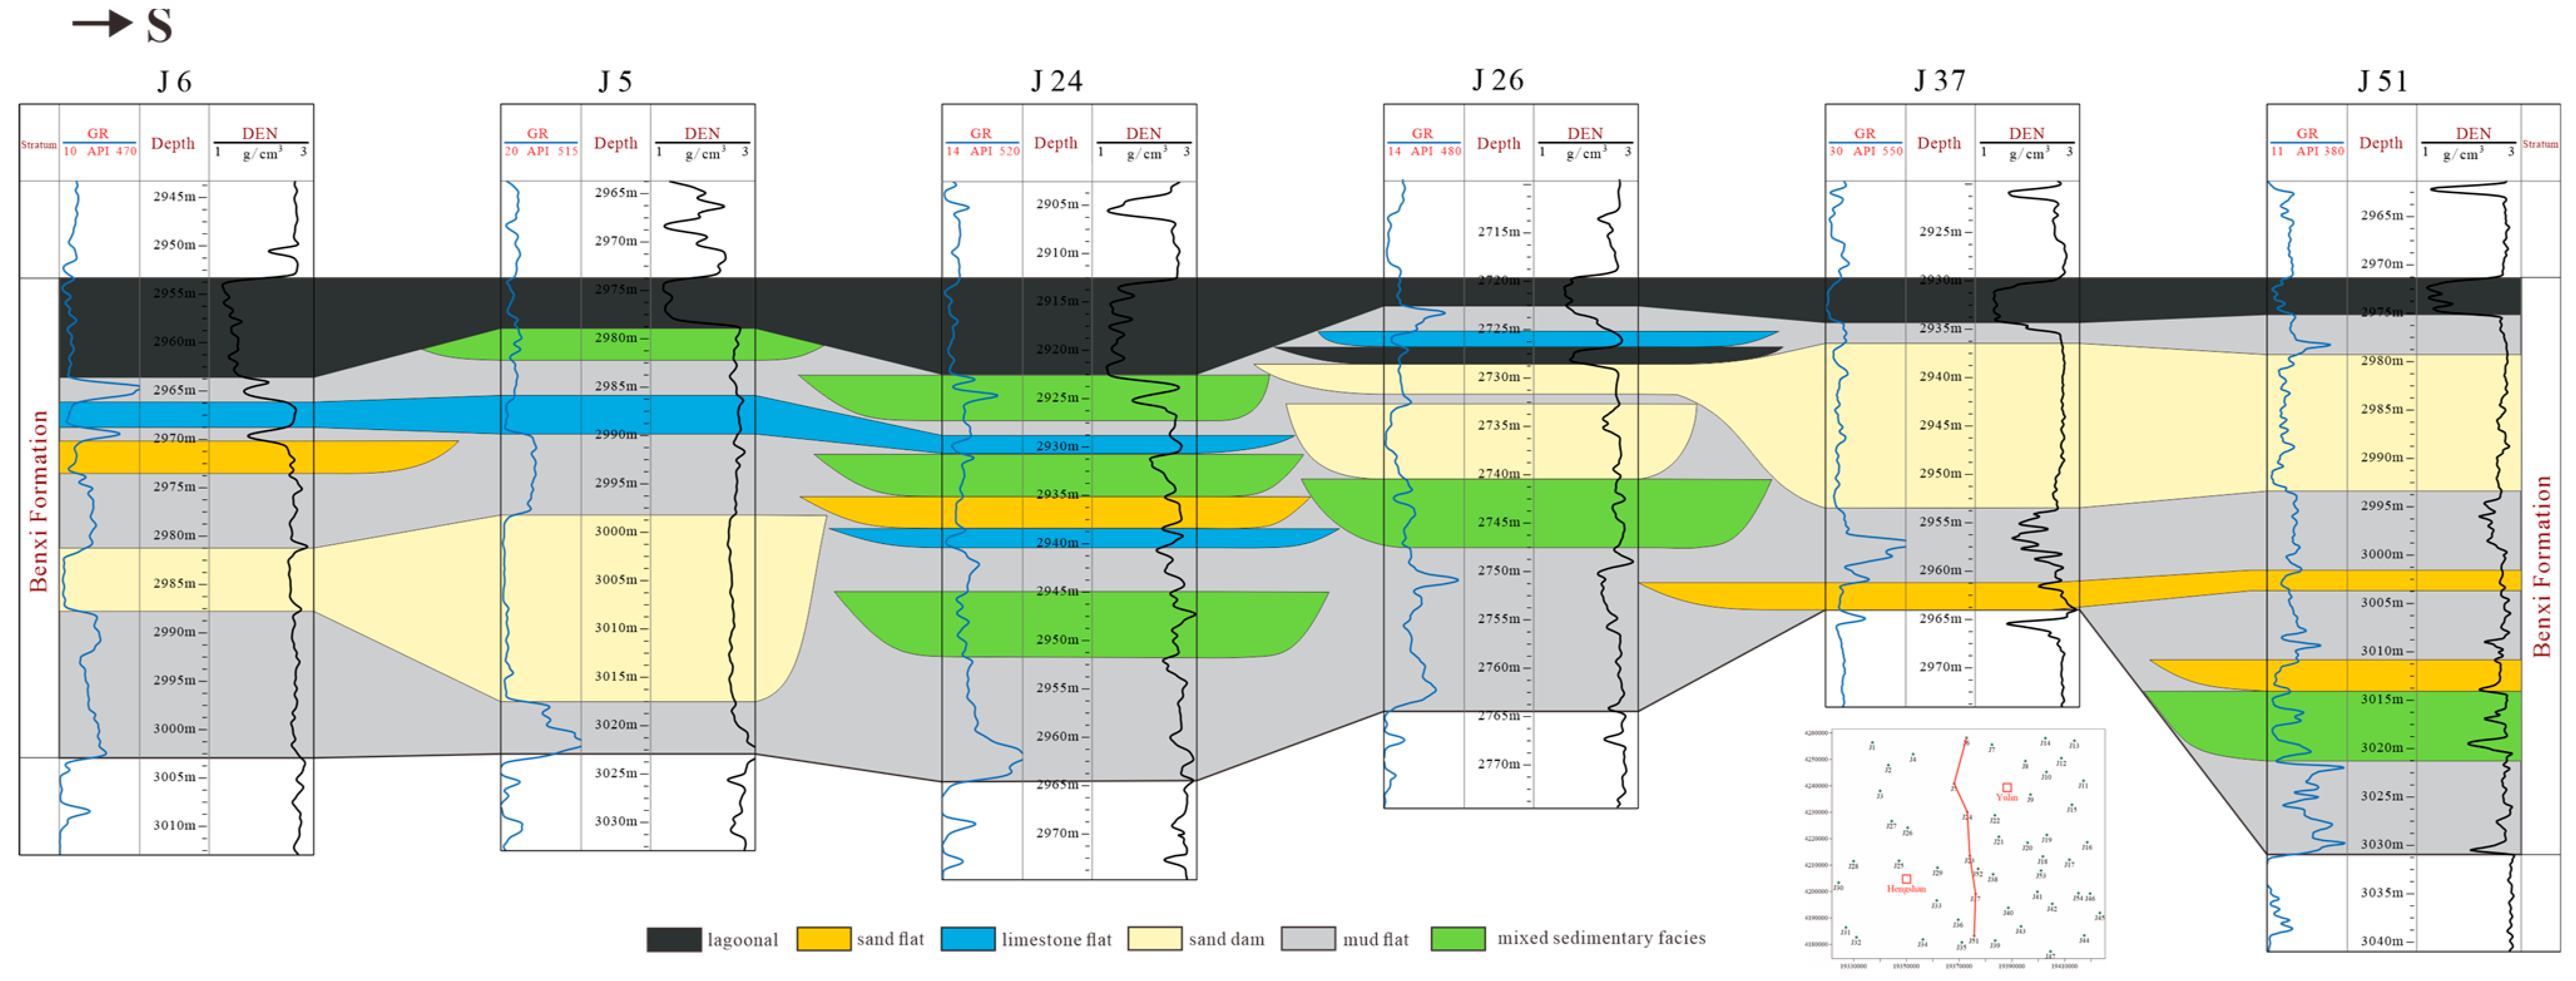
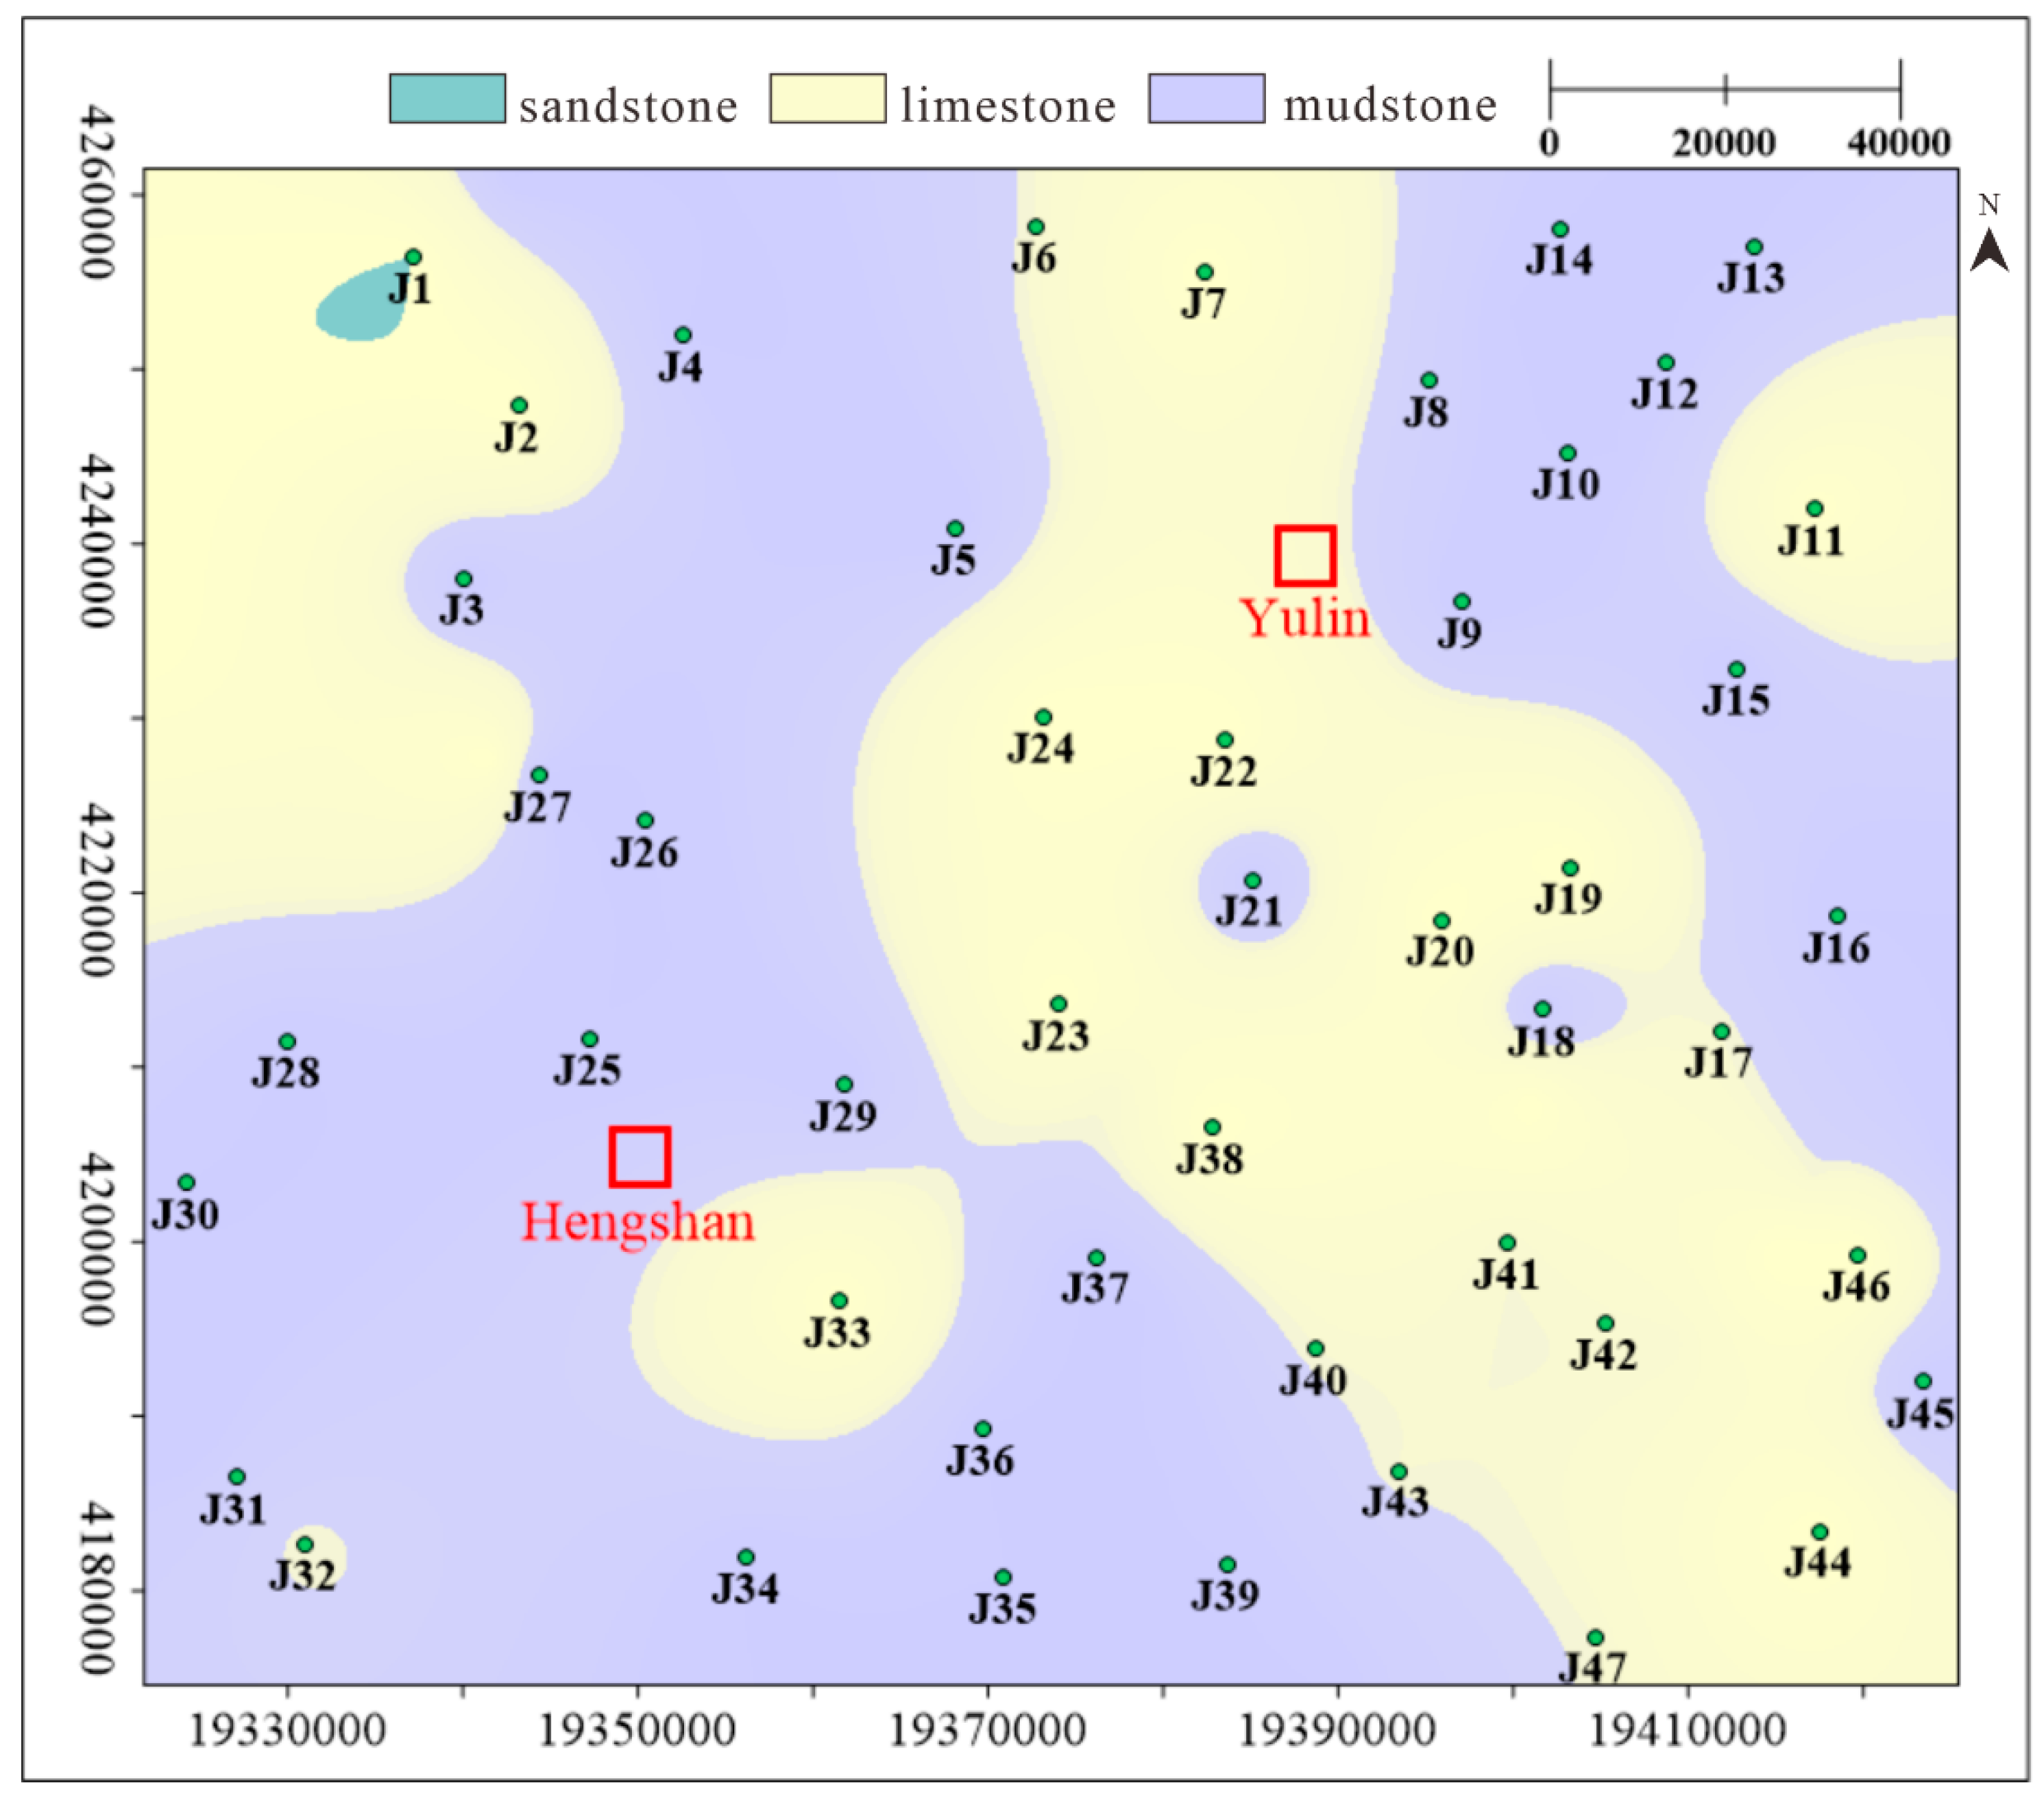
4.1.2. Coal Roof Lithology

The coal roof lithology is an important condition that affects the sealing ability of the cover and the preservation of the CBM. The nature of the top plate determines its ability to preserve the CBM. If the roof has good sealing abilities, it can effectively slow down the vertical dissipation of the CBM [8]. Similarly, a poorly sealed roof will have a weak fluid-sealing ability and the gas will easily dissipate outward, resulting in the destruction of the CBM reservoir. It is believed that compared with sandstone, which has a loose structure, large pores, and good permeability, mudstone has a relatively dense structure, a high argillaceous content, small pores, and poor permeability with a good capacity for closure, which is more favorable to the preservation of CBM. In addition, the greater the thickness of the coal seam roof, the stronger the inhibition effect on the vertical escape of CBM, which is conducive to the enrichment of the CBM. The stronger the toughness of the roof, the smaller the fracture produced by the tectonic effect and the more favorable this is to the storage of CBM. The sealing ability levels of the different coal seam roof types, in order from strongest to weakest, are oil–shale, mudstone, limestone, interbedded mudstone–siltstone, fine sandstone, and sandstone [36].
According to the J39-J10 gas reservoir profile chart of the study area (Figure 3), the gas content of CBM will be higher when the roof of coal seam comprises mudstone and limestone; the thicker the coal seam, the higher the gas content. However, when there is more sandstone above and below the coal seam, the gas content of the coal seam will be relatively low. The CBM is also distributed in the lower sandstone layer, indicating that some CBM will migrate downward to the lower sandstone in a free state. In conclusion, mudstone and limestone roofs are more conducive to the preservation of CBM, while sandstone roofs have a poorer sealing ability, leading to the phenomenon of CBM diffusion and migration.
Logging and lithology data were collected for 69 wells in the study area; among these, 12 wells have sandstone roofs, 18 wells have limestone roofs, and 39 wells have mudstone roofs. The thicknesses of the roofs range from 0.44 m to 11.29 m, with an average thickness of 4.26 m. The roofs are thicker in the middle of the study area. According to these development characteristics, the lithology map of the coal seam roof in the study area was drawn (Figure 4). The related figure shows that a large part of the mudstone roof developed in the Yulin Block, which corresponds directly to the characteristics of the study area being dominated by mud flat deposition. The sandstone roof is concentrated in the middle of the study area, while the limestone roof developed sporadically, making the overall sealing capacity of the study area strong.

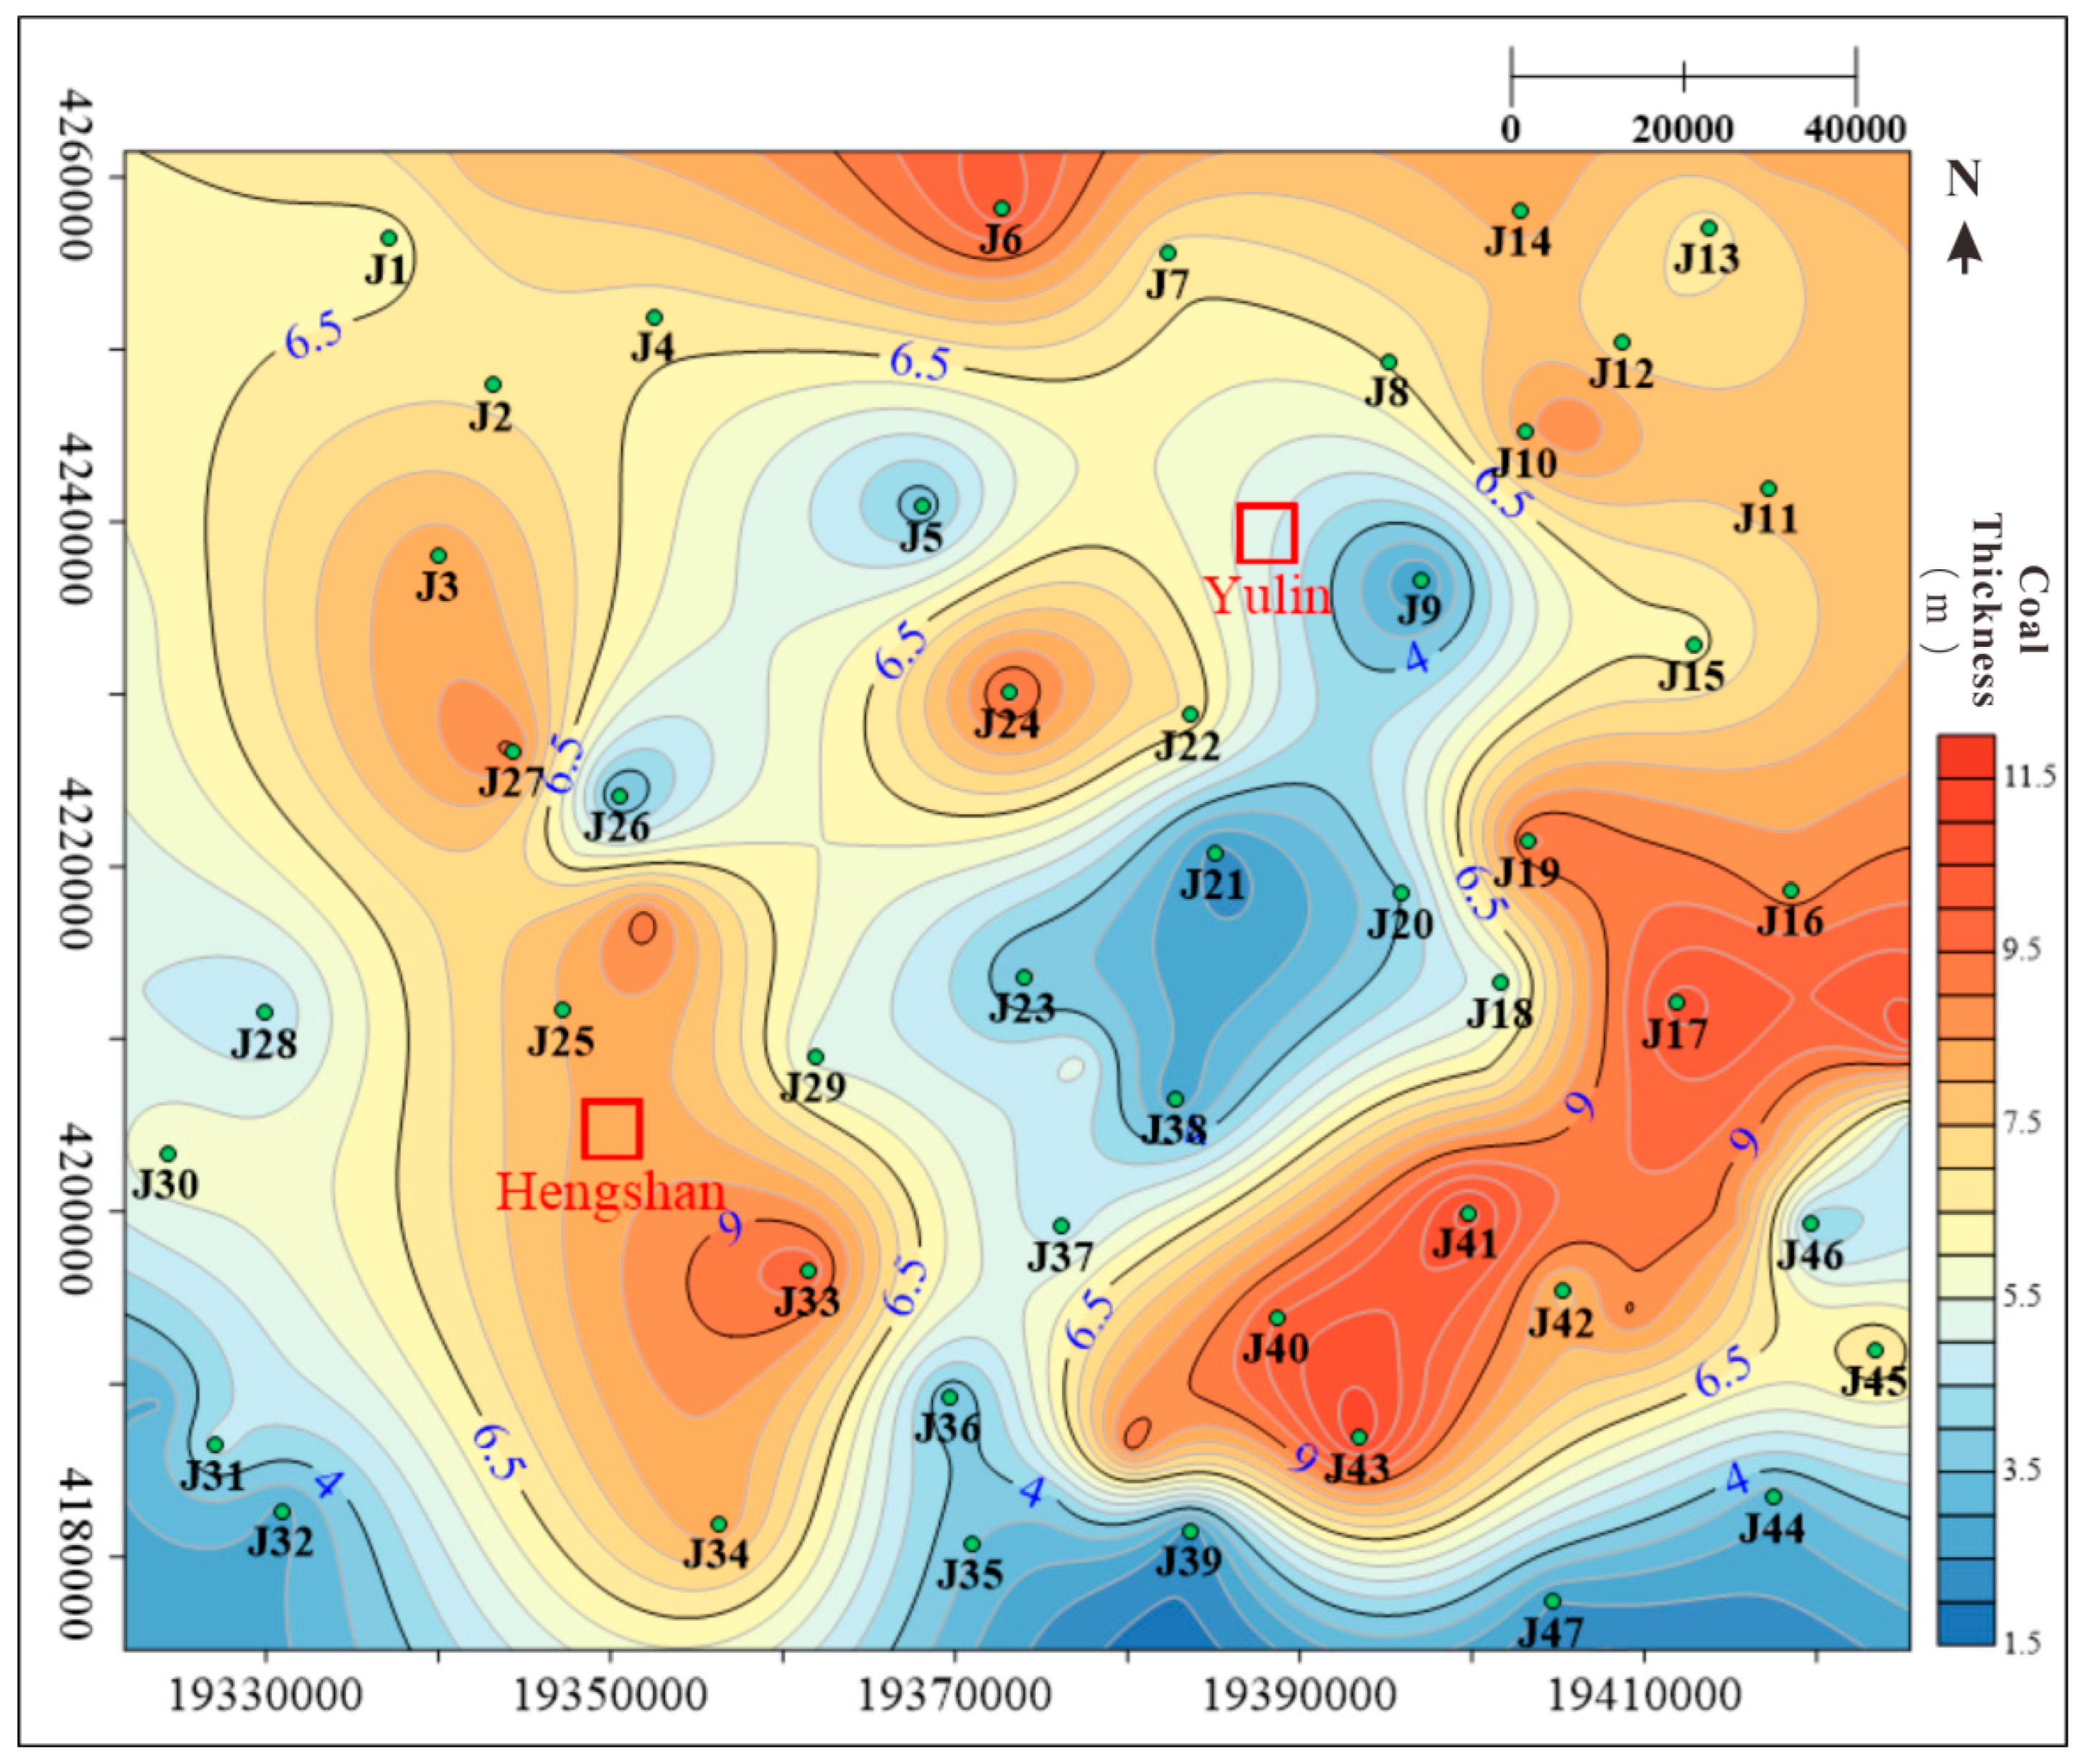
4.1.3. Coal Seam Thickness
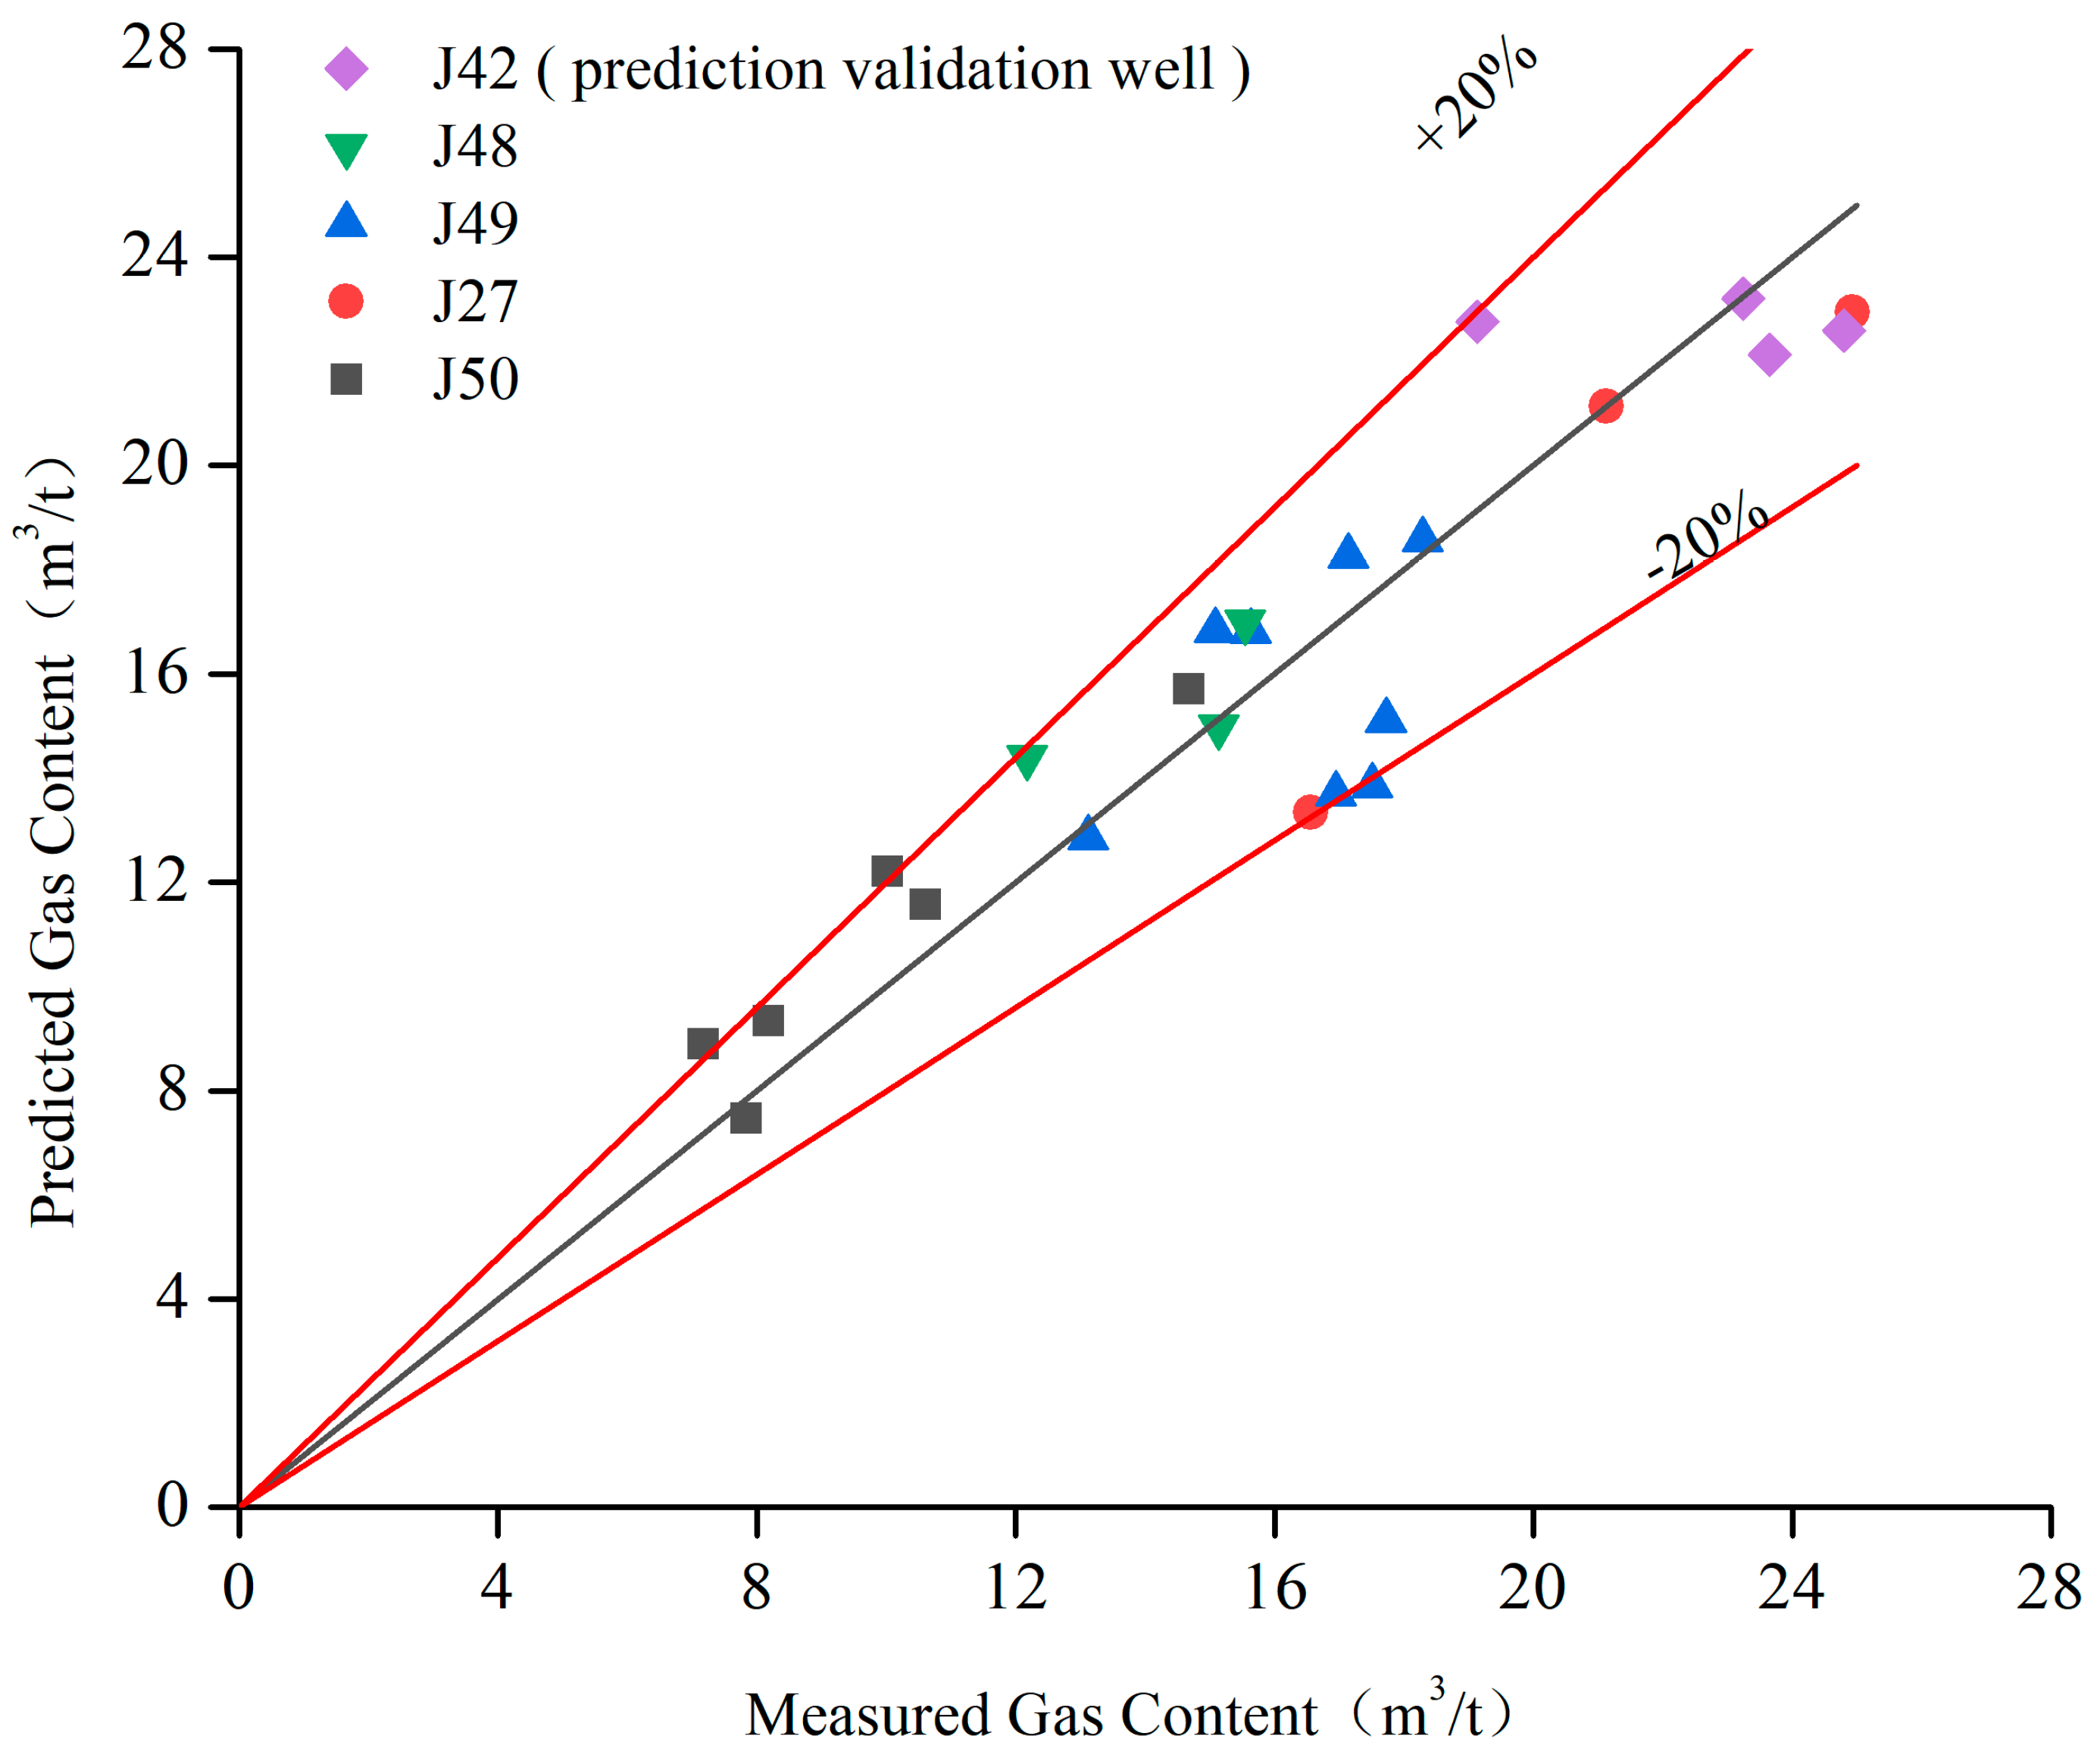
The coal seam thickness is the basic measure of coal reservoir resources. Together with the gas content, it determines the accumulation of CBM reserves. A positive correlation exists between the coal seam thickness and the gas production potential. The content of organic matter in coal increases with the thickness of the coal seam, meaning a greater amount of gas is generated [37]. On the other hand, if a coal seam of the same coal rank is not as influenced by the tectonic structure, then the thickness will be greater, the gas content will be higher, and the resource conditions will be better [38]. In addition, the coal seam itself can also be used as a low-permeability tight rock layer, which can prevent the diffusion of CBM to the roof and floor to a certain extent. Meanwhile, the thicker the coal seam, the longer the diffusion path of CBM to the roof and floor, and the more difficult it is for it to escape, which will further improve the gas content of the reservoir.
To better study the distribution characteristics of coal seams, in this research, based on the distribution of well locations across the entire area, two cross-sectional profiles of sedimentary facies of the Benxi Formation in both the north–south and east–west directions were created; the sedimentary profile J28–J54 runs in the east–west direction (Figure 5), while J6–J51 runs in the north–south direction (Figure 6). Overall, the coal seams in the Benxi Formation are consistently developed and stable, primarily occurring within the sedimentary microfacies at the top of lagoons. The dominant sedimentary microfacies is mudflat, which serves as a favorable coal seam floor. Additionally, multiple thick sand dams have developed over different periods, with relatively poor lateral sand body connectivity.
According to the logging data, the No. 8 coal seam of the Benxi Group in the Yulin Block was statistically calculated, with thicknesses ranging from 2.20 m to 11.37 m and an average coal thickness of 6.60 m. It can be seen from the contour diagram of the coal thicknesses that the coal is thin in the middle and thick around the periphery (Figure 7). A large area of thick coal seams has developed in the southeast part of the study area (near wells J43, J41, and J13), with great horizontal continuity; this is conducive to the enrichment of deep CBM. By analyzing the continuous well profiles, it could be concluded that the sedimentary environment in the southeastern region mainly comprises lagoons, while the areas with thin coal seams are mostly in mudflat environments, indicating that the scale of coal reservoir development is closely related to the sedimentary environment, while the thicknesses of the coal seams in the different depositional environments vary significantly [39]. In the Yulin area, it is more likely for thick coal seams to form in the lagoon environment, with large contents of organic matter and a high rate of gas production [40,41]. On the whole, most of the areas in the study region have favorable basic resource conditions for CBM development.

4.1.4. Gas Content

The coal seam gas content is one of the pivotal parameters for characterizing the enrichment of CBM resources, which is the main controlling factor used to determine whether CBM wells can produce high yields or not [42]. It is coupled with the permeability, coal seam thickness, and other parameters to measure the gas production potential of the CBM [43]. Generally speaking, the higher the gas content of the coal reservoir, the greater the production capacity of the CBM wells and the more valuable they are for development. Coring test data were available for only five wells in the study area, so the linear regression analysis technique was used to predict the gas contents of the deep coal seams across the whole area. This method has high reliability in predicting the gas contents of coal seams in the same tectonic unit when they are of a similar coal rank and burial depth.
Combined with the petrophysical properties of the No. 8 coal reservoir, the measured gas content data for the five wells in the study area were selected (taking the J42 well as the prediction validation well) and Pearson’s correlation coefficient was used to analyze and optimize the logging curves. Finally, the four factors with high correlation were identified as DEN, GR, RLLD, and RLLS. On this basis, the regression equation for the coal seam gas content, coal quality parameters, and response values of the logging was set up to construct the prediction model of the gas content of Yulin Block No. 8 coal:
GAS = 21.48 × DEN 0.022 × GR 1.48 × Lg   ( RLLD ) + 3.97 × Lg   ( RLLS ) + 41.59  
After testing, the absolute error of the gas content prediction model was 1.52 m3/t on average and the relative error was 10.85% on average. The absolute error range of the prediction verification well J42 was 0.65–1.54 m3/t and the relative error range was 2.04–6.22%; R2 is 0.75. The constructed model showed certain rationality, from which the contour diagram of the gas content across the whole area was derived (Figure 8).
From the prediction model, it can be seen that the gas content range of the No. 8 coal seam in the study area is 9.74–23.38 m3/t, with an average of 16.42 m3/t. The overall trend is low in the northwest and high in the southeast, and the planar heterogeneity of the gas contents in the block is obvious (Figure 9). There are 35 wells with gas contents above 15 m3/t, accounting for 51% of the total number of wells, which are mostly distributed in the southeast of the study area. The gas content of the deep coal seams in the area where J40 and J42 are located is as high as 20 m3/t, corresponding to the thickness of the coal seams and the large content of organic matter.

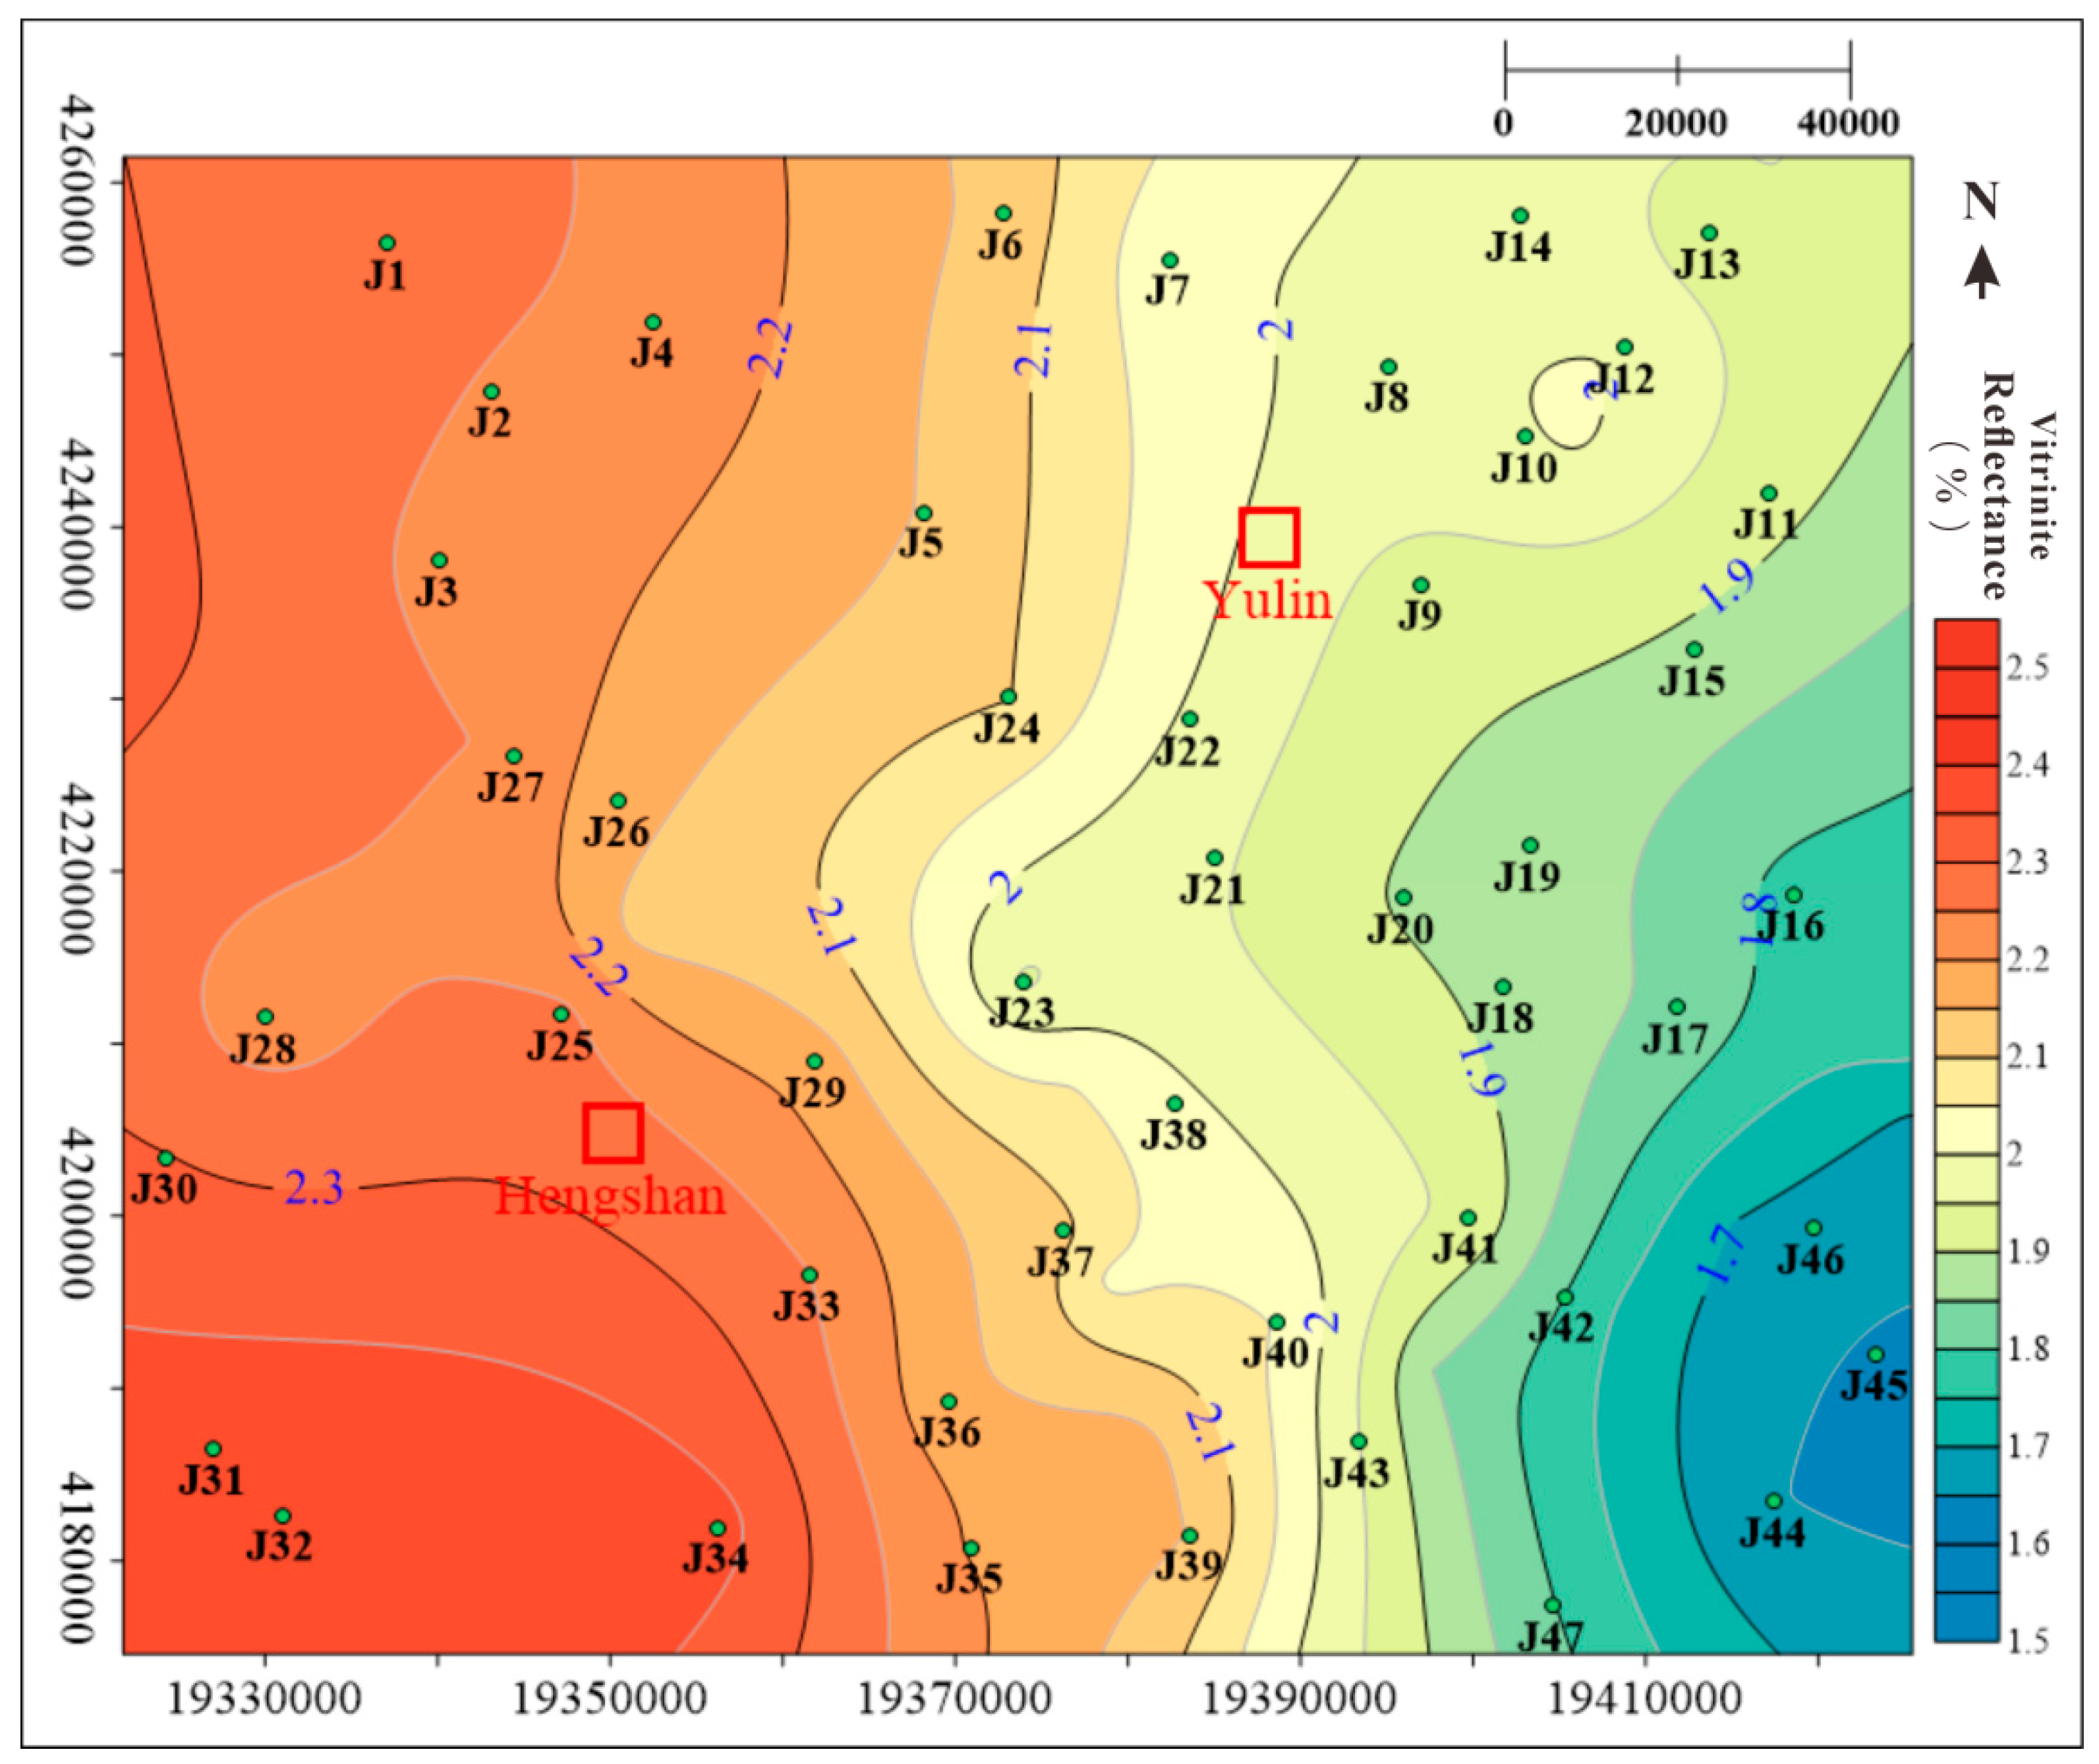
4.1.5. Vitrinite Reflectance

The vitrinite reflectance is the most important index of organic maturity and is closely related to diagenesis [44]; the deeper the thermal metamorphism, the greater the vitrinite reflectance. In the biochemistry pyrolysis gas stage, the vitrinite reflectivity is low (less than 0.5%). As the burial depth gradually changes, in the thermal catalytic oil and gas generation stage and the thermal cracking and condensation gas generation stage, the vitrinite reflectivity as a depth function increases rapidly, from about 0.5% to 2.0%, and continues to increase in the deep high-temperature gas generation stage [45]. On the other hand, the coal rank controls the changing pore volume and specific surface area trends in a way that influences the pore characteristics of the coal matrix, further determining the adsorbed gas content [46]. The adsorbed gas content first increases and then decreases with the increase in the coal rank. The inflection point is around 4.5% of the vitrinite reflectance. Therefore, the measurement of the vitrinite reflectance can characterize the methane adsorption capacity of coal reservoirs to a certain extent [47].
As determined by the thermal evolution history of the Ordos Basin, the vitrinite reflectance of the basin gradually increases with the increase in depth [48]. Meanwhile, by exploring and analyzing the distribution characteristics of the vitrinite reflectivity values of the known wells, it was found that the reflectivity of the vitrinite in the study area gradually increases from east to west on the plane, which is consistent with the change in the coal seam burial depth and further verifies the conclusion above. Therefore, the burial depth parameter was selected to fit the correlation with the vitrinite reflectance and establish a maturity prediction model of the Yulin Block No. 8 coal seam:
Ro,max = 0.0006H + 0.1737
where Ro,max is the vitrinite reflectance, H is the thickness of the coal seams, and R2 = 0.79.
From this model, a planar distribution diagram of the predicted vitrinite reflectance of No. 8 coal in the study area was created (Figure 10); this is high in the west, low in the east, low in the north, and high in the south. The vitrinite reflectance distribution range is 1.65–2.39%, with an average value of 2.06%, which is within the most favorable coal rank range for CBM mining. The vitrinite reflectance in the southwest is the largest and the gas production capacity is strong.

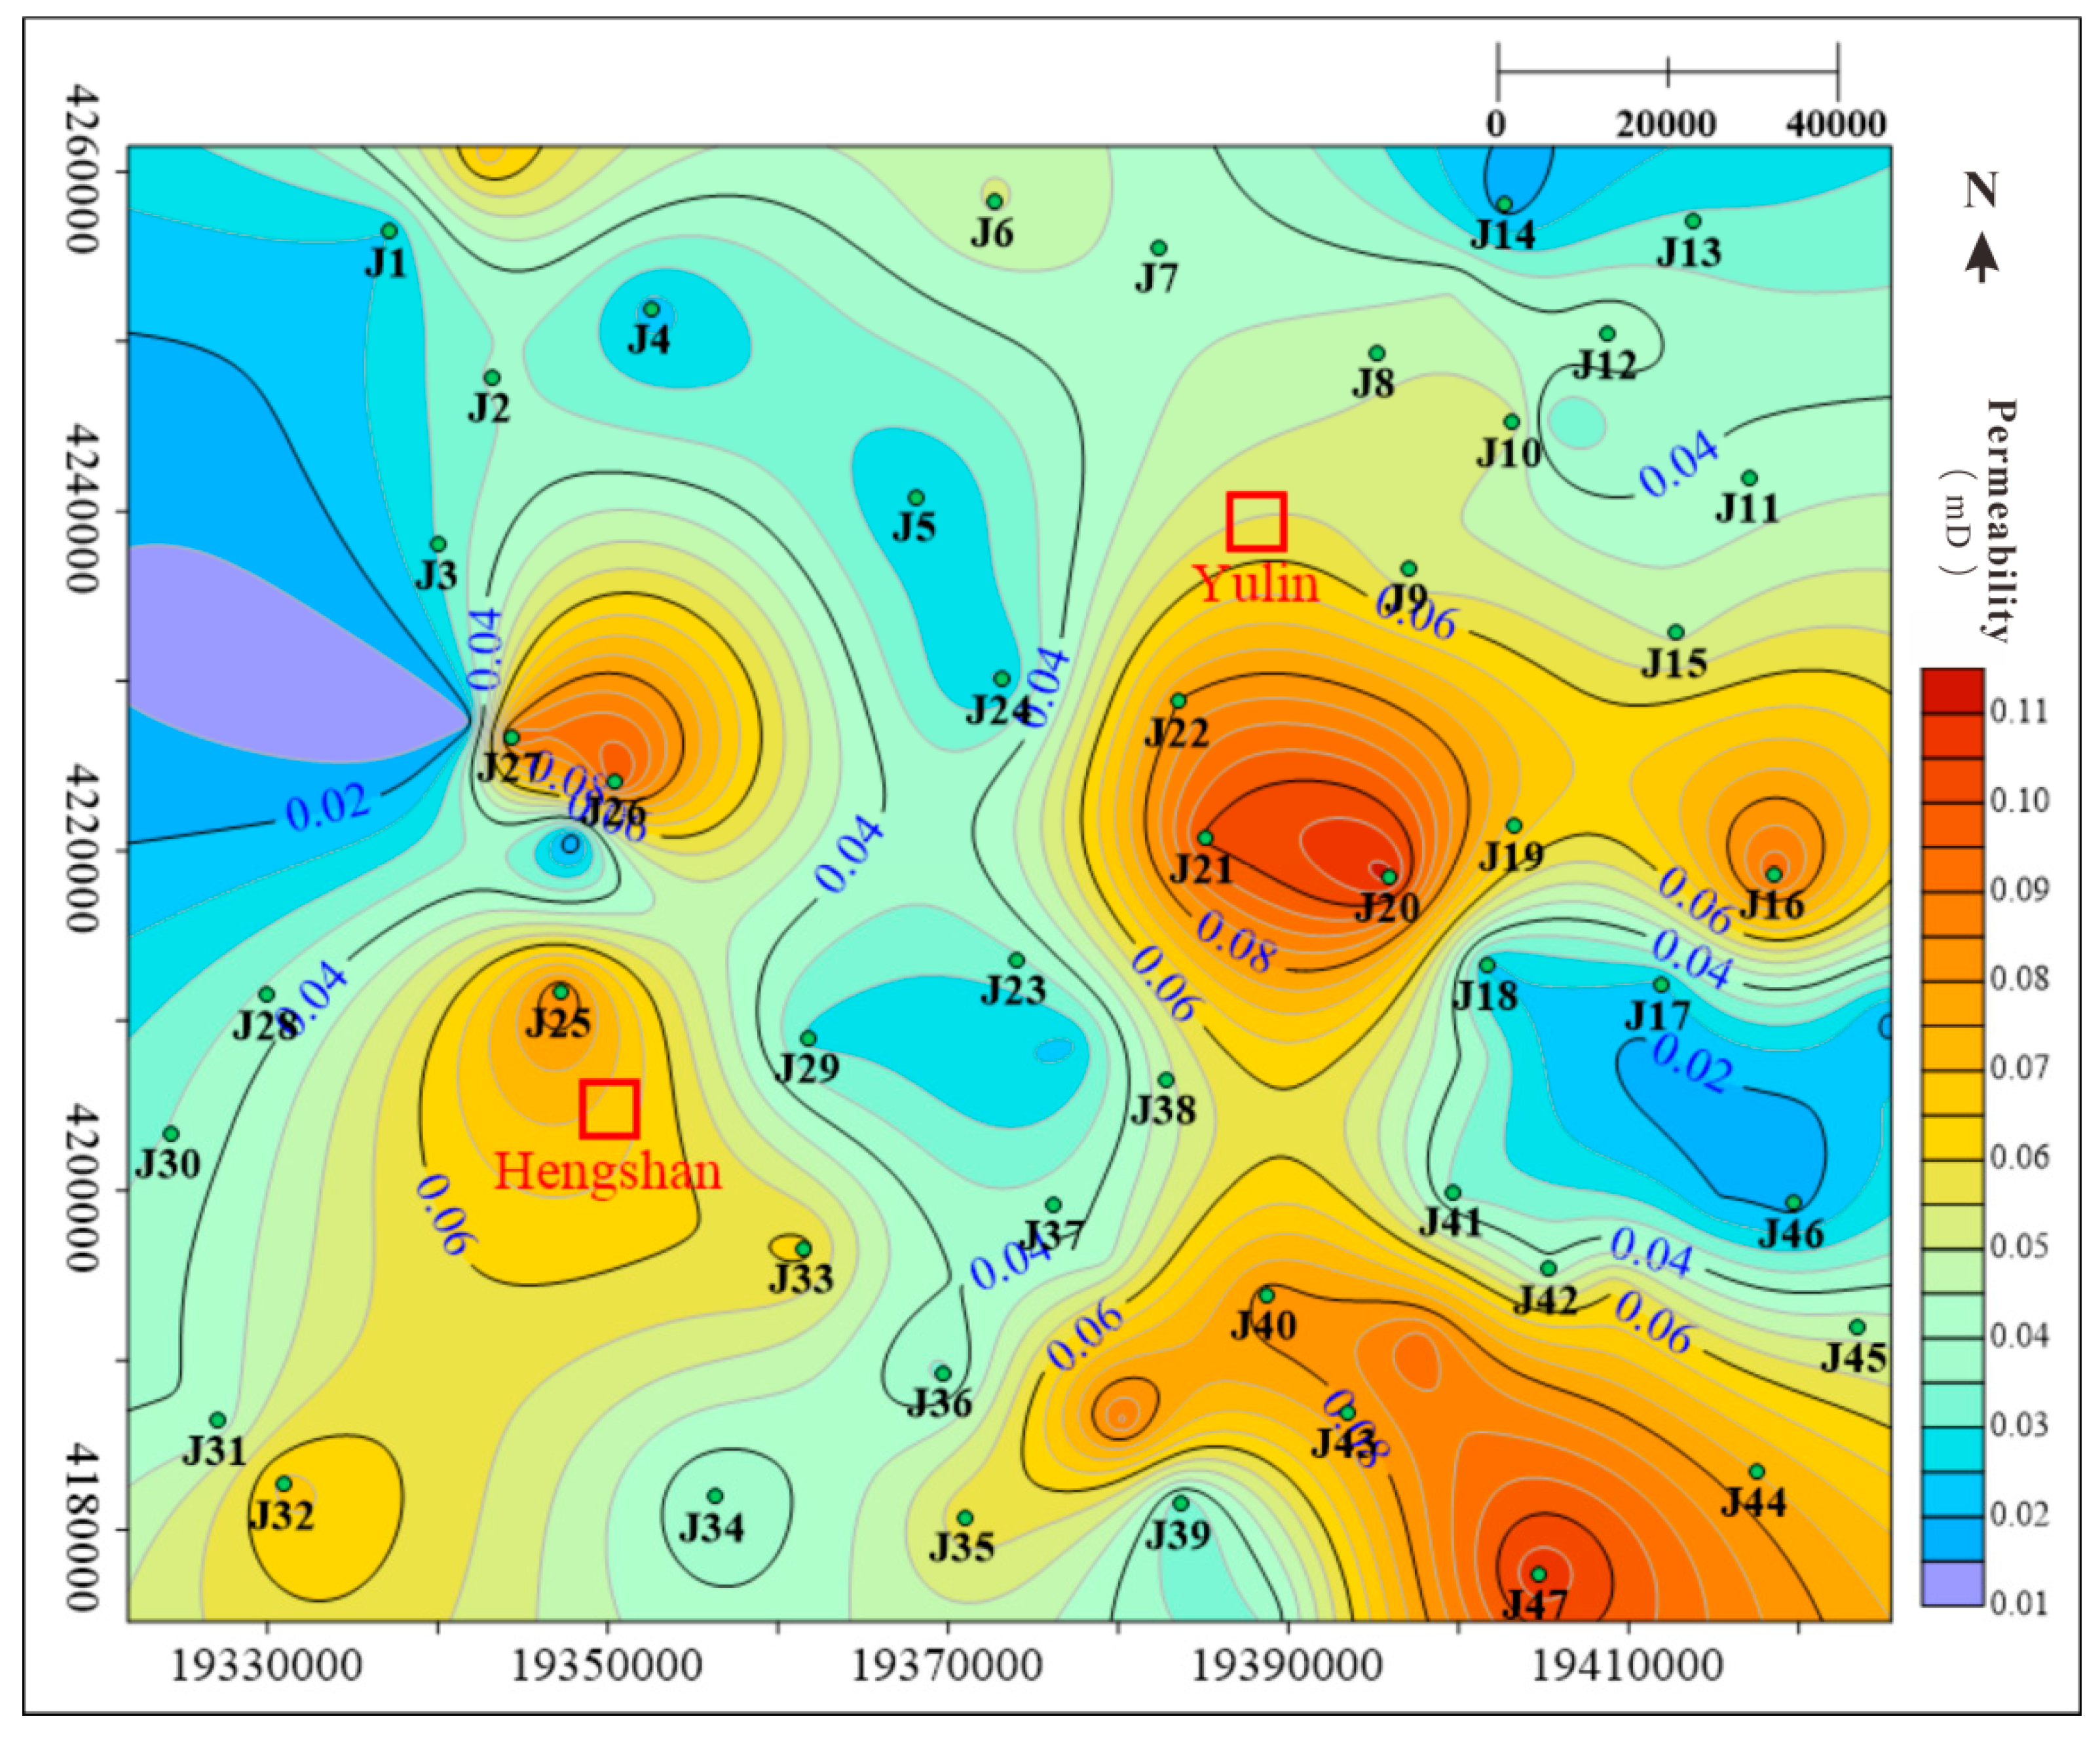
4.1.6. Coal Seam Permeability

The permeability of coal reservoirs is closely related to the entire CBM flow process, serving as the theoretical basis for revealing the laws of CBM seepage. It has a direct impact on the recoverable resources and CBM recovery rate, determining the production and migration of the CBM [49] and impacting the size of the drainage and pressure-lowering funnels in CBM wells, making it one of the key parameters for characterizing the recoverability of the CBM. Its influencing factors are extremely complex, mainly being controlled by the development characteristics of its own fractures. The coal bed pore–fracture system affects the production and migration of the CBM [50,51] and determines the method and type of CBM diffusion and seepage, while the connectivity and development degree determine the ability of fluids to pass through the coal reservoir. The development of fractures will directly influence the desorption, seepage, diffusion, and production of CBM [52].
φ f = R mf R LLS 1 mf
K f = π 2 ( d 1 + r w ) 2 48 φ f 3
Here, φ f is the fracture porosity; R m f is the drilling fluid resistivity, with a value of 0.65; R L L S is the shallow lateral resistivity; K f is the permeability; d 1 is the detected depth of the deep lateral logging area, with a value of 0.27; r w is the radius of the borehole; and m f is the porosity exponent, with a value of 1.6.
Therefore, in this study, the permeability calculation model proposed by Li [53] was selected and combined with the well logging parameters in the study area. After standardization, the porosity of the fracture in the study area was calculated based on Formula (5). Subsequently, by substituting the result into Formula (6), the permeability of the entire No. 8 coal reservoir in the study area was obtained (Figure 11).
The results showed that the overall permeability distribution in the study area ranges from 0.012 mD to 0.112 mD, with an average of 0.048 mD, indicating a low-permeability reservoir. In terms of the planar characteristics, there is an alternating low–high–low–high distribution trend from west to east. Overall, the high permeability values are concentrated in the southeastern part of the study area, making it a favorable area for fracturing and transformation mining, which is related to the well-developed cleats in the rock core samples in this area.

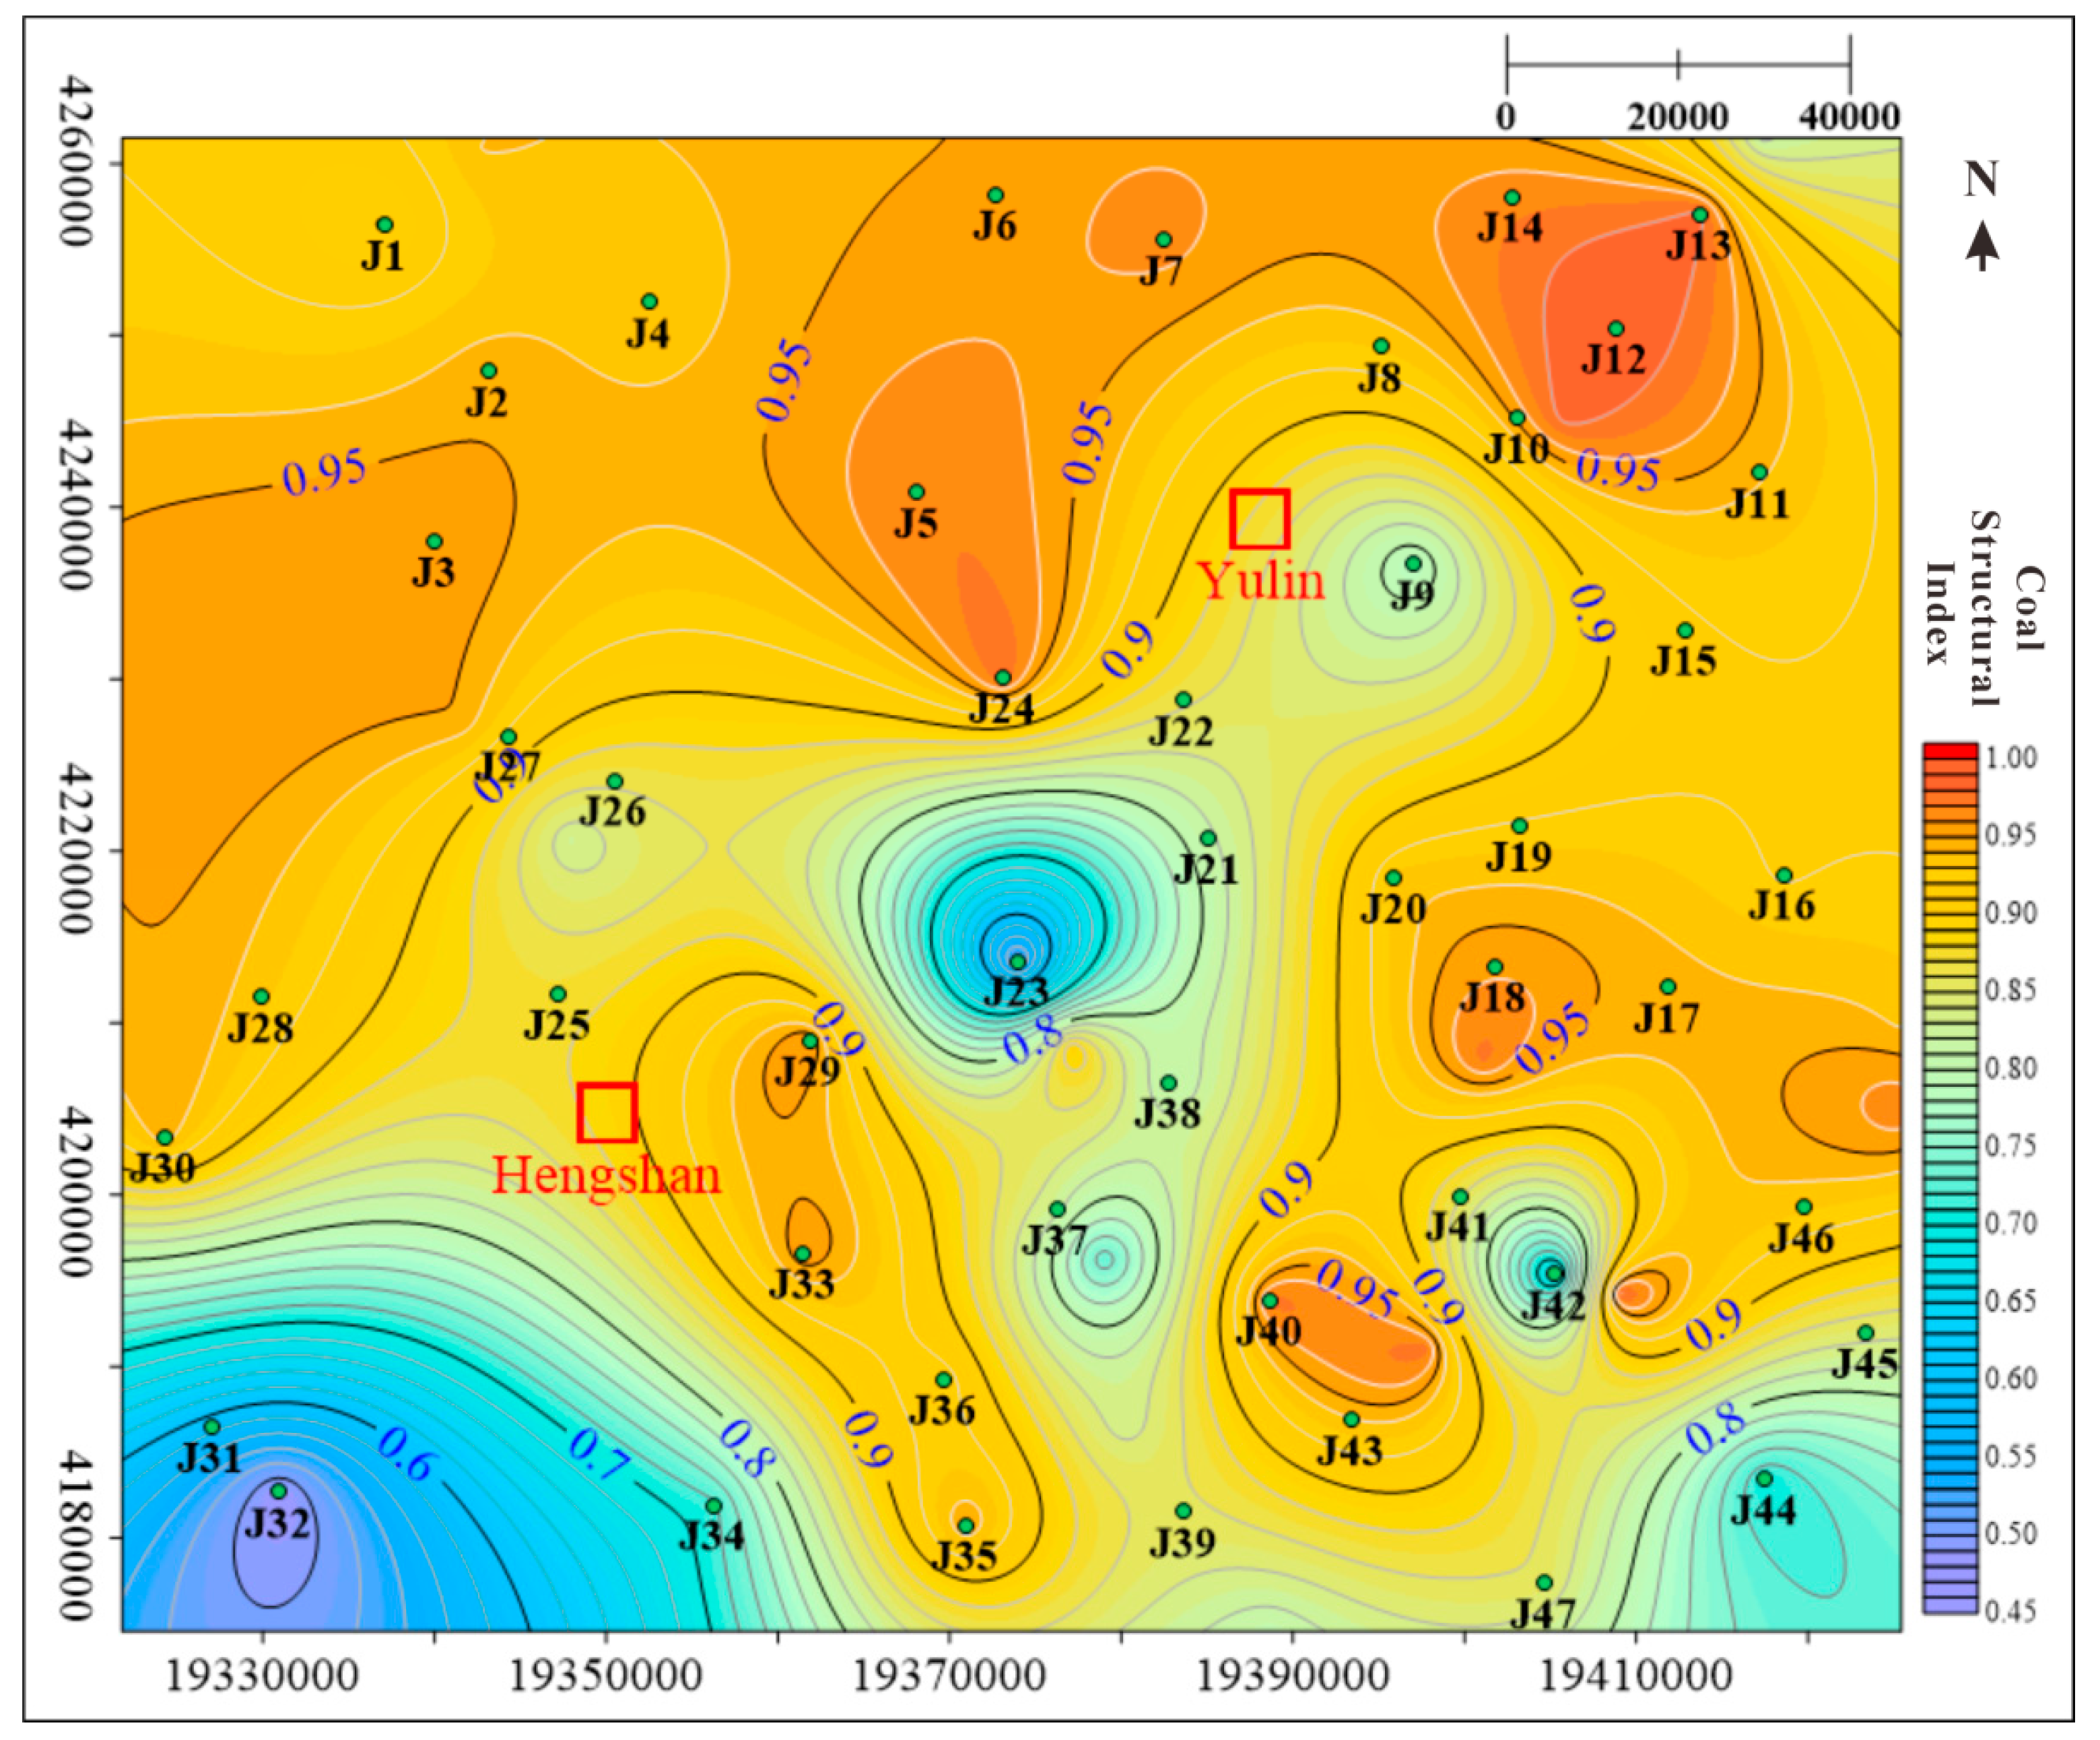
4.1.7. Coal Structural Index

Fracturing modification is an important technique used to improve the production capacity of CBM wells [54], while the coal mass structure is one of the key factors used to determine the effectiveness of hydraulic fracturing activities. On the other hand, the coal structure provides a macroscopic description of the degree of structural deformation. Different coal structures exhibit significant differences in permeability [55], thereby affecting the reservoir mining. Primary coal and fractured coal have good solidity and poor plasticity, and easily form artificial fractures with high conductivity through fracturing. This can effectively enhance the coalbed’s permeability and improve the mining efficiency. Granulated coal and mylonitized coal have strong plasticity, making it difficult for the main fractures to form and meaning that the fractures that do form have poor conductivity [7,56].
The core observation data for seven wells in the region were selected as training data and Pearson’s correlation coefficient was used to determine the parameters, with significant correlations in the well logging responses. The multiple linear regression method was then used to establish a coal structure prediction model for the Yulin region:
Y = 0.0003 × AC 0.0393 × CAL 0.0618 × DEN 0.0024 × GR + 1.2173 × Lg ( RD ) + 0.3466 × Lg ( RS ) 1.1967 × Lg ( RT ) + 1.457
where Y represents the coal structures, AC means acoustic, CAL is the borehole diameter, DEN is the density, GR is the natural gamma ray, RD is the deep double lateral resistivity log, RS is the shallow double lateral resistivity log, RT is the true formation resistivity, and R2 = 0.81.
The single-well prediction results are shown in Figure 12 and are consistent with the actual core observation results. According to the predictions, most of the coal structures in wells across the entire area are composed of primary structural coal, which is extensively developed in the study area. In order to better highlight the characteristics of the body structures in different zones of the study area, the coal structure index F proposed by Fu et al. [7] was used to characterize the degree of coal rock damage. The F value is directly proportional to the completeness of the coal structure, indicating that a larger F value corresponds to a more intact coal structure, which is more conducive to the fracturing and mining of coal reservoirs.
The formula is as follows:
F = (M1 + M2)/M
where M1 is the thickness of the primary structural coal, M2 is the thickness of the fractured coal, and M is the total thickness of the coal seam.
A contour map of the coal structure index for the Yulin Block was drawn (Figure 13); this revealed a general trend of low values in the central area and high values in the surroundings. Additionally, in the northern and eastern parts of the study area, the F values were relatively large, indicating greater suitability for fracturing and development.

4.2. Degree of Affiliation of Evaluation Indexes

Based on the spatial distribution characteristics of the various evaluation indexes in the Yulin region, it was necessary to further quantify the influence of each qualitative and quantitative index on the evaluation results.

4.2.1. Qualitative Index

In this study, the coal roof lithology was the only qualitative index, and its membership was determined by referencing previous classifications [7] and considering the characteristics of the coal seam roof in the Yulin region; thus, the membership function set is shown in Table 8.

4.2.2. Quantitative Indexes

For quantitative indexes, researchers usually use linear membership functions to achieve quantitative representation. The quantitative indexes studied in this paper included the vitrinite reflectance (A11), gas content (A12), coal thickness (A13), burial depth (A21), coal structural index (A31) and coal seam permeability (A32). Different indexes have different judgment criteria. By referring to the Chinese National Standards NB/T 10013-2014 [31], combining previous research results [5,6,7,57], and considering the characteristics of the #8 coal reservoir in the Yulin area, each index parameter value was divided into three intervals. The parameter values in Class I all indicated good reservoir conditions conducive to exploration and development, with a corresponding membership degree of 1. The reservoir parameters with low development benefits were classified into Class III, with a membership degree value of 0.2. The parameters with values falling between Class I and Class III were identified as Class II parameters, and their membership degrees were determined by the corresponding linear function. The specific interval divisions are listed below.
(1)
Vitrinite reflectance
The vitrinite reflectance to some extent reflects the ability of coal reservoirs to adsorb methane. Previous studies [24] suggest that the lower limit of vitrinite reflectance is 1.2%, indicating that coal reserves with reflectance levels lower than this value have poor gas production abilities. Regarding the upper limit of vitrinite reflectance, due to the variations among the different study areas, there is no unified standard yet, although the research indicates that it should not exceed 2.5%, as excessively high reflectance may lead to lower permeability [58]. In this study area, the Yulin Block, the #8 coal generally exhibits a high thermal evolution level, with Ro,max values ranging from 1.65% to 2.39%, indicating strong gas generation abilities overall. To better highlight the regional differences in vitrinite reflectance as an evaluation index, the lower limit was raised to 1.8%, indicating a Class III interval when the reflectance was lower than this value. Simultaneously, the upper limit was raised to 2.1%, indicating a Class I interval when the reflectance was higher than this value. Based on this, the membership function for vitrinite reflectance was established:
A 11 = 1 R o , m a x 2.1 % 8 3 R o , m a x 23 5 1.8 %   R o , m a x < 2.1 % 0.2 R o , m a x > 1.8 %
(2)
Gas Content
The gas content is used to determine whether deep coalbed gas has high productivity potential, and the higher the gas content in coal reservoirs, the greater development value they have. According to the Chinese National Standards NB/T 10013-2014 [31] and previous studies, for medium- to high-rank coal reservoirs, a gas content rate greater than 15 cm3/t is considered highly favorable for reservoir exploration and development. Therefore, this study set the upper limit for the favorable evaluation of gas contents to 15 cm3/t, whereby gas content values higher than 15 cm3/t were classified as Class I intervals with a membership degree of 1. Regarding the minimum gas content required for economical coalbed gas extraction, previous studies suggest that gas content rates below 8 cm3/t do not have development value [22]. However, due to differences in the gas contents among the different blocks, there is no exact standard yet. Since the gas generation capacity of the No. 8 coal in the Yulin area is strong, the gas contents are generally high, ranging from 9.74 m3/t to 23.38 m3/t. To better highlight the differences in gas content for the optimal selection of favorable areas, this study set the lower limit of evaluation to 12 cm3/t. Gas content values below 12 cm3/t were classified as Class III intervals with a membership degree of 0.2. Therefore, the function for the gas content was established:
A 12   = 1 V 15   m 3 / t 4 15 V 3 12   m 3 / t V < 15   m 3 / t 0.2 V > 12   m 3 / t
(3)
Coal seam thickness
The coal seam thickness can control the gas generation potential of deep coalbed gas, and a certain thickness is also a basic requirement for the development of deep coalbed gas resources. According to the standards, coal seams measuring less than 2 m thick are considered to have no development value or to present technical difficulties during development, while coal seams greater than 6 m thick represent the upper limit for coal thickness. Considering the overall stable distribution and thickness of the coal seams in the study area, in order to better highlight regional differences, the lower limit of the coal seam thickness was raised to 4 m and the upper limit was set to 8 m. Therefore, the following function was established:
A 13   = 1 H 8   m 0.2 H 3 4   m H < 8   m 0.2 H > 4   m
(4)
Coal structure index
The coal structure, to some extent, can influence the effectiveness of deep coal seam fracturing and mining activities. This study employed the coal structure index to further quantitatively characterize the coal structures. By combining core observation results with model predictions, the research identified that the #8 coal mainly consists of primary structured coal, with local developments of fractured coal and granular coal, resulting in relatively high coal structure index values. This study referred to previous classification criteria [7] and considered the actual frequency distribution of the coal structures in the study area to better highlight the differential characteristics between regions, setting the upper limit of the Coal Structure Index at 0.95 and the lower limit at 0.8. Therefore, the following function was established:
A 31 = 1 F 0.95 16 3 F 61 15 0.8 F < 0.95 0.2 F > 0.8
(5)
Permeability
Permeability is one of the key parameters characterizing the recoverability of deep CBM and is closely related to the entire CBM flow process. According to the model prediction results, the permeability range in the study area is between 0.012 mD and 0.112 mD. By classifying the CBM evaluation importance parameters proposed by Han [59] and considering the actual frequency distribution of permeability values in the study area, the upper limit of permeability was set to 0.04 mD and the lower limit was set to 0.02 mD to better highlight the differential characteristics between regions. Therefore, the following function was established:
A 32 = 1 K 0.04   mD 40 K 0.6 0.02   mD K < 0.04   mD 0.2 K > 0.02   mD
(6)
Burial Depth
Changes in the coal seam burial depth lead to dynamic changes in the coal reservoir temperature and pressure, which affect the adsorption and desorption process of CBM. An excessive burial depth is not conducive to the desorption of deep CBM, and a too small burial depth is difficult to desorb. Previous studies were largely based on shallow coal reservoirs, which differ significantly from deep coal reservoirs in terms of burial depth. Therefore, based on the #8 coal reservoir having a large burial depth, with the average depth exceeding 2500 m, this study increased the regional difference of evaluation indexes by setting the upper burial depth limit to 2800 m and the lower limit to 3200 m. That is, areas with burial depths greater than 3200 m, which are classified as Class III areas with a membership degree of 0.2, are unfavorable for reservoir development. However, areas with burial depths of less than 2800 m are favorable for deep CBM desorption, leading to high development efficiency levels; these are classified as Class I areas with a membership degree of 1. Based on these factors, the degree of affiliation function for the burial depth was established:
A 21   = 1 D < 2800   m 0.0002 D + 6.6 2800   m D < 3200   m 0.2 D 3200   m

4.3. Comprehensive Evaluation Results

Based on the above discussion, the values for seven evaluation indexes of the #8 coal reservoir in the study area were obtained, including the coal thickness, burial depth, gas content, and permeability. Logging data were obtained for a total of 69 wells in the study area, although due to missing well logging curve data in some wells, only 45 wells’ index values could be accurately predicted. By substituting the seven index values for each well into the evaluation system, the scores of the secondary evaluation indexes were calculated. The evaluation results for some wells are shown in Table 9, Table 10 and Table 11.
By adding up the scores for the secondary indexes, the primary index (comprehensive evaluation index A) for the reservoir was obtained (Table 12). Kriging linear interpolation was conducted to yield the comprehensive evaluation index score for the #8 reservoir for the entire study area, as shown in the Figure 14.
The overall scores for the reservoirs in the study area show a trend of intermediately low values in the center and high values around the periphery. In the southeastern part of the study area, specifically in the vicinity of J40, J42, and J43, the A values reach as high as 0.90. This area is also characterized by high permeability, a high gas content, and high coal thickness values. By combining the gas content tests, it was found that the free gas content of the deep CBM accounts for up to 45% of the total. It is mainly present in large pores and widely developed cleavages and structural fractures, which contribute to the formation of lithological traps and the sealing conditions for cap rock, exerting control over high-yield sweet spots. Therefore, regions with high gas contents also have high comprehensive reservoir scores (A values). Similarly, this indicates that the area has a superior coal thickness, favorable resource conditions, and a relatively complete coal structure, which will make it the focus of subsequent exploration and development.
To better determine the subsequent production and development pilot test area, it was necessary to classify the study area to delineate different types of favorable zones, with reference to previous studies [5,6,7] and in combination with the natural breakpoint method. Based on the distributions obtained from comprehensive reservoir evaluations in the study area, the Yulin region was divided into three different categories of favorable zones (Table 13). Type I areas have A values greater than 0.75, Type II areas have A values ranging between 0.65 and 0.75, and Type III areas have A values of less than 0.65. Based on the contour map, the favorable zones for the geological conditions of the No. 8 coal deep reservoir in the Yulin area were delineated according to the reservoir evaluation grades (Figure 15).
As can be seen in the graph, Type I areas are the most favorable within the study area for the enrichment of CBM and have the highest development potential. This type is widely distributed in the Yulin Block, concentrated in the eastern part of the study area. The overall trend is consistent with the contour maps for the gas content and coal thickness, showing good thickness and continuity, while the gas content is consistently above 15 m3/t. The burial depth here is shallow, and there is a prevalence of primary structural coal with high permeability, making it highly conducive to fracturing and, for the reconstruction of coal reservoirs, providing significant value for exploration and development activities. The Type II sub-favorable area serves as an alternative region for coal rock gas development. The secondary favorable areas in the study area are closely distributed around the edges of the Type I areas, exhibiting good gas characteristics, relatively complete coal structures, and favorable coal seam thicknesses. They possess certain favorable conditions for reservoir development and significant prospects for development. The Type III unfavorable areas represent a general area for CBM development. They are concentrated in the central part of the study area, characterized by low gas contents, thin coal seams, and limited resources. These areas have limestone roofs, poor preservation conditions, and economic risks associated with development.
Due to being in the early stage of the exploration and development of deep CBM in the Yulin area, experimental data from only one drilling well were available for verification. This well is located near well J3 in the favorable Type I study area, focusing on exploring the characteristics of the CBM at a burial depth of around 2300 m [13]. The well’s hydrocarbon gas peak measurements reached 78.5%, and after a sand-fracturing stimulation, the gas production increased rapidly after unloading the liquid. With a 12 mm oil nozzle, the daily gas production rate reached 5.4 × 10⁴ m3, stabilizing at 2.7 × 10⁴ m3 per day as of 21 November 2023, with the cumulative gas production exceeding 1120 × 104 m3. The successful trial at this well confirmed that the favorable consideration of Type I deep CBM areas is reasonable.
Hence, the predicted favorable areas of the #8 coalbed in the Yulin Block are relatively reliable and demonstrate a certain level of accuracy. Overall, in the eastern part of the research area, the coal rock reservoir has a thick coal seam, moderate burial depth, good reservoir properties, weak coal damage, strong sealing abilities, and good geological conditions for the enrichment of deep CBM. This study suggests that the central region should be avoided in the exploration and development of deep CBM in this area and that expansion from the eastern part of the research area should be prioritized.

5. Conclusions

  • The planar distribution characteristics of the No. 8 coal reservoir in the Yulin area have been investigated. The thickness of the coal seam is significant, and the burial depth shows a trend of higher values in the west and lower values in the east. The roof is mostly mudstone, with good resource preservation conditions. The gas content is high, ranging from 9.74 m3/t to 23.38 m3/t. The vitrinite reflectance is high, with most being between 1.65% and 2.39%, showing a good positive correlation with the burial depth. The overall fracture permeability of the reservoir is low, with better coal structure integrity in the northern and eastern parts of the study area, indicating a strong potential for modification.
  • An evaluation system for deep coalbed methane (CBM) reservoirs was established. Based on the characteristics of reservoirs in the Yulin Block, three types of geologically favorable areas have been reasonably classified. Overall, the Yulin Block shows the widespread development of Type I favorable areas, concentrated in the central-eastern, northern, and southwestern parts. Type II sub-favorable areas are closely distributed around the Type I favorable areas. Type III unfavorable areas are concentrated in a very small central part of the study area. Priority should be given to the exploration and development of the central-eastern part of the Yulin Block.

Author Contributions

Conceptualization, K.Z.; data curation, Z.W.; formal analysis, K.Z.; funding acquisition, F.Q.; investigation, S.X.; methodology, K.Z.; project administration, F.Q. and F.S.; software, C.Y.; supervision, J.C.; validation, K.Z.; writing—original draft, K.Z.; writing—review and editing, C.Y. and F.S. All authors have read and agreed to the published version of the manuscript.

Funding

This research and the APC were funded by National Natural Science Foundation of China (Grant no: 42130806).

Data Availability Statement

The data presented in this study are available upon request from the corresponding author.

Acknowledgments

Sincere thanks to all those who contributed to this paper.

Conflicts of Interest

The authors declare no conflict of interest.

References

  1. Li, S.; Qin, Y.; Tang, D.; Shen, J.; Wang, J.; Chen, S. A comprehensive review of deep coalbed methane and recent developments in China. Int. J. Coal Geol. 2023, 279, 104369. [Google Scholar] [CrossRef]
  2. Xu, F.; Yan, X.; Li, S.; Xiong, X.; Wang, Y.; Zhang, L.; Liu, C.; Han, J.; Feng, Y.; Zhen, H.; et al. Theoretical and technological difficulties and countermeasures of deep CBM exploration and development in the eastern edge of Ordos Basin. Coal Geol. Explor. 2023, 51, 115–130. [Google Scholar]
  3. Li, S.; Wang, C.; Wang, H.; Wang, Y.; Xu, F.; Guo, Z.; Liu, X. Reservoir forming characteristics and favorable area evaluation of deep coalbed methane in Daning-Jixian Block. Coal Geol. Explor. 2022, 50, 59–67. [Google Scholar]
  4. Xu, H.; Tang, D.; Tao, S.; Li, S.; Tang, S.; Chen, S.; Zong, P.; Dong, Y. Formation mechanism of geological conditions differences between deep and shallow coalbed methane. Coal Geol. Explor. 2024, 52, 33–39, (In Chinese with English Abstract). [Google Scholar]
  5. Guo, G.; Xu, F.; Liu, L.; Cai, Y.; Qin, W.; Chen, Z.; Deng, J.; Li, Z. Enrichment and accumulation patterns and favorable area evaluation of deep coalbed methane in the Fugu area, Ordos Basin. Coal Geol. Explor. 2024, 52, 81–91, (In Chinese with English Abstract). [Google Scholar]
  6. Li, S.; Wang, H.; Xu, B.; Zhen, H.; Wang, C.; Yuan, P. Influencing factors on gas production effect of acid fractured CBM Wells in deep coal seam of Daning-Jixian Block. Coal Geol. Explor. 2022, 50, 165–172. [Google Scholar]
  7. Fu, X.; Meng, Y.; Li, Z.; Kong, P.; Chang, S.; Yan, T.; Liu, Y. Coalbed Methane Potential Evaluation and Development Sweet Spot Prediction Based on the Analysis of Development Geological Conditions in Yangjiapo Block, Eastern Ordos Basin, China. Geofluids 2021, 2021, 8728005. [Google Scholar] [CrossRef]
  8. Qin, Y.; Moore, T.A.; Shen, J.; Yang, Z.; Shen, Y.; Wang, G. Resources and geology of coalbed methane in China: A review. Int. Geol. Rev. 2018, 60, 777–812. [Google Scholar] [CrossRef]
  9. Li, S.; Tang, D.; Pan, Z.; Xu, H.; Tao, S.; Liu, Y.; Ren, P. Geological conditions of deep coalbed methane in the eastern margin of the Ordos Basin, China: Implications for coalbed methane development. J. Nat. Gas Sci. Eng. 2018, 53, 394–402. [Google Scholar] [CrossRef]
  10. Ju, W.; Shen, J.; Qin, Y.; Meng, S.; Wu, C.; Shen, Y.; Yang, Z.; Li, G.; Li, C. In-situ stress state in the Linxing region, eastern Ordos Basin, China: Implications for unconventional gas exploration and production. Mar. Pet. Geol. 2017, 86, 66–78. [Google Scholar] [CrossRef]
  11. Li, Y.; Tang, D.; Wu, P.; Niu, X.; Wang, K.; Qiao, P.; Wang, Z. Continuous unconventional natural gas accumulations of Carboniferous-Permian coal-bearing strata in the Linxing area, northeastern Ordos basin, China. J. Nat. Gas Sci. Eng. 2016, 36, 314–327. [Google Scholar] [CrossRef]
  12. Jiang, B.; Wang, J.; Qu, Z.; Li, C.; Wang, L.; Li, M.; Liu, J. The stress characteristics of the DaningJixian Area and its influence on the permeability of the coal reservoir. Earth Sci. Front. 2016, 23, 17–23. [Google Scholar]
  13. Zhao, Z.; Xu, W.; Zhao, Z.; Yi, S.; Yang, W.; Zhang, Y.; Sun, Y.; Zhao, W.; Shi, Y.; Zhang, L.; et al. Geological characteristics and exploration breakthroughs of coal rock gas in Carboniferous Benxi Formation, Ordos Basin, NW China. Pet. Explor. Dev. 2024, 51, 234–247+259, (In Chinese with English Abstract). [Google Scholar] [CrossRef]
  14. Yao, Y.; Liu, D.; Tang, D.; Huang, W.; Tang, S.; Che, Y. A Comprehensive Model for Evaluating Coalbed Methane Reservoirs in China. Acta Geol. Sin. 2008, 82, 1253–1270. [Google Scholar]
  15. Zhang, Z.; Qin, Y.; Zhuang, X.; Li, G.; Liu, D. Geological Controls on the CBM Productivity of No.15 Coal Seam of Carboniferous-Permian Taiyuan Formation in Southern Qinshui Basin and Prediction for CBM High-yield Potential Regions. Acta Geol. Sin. 2018, 92, 2310–2332. [Google Scholar]
  16. Guo, G. Comprehensive evaluation study on favorable area of coalbed methane reservoir in southern Shizhuang Block. Coal Sci. Technol. 2019, 47, 200–206. [Google Scholar]
  17. Xiang, W.; Sang, S.; Wu, Z.; Tu, B.; Guo, Z.; Han, S.; Zhou, X.; Zhou, P. Characteristics of coal reservoirs and favorable areas classification and optimization of CBM planning blocks in Guizhou Province. Coal Geol. Explor. 2022, 50, 156–164. [Google Scholar]
  18. Shih, H.S.; Lai, Y.J.; Lee, E.S. Fuzzy approach for multi-level programming problems. Comput. Oper. Res. 1996, 23, 73–91. [Google Scholar] [CrossRef]
  19. Sinha, S. Fuzzy programming approach to multi-level programming problems. Fuzzy Sets Syst. 2003, 136, 189–202. [Google Scholar] [CrossRef]
  20. Abbaszadeh Shahri, A.; Chunling, S.; Larsson, S. A hybrid ensemble-based automated deep learning approach to generate 3D geo-models and uncertainty analysis. Eng. Comput. 2023, 1–16. [Google Scholar] [CrossRef]
  21. Zhang, J.; Wang, H.; Xing, H. Main controlling factors and prediction methods of high yield and enrichment of coalbed methane. Well Test. 2000, 9, 62–65+91, (In Chinese with English Abstract). [Google Scholar]
  22. Li, G. Selection of the favorable coalbed methane (CBM) blocks in eastern Ordos basin. Coal Geol. Explor. 2015, 43, 28–32. [Google Scholar]
  23. Liu, D.; Yao, Y.; Tang, D.; Tang, S.; Che, Y.; Huang, W. Coal reservoir characteristics and coalbed methane resource assessment in Huainan and Huaibei coalfields, Southern North China. Int. J. Coal Geol. 2009, 79, 97–112. [Google Scholar] [CrossRef]
  24. Wang, G.; Qin, Y.; Xie, Y.; Shen, J.; Zhao, L.; Huang, B.; Zhao, W. Coalbed methane system potential evaluation and favourable area prediction of Gujiao blocks, Xishan coalfield, based on multi-level fuzzy mathematical analysis. J. Pet. Sci. Eng. 2018, 160, 136–151. [Google Scholar] [CrossRef]
  25. Chen, Y.; Wang, L.; Li, G.; Zhang, L.; Yang, F.; Ma, Z.; Gao, Z. Prediction of favorable areas for low-rank coalbed methane based on Random Forest algorithm. Reserv. Eval. Dev. 2022, 12, 596–603, 616. [Google Scholar]
  26. Wei, X.; Chen, H.; Zhang, D.; Dai, R.; Guo, Y.; Chen, J.; Ren, J.; Liu, N.; Luo, S.; Zhao, J. Gas exploration potential of tight carbonate reservoirs: A case study of Ordovician Majiagou Formation in the eastern Yi-Shan slope, Ordos Basin, NW China. Pet. Explor. Dev. 2017, 44, 347–357. [Google Scholar] [CrossRef]
  27. GB/T 19559-2021; Method of Determining Coalbed Methane Content. China Coal Industry Association: Beijing, China, 2021.
  28. GB/T 6948-2008; Method of Determining Microscopically the Reflectance of Vitrinite in Coal. China Coal Industry Association: Beijing, China, 2008.
  29. Chatterjee, R.; Paul, S. Classification of coal seams for coal bed methane exploitation in central part of Jharia coalfield, India—A statistical approach. Fuel 2013, 111, 20–29. [Google Scholar] [CrossRef]
  30. Meng, Y.; Tang, D.; Xu, H.; Li, C.; Li, L.; Meng, S. Geological controls and coalbed methane production potential evaluation: A case study in Liulin area, eastern Ordos Basin, China. J. Nat. Gas Sci. Eng. 2014, 21, 95–111. [Google Scholar] [CrossRef]
  31. NB/T 10013-2014; The Procedure and Method of Coalbed Methane Play Evaluation and Selection. Coalbed Methane Standardization Technical Committee of Energy Industry: Beijing, China, 2014.
  32. Saaty, T.L. Axiomatic Fundation of the Analytic Hierarchy Process. Manag. Sci. 1986, 32, 841–855. [Google Scholar] [CrossRef]
  33. Heo, E.; Kim, J.; Boo, K.-J. Analysis of the assessment factors for renewable energy dissemination program evaluation using fuzzy AHP. Renew. Sustain. Energy Rev. 2010, 14, 2214–2220. [Google Scholar] [CrossRef]
  34. Ju, W.; Jiang, B.; Miao, Q.; Wang, J.; Qu, Z.; Li, M. Variation of in situ stress regime in coal reservoirs, eastern Yunnan region, South China: Implications for coalbed methane production. AAPG Bull. 2018, 102, 2283–2303. [Google Scholar] [CrossRef]
  35. Qin, Y.; Shen, J. On the fundamental issues of deep coalbed methane geology. Acta Petrolei Sinica 2016, 37, 125–136. [Google Scholar]
  36. Liu, D.; Yao, Y.; Cai, Y.; Zhang, B.; Zhang, K.; Li, J. Characteristics of Porosity and Permeability and Their Geological Control of Permo-Carboniferous Coals in North China. Geoscience 2010, 24, 1198–1203. [Google Scholar]
  37. Zhou, S.; Liu, D.; Sun, S.; Cai, Y. Factors Affecting Coalbed Methane Enrichment and CBM Favorable Area of Liuhuanggou Area in the Southern Jungger Basin. Geoscience 2015, 29, 179–189. [Google Scholar]
  38. Zou, Z.; Liu, D.; Cai, Y.; Wang, Y.; Li, J. Geological Factors and Reservoir Properties Affecting the Gas Content of Coal Seams in the Gujiao Area, Northwest Qinshui Basin, China. Energies 2018, 11, 1044. [Google Scholar] [CrossRef]
  39. Wang, H.; Shao, L.; Hao, L.; Zhang, P.; Glasspool, I.J.; Wheeley, J.R.; Wignall, P.B.; Yi, T.; Zhang, M.; Hilton, J. Sedimentology and sequence stratigraphy of the Lopingian (Late Permian) coal measures in southwestern China. Int. J. Coal Geol. 2011, 85, 168–183. [Google Scholar] [CrossRef]
  40. Diessel, C.F.K. Utility of coal petrology for sequence-stratigraphic analysis. Int. J. Coal Geol. 2007, 70, 3–34. [Google Scholar] [CrossRef]
  41. Wu, C.; Qin, Y.; Fu, X. Stratum energy of coal-bed gas reservoir and their control on the coal-bed gas reservoir formation. Sci. China Ser. D-Earth Sci. 2007, 50, 1319–1326. [Google Scholar] [CrossRef]
  42. Ou, C.; Li, C.; Zhi, D.; Xue, L.; Yang, S. Coupling accumulation model with gas-bearing features to evaluate low-rank coalbed methane resource potential in the southern Junggar Basin, China. AAPG Bull. 2018, 102, 153–174. [Google Scholar] [CrossRef]
  43. Hou, X.; Liu, S.; Zhu, Y.; Yang, Y. Evaluation of gas contents for a multi-seam deep coalbed methane reservoir and their geological controls: In situ direct method versus indirect method. Fuel 2020, 265, 116917. [Google Scholar] [CrossRef]
  44. Maehlmann, R.F.; Le Bayon, R. Vitrinite and vitrinite like solid bitumen reflectance in thermal maturity studies: Correlations from diagenesis to incipient metamorphism in different geodynamic settings. Int. J. Coal Geol. 2016, 157, 52–73. [Google Scholar] [CrossRef]
  45. Zhang, X.; Yang, X.; Zhou, F.; Ju, P.; Chen, Y.; Cao, Z.; Xia, Y.; Zhang, X. Hydrocarbon yield evolution characteristics and geological significance in temperaturepressure controlled simulation experiment. Nat. Gas Geosci. 2022, 33, 1460–1475. [Google Scholar]
  46. Liu, A.; Fu, X.; Liang, W.; Lu, L.; Luo, P. Pore Distribution Features of Different Rank Coal and Influences to Coal Bed Methane Development. Coal Sci. Technol. 2013, 41, 104–108, (In Chinese with English Abstract). [Google Scholar]
  47. Bustin, R.M.; Clarkson, C.R. Geological controls on coalbed methane reservoir capacity and gas content (vol 38, pg 3, 1998). Int. J. Coal Geol. 1999, 40, 357–358. [Google Scholar]
  48. Yu, Q.; Ren, Z.; Li, R.; Wang, B.; Qin, X.; Tao, N. Paleogeotemperature and maturity evolutionary history of the source rocks in the Ordos Basin. Geol. J. 2017, 52, 97–118. [Google Scholar] [CrossRef]
  49. Li, P.; Zhang, X.; Li, J.; Zhao, J.; Huang, J.; Zhang, S.; Zhou, S. Analysis of the Key Factors Affecting the Productivity of Coalbed Methane Wells: A Case Study of a High-Rank Coal Reservoir in the Central and Southern Qinshui Basin, China. Acs Omega 2020, 5, 28012–28026. [Google Scholar] [CrossRef]
  50. Clarkson, C.R.; Bustin, R.M. The effect of pore structure and gas pressure upon the transport properties of coal: A laboratory and modeling study. 1. Isotherms and pore volume distributions. Fuel 1999, 78, 1333–1344. [Google Scholar] [CrossRef]
  51. Yao, Y.; Liu, D.; Tang, D.; Tang, S.; Che, Y.; Huang, W. Preliminary evaluation of the coalbed methane production potential and its geological controls in the Weibei Coalfield, Southeastern Ordos Basin, China. Int. J. Coal Geol. 2009, 78, 1–15. [Google Scholar] [CrossRef]
  52. Lu, W.; Huang, B.; Zhao, X. A review of recent research and development of the effect of hydraulic fracturing on gas adsorption and desorption in coal seams. Adsorpt. Sci. Technol. 2019, 37, 509–529. [Google Scholar] [CrossRef]
  53. Li, C. Study on Prediction Method of Coal Reservoir Permeability in Southern Qinshui Basin. Master’s Thesis, China University of Geosciences, Beijing, China, 2016. (In Chinese with English Abstract). [Google Scholar]
  54. Tao, S.; Pan, Z.; Tang, S.; Chen, S. Current status and geological conditions for the applicability of CBM drilling technologies in China: A review. Int. J. Coal Geol. 2019, 202, 95–108. [Google Scholar] [CrossRef]
  55. Zhang, X.; Du, Z.; Li, P. Physical characteristics of high-rank coal reservoirs in different coal-body structures and the mechanism of coalbed methane production. Sci. China-Earth Sci. 2017, 60, 246–255. [Google Scholar] [CrossRef]
  56. Wang, Y.; Liu, D.; Cai, Y.; Yao, Y.; Pan, Z. Constraining coalbed methane reservoir petrophysical and mechanical properties through a new coal structure index in the southern Qinshui Basin, northern China: Implications for hydraulic fracturing. AAPG Bull. 2020, 104, 1817–1842. [Google Scholar] [CrossRef]
  57. Yang, S.; Fu, H.; Wang, G.; Yan, D.; Li, Y.; Yao, C.; Zhang, N. Evaluation System and Prediction of Coalbed Methane Exploration Targets in the Southern Junggar Basin. Xinjiang Geol. 2021, 39, 292–296. [Google Scholar]
  58. Meng, Y.; Li, Z.; Tang, S.; Lai, F. Laboratory investigation on methane sorption-induced strain and permeability in middle and high rank coal samples. J. China Coal Soc. 2021, 46, 1915–1924. [Google Scholar]
  59. Han, B. Porosity, Permeability and Favorable Production Region of Coal Reservoirs in Gujiao Block Xishan. Master’s Thesis, China University of Mining and Technology, Xuzhou, China, 2015. (In Chinese with English Abstract). [Google Scholar]
Figure 1. Map of the general geology and stratigraphic column in the Yulin block.
Processes 12 00820 g001
Figure 2. Planar distribution characteristic map of the burial depth of No. 8 coal seam.
Processes 12 00820 g002
Figure 3. Gas reservoir profile chart of J39–J10 in Yulin block.
Processes 12 00820 g003
Figure 4. Planar distribution characteristic map of the roof lithology character of #8 coal.
Processes 12 00820 g004
Figure 5. Sedimentary section of Benxi Formation from J28 to J54.
Processes 12 00820 g005
Figure 6. Sedimentary section of Benxi Formation from J6 to J51.
Processes 12 00820 g006
Figure 7. Planar distribution characteristic map of the thickness of the No. 8 coal seam.
Processes 12 00820 g007
Figure 8. Predicted results of gas content forecasting model.
Processes 12 00820 g008
Figure 9. Planar distribution characteristic map of the gas content of the No. 8 coal seam.
Processes 12 00820 g009
Figure 10. Planar distribution characteristic map of the vitrinite reflectance of the No. 8 coal.
Processes 12 00820 g010
Figure 11. Planar distribution characteristic map of the permeability of the No. 8 coal seam.
Processes 12 00820 g011
Figure 12. Single-well prediction result of J42.
Processes 12 00820 g012
Figure 13. Planar distribution characteristic map of the coal structural index of the No. 8 coal seam.
Processes 12 00820 g013
Figure 14. Map of the comprehensive evaluation score of the No. 8 coal seam in the Yulin block.
Processes 12 00820 g014
Figure 15. Map of the geological comprehensive evaluation of the No. 8 coal reservoir.
Processes 12 00820 g015
Table 1. Partial sample results of coalbed gas content testing.
Sample IDDepth (m)Desorbed Gas Content (m3/t)Residual Gas Content (m3/t)Loss Gas Content (m3/t)Total Gas Content (m3/t)
J27-33101.33–3101.6117.020.024.0921.13
J27-43101.85–3102.2318.260.026.6524.93
J27-73103.08–3103.3615.770.074.0619.91
J27-123103.92–3104.1215.330.072.9618.36
J27-153104.84–3105.0411.610.024.9316.56
J42-12628.00–2628.3518.110.151.4026.04
J42-32629.15–2629.5316.740.201.4924.80
J42-52631.02–2631.4015.320.171.3823.24
J42-82632.39–2632.7220.400.14 1.7923.65
J42-132635.53–2635.8816.610.15 1.0519.13
Table 2. Results of coalbed vitrinite reflectance testing.
WellAverage Depth (m)Ro,max (%)
J273102.912.06
J313403.201.92
J392975.51.85
J422629.702.03
J462374.911.52
J483276.152.04
J492883.331.90
J503403.261.85
J512736.151.99
Table 3. Evaluation index system of deep CBM in the Yulin area.
Primary IndexA Reservoir Comprehensive Evaluation Index
Secondary IndexesA1 Resources ConditionA2 Storage ConditionA3 Mining Condition
Tertiary indexesA11 Vitrinite reflectanceA21 Burial depthA31 Coal structural index
A12 Gas contentA22 Coal roof lithologyA32 Coal seam permeability
A13 Coal seam thickness
Table 4. The value range of the pairwise comparison of indexes at the same level.
Importance DegreeCoefficient Value
extremely important≥3
very important2–3
somewhat important1–2
equal important1
somewhat unimportant1/2–1
unimportant1/3–1/2
extremely unimportant≤1/3
Table 5. The importance of each index layer relative to the target layer.
Judging MatrixCharacteristic VectorMaximum Characteristic Root (%)
A1A2A3
A111/52/50.593
A25120.12
A35/21/210.29
A11A12A13
A1111/3.21/1.80.173
A123.211.50.51
A131.81/1.510.32
A21A22
A2114/50.562
A225/410.44
A31A32
A3114/50.562
A325/410.44
Table 6. Weight for comprehensive geological evaluation of #8 coal seams.
Primary IndexSecondary IndexesWeightTertiary IndexesWeightTotal Weight
Reservoir comprehensive evaluation indexA1Resources condition0.59A11Vitrinite reflectance0.170.100
A12Gas content0.510.301
A13Coal seam thickness0.320.189
A2Storage condition0.12A21Burial depth0.560.067
A22Coal roof lithology0.440.053
A3Mining condition0.29A31Coal structural index0.560.162
A32Coal seam permeability0.440.128
Table 7. Subdivision table of degree of affiliation of indexes.
Evaluation IndexesClass IntervalDegree of Affiliation
Resources conditionGas content≥151
12–154/15 × V − 3
<120.2
Coal seam thickness≥81
4–80.2 × H − 0.6
<40.2
Vitrinite reflectance≥2.11
1.8–2.18/3 × Ro,max − 23/5
<1.80.2
Storage conditionBurial depth<28001
2800–3200−0.0002 × D + 6.6
≥32000.2
Coal roof lithologic charactermudstone1
limestone0.8
sandstone0.6
Mining conditionCoal structural index≥0.951
0.8–0.9516/3 × F − 61/15
<0.80.2
Coal seam permeability≥0.041
0.02–0.0440 × K − 0.6
<0.020.2
Table 8. Membership partition table for qualitative index.
Coal Roof LithologyMembership Degree
Mudstone1
Limestone0.8
Sandstone0.6
Table 9. Resource condition score table of some wells.
WellRo,max (%) M11A11V (m3/t)M12A12H (m)M13A13A1
J12.2641.0000.10011.0150.2000.0606.2600.6520.1230.283
J32.2371.0000.10013.7410.6640.2008.3521.0000.1890.489
J62.1341.0000.10013.9210.7120.21410.3721.0000.1890.503
J141.9710.6550.06618.2521.0000.3018.2801.0000.1890.556
J152.0120.7640.07617.1471.0000.3016.2720.6540.1240.501
J201.8940.4500.04517.1651.0000.3014.0200.2040.0390.385
J231.9430.5820.0589.7390.2000.0603.4260.2000.0380.156
J352.1961.0000.10017.8181.0000.3013.5520.2000.0380.439
J372.1131.0000.10017.3821.0000.3014.6920.3380.0640.465
J402.0470.8590.08620.0771.0000.30110.0201.0000.1890.576
Note: In order to more conveniently express the values in the table, M represents the membership degree of the evaluation index. In the table, A11 is an exact value, obtained by multiplying the membership degree by weight.
Table 10. Storage condition score table of some wells.
WellD (m)M21A21RM22A22A2
J13124.7600.3500.023sandstone0.6000.0320.055
J33091.3040.4170.028mudstone1.0000.0530.081
J62963.4980.6730.045limestone0.8000.0420.087
J142758.8801.0000.067mudstone1.0000.0530.120
J152808.8420.9820.066mudstone1.0000.0530.119
J202660.5201.0000.067sandstone0.6000.0320.099
J232721.5981.0000.067sandstone0.6000.0320.099
J353038.3520.5230.035mudstone1.0000.0530.088
J372934.4160.7310.049mudstone1.0000.0530.102
J402855.2200.8900.060limestone0.8000.0420.102
Note: In the table, R represents the coal roof lithology.
Table 11. Mining condition score table of some wells.
WellFM31A31K (mD)M32A32A3
J10.8990.7260.1180.0250.4010.0510.169
J30.9581.0000.1620.0300.6180.0790.241
J60.9521.0000.1620.0511.0000.1280.290
J140.9661.0000.1620.0170.2000.0260.188
J150.9170.8230.1330.0491.0000.1280.261
J200.9330.9080.1470.1121.0000.1280.275
J230.5110.2000.0320.0340.7620.0980.130
J350.9501.0000.1620.0581.0000.1280.290
J370.8260.3380.0550.0380.9100.1160.171
J400.9731.0000.1620.0821.0000.1280.290
Table 12. The total evaluation score of each well in the Yulin Block.
WellAWellA
J10.508J360.770
J20.694J370.738
J30.811J380.678
J40.738J400.968
J50.750J440.618
J60.881J470.676
J70.758J520.841
J90.673J530.942
J130.859J540.721
J140.863J560.523
J150.881J570.731
J160.893J580.786
J170.831J590.870
J200.758J600.909
J230.385J610.885
J240.752J620.788
J250.829J630.726
J290.814J640.807
J300.686J650.864
J320.643J670.882
J330.937J680.774
J340.789J690.676
J350.817
Table 13. The interval of different types of favorable areas.
TypesType I
Favorable Area
Type II
Sub-Favorable Area
Type III
Unfavorable Area
Interval(0.4, 0.65](0.65, 0.75](0.75, 1]
Disclaimer/Publisher’s Note: The statements, opinions and data contained in all publications are solely those of the individual author(s) and contributor(s) and not of MDPI and/or the editor(s). MDPI and/or the editor(s) disclaim responsibility for any injury to people or property resulting from any ideas, methods, instructions or products referred to in the content.

