

The Material Balance of Complex Separation Flowsheets

Lomonosov Institute of Fine Chemical Technologies, MIREA—Russian Technological University, Moscow 119454, Russia
*
Author to whom correspondence should be addressed.
Processes 2024, 12(4), 821; https://doi.org/10.3390/pr12040821
Submission received: 27 March 2024
/
Revised: 9 April 2024
/
Accepted: 17 April 2024
/
Published: 18 April 2024
(This article belongs to the Topic Advanced Heat and Mass Transfer Technologies)
Abstract
:The paper shows the expediency of supplementing the balance simplex method by calculating the number of free variables of separation flowsheets containing recycle flows. The need to determine and set the free variables that provide lower energy consumption when calculating the material balance of flowsheets with recycling is justified. The problem of material balance multivariance is illustrated, and ways to solve it are shown with the example of separation flowsheets for two ternary mixtures: n-butanol + water + toluene and n-butanol + butyl acetate + water. Separation flowsheets containing three distillation columns and a liquid–liquid separator are proposed for both systems. The dependence of the recycle flow values and the energy consumption of distillation columns and separation flowsheets on the selection and setting of values of free variables in solving the balance problem is shown. The dependence of energy consumption on the composition of the original mixture is studied for an n-butanol + butyl acetate + water system. Recommendations for setting free variables for flowsheets of the separation of ternary mixtures with three binary (and one ternary) azeotropes are formulated. The technique of highlighting the region of separation flowsheet operability is illustrated. The column operating parameters that ensure the production of products of a given quality with minimal energy consumption are determined. It is shown that with the incorrect selection and setting of variables (during balance task solvation), the energy consumption for mixture separation can be overestimated by more than 40%.
1. Introduction
Material balance is the basis of process design. It gives a characteristic for all material streams that are presented in a flowsheet. This information is needed both for the design and for the operation control. The energy consumption of the technology depends on the material balance [1,2,3,4,5]. Process and operating parameter optimization is carried out at all stages of flowsheet creation in order to reduce energy consumption. It is possible to optimize both an individual device and the entire flowsheet. Optimization, as will be shown in the present paper, is also possible at the stage of solving the balance task. And it Is connected to the choice of such a solution, for which the minimum values of recycling flows will be observed and the energy consumption will eventually be minimal [6].
Technological flowsheets for the separation of azeotropic mixtures can be conditionally divided into several types: linear (there are no recycling streams), separation complex (there is at least one recycling stream) and flowsheet “complex within a complex”, when there is internal and external recycling. The calculation of the material balance of the flowsheet of the first type is not difficult: the calculation is carried out from one device to another. We can say that the number of freedom degrees of such a flowsheet (when calculating the material balance) is zero [2], i.e., there is always one solution. The same applies to binary mixture separation complexes (even in the presence of a recycle flow, the solution of the balance task is determined). The balance task may have not one, but several solutions, which leads to the problem of multivariance and the choice of the optimal option. This situation is observed for flowsheets of the second and third types.
When separating azeotropic mixtures, preference is often given to processes requiring the introduction of additional substances, for example, extractive or azeotropic distillation. The extractive distillation process can be called universal in this sense [7,8]. Calculating the material balance of flowsheets based on these methods is not difficult. The main task is to determine the required amount of separating agent [8].
Energy-efficient separation techniques include methods based on a combination of distillation and splitting processes [9,10]. This is due to the following reasons: firstly, splitting is a spontaneous process (does not require energy consumption); secondly, the columns located after liquid–liquid separation are often stripping, i.e., a minimal reflux is needed, which reduces the energy intensity of the process; thirdly, a situation often arises when the concentration of a component in one of the liquid layers meets the product requirements and no further purification is required.
However, given the fact that such flowsheets are based on different but inter-related processes, and, as a rule, contain recycling flows, solving the balance task may present difficulties. These difficulties are due to the need to select and set parameters so that the balance problem can be solved.
The material balance of a flowsheet without a recycle flow can be calculated sequentially, taking each unit in turn (the flow out of one device is the feed to the next one). The more complex the flowsheet structure (especially in the presence of recycling), the more difficult the material balance task. If the flowsheet contains recycling, then the flow will not be known at the point where the recycling is returned as it depends on the flows that have not been calculated yet. Two methods for solving the problem are known: “the cut and try method” and “the algebraic method” [1]. There is one another method (graphical) based on the construction of material balance line diagrams [11]. In the present paper, we will not dwell in detail on the description of these methods. It is important to note that the researcher often has to face the problem of the multivariance of calculating material balance, i.e., when there is not one, but many solutions to the balance task [12,13]. This problem is related to the need to select and set free variables necessary to solve the problem. Obviously, the optimal option will be the one for which the lowest energy consumption will be observed in the future.
In the present paper, it is proposed to improve the method of balance simplices [11] by supplementing it with a method for calculating the number of free variables of complex separation flowsheets. Such an addition will make it possible to exclude solutions that do not make physical sense, to determine the limiting possibilities of the process in distillation columns (the assessment of the possibility of reaching the boundaries of distillation regions), as well as to formulate recommendations on the choice of variables for which minimum values of recycle flows are observed. The problem of the multivariance of the balance problem and the ways to solve it are illustrated by the example of an n-butanol + water + toluene ternary system. The dependence of the values of the material flows on the choice of and setting the value of free variables is shown.
The possibilities of the proposed approach are illustrated by the example of a separation flowsheet for an n-butanol + butyl acetate + water ternary mixture of different original composition. The proposed separation flowsheets and the determined columns’ operating parameters can be used to develop a separation technology for the considered mixtures.
2. Computational Methods
The thermodynamic modeling of the phase equilibria of the n-butanol (B) + water (W) + toluene (T) and n-butanol (B) + butyl acetate (BA) + water (W) systems was based on the NRTL [14] equation using Aspen Plus v10.0 (AspenTech, Bedford, MA, USA). The choice of the model was due to the presence of components with limited mutual solubility in the mixture. The model allowed for such systems to be described with a high degree of accuracy.
where ; ; ; ; ; .
The parameters of the NRTL model were taken from the AspenPlus V.10.0 database.
A comparison between the evaluated and experimental parameters (the boiling temperature of pure components, azeotrope characteristics (composition and boiling temperature) (Table 1) and compositions of liquid phases corresponding to the liquid−liquid equilibrium (LLE) (Table 2)) was made. If the relative standard uncertainty (ur) of the description of VLE and LLE was less than 0.05, the set of parameters was used for further calculations (phase equilibrium studies and the simulation of the distillation process) as follows:
where a can be presented as temperature (T) or concentration (x).
3. Theoretical Analysis
3.1. n-Butanol + Water + Toluene Ternary System
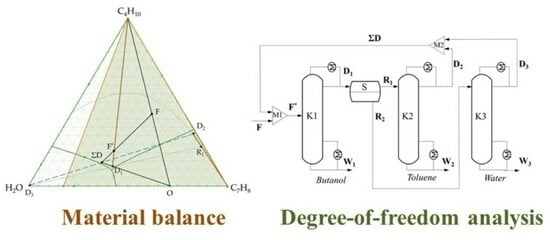
The phase diagram of the n-butanol + water + toluene ternary system contains three binary and one ternary azeotrope (Table 1). In addition, two pairs of components (n-butanol + water and toluene + water) are characterized by limited mutual solubility (Figure 1a). A significant part of the composition triangle is covered by a two-phase splitting region. All azeotropes except for n-butanol + toluene belong to this region. It makes it possible to use a special method based on a combination of distillation and splitting processes to separate the mixture. The composition of the original mixture (B: 0.782, W: 0.15, T: 0.068 mol. frac.) belongs to the distillation region with n-butanol as the stable node. It allows for the separation of n-butanol in the bottom of the first distillation column (K1) (Figure 1b). The composition of the distillate in this case belongs to one of the separatric curves or the ternary azeotropes. The distillate flow can be directed to a liquid–liquid separator, after which, the organic layer is sent to the second column (K2) for toluene purification, and the water one is sent to column K3 for water separation. Distillate flows of columns K2 and K3 form a recycling stream, which is directed to K1 (Figure 1b).
The composition of point F* formed by the mixing of the feed flow and the recycle flow is unknown. However, the position of this point can be determined graphically. To achieve this, it is necessary to build a balance net consisting of lines of material balances for various spatiotemporal contours (one or more apparatuses). An example of building a balance net and determining point F* by the graphical method is given below.
First, it is necessary to write down the material balance of the whole flowsheet as follows:
F = W1 + W2 + W3,
Denote the sum of W2 + W3 by
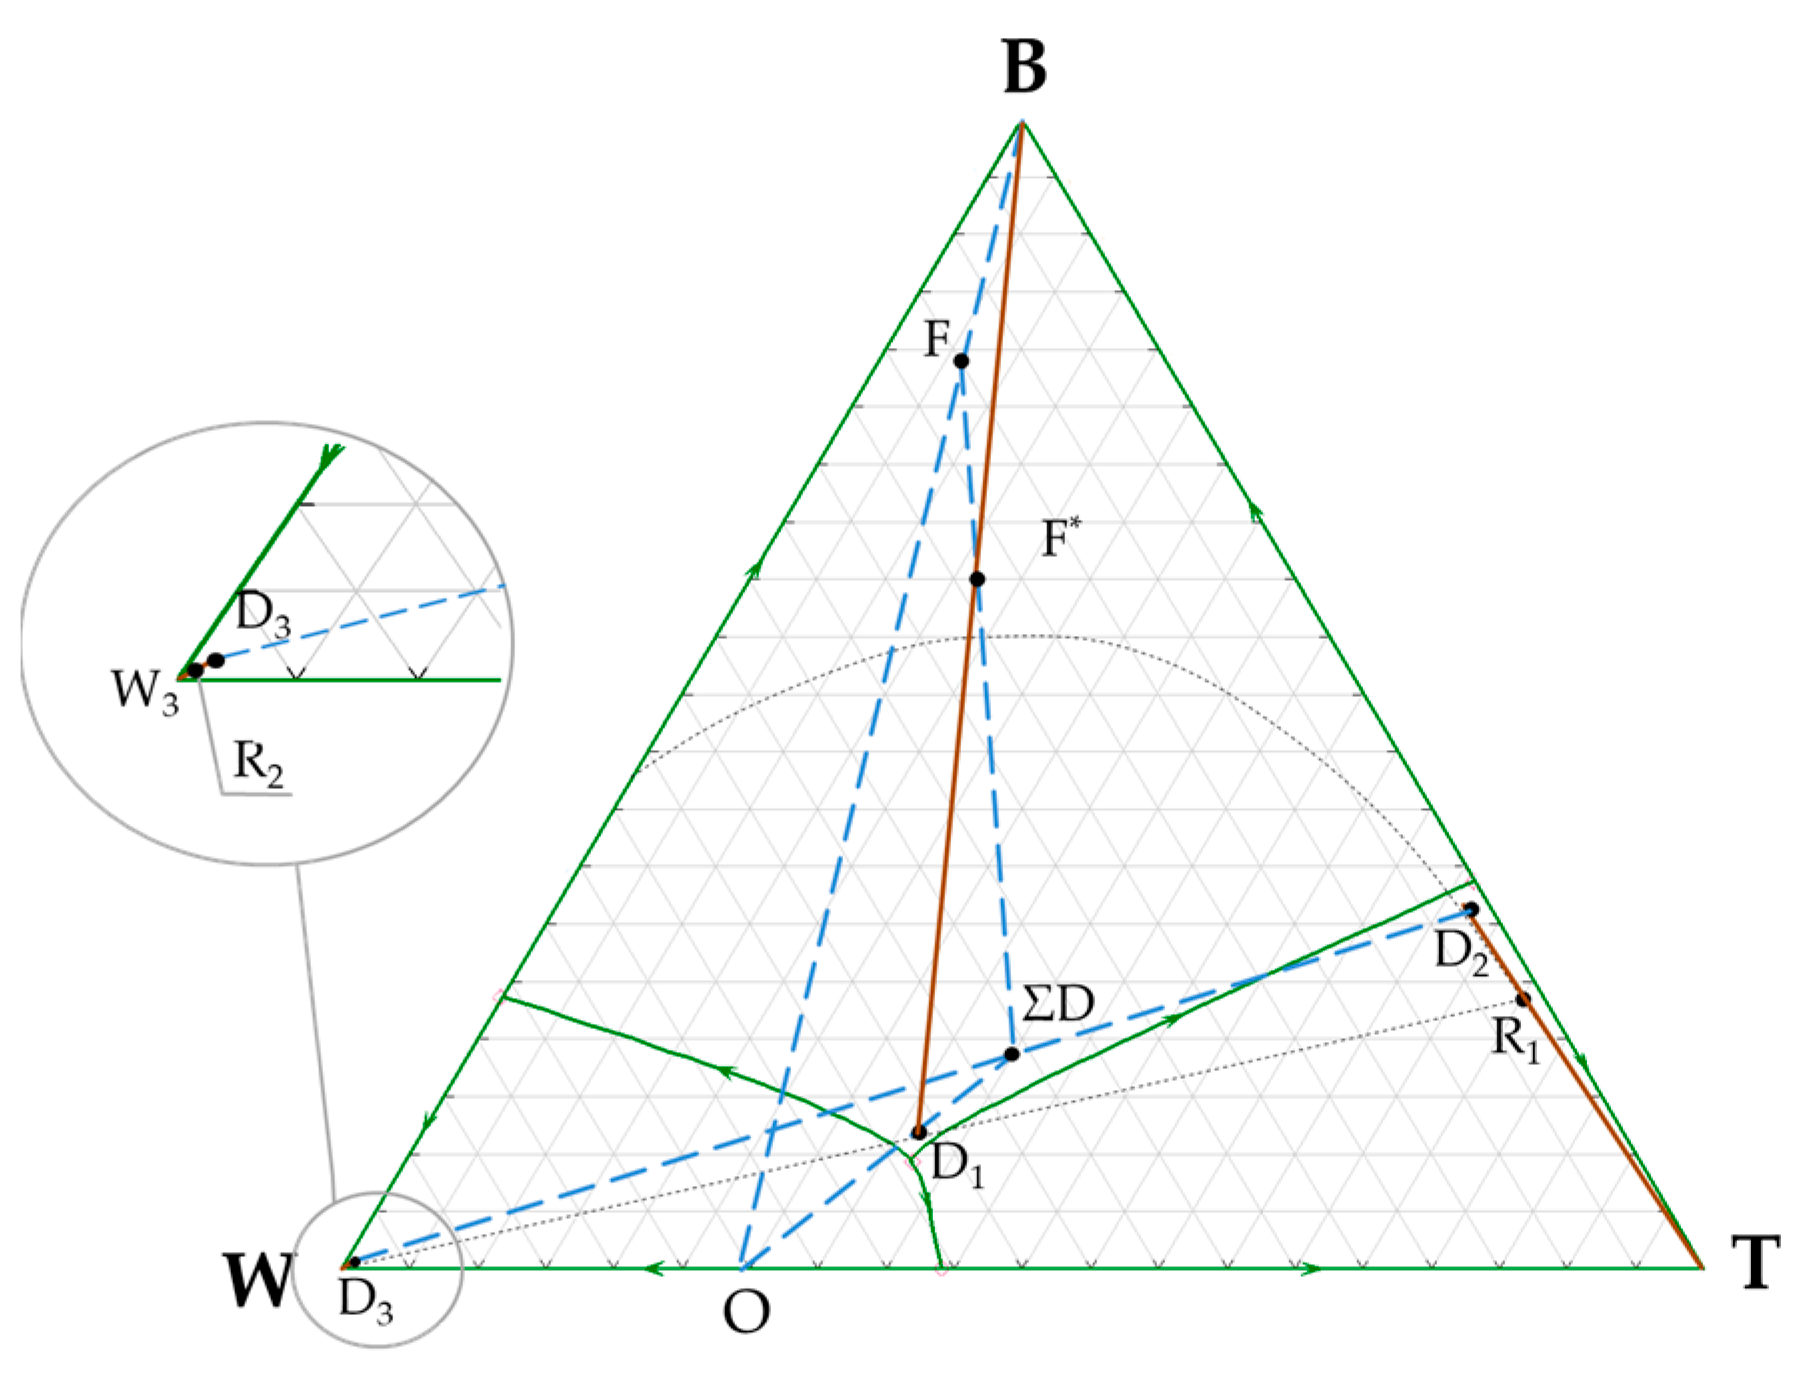
where point O belongs to the binary constituent water + toluene (Figure 2).
O: W2 + W3 = O,
Let us consider the contour combining the separator, the second and the third distillation columns (S-K2-K3):
D1 = W2 + W3 + D2 + D3 = O + ΣD.
The point corresponding to the composition of the recycle flow (ΣD) is a continuation of a line passing through points D1 and O and it belongs to the D2 and D3 flow-mixing line. By setting the position of point D1, it is possible to determine the coordinates of point ΣD by plotting balance lines (Figure 2).
Point F* will be located at the intersection of the material balance lines corresponding to the mixer (M1) and distillation column (K1) as follows:
for mixer M1: F + ΣD = F*
for column K1: F* = D1 + W1
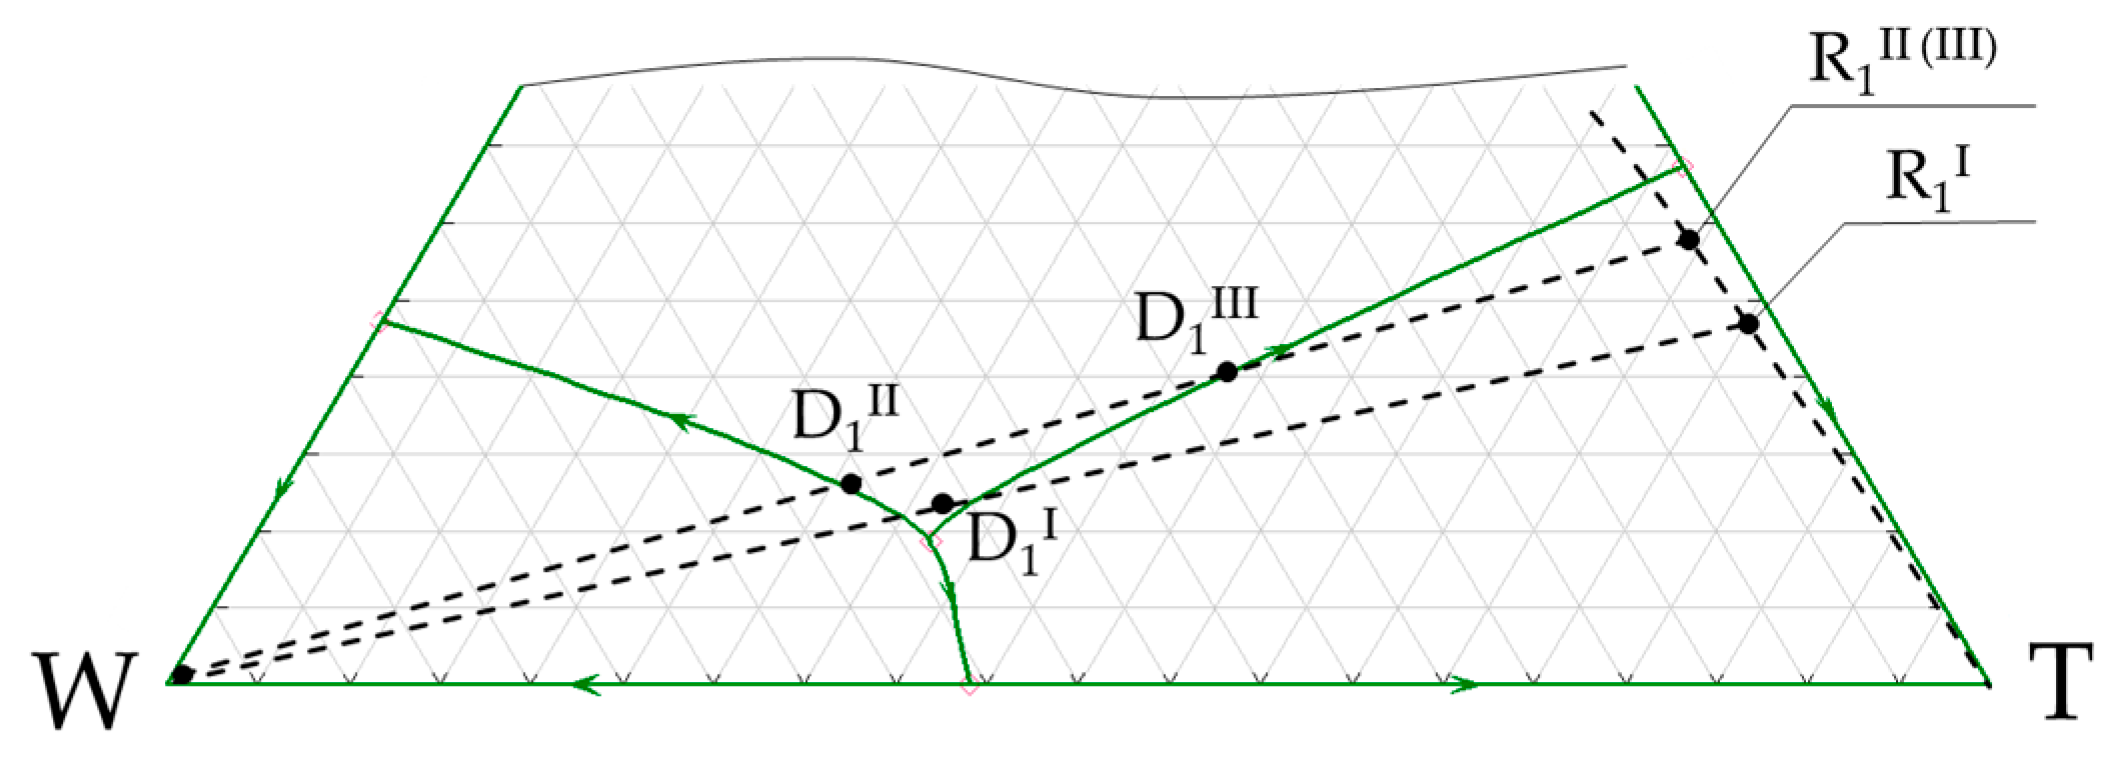
To calculate the material balance of the flowsheet (to determine the amounts and compositions of all material flows), it is necessary to select and set free variables [12]. The number of variables depends on the number of material flows. Each flow is characterized by the amount and composition (two independent concentrations for the ternary system). The number of flows in the flowsheet considered is 11, and therefore, the number of variables is 33. The independent equations are the equations of the material balances of the apparatuses (general and for components): 18 equations for the flowsheet in Figure 1b. Thus, the number of freedom degrees is 15. It should be also taken into account that the amount and the composition of the original mixture (three variables), the compositions of the two layers in the separator (liquid–liquid equilibrium data) (four variables) and requirements for the composition of three product streams (six variables) are known. There are two free variables left that need to be set in order to calculate the material balance. As for the latter, the authors [12] recommend setting the position of point D1 and D3 for the flowsheet of the same structure. Let us consider three variants of point D1’s location: (1) near the ternary azeotrope (variant I, Figure 2); (2) on the separatric line generated by the saddle azeotrope B + W (variant II); (3) on the separatric line generated by the saddle azeotrope B + T (variant III). The compositions of the liquid layers in the separator (S) will depend on the choice of this variable (Figure 3).
It should be noted that in this paper, the position of point D3 remains fixed (the effect of changing this parameter on energy consumption was considered by us earlier in [12]). Point D3 belongs the separatric line for each of the variants.
The amount and the composition of all material flows of the flowsheet considered are determined for three variants (Table 3, Table 4 and Table 5).
The balance nets are built and the position (composition) of point F* is determined using the graphical method (variant I—Figure 2, variant II—Figure 4, variant III—Figure 5). The compositions obtained by the calculated and graphical method coincide.
The water layer leaving the separator can be a product flow (no additional purifying is required; it is possible to abandon column K3). However, we purposefully leave the column to illustrate the construction of the balance net and to demonstrate the contribution of the column’s energy consumption to the total flowsheet energy consumption.
The simulation of the distillation process was carried out to assess the effect of the flows values on the operating parameters of the columns and the energy consumption of the flowsheet (Table 6). The procedure for optimizing parameters is standard and described in detail in the literature [13]. The results are given in Table 4 (the concentration of the main component in the product flow for all flowsheets is B—0.996; W—1.000; T—0.994 mole frac.).
Figure 6 shows a comparison of energy consumption for individual columns and the flowsheet for the three variants considered.
The main contribution to the flowsheet energy consumption is made by the energy consumption of column K1 (Figure 6). The ratio of water and organic layers in the separator is close to unity for variant I. An increase (variant II) or decrease (variant III) in this ratio leads to an increase in the distillate flows of columns K3 and/or K2, which negatively affects the energy consumption of not only these columns, but also of column K1 (the recycle flow increases).
If the R2 flow quality meets the technical requirements, then the separation flowsheet can abandon column K3. The refusal of this distillation column for variant II is fundamental, since in this case, the energy consumption of the flowsheet will be comparable to the energy consumption of the flowsheet of variant III.
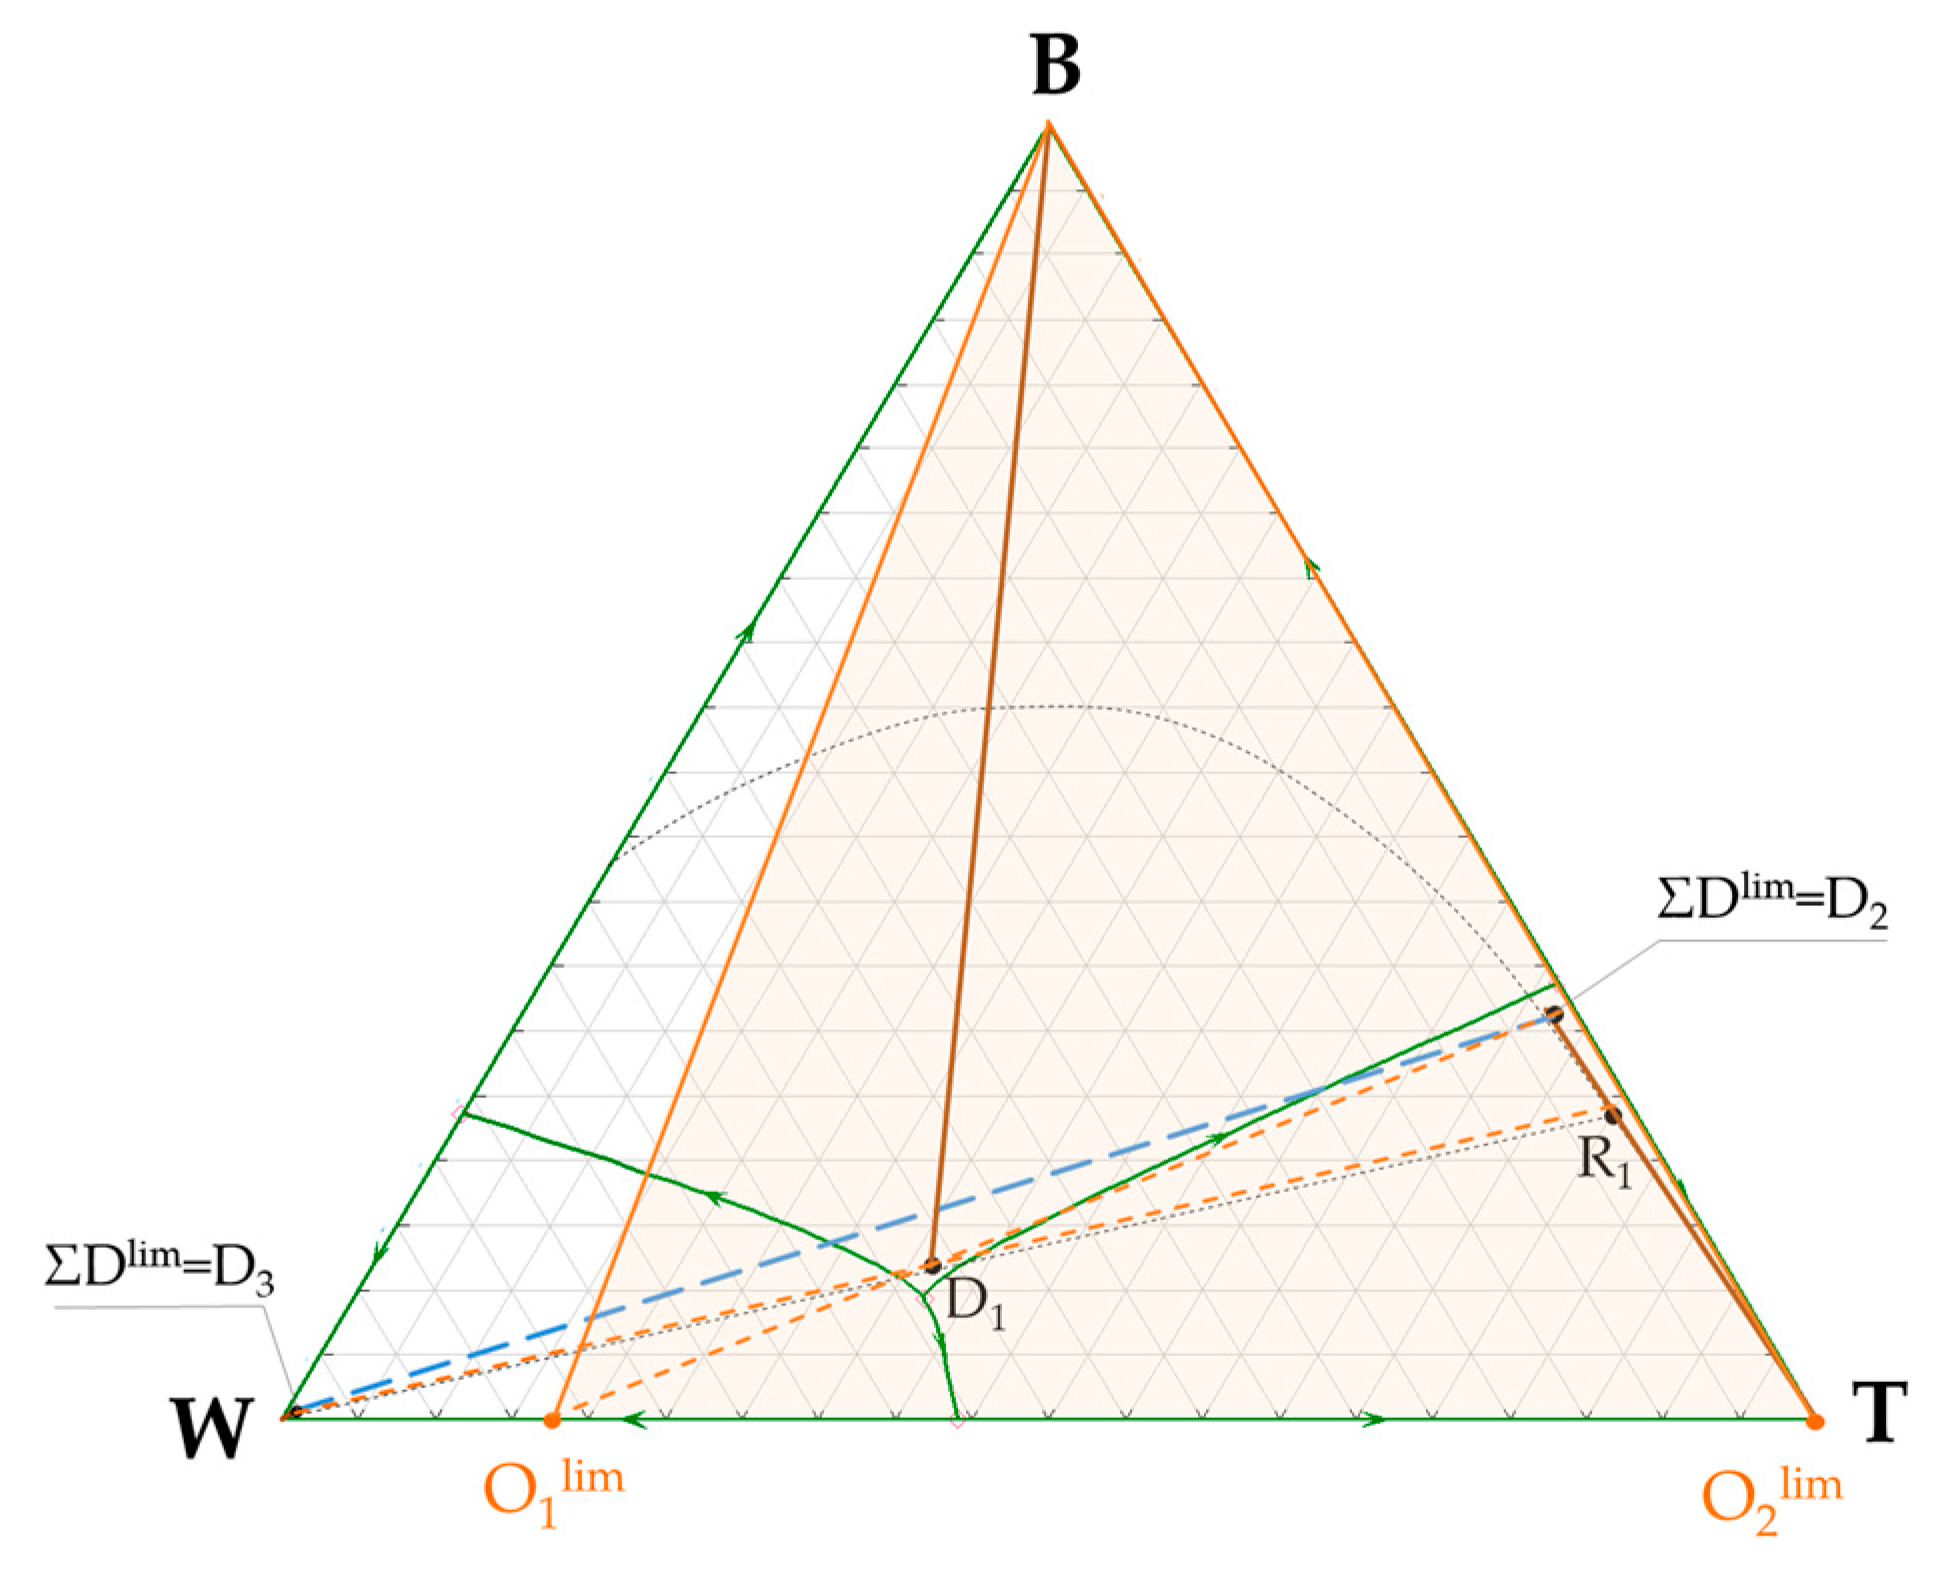
The separation flowsheet under consideration will be workable not only for a given composition of the original mixture, but for a group of compositions. The graphical method allows the region of the flowsheet’s operability under the conditions considered to be highlighted. To highlight the boundaries of this region, it is necessary to determine the limit positions of point O (O1lim and O2lim). The latter can be determined from Equation (3), given that the limiting values of ΣD (ΣDlim) will be points D2 and D3. Point O1lim will be located on the line passing through points D2 and D1, O2lim—points D3 and D1 (Figure 7).
Line D3–D1 intersects the boundary of composition triangle B + T; however, since point O must belong to the binary constituent W + T, O2lim coincides with the point of the pure toluene. The region of the flowsheet’s operability is highlighted in color in Figure 7. In accordance with Equation (3), the boundaries of the operability region will be lines B(W1)-O1lim and B(W1)-O2lim. It is possible to build a balance net for any composition within this region (the construction technique is described above); lines O-D1 and D2–D3 will always intersect.
If the composition of the mixture is located outside the selected region, then the separation of the mixture using the flowsheet considered is impossible (Figure 8). There is no intersection between lines O-D1 and D2-D3; therefore, the position of point ΣD cannot be determined.
3.2. n-Butanol + Butyl Acetate + Water Ternary System
The effect of the mixture’s original composition on the separation flowsheet energy consumption will be considered using the example of this system.
The phase diagram of the system considered as well as the separation flowsheet are characterized by the same structure discussed above (Figure 9).
The compositions of the original mixture (B/BA/W) are located on the same secant: variant I—0.85/0.052/0.098; variant II—0.74/0.09/0.17; variant III—0.6/0.138/0.262 mol. frac. (Figure 10). The feed flow is 100 kmol/h for all variants.
The number of free variables, as in the previous case, is two. To solve the balance task and build a balance net, the position of points D1 and D2 is set (Figure 10). The difference between this system and the previous one is that it is extremely difficult to separate the ternary azeotrope in the distillate of the first column due to the contact of the separatrices.
The results of calculating the material balance (the ratio of the amount of columns’ distillate and bottom flows (separator layers)) for different original compositions and different locations of point D1 (two tie-lines are considered, A and B—Figure 9a) are shown in Table 7; the constructed balance net is shown in Figure 10.
The ratio of distillate and bottom flows in all columns for tie-line B is lower compared to tie-line A. The D/W ratio in the column K1 increases with a decrease in the butanol concentration in the original mixture and remains constant in the other two columns (K2 and K3). The optimization of the column operation parameters was carried out for case B, for which smaller distillate flows and total recycling are observed. The results are shown in Table 8 (the concentration of the main component in the product flow for all flowsheets is B—0.997; W—1.000; T—0.985 mole frac.).
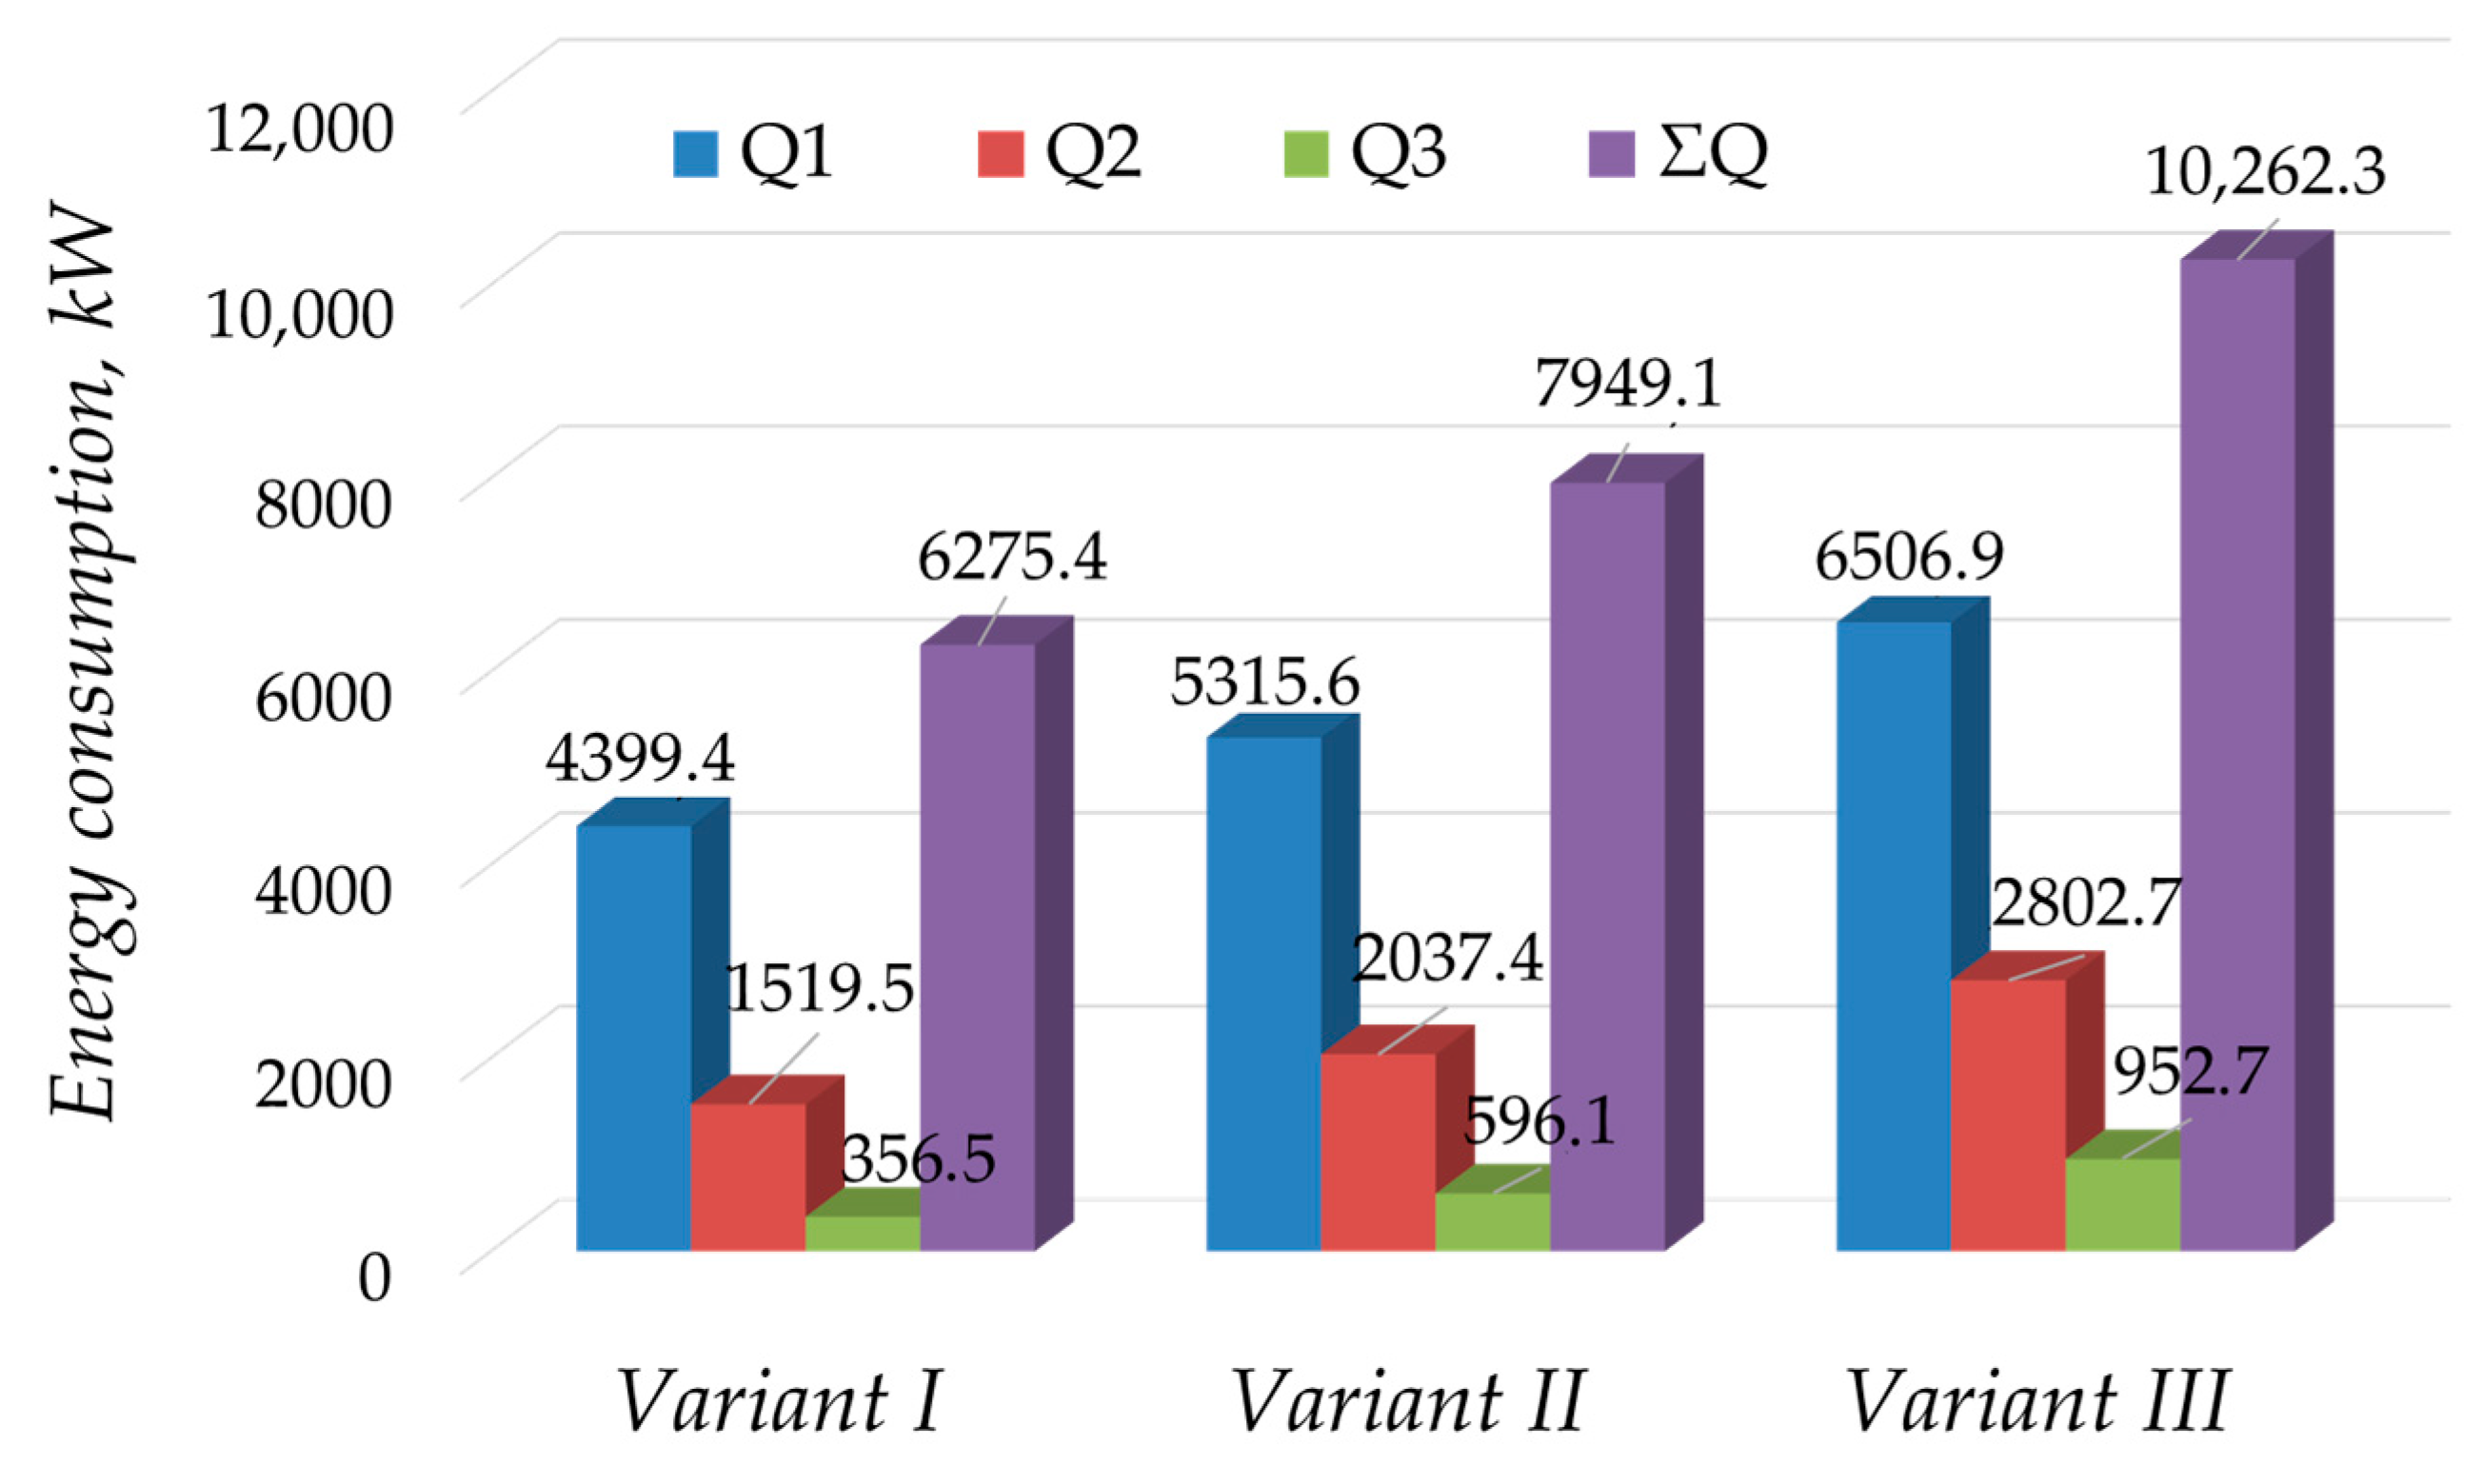
Figure 11 shows a comparison of energy consumption for individual columns and the flowsheet for the three variants considered.
The main contribution to energy consumption is made by column K1. The lower the n-butanol content in the original mixture, the higher the energy consumption of the flowsheet. If we consider any other tie-line lying above the previously considered one, then by graphically constructing the balance net, one can see that D1/W1 and D2/W2 will increase significantly, which will lead to an increase in the flowsheet energy consumption. For a number of tie-lines, the flowsheet will be inoperable (the composition of the flow R1 belongs to the distillation region with a stable node B).
4. Discussion
Restrictions on the use of a specific structure flowsheet for the separation of an azeotropic mixture may be related not only to the features of phase behavior (restrictions in the form of azeotropes, separatrices and features of the mutual arrangement of tie-lines and separatric lines), but also to the specifics of the material balance (limited access to the boundaries of distillation regions, overestimated values of distillate flows due to incorrect choice and setting free variables).
The expediency of supplementing the balance simplex method with a method for calculating the number of freedom degrees of separation flowsheets (for calculating the material balance) is shown with the example of n-butanol + water + toluene ternary mixture separation. Separation flowsheets containing three distillation columns and a liquid–liquid separator are proposed for both systems. The multivariance of calculating the material balance of the flowsheet depending on the choice of free variables is illustrated. Three variants of calculating the material balance differing in setting one of the free variables, in particular, the composition of the distillate of the first column, are considered. For all variants, the distillation process was simulated and the columns’ operating parameters as well as the flowsheet energy consumption were determined. The dependence of the material flow values, the columns’ operating parameters, as well as the energy consumption of columns and the flowsheet as a whole on the choice and assignment of free variables is illustrated. The lowest values of column distillate flows and, as a consequence, the lowest energy consumption are observed for variant I.
The dependence of the flowsheet energy consumption on the mixture’s original composition is shown using the example of the n-butanol + butyl acetate + water ternary system. The limitations of the choice and setting of free variables associated with increases in distillate flows, recycle flow and energy consumption are shown.
The column operating parameters that ensure the production of products of a given quality with minimal energy consumption were determined.
Based on the results obtained, it can be concluded that when separating mixtures of class 3.3.1–2 [26] (present paper) and 3.3.0–2 [26] (these are the most common structures in ternary systems with three binary azeotropes) using the flowsheet of the considered structure, it is recommended to set the composition of a ternary (class 3.3.1–2) or binary (class 3.3.0–2) heteroazeotrope as D1. In this case, the D/W ratio in the first column and the value of the recycle flow will be minimal. When choosing the second variable, preference should be given to the distillate composition of the column in which the concentration of the first component (separated in the bottom of the first column) is higher in the feed flow.
Considering the separation flowsheet with a liquid–liquid separator, it is necessary to take into account the contribution of distillate flows to the columns’ energy consumption. Columns into which the flows leaving the separator are fed, as a rule, are stripping or require minimal reflux. An increase in the D/W ratio may have a slight effect on the energy consumption of the stripping column but leads to a noticeable increase in the energy consumption of the column, the distillate flow in which is formed from distillates of other columns.
The change in the composition of the mixture supplied for the separation is possible in any technological process. Therefore, it is very important to know the boundaries of the region of flowsheet operability, so that, if necessary (the composition is located on the border or outside the region), it can be transferred to a region favorable for separation (for example, due to directional recycling). The technique of distinguishing the boundaries of such a region is illustrated by the example of the ternary n-butanol + water + toluene system and its separation flowsheet.
The data obtained show that when selecting and specifying different free variables for calculating the material balance, the difference in total energy consumption can reach more than 40%.
Author Contributions
Conceptualization, A.F. (Anastasia Frolkova) and A.F. (Alla Frolkova); methodology, A.F. (Anastasia Frolkova); software, M.S.; validation, A.F. (Anastasia Frolkova) and K.L.; formal analysis, A.F. (Anastasia Frolkova); investigation, A.F. (Anastasia Frolkova) and M.S.; resources, A.F. (Alla Frolkova); writing—original draft preparation, A.F. (Anastasia Frolkova); writing—review and editing, A.F. (Anastasia Frolkova); visualization, M.S.; supervision, A.F. (Anastasia Frolkova); project administration, A.F. (Alla Frolkova); funding acquisition, A.F. (Alla Frolkova). All authors have read and agreed to the published version of the manuscript.
Funding
This research was funded by the Ministry of Education and Science in the framework of the State task on the topic no. FSFZ-2023-0003.
Data Availability Statement
The data presented in this study are available in [https://www.finechem-mirea.ru/jour/article/view/29] at [https://doi.org/10.32362/2410-6593-2016-11-3-47-57], reference number [12]. These data were derived from the following resources available in the public domain: [https://www.finechem-mirea.ru].
Conflicts of Interest
The authors declare no conflicts of interest.
References
- Sinnott, R.K. Chemical Engineering. In Chemical Engineering Design, 4th ed.; Elsevier: Oxford, UK, 2005; Volume 6, pp. 34–57. [Google Scholar]
- Timofeev, V.S.; Serafimov, L.A.; Tymoshenko, A.V. Principles of the Technology of Basic Organic and Petrochemical Synthesis; Textbook for Universities; Higher School: Moscow, Russia, 2010; pp. 9–13. (In Russian) [Google Scholar]
- Felder, R.M.; Rousseau, R.W. Elementary Principles of Chemical Processes, 6th ed.; Pearson: London, UK, 1995; pp. 250–310. [Google Scholar]
- Chopey, N.P. (Ed.) Handbook of Chemical Engineering Calculations; McGraw-Hill: New York, NY, USA, 1984; pp. 348–360. [Google Scholar]
- Kostikova, N.A.; Glukhan, E.N.; Kazakov, P.V.; Antonova, M.M.; Klimov, D.I. Assessment of resource-saving technologies in low-tonnage chemical industries for compliance with best available technologies principles. Fine Chem. Technol. 2023, 18, 187–218. [Google Scholar] [CrossRef]
- Seidel, T.; Hoffmann, A.; Bortz, M.; Scherrer, A.; Burger, J.; Asprion, N.; Küfer, K.-H.; Hasse, H. A novel approach for infeasible path optimization of distillation-based flowsheets. Chem. Eng. Sci. X 2020, 7, 100063. [Google Scholar] [CrossRef]
- Gerbaud, V.; Rodriguez-Donis, I.; Hegely, L.; Lang, P.; Denes, F.; You, X. Review of Extractive Distillation. Process design, operation optimization and control. Chem. Eng. Res. Des. 2019, 141, 229–271. [Google Scholar] [CrossRef]
- Raeva, V.M.; Stoyakina, I.E. Selecting Extractive Agents on the Basis of Composition-Excess Gibbs Energy Data. Russ. J. Phys. Chem. A 2021, 95, 1779–1790. [Google Scholar] [CrossRef]
- Prayoonyong, P.; Jobson, M. Flowsheet synthesis and complex distillation column design for separating ternary heterogeneous azeotropic mixtures. Chem. Eng. Res. Des. 2011, 89, 1362–1376. [Google Scholar] [CrossRef]
- Petlyuk, F.B.; Danilov, R.Y. Synthesis of separation flowsheets for multicomponent azeotropic mixtures on the basis of the distillation theory. Presynthesis: Prediction of feasible product compositions. Theor. Found. Chem. Eng. 2000, 34, 236–254. [Google Scholar] [CrossRef]
- Serafimov, L.A.; Frolkova, A.K.; Pavlenko, T.G. Determination of conditions for existence of stationary regimes of complexes with recycles for ternary mixture separation. Theor. Found. Chem. Eng. 1992, 26, 281–286. (In Russian) [Google Scholar]
- Frolkova, A.V.; Ablizin, M.A.; Mayevskiy, M.A.; Frolkova, A.K. The multivariate calculation of material balances of flowsheets for separating ternary mixtures of different physical-chemical nature. Fine Chem. Technol. 2016, 11, 47–57. [Google Scholar] [CrossRef]
- Frolkova, A.V.; Frolkova, A.K.; Podtyagina, A.V.; Spiryakova, V.V. Energy savings in flowsheets based on combination in splitting and distillation processes. Theor. Found. Chem. Eng. 2018, 52, 771–778. [Google Scholar] [CrossRef]
- Renon, H.; Prausnitz, J.M. Local compositions in thermodynamic excess functions for liquid mixtures. AIChE J. 1968, 14, 135–144. [Google Scholar] [CrossRef]
- Orr, V.; Coates, J. Versatile vapor-liquid equilibrium still. Ind. Eng. Chem. 1960, 52, 27–30. [Google Scholar] [CrossRef]
- Gomis, V.; Font, A.; Saquete, M.D. Homogeneity of the water + ethanol + toluene azeotrope at 101.3 kPa. Fluid Phase Equilib. 2008, 266, 8–13. [Google Scholar] [CrossRef]
- Gorbunov, A.N.; Susarev, M.P.; Balashova, I.M. Liquid-Vapor Equilibrium in the System Isobutyl Acetate-n-Butyl Alcohol-Toluene. Zh. Prikl. Khim. 1968, 41, 312–316. [Google Scholar]
- Gomis, V.; Font, A.; Saquete, M.D.; Garcia-Cano, J. Phase equilibria of the water + 1-butanol + toluene ternary system at 101.3 kPa. Fluid Phase Equilib. 2015, 385, 29–36. [Google Scholar] [CrossRef]
- Wu, Y.-Y.; Pan, D.-T.; Zhu, J.-W.; Chen, K.; Wu, B.; Ji, L. Liquid–liquid equilibria of water + 2,3-butanediol + isobutanol at several temperatures. Fluid Phase Equilib. 2012, 325, 100–104. [Google Scholar] [CrossRef]
- Hirata, M.; Hirose, Y.; Kagaku, K. Vapor-liquid equilibria of ternary system water–acetic acid–n-butyl acetate. Chem. Eng. 1966, 30, 121–127. [Google Scholar] [CrossRef]
- González, E.; Ortega, J. Densities and Isobaric Vapor−Liquid Equilibria for the Mixtures Formed by Four Butyl Esters and 1-Butanol. J. Chem. Eng. Data 1996, 41, 53–58. [Google Scholar] [CrossRef]
- Zhuchkov, V.I.; Nazanskiy, S.L.; Solokhin, A.V.; Frolkova, A.K. Determination of azeotropes in the n-butanol–n-buthylacetate–water system. Chem. Technol. Org. Subst. 2022, 21, 12–19. (In Russian) [Google Scholar]
- Escudero, I.; Cabezas, J.L.; Coca, J. Liquid-Liquid Equilibria for 2,3-Butanediol + Water + 4-(1-Methylpropyl) phenol + Toluene at 25 °C. J. Chem. Eng. Data 1996, 41, 2–5. [Google Scholar] [CrossRef]
- Grande, M.D.C.; Marschoff, C.M. Liquid-Liquid Equilibria for Water + Benzonitrile + Ethyl Acetate or + Butyl Acetate. J. Chem. Eng. Data 2005, 50, 1324–1327. [Google Scholar] [CrossRef]
- Golikova, A.; Shasherina, A.; Anufrikov, Y.; Misikov, G.; Toikka, M.; Zvereva, I.; Toikka, A. Excess enthalpies for binary mixtures of the reactive system acetic acid + n-butanol + n-butyl acetate + water: Brief data review and results at 313.15 k and atmospheric pressure. Int. J. Mol. Sci. 2023, 24, 5137. [Google Scholar] [CrossRef] [PubMed]
- Serafimov, L.A. Thermodynamical and topological analysis of liquid-vapor phase equilibrium diagrams and problems rectification of multicomponent mixtures. Math. Method Contemp. Chem. 1996, 10, 557. [Google Scholar]
Figure 1.
Phase diagram of butanol + water + toluene ternary mixture at 101.3 kPa (a) and flowsheet of its separation (b) (M1, M2—mixers, S—separator, K1, K2, K3—distillation columns).
Figure 1.
Phase diagram of butanol + water + toluene ternary mixture at 101.3 kPa (a) and flowsheet of its separation (b) (M1, M2—mixers, S—separator, K1, K2, K3—distillation columns).
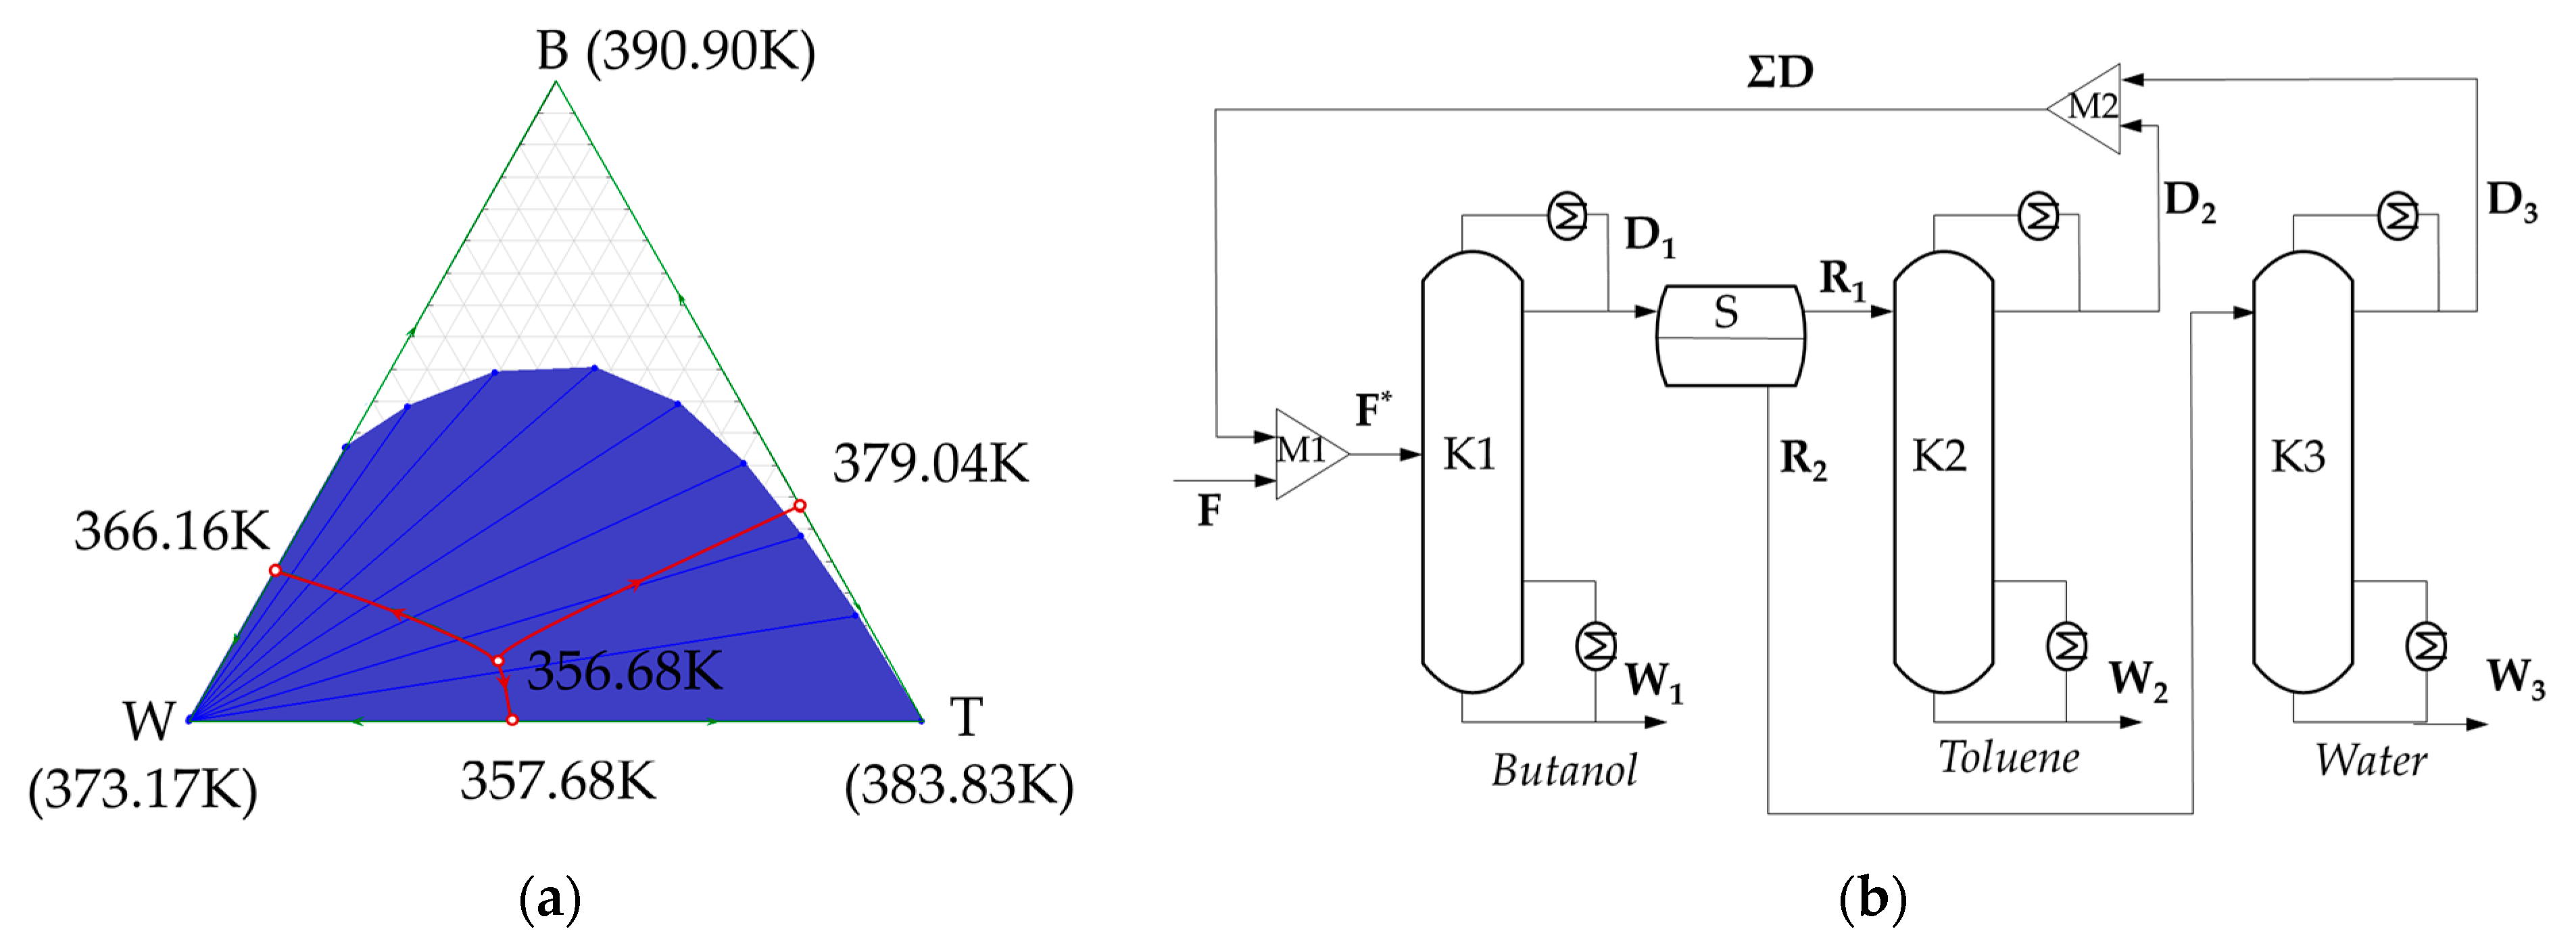
Figure 2.
An example of determining the position of point F* by the graphical method (blue dotted lines—lines of material balances for various contours, brown solid lines—lines of material balances of distillation columns): D1–D3—the compositions of distillate flows of columns K1–K3; F—the composition on original mixture; F*—the composition of feed flow to the column K1; R1 and R2—the compositions of liquid layers in separator. Variant I.

Figure 3.
The variants of the location of point D1. (the dotted line shows the tie-lines and a fragment of the bimodal curve): D1—the composition of distillate flow of column K1; R1—the compositions of organic liquid layers in separator.
Figure 3.
The variants of the location of point D1. (the dotted line shows the tie-lines and a fragment of the bimodal curve): D1—the composition of distillate flow of column K1; R1—the compositions of organic liquid layers in separator.

Figure 4.
Lines of material balances for various spatiotemporal contours of the separation flowsheet: D1–D3—the compositions of distillate flows of columns K1–K3; F—the composition on original mixture; F*—the composition of feed flow to column K1; R1 and R2—the compositions of liquid layers in separator. Variant II.
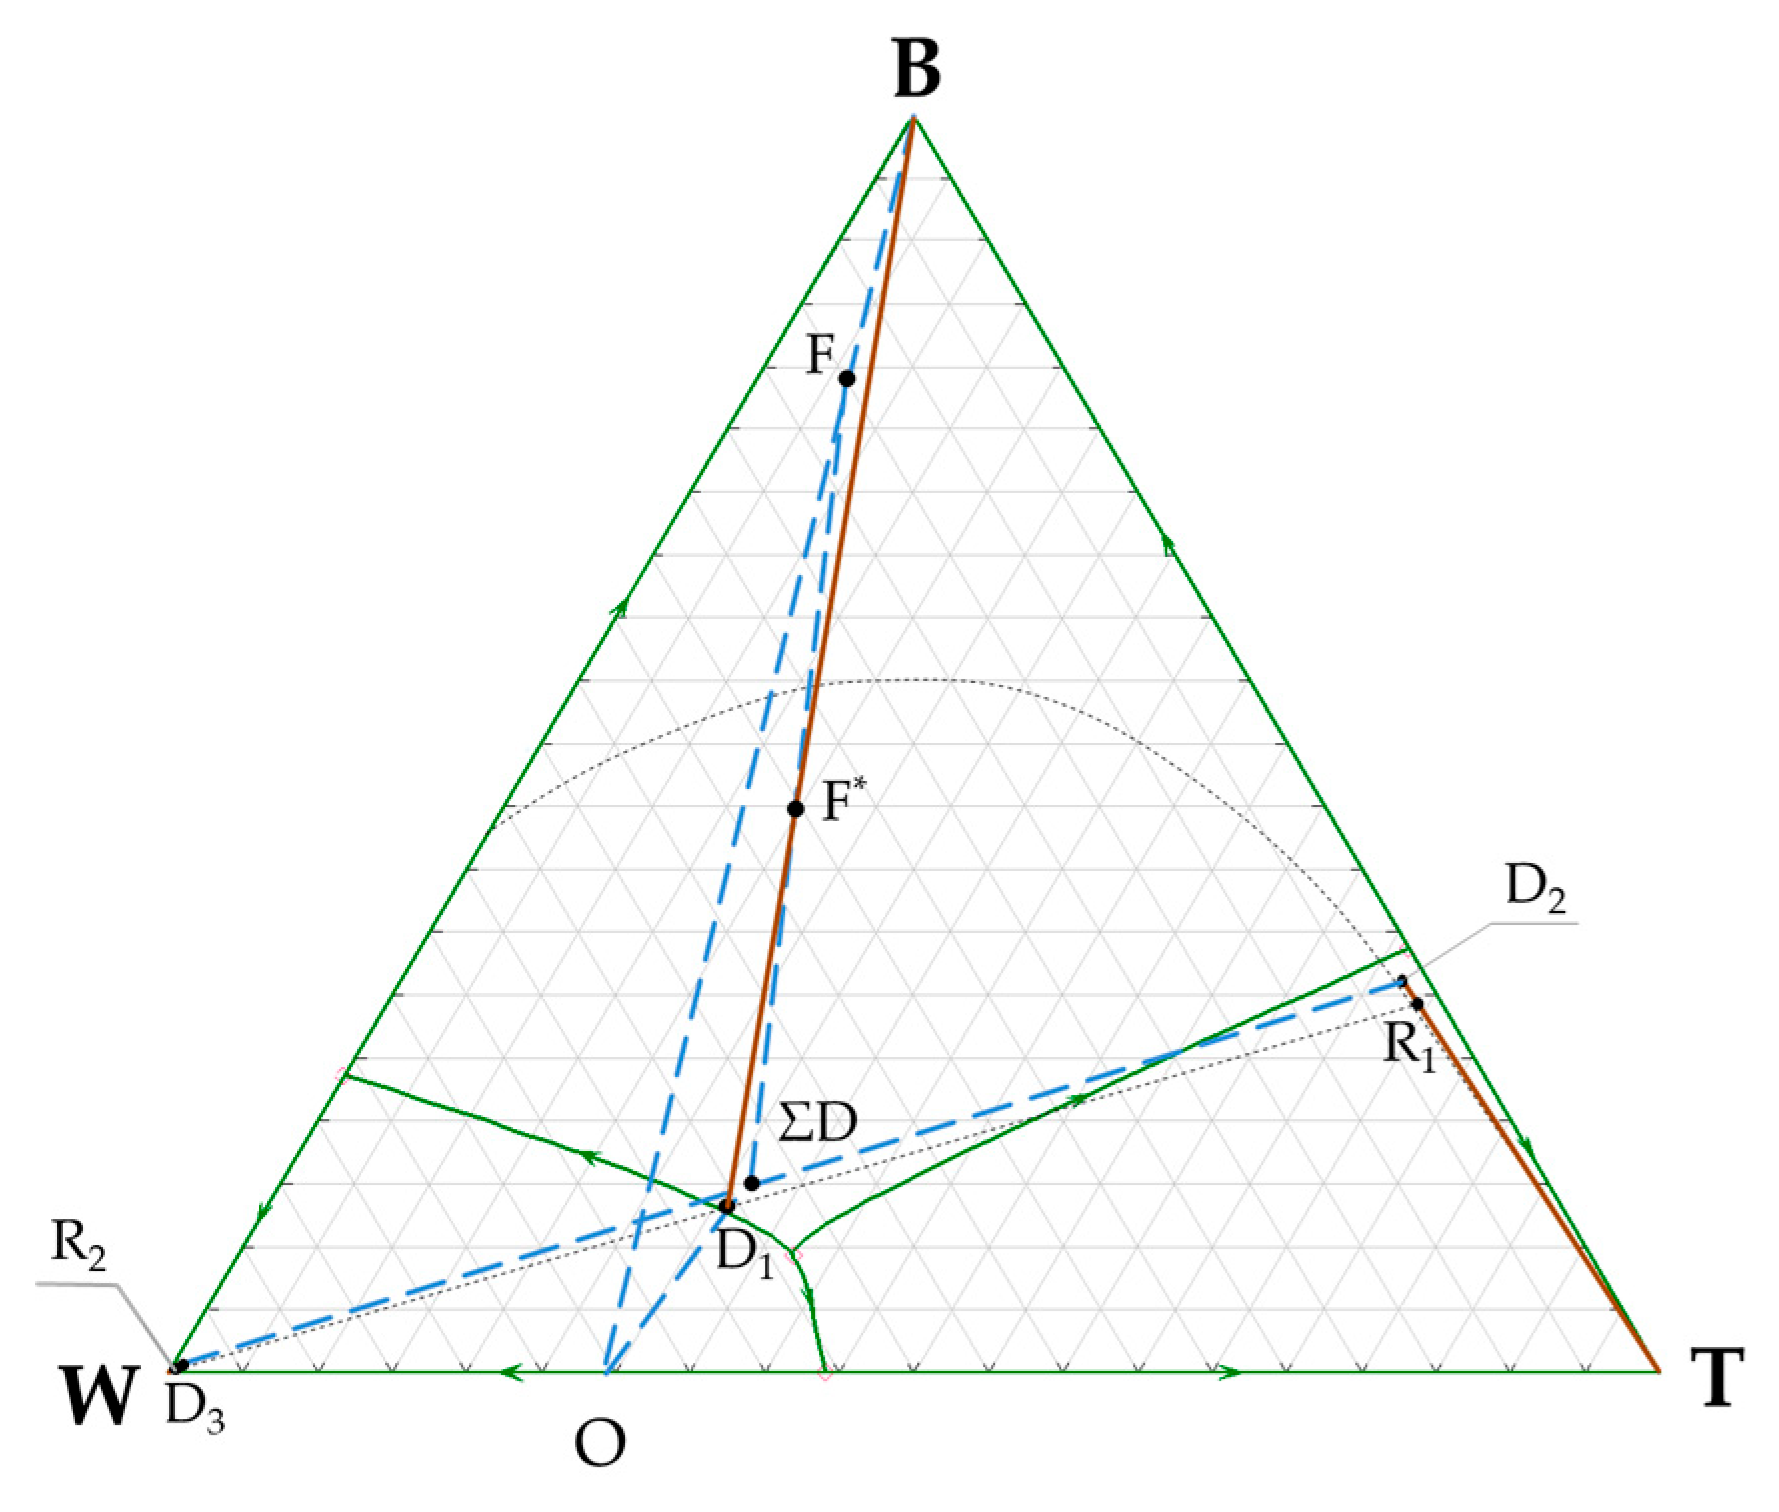
Figure 5.
Lines of material balances for various spatiotemporal contours of the separation flowsheet: D1–D3—the compositions of distillate flows of columns K1–K3; F—the composition on original mixture; F*—the composition of feed flow to column K1; R1 and R2—the compositions of liquid layers in separator. Variant III.
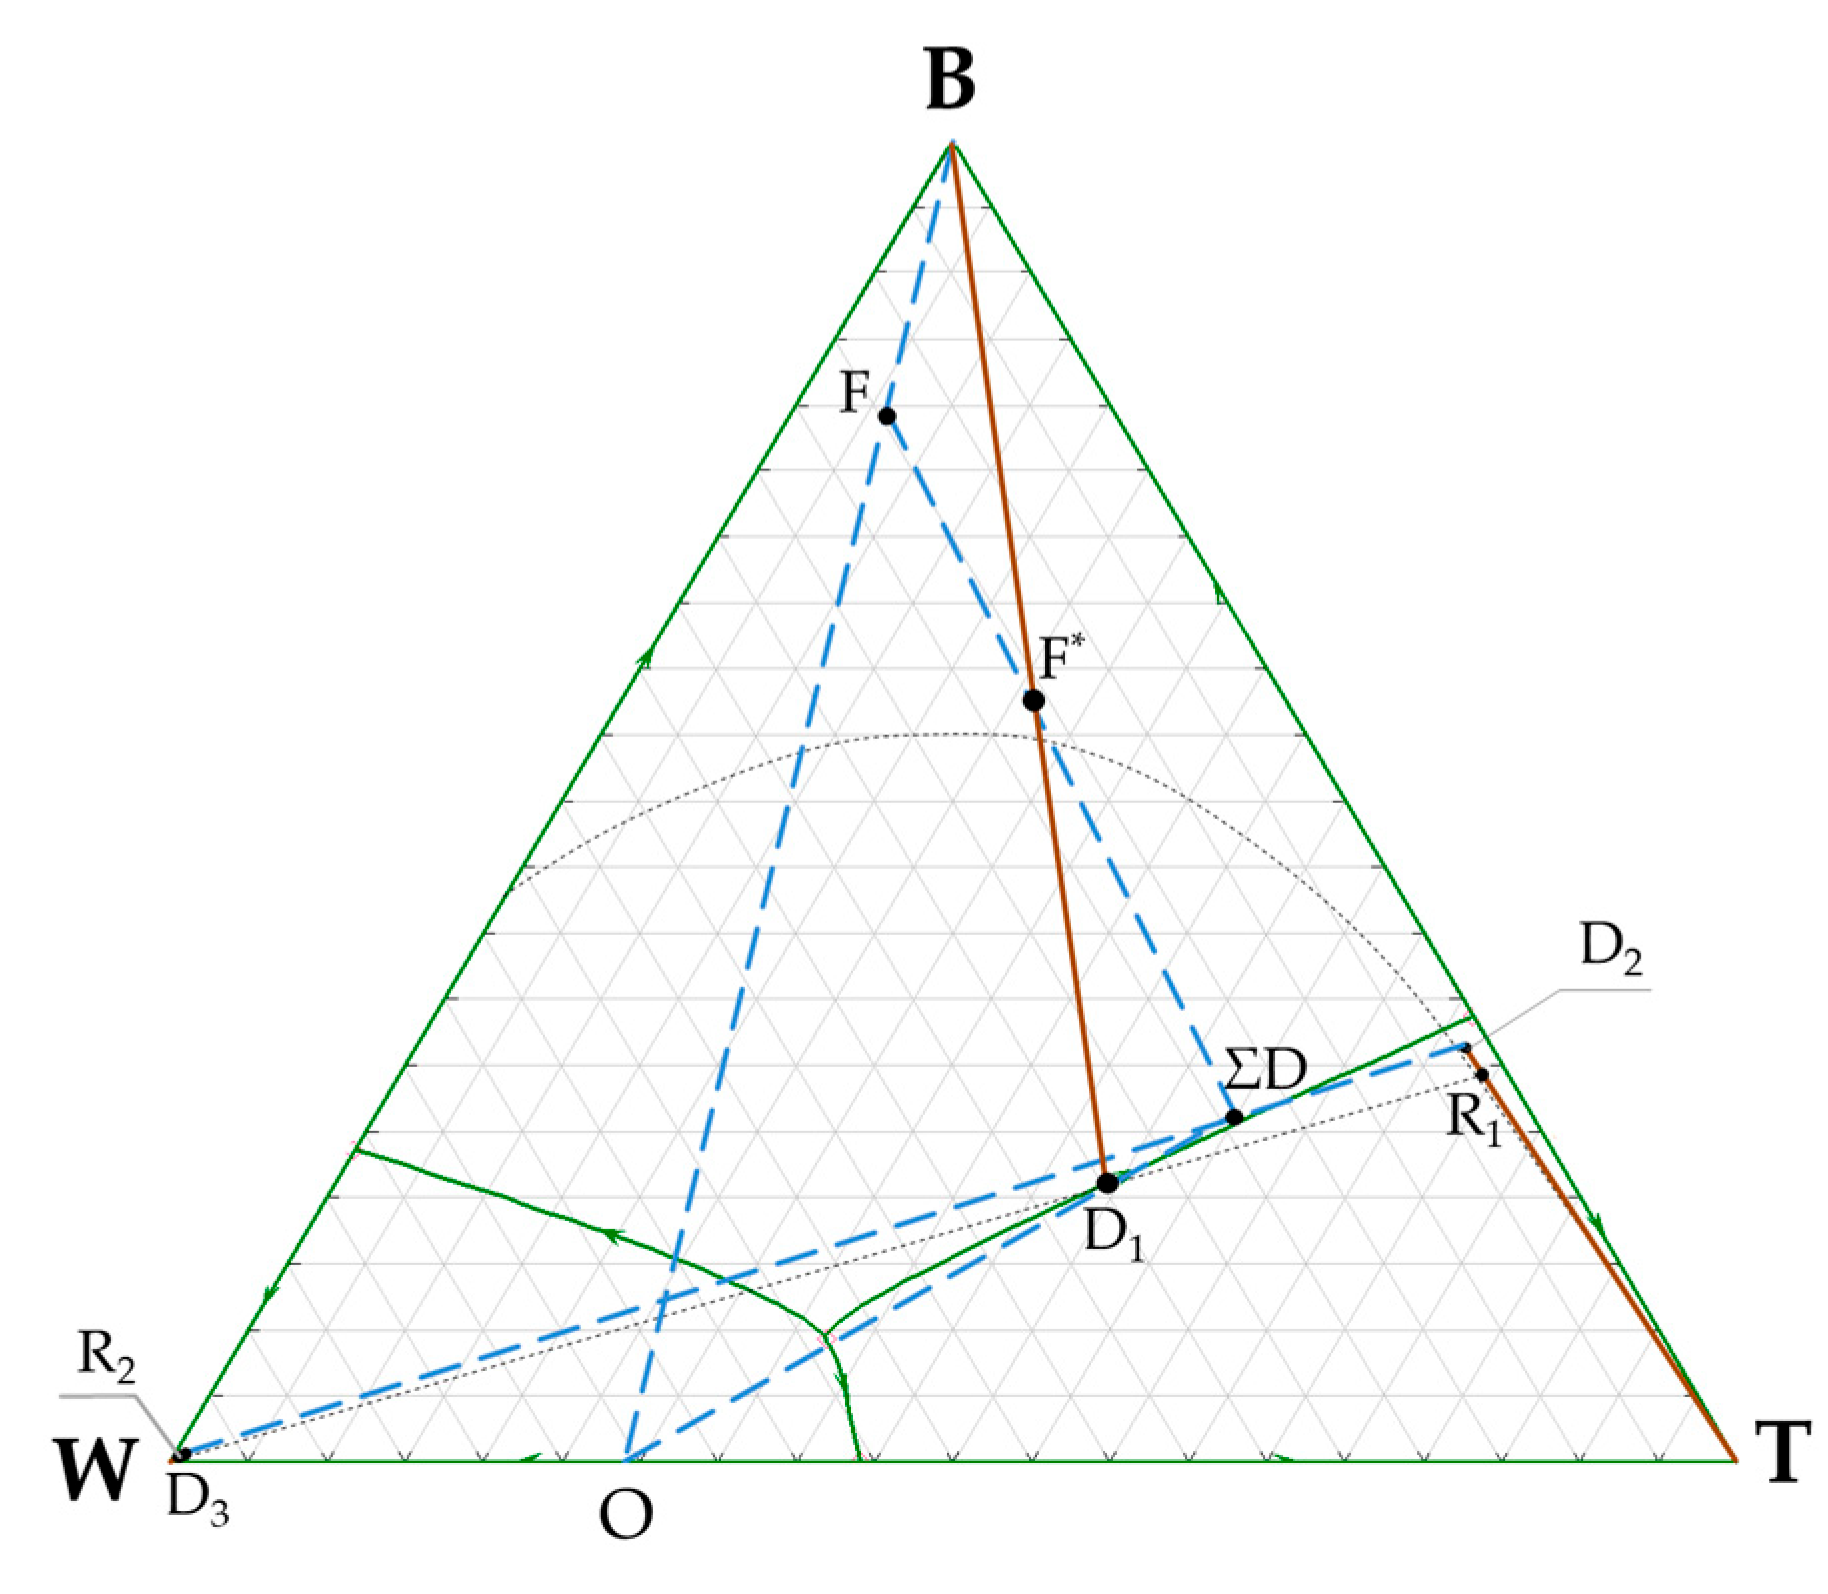
Figure 6.
Comparison of separation flowsheet energy consumption for variants I, II and III for ternary mixture butanol–water–toluene.
Figure 6.
Comparison of separation flowsheet energy consumption for variants I, II and III for ternary mixture butanol–water–toluene.
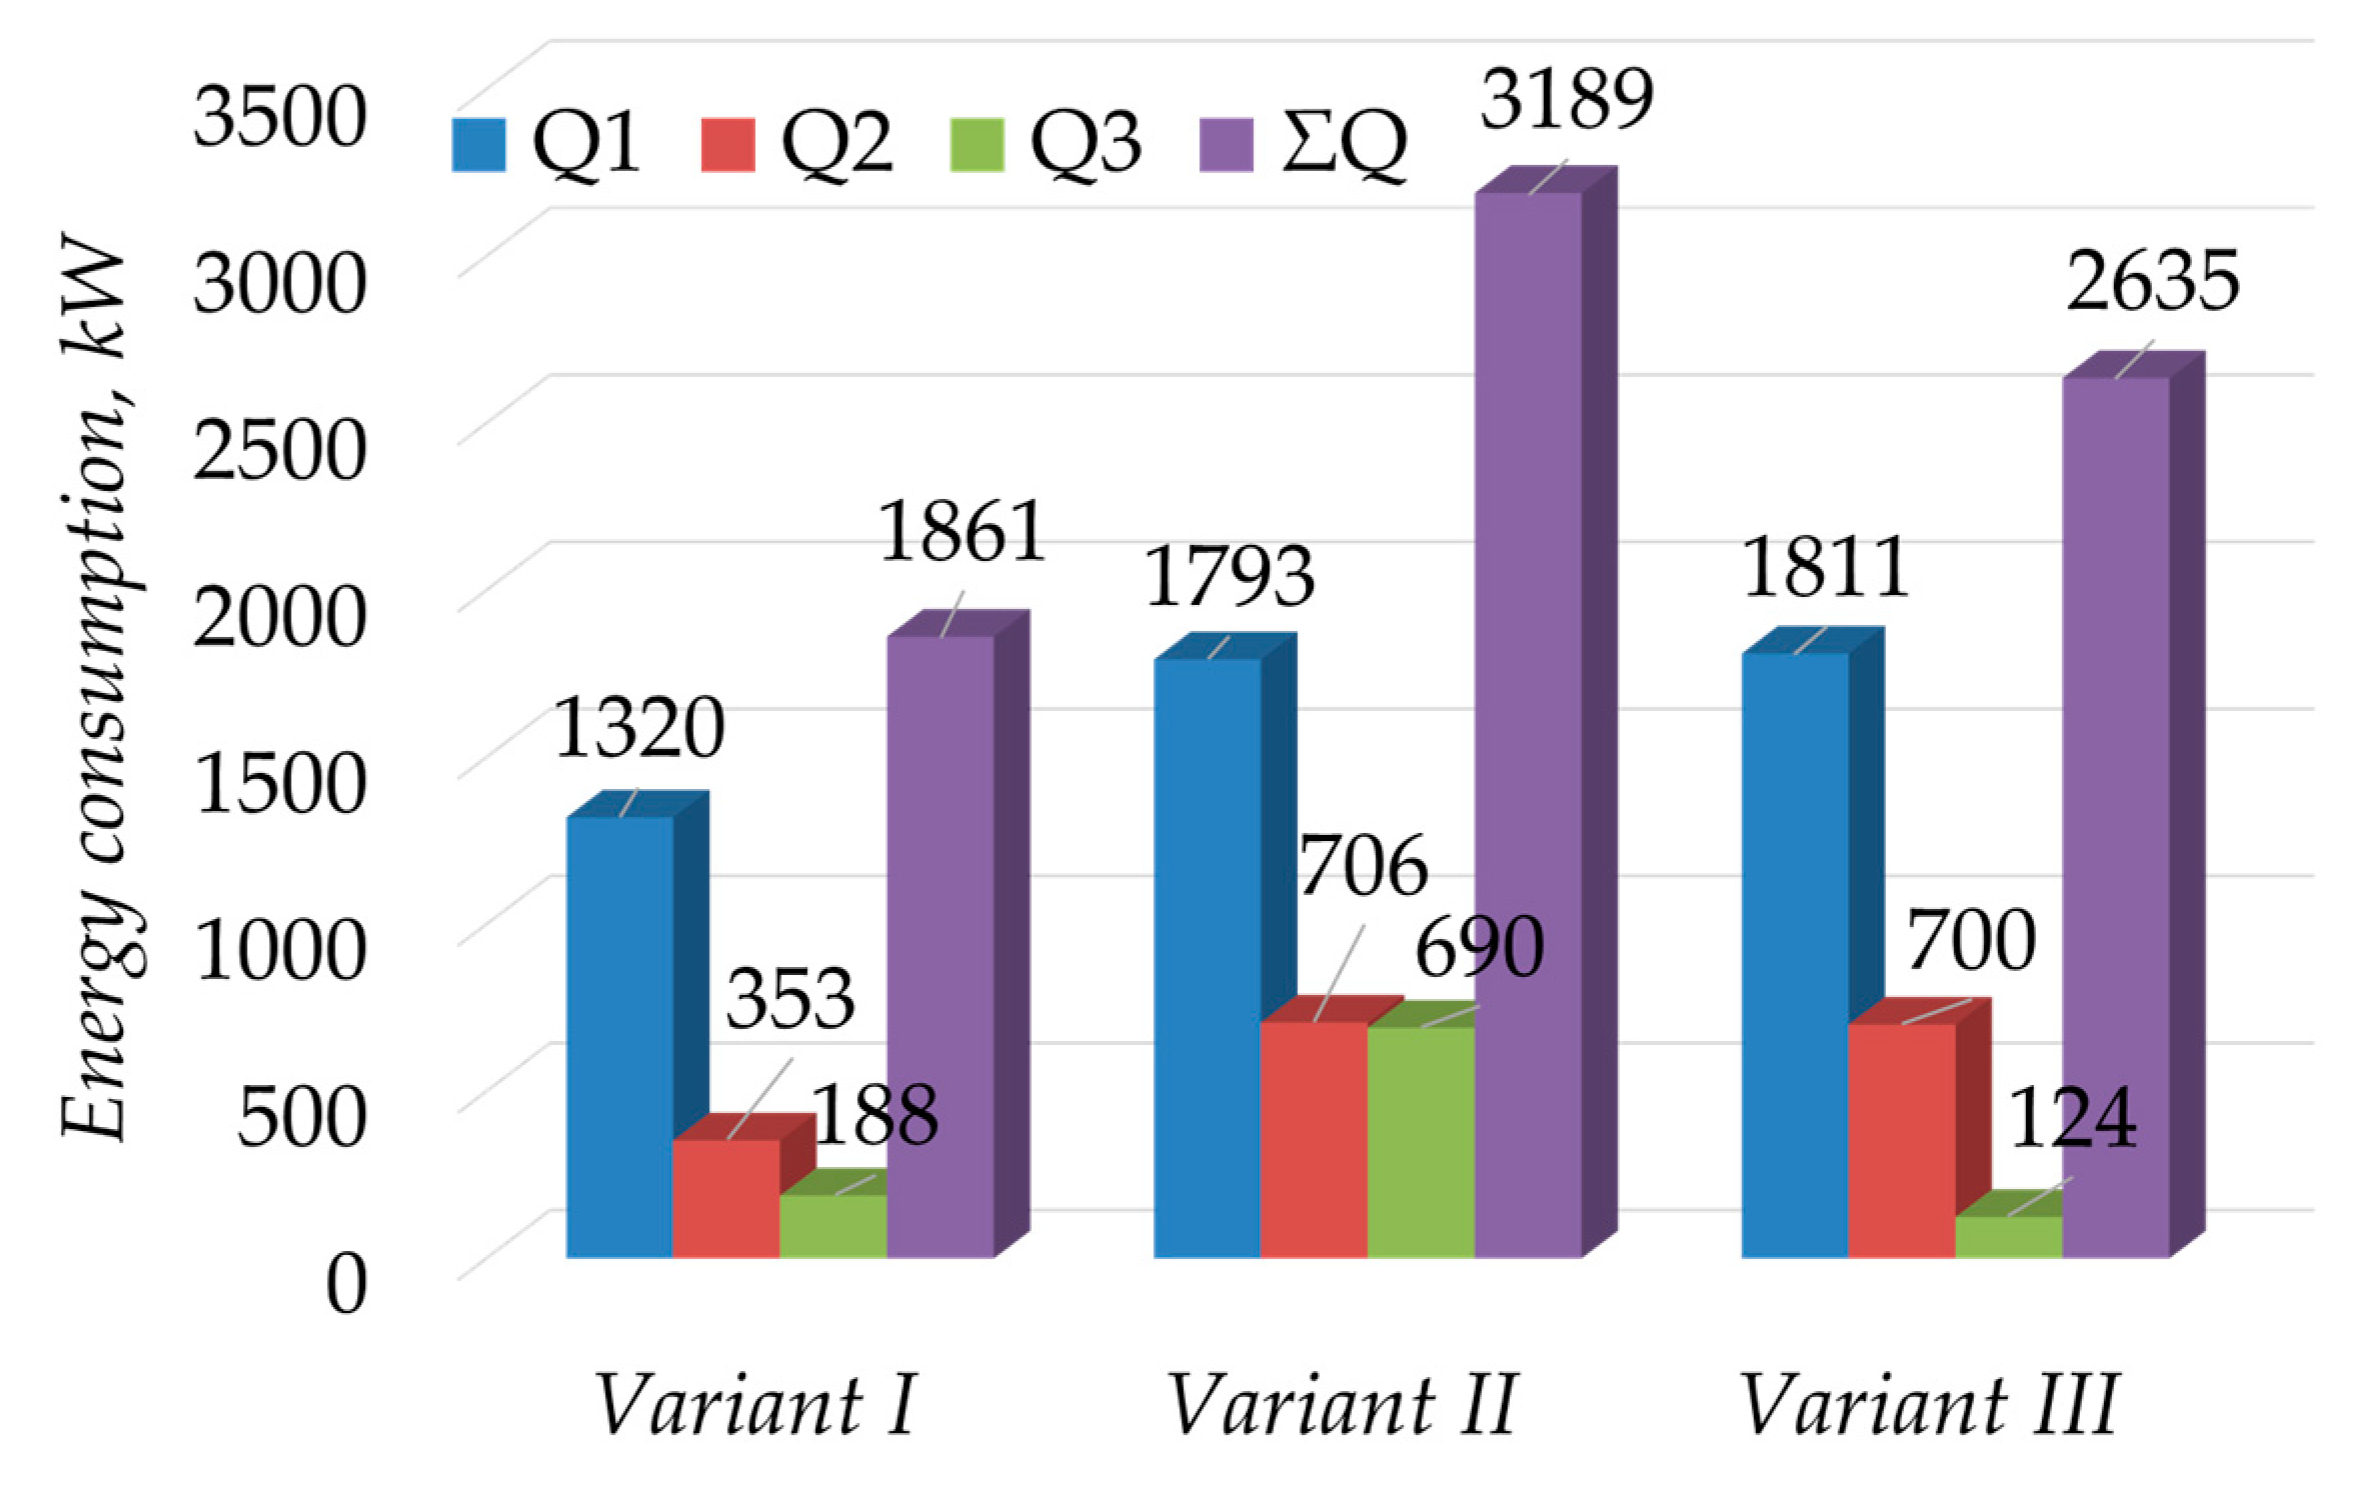
Figure 7.
The region of the flowsheet’s operability.

Figure 8.
An example of the mixture composition, the separation of which is impossible.
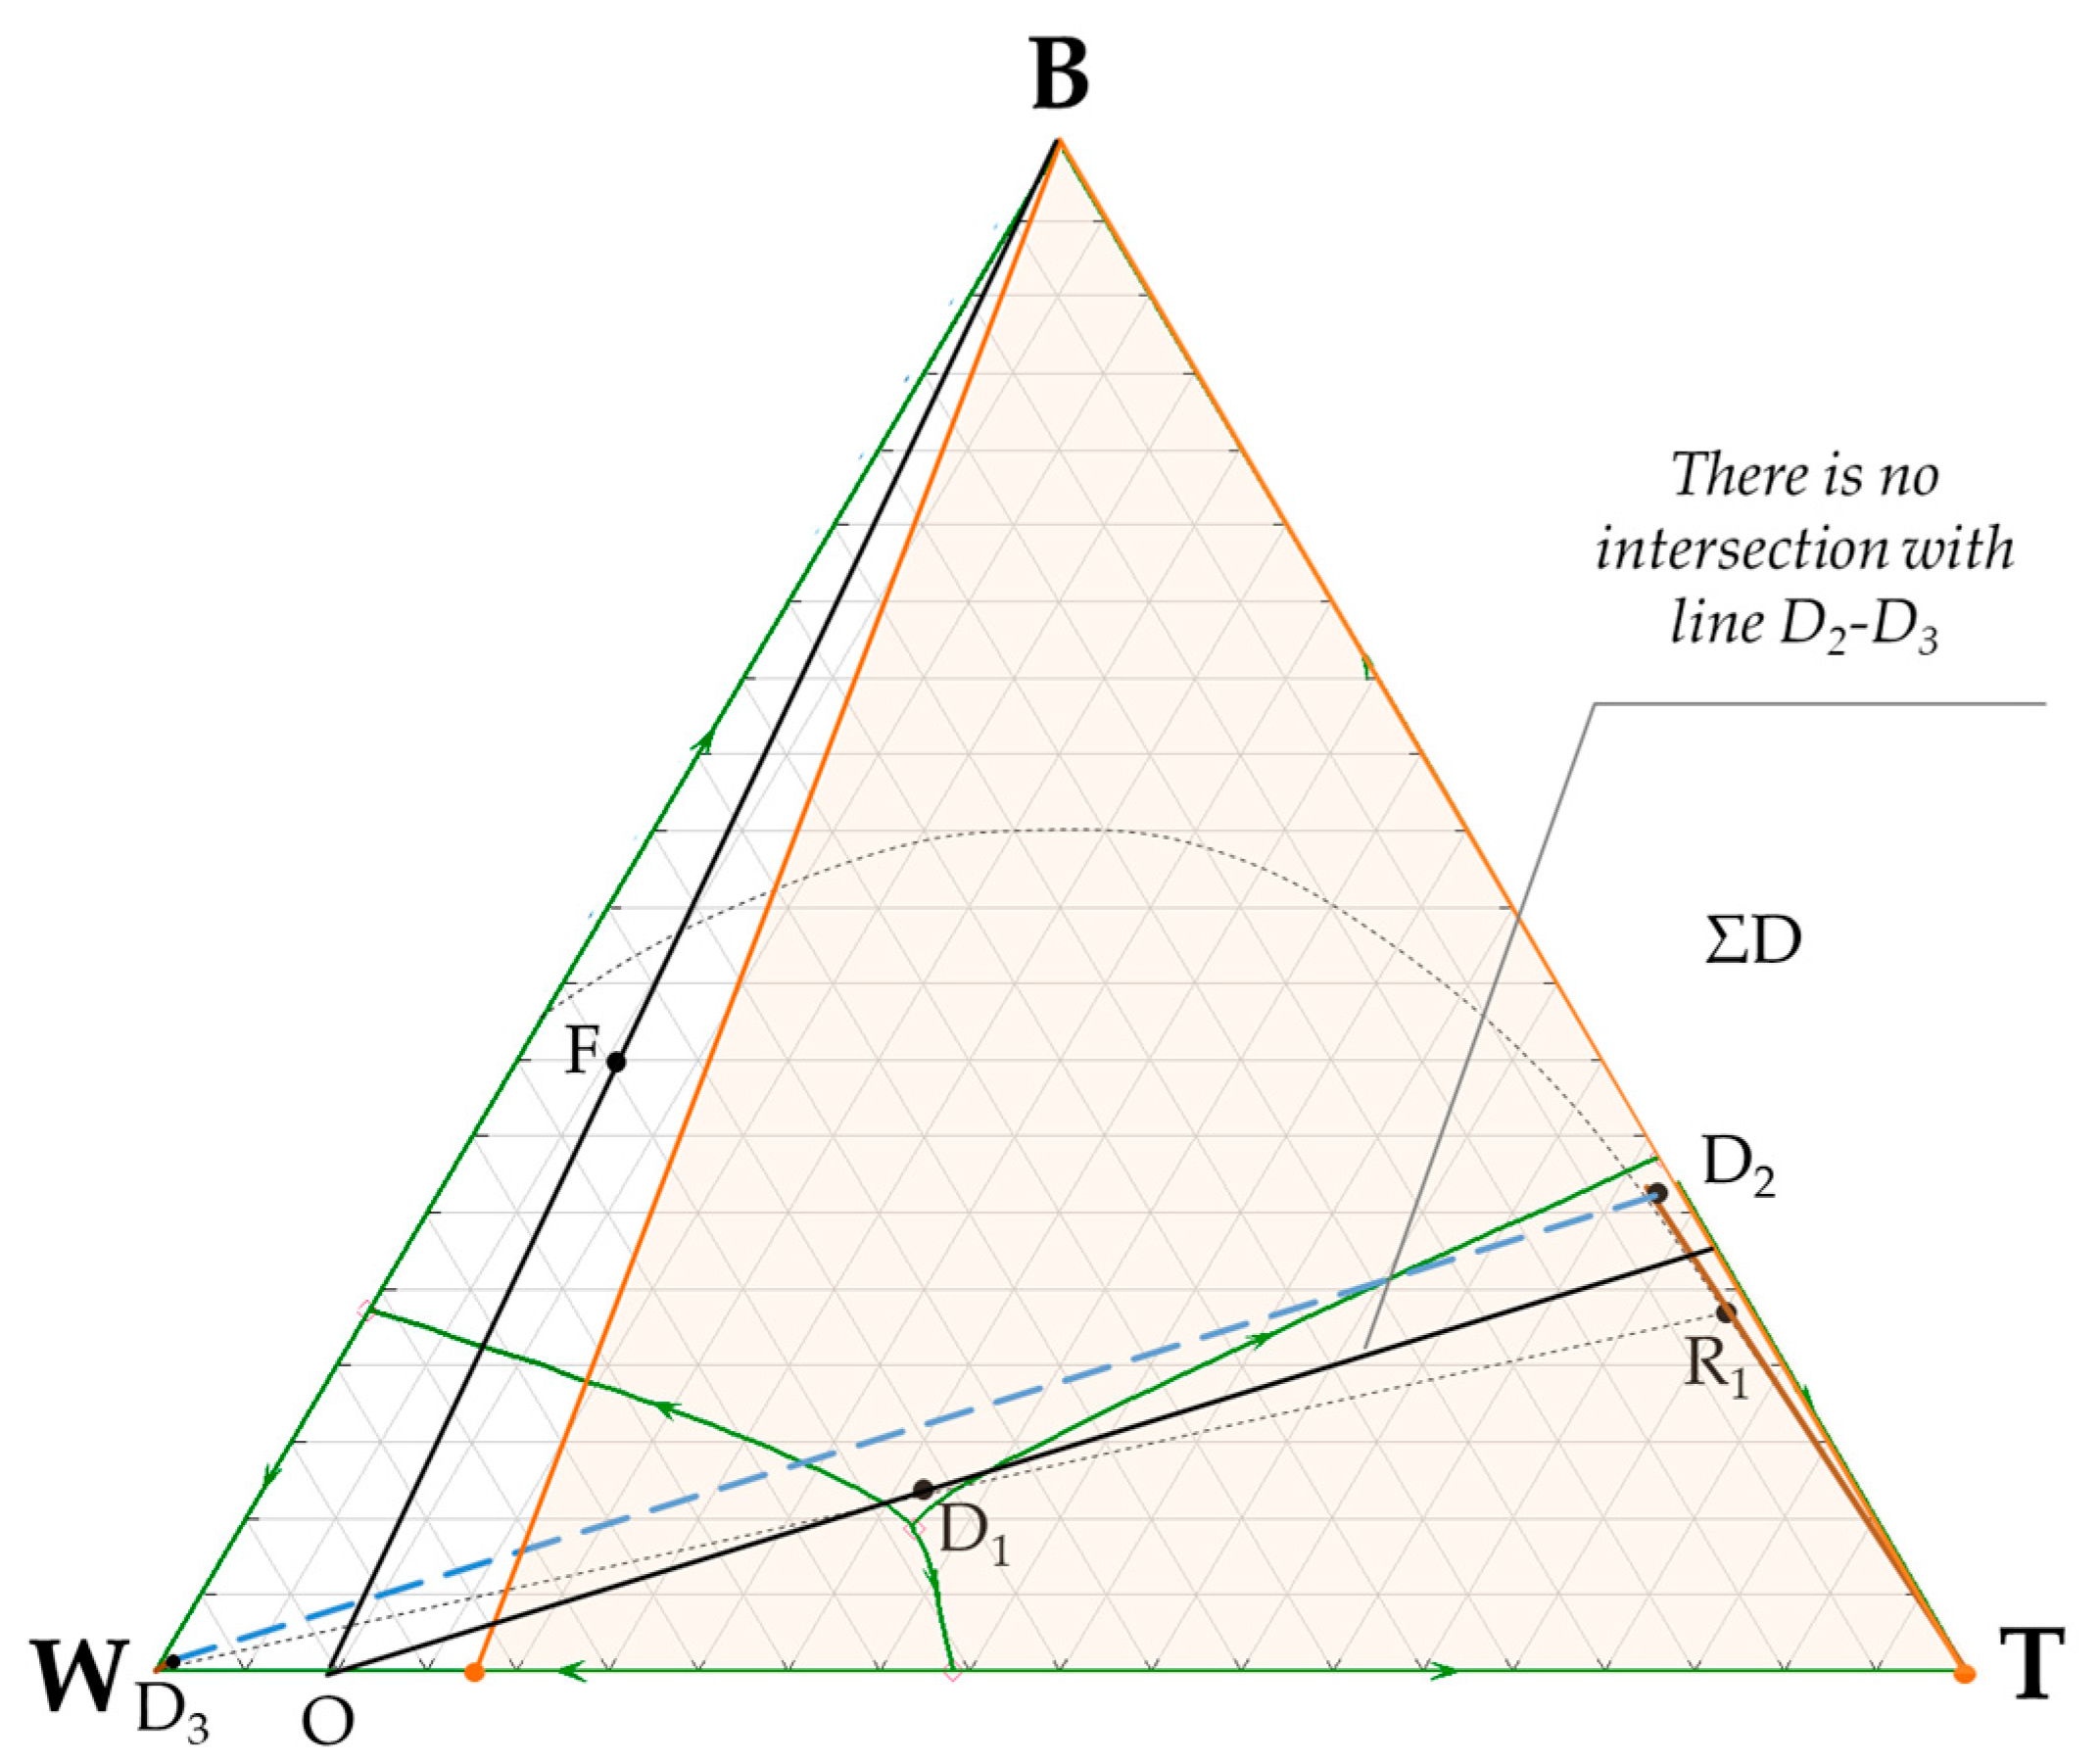
Figure 9.
Phase diagram of n-butanol (B) + butyl acetate (BA) + water (W) ternary mixture at 101.3 kPa (a) and flowsheet of its separation (b) (M1, M2—mixers, S—separator, K1, K2, K3—distillation columns).
Figure 9.
Phase diagram of n-butanol (B) + butyl acetate (BA) + water (W) ternary mixture at 101.3 kPa (a) and flowsheet of its separation (b) (M1, M2—mixers, S—separator, K1, K2, K3—distillation columns).

Figure 10.
Lines of material balances for various spatiotemporal contours of the separation flowsheet for ternary n-butanol (B) + water (W) + butyl acetate (BA) mixture of different original compositions: (a)—for tie-line A, (b)—for tie-line B: D1–D3—the compositions of distillate flows of columns K1–K3; F—the composition on original mixture; F*—the composition of feed flow to the column K1; R1 and R2—the compositions of liquid layers in separator.
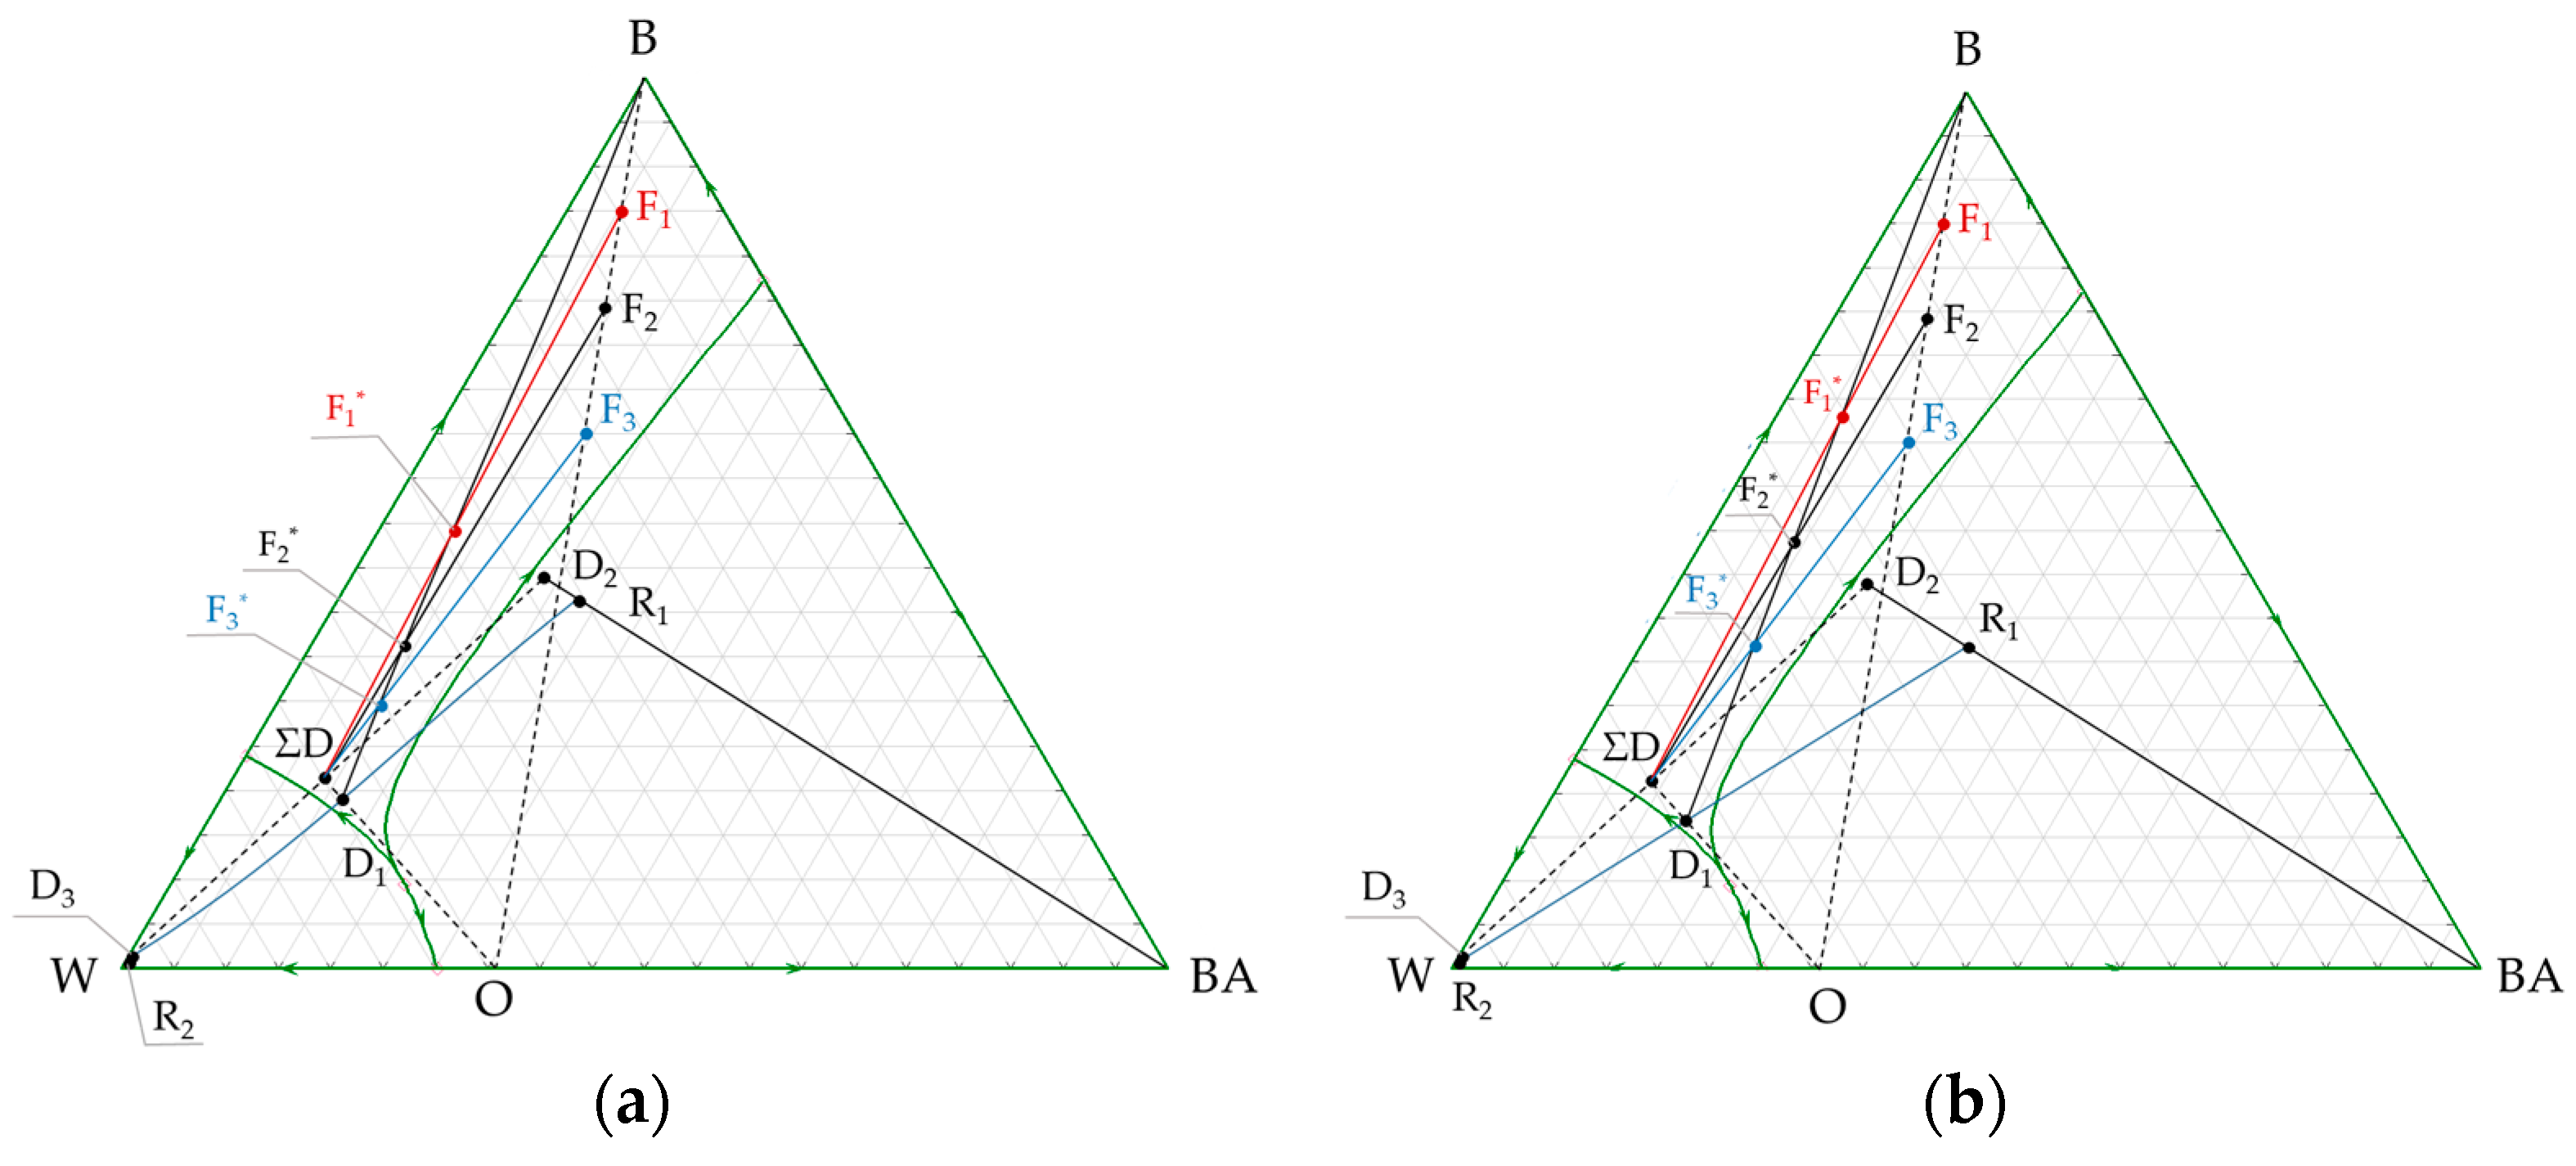
Figure 11.
Comparison of separation flowsheet energy consumption for variants I, II and III for ternary mixture butanol–butyl acetate–water.
Figure 11.
Comparison of separation flowsheet energy consumption for variants I, II and III for ternary mixture butanol–butyl acetate–water.

Table 1.
Boiling temperatures (T) of pure components and azeotropic data (liquid composition (x1) and temperature (T)) (experimental [15,16,17,18,19,20,21,22] and calculated) for B + W + T and B + BA + W ternary systems at 101.3 kPa.
| Pure Component/ Azeotrope | x1(2)cal (Mole Frac.) | x1(2)exp (Mole Frac.) | u (Mole Frac.) | ur | Tcal (K) | Texp (K) | u (K) | ur |
|---|---|---|---|---|---|---|---|---|
| B | 1.0000 | 1.0000 | 0.0000 | 0.0000 | 390.90 | 390.80 | 0.1000 | 0.0002 |
| W | 1.0000 | 1.0000 | 0.0000 | 0.0000 | 373.17 | 373.15 | 0.0020 | 0.0001 |
| T | 1.0000 | 1.0000 | 0.0000 | 0.0000 | 383.83 | 383.75 | 0.0800 | 0.0002 |
| BA | 1.0000 | 1.0000 | 0.0000 | 0.0000 | 399.16 | 399.45 | 0.2900 | 0.0007 |
| W + B | 0.7640 | 0.7600 | 0.0040 | 0.0053 | 366.16 | 365.65 | 0.5100 | 0.0014 |
| T + B | 0.6630 | 0.6730 | 0.0100 | 0.0148 | 379.04 | 378.15 | 0.8900 | 0.0024 |
| W + T | 0.5597 | 0.5610 | 0.0013 | 0.0023 | 357.68 | 357.34 | 0.3400 | 0.0009 |
| B + BA | 0.7718 | 0.7780 | 0.0062 | 0.0080 | 390.05 | 389.64 | 0.4100 | 0.0010 |
| W + BA | 0.6982 | 0.7220 | 0.0238 | 0.0329 | 363.36 | 364.12 | 0.7600 | 0.0021 |
| W + T + B | 0.5346 (0.3725) | 0.5320 (0.3880) | 0.0026 (0.0155) | 0.0049 (0.0437) | 356.68 | 356.45 | 0.2300 | 0.0006 |
| BA + W + B | 0.2242 (0.6817) | 0.2240 (0.7034) | 0.0002 (0.0217) | 0.0009 (0.0308) | 362.84 | 363.52 | 0.68 | 0.0019 |
Table 2.
Experimental [19,23,24,25] and calculated LLE data (liquid compositions x1′ and x1″) for binary systems W + B, W + T, BA + W at 101.3 kPa and 298.15 K.
| Binary System | x2′ (cal) (Mole Frac.) | x1″ (cal) (Mole Frac.) | x2′ (exp) (Mole Frac.) | x1″ (exp) (Mole Frac.) | u (x2′) (Mole Frac.) | ur (x2′) | u (x1″) (Mole Frac.) | ur (x1″) |
|---|---|---|---|---|---|---|---|---|
| W + B | 0.4769 | 0.9911 | 0.4900 | 0.9940 | 0.0131 | 0.0267 | 0.0029 | 0.0030 |
| W + T | 0.9999 | 0.9982 | 0.9999 | 0.9985 | 0.0000 | 0.0000 | 0.0003 | 0.0003 |
| W + BA | 0.9249 | 0.9992 | 0.9356 | 0.9990 | 0.0107 | 0.0114 | 0.0002 | 0.0002 |
Table 3.
The material balance for separation flowsheet (variant I: D1 is near the ternary azeotrope) (the designation of the flows is given in Figure 1b): D1–D3 (W1–W3)—the distillate (bottom) flows of columns K1–K3; F—the flow of original mixture; F*—the flow to the column K1; R1 and R2—liquid layers in separator; ΣD—the recycle flow; B—butanol, W—water, T—toluene.
| Flow | The Amount of Flow, kmol/h | The Amount of Components in Flow, kmol/h | The Flow Composition, Mole Frac. | |
|---|---|---|---|---|
| F* | 141.9 | B | 85.90 | 0.6054 |
| W | 32.59 | 0.2297 | ||
| T | 23.41 | 0.1649 | ||
| F | 100.0 | B | 78.20 | 0.7820 |
| W | 15.00 | 0.1500 | ||
| T | 6.80 | 0.0680 | ||
| D1 | 63.7 | B | 7.70 | 0.1209 |
| W | 32.59 | 0.5116 | ||
| T | 23.41 | 0.3675 | ||
| R1 | 31.5 | B | 7.67 | 0.2434 |
| W | 0.42 | 0.0134 | ||
| T | 23.41 | 0.7432 | ||
| R2 | 32.2 | B | 0.03 | 0.0008 |
| W | 32.17 | 0.9992 | ||
| T | 0.00 | traces | ||
| W1 | 78.2 | B | 78.20 | 1.0000 |
| W | 0.00 | 0.0000 | ||
| T | 0.00 | 0.0000 | ||
| W2 | 6.8 | B | 0.00 | 0.0000 |
| W | 0.00 | 0.0000 | ||
| T | 6.80 | 1.0000 | ||
| W3 | 15.0 | B | 0.00 | 0.0000 |
| W | 15.00 | 1.0000 | ||
| T | 0.00 | 0.0000 | ||
| D2 | 24.7 | B | 7.67 | 0.3100 |
| W | 0.42 | 0.0170 | ||
| T | 16.61 | 0.6730 | ||
| D3 | 17.2 | B | 0.03 | 0.0017 |
| W | 17.17 | 0.9983 | ||
| T | 0.00 | traces | ||
| ΣD | 41.9 | B | 7.70 | 0.1838 |
| W | 17.59 | 0.4198 | ||
| T | 16.61 | 0.3964 | ||
Table 4.
The material balance for separation flowsheet (variant II: D1 is on the separatrix generated by the saddle azeotrope B + W) (the designation of the flows is given in Figure 1b): D1–D3 (W1–W3)—the distillate (bottom) flows of columns K1–K3; F—the flow of original mixture; F*—the flow to the column K1; R1 and R2—liquid layers in separator; ΣD—the recycle flow; B—butanol, W—water, T—toluene.
| Flow | The Amount of Flow, kmol/h | The Amount of Components in Flow, kmol/h | The Flow Composition, Mole Frac. | |
|---|---|---|---|---|
| F* | 214.0 | B | 95.76 | 0.4475 |
| W | 76.73 | 0.3585 | ||
| T | 41.51 | 0.1940 | ||
| F | 100.0 | B | 78.20 | 0.7820 |
| W | 15.00 | 0.1500 | ||
| T | 6.80 | 0.0680 | ||
| D1 | 135.8 | B | 17.56 | 0.1293 |
| W | 76.73 | 0.5650 | ||
| T | 41.51 | 0.3057 | ||
| R1 | 60.1 | B | 17.48 | 0.2908 |
| W | 1.11 | 0.0185 | ||
| T | 41.51 | 0.6907 | ||
| R2 | 75.7 | B | 0.08 | 0.0010 |
| W | 75.62 | 0.9990 | ||
| T | 0.00 | traces | ||
| W1 | 78.2 | B | 78.20 | 1.0000 |
| W | 0.00 | 0.0000 | ||
| T | 0.00 | 0.0000 | ||
| W2 | 6.8 | B | 0.00 | 0.0000 |
| W | 0.00 | 0.0000 | ||
| T | 6.80 | 1.0000 | ||
| W3 | 15.0 | B | 0.00 | 0.0000 |
| W | 15.00 | 1.0000 | ||
| T | 0.00 | 0.0000 | ||
| D2 | 53.3 | B | 17.48 | 0.3280 |
| W | 1.11 | 0.0208 | ||
| T | 34.71 | 0.6512 | ||
| D3 | 60.7 | B | 0.08 | 0.0013 |
| W | 60.62 | 0.9987 | ||
| T | 0.00 | traces | ||
| ΣD | 114.0 | B | 17.56 | 0.1540 |
| W | 61.73 | 0.5415 | ||
| T | 34.71 | 0.3045 | ||
Table 5.
The material balance for separation flowsheet (variant III: D1 is on the separatrix generated by the saddle azeotrope B + T) (the designation of the flows is given in Figure 1b): D1–D3 (W1–W3)—the distillate (bottom) flows of columns K1–K3; F—the flow of original mixture; F*—the flow to the column K1; R1 and R2—liquid layers in separator; ΣD—the recycle flow; B—butanol, W—water, T—toluene.
| Flow | The Amount of Flow, kmol/h | The Amount of Components in Flow, kmol/h | The Flow Composition, Mole Frac. | |
|---|---|---|---|---|
| F* | 164.2 | B | 95.71 | 0.5829 |
| W | 26.98 | 0.1643 | ||
| T | 41.51 | 0.2528 | ||
| F | 100.0 | B | 78.20 | 0.7820 |
| W | 15.00 | 0.1500 | ||
| T | 6.80 | 0.0680 | ||
| D1 | 86.0 | B | 17.51 | 0.2036 |
| W | 26.98 | 0.3137 | ||
| T | 41.51 | 0.4827 | ||
| R1 | 60.1 | B | 17.48 | 0.2908 |
| W | 1.11 | 0.0185 | ||
| T | 41.51 | 0.6907 | ||
| R2 | 25.9 | B | 0.30 | 0.0010 |
| W | 25.87 | 0.9990 | ||
| T | 0.00 | traces | ||
| W1 | 78.2 | B | 78.20 | 1.0000 |
| W | 0.00 | 0.0000 | ||
| T | 0.00 | 0.0000 | ||
| W2 | 6.8 | B | 0.00 | 0.0000 |
| W | 0.00 | 0.0000 | ||
| T | 6.80 | 1.0000 | ||
| W3 | 15.0 | B | 0.00 | 0.0000 |
| W | 15.00 | 1.0000 | ||
| T | 0.00 | 0.0000 | ||
| D2 | 53.3 | B | 17.48 | 0.3280 |
| W | 1.11 | 0.0208 | ||
| T | 34.71 | 0.6512 | ||
| D3 | 10.9 | B | 0.03 | 0.0028 |
| W | 10.87 | 0.9972 | ||
| T | 0.00 | traces | ||
| ΣD | 64.2 | B | 17.51 | 0.2727 |
| W | 11.98 | 0.1866 | ||
| T | 34.71 | 0.5407 | ||
Table 6.
Distillation columns (K1–K3) operating parameters (the columns’ pressure: 101.3 kPa).
| Column | Number of Stages/Feed Stage | Reflux Ratio | Number of Stages/Feed Stage | Reflux Ratio | Number of Stages/Feed Stage | Reflux Ratio |
|---|---|---|---|---|---|---|
| Variant I | Variant II | Variant III | ||||
| K1 | 21/13 | 0.738 | 10/2 | 0.001 | 15/7 | 0.79 |
| K2 | 14/4 | 0.500 | 13/3 | 0.550 | 13/3 | 0.554 |
| K3 | 4/2 | 0.0001 | 4/2 | 0.0001 | 4/2 | 0.0001 |
Table 7.
The ratio of the amount of columns (K1–K3) distillate (Di) and bottom (Wi) flows (separator layers R1/R2).
Table 7.
The ratio of the amount of columns (K1–K3) distillate (Di) and bottom (Wi) flows (separator layers R1/R2).
| Variant | I | II | III | ||||||
|---|---|---|---|---|---|---|---|---|---|
| Column (Separator) | K1 | K2 | K3 | K1 | K2 | K3 | K1 | K2 | K3 |
| Tie-line A (R1/R2 = 0.83) | |||||||||
| Di/Wi | 1.21 | 7.80 | 4.71 | 2.42 | 7.89 | 4.71 | 4.54 | 7.90 | 4.70 |
| Tie-line B (R1/R2 = 0.84) | |||||||||
| Di/Wi | 0.79 | 4.87 | 2.71 | 1.51 | 4.80 | 2.69 | 2.96 | 4.82 | 2.71 |
Table 8.
Distillation columns operating parameters (the pressure in columns: K1—70 kPa, K2–K3—101.3 kPa).
Table 8.
Distillation columns operating parameters (the pressure in columns: K1—70 kPa, K2–K3—101.3 kPa).
| Column | Number of Stages/Feed Stage | Reflux Ratio | Number of Stages/Feed Stage | Reflux Ratio | Number of Stages/Feed Stage | Reflux Ratio |
|---|---|---|---|---|---|---|
| Variant I | Variant II | Variant III | ||||
| K1 | 46/18 | 4.5 | 48/21 | 3.0 | 48/19 | 2.1 |
| K2 | 50/40 | 3.6 | 40/26 | 2.7 | 43/30 | 2.2 |
| K3 | 4/2 | 0.001 | 4/2 | 0.001 | 4/2 | 0.001 |
Disclaimer/Publisher’s Note: The statements, opinions and data contained in all publications are solely those of the individual author(s) and contributor(s) and not of MDPI and/or the editor(s). MDPI and/or the editor(s) disclaim responsibility for any injury to people or property resulting from any ideas, methods, instructions or products referred to in the content. |
© 2024 by the authors. Licensee MDPI, Basel, Switzerland. This article is an open access article distributed under the terms and conditions of the Creative Commons Attribution (CC BY) license (https://creativecommons.org/licenses/by/4.0/).
Share and Cite
MDPI and ACS Style
Frolkova, A.; Frolkova, A.; Sibirtsev, M.; Lysenko, K. The Material Balance of Complex Separation Flowsheets. Processes 2024, 12, 821. https://doi.org/10.3390/pr12040821
AMA Style
Frolkova A, Frolkova A, Sibirtsev M, Lysenko K. The Material Balance of Complex Separation Flowsheets. Processes. 2024; 12(4):821. https://doi.org/10.3390/pr12040821
Chicago/Turabian StyleFrolkova, Anastasia, Alla Frolkova, Michael Sibirtsev, and Kirill Lysenko. 2024. "The Material Balance of Complex Separation Flowsheets" Processes 12, no. 4: 821. https://doi.org/10.3390/pr12040821
Note that from the first issue of 2016, this journal uses article numbers instead of page numbers. See further details here.