
CFD−DEM Simulation of a Jamming Mechanism and Influencing Factors of a Fracture-Shrinking Model


National Key Laboratory of Oil and Gas Reservoir Geology and Exploitation, Southwest Petroleum University, Chengdu 610500, China
*
Author to whom correspondence should be addressed.
Processes 2024, 12(4), 822; https://doi.org/10.3390/pr12040822
Submission received: 7 March 2024
/
Revised: 9 April 2024
/
Accepted: 15 April 2024
/
Published: 18 April 2024
(This article belongs to the Special Issue Advanced Fracturing Technology for Oil and Gas Reservoir Stimulation)
Abstract
:Fractured-vuggy reservoirs are crucial for increasing unconventional oil storage and production, but the controlling mechanism of this dominant flow channel remains vague, and the jamming mechanism of modulator particles is unclear. This study explores the filling and jamming processes of particles in the fractures by conducting a computational fluid dynamics−discrete element method (CFD−DEM) coupled simulation, considering the variation of fracture width, fluid velocity, particle size, and concentration. Results suggest that four sealing modes are proposed: normal filling, local jamming, complete sealing, and sealing in the main fracture. The ratio of particle size to the main fracture width exerts the primary role, with the ratio having a range of 0.625 < D/W ≤ 0.77 revealing complete jamming. Furthermore, an optimal particle size for achieving stable sealing is observed when the particle size varies from 2 to 2.5 mm. A higher concentration of particles yields better results in the fracture-shrinking model. Conversely, a greater velocity worsens the sealing effect on fractures. This research can offer technical support for the large-scale dissemination of flow regulation technology.
1. Introduction
Carbonate reservoirs have been the utmost source of oil and gas production in many regions of the world, including South America, the Middle East, and Central Asia [1,2]. Based on statistical data from IHS Markit, carbonate oil and gas resources have a proportion of about 70% of the total oil and gas resources globally, proven recoverable reserves of about 50%, and production of about 60%. These reservoirs are usually huge in areal extent and thickness and heterogeneous in pore structure [3], mainly distributed in the Jurassic, Cretaceous, and Neogene strata. China is also abundant in carbonate oil and gas resources, especially in the western part [4,5]. Recently, the production of carbonate oil and gas has increased rapidly; thus, it has become an important field of oil and gas exploration and development and oil and gas storage and production in China [6]. Compared with carbonate reservoirs in other countries, carbonate reservoirs in China are more difficult to exploit because of their old geological age, deep location and multi-stage tectonic transformation [7], with the primary oil reservoirs of fissure-pore type and fracture-cavity type, and the gas reservoirs of mainly porous reef dolomite.
The Ordovician fracture-vuggy carbonate reservoir belonging to Tahe oilfield is located in Tarim Basin, being buried at a depth of over 4500 m; it is a complex reservoir zone of combined fractures and vughs and varying reservoir size [8,9]. The reservoir zone is dominated by karst caves and large fractures, in which the caves are large in scale and have various connectivity forms, complex spatial distribution, and strong heterogeneity (for geological information, please refer to Figure 2 in [10]). After long-term, water-driving exploitation, the fractured-vuggy reservoirs have issues with low response and low recovery degrees [11,12]. Consequently, it is urgent to expand the water-driving-related volume of fractured-vuggy reservoirs and improve the oil recovery efficiency of fractured-vuggy reservoirs. The implementation of water injection has emerged as the foremost approach for ensuring stable production and enhancing recovery efficiency in fractured-vuggy carbonate reservoirs [13]. Nevertheless, in the fractured-vuggy reservoir of Tahe, water injection exploitation often leads to the formation of distinct preferential pathways within the injection−production well group [14,15]. These channels facilitate the rapid breakthrough of injected water, resulting in premature water breakthrough in oil wells and limited effectiveness of water flooding, thereby compromising the desired outcomes of water injection.
By implementing measures to adjust particle flow channels, significant changes have been observed in the flow characteristics of fractured reservoirs, and positive production feedback has been obtained onsite [16,17]. However, due to the intricate nature of karst caves and fractures as well as their interconnections within fractured reservoirs, the field implementation of flow channel adjustments for different well conditions requires distinct process parameters [18]. This constraint hinders the widespread adoption and application of particle flow channel adjustment technology [19]. Notably, local jamming caused by flow control agent particles is a crucial factor influencing the effectiveness of flow control [20]. The bridging between particles serves as the primary mechanism for jamming and shrinking fractures, thus significantly impacting design parameters such as particle concentration, size distribution, and injection volume.
Exploring the migration law of granular flow modulators is crucial, and computational fluid dynamics (CFD) has proven to be an effective tool for accurately simulating liquid flow at a macroscopic scale [21,22,23,24]. In addition, the discrete element method (DEM) is a widely used particle simulation technology that can accurately describe the real-time motion state of individual particles [25,26,27,28]. The combination of CFD and DEM technology provides an ideal method for simulating the migration behavior of granular modulators in fracture-cavity reservoirs [29,30,31,32,33]. Furthermore, numerical simulation has the advantage of obtaining the relationship between the type, size, and concentration of the plugging agent and the fracture width, and can directly extend the experimental results to the strata conditions. For instance, Zhang et al. [34] used DEM technology to describe the migration path of thin fluid as particles but ignored the influence of particles on fluid flow and particle−particle interactions. Varga et al. [35] utilized the CFD−DEM coupled technique to simulate particle flow in a feed pipe, with prediction results for local particle packing density consistent with laboratory test results. Chu and Yu [36,37] successfully combined the DEM code with CFD software to simulate the particle−fluid flow in complex three-dimensional systems, demonstrating that the CFD−DEM method is a potential tool for analyzing internal particle flow and dynamic particle−fluid flow.
This paper conducts the CFD−DEM coupled simulation to investigate the sealing process of particles in the fracture-shrinking model and examine the influences of particle concentration, size, flow velocity, and density on the sealing process. The influences of particle size, fluid velocity, and fracture structure on pressure drop and bridging morphology during particle jamming are unraveled through analysis of simulation results, subsequently proposing a predictive approach for fractures and vugh sealing. The goal is to provide a constructive guide for the fractured-vuggy carbonate reservoir to improve production performance.
2. Methodology
The coupled CFD−DEM numerical method implemented by the CFD program based on the mass conservation equation, and the Navier−Stokes (N−S) and k-epsilon equations, contributing to simulate fluid flow and the Newton’s second law-based DEM module, which is utilized to derive the particle motion, is conducted to model the fluid−particle two-phase behavior. The forces involving particle–particle, particle–wall, and fluid–particle interaction are considered, and the two solid−liquid two phases are coupled by volume fraction and interaction force. In the following, the governing equations are briefly described.
2.1. CFD-Based Fluid Flow Model
The fluid flow through the fracture of an incompressible property with a secondary particulate phase can be mathematically described by the volume-averaged N−S equations [38].
where is the density of the liquid, kg/m3. is the volume coefficient of the liquid, . is the momentum exchange source term between the modulator and the liquid phase, .
2.2. DEM-Based Particle Model
DEM can calculate the trajectory of particles considering the interaction between each particle and the influence of container walls. The rotational and translational components are included in the motion of particles, and Newton’s second law-derived momentum balance equation with differential form is introduced to describe the motion of each individual particle [39,40].
where is the mass of the particle, kg. is the contact force between particles, N. is the drag force of the fluid, N. is the shearing lift force, N. is the rotational lift force or Magnus force, N. is the gradient force of the fluid pressure, N.
The particle rotational motion is described as:
where is the torque vector generated by the tangential contact force of particle q acting on particle p. is the torque vector generated by the normal contact force of particle q acting on particle p. is the inertia tensor. is the torque of the rotational velocity of particle p. The rotation movement is also influenced by the drag torque , which is produced by the sliding rotation.
In order to simplify the model for practical application and calculation, the following assumptions are made: (1) the liquid phase is assumed to be incompressible and inelastic fluid and is in an isothermal state, with relatively stable rheological properties that do not change with time and location; (2) the particles are assumed to be spherical rigid particles with uniform density, particle size, geometric size and friction angle, and the particles will not react with each other; (3) the particles that collide in the transport process of the modulator obey Newton’s second law, and their motion can be decomposed into two states of motion: translational state and rotational state.
3. DEM−CFD Model Setup
3.1. Geometry of Fracture-Shrinking Model
Based on the actual characteristics of the strata, the rock fracture width of carbonate reservoirs in the Tahe oil field varies from 0.001 mm to tens of millimeters [41]. A fracture-shrinking structure has been established, as depicted in Figure 1 to serve as a foundation for simulating fracture plugging under varying conditions such as particle size, fluid velocity, and particle concentration. The main fracture measures 1.2 m in length with a width of 8 mm and height of 0.2 m, transitioning into a narrow fracture structure through localized necking. The narrow fracture is 0.4 m in length with a height of 0.2 m. The main fracture is undergoing a transition to a narrow fracture structure via localized necking, while the joint angle of the three distinct joint combinations remains fixed at 7.125°. Table 1 lists the geometric parameters of the models.
3.2. Grid Model
ICEM CFD embedded in ANSYS version 22.2 (ANSYS, Inc., Canonsburg, PA, USA) is utilized to model and grid the aforementioned geometric models. Initially, the geometric modeling tool establishes the fundamental geometric model; subsequently, block grid division technology and local grid encryption technology are employed to partition the primary joint, transition segment, and secondary joint. The resulting grid system flawlessly maps onto the geometry. Then, in order to strike a balance between calculation velocity and accuracy, local nodes are established within the grid. Subsequently, the validity of the grid is verified before outputting a fluent-compatible file for solid−liquid two-phase flow calculations.
3.3. Experiment Validation
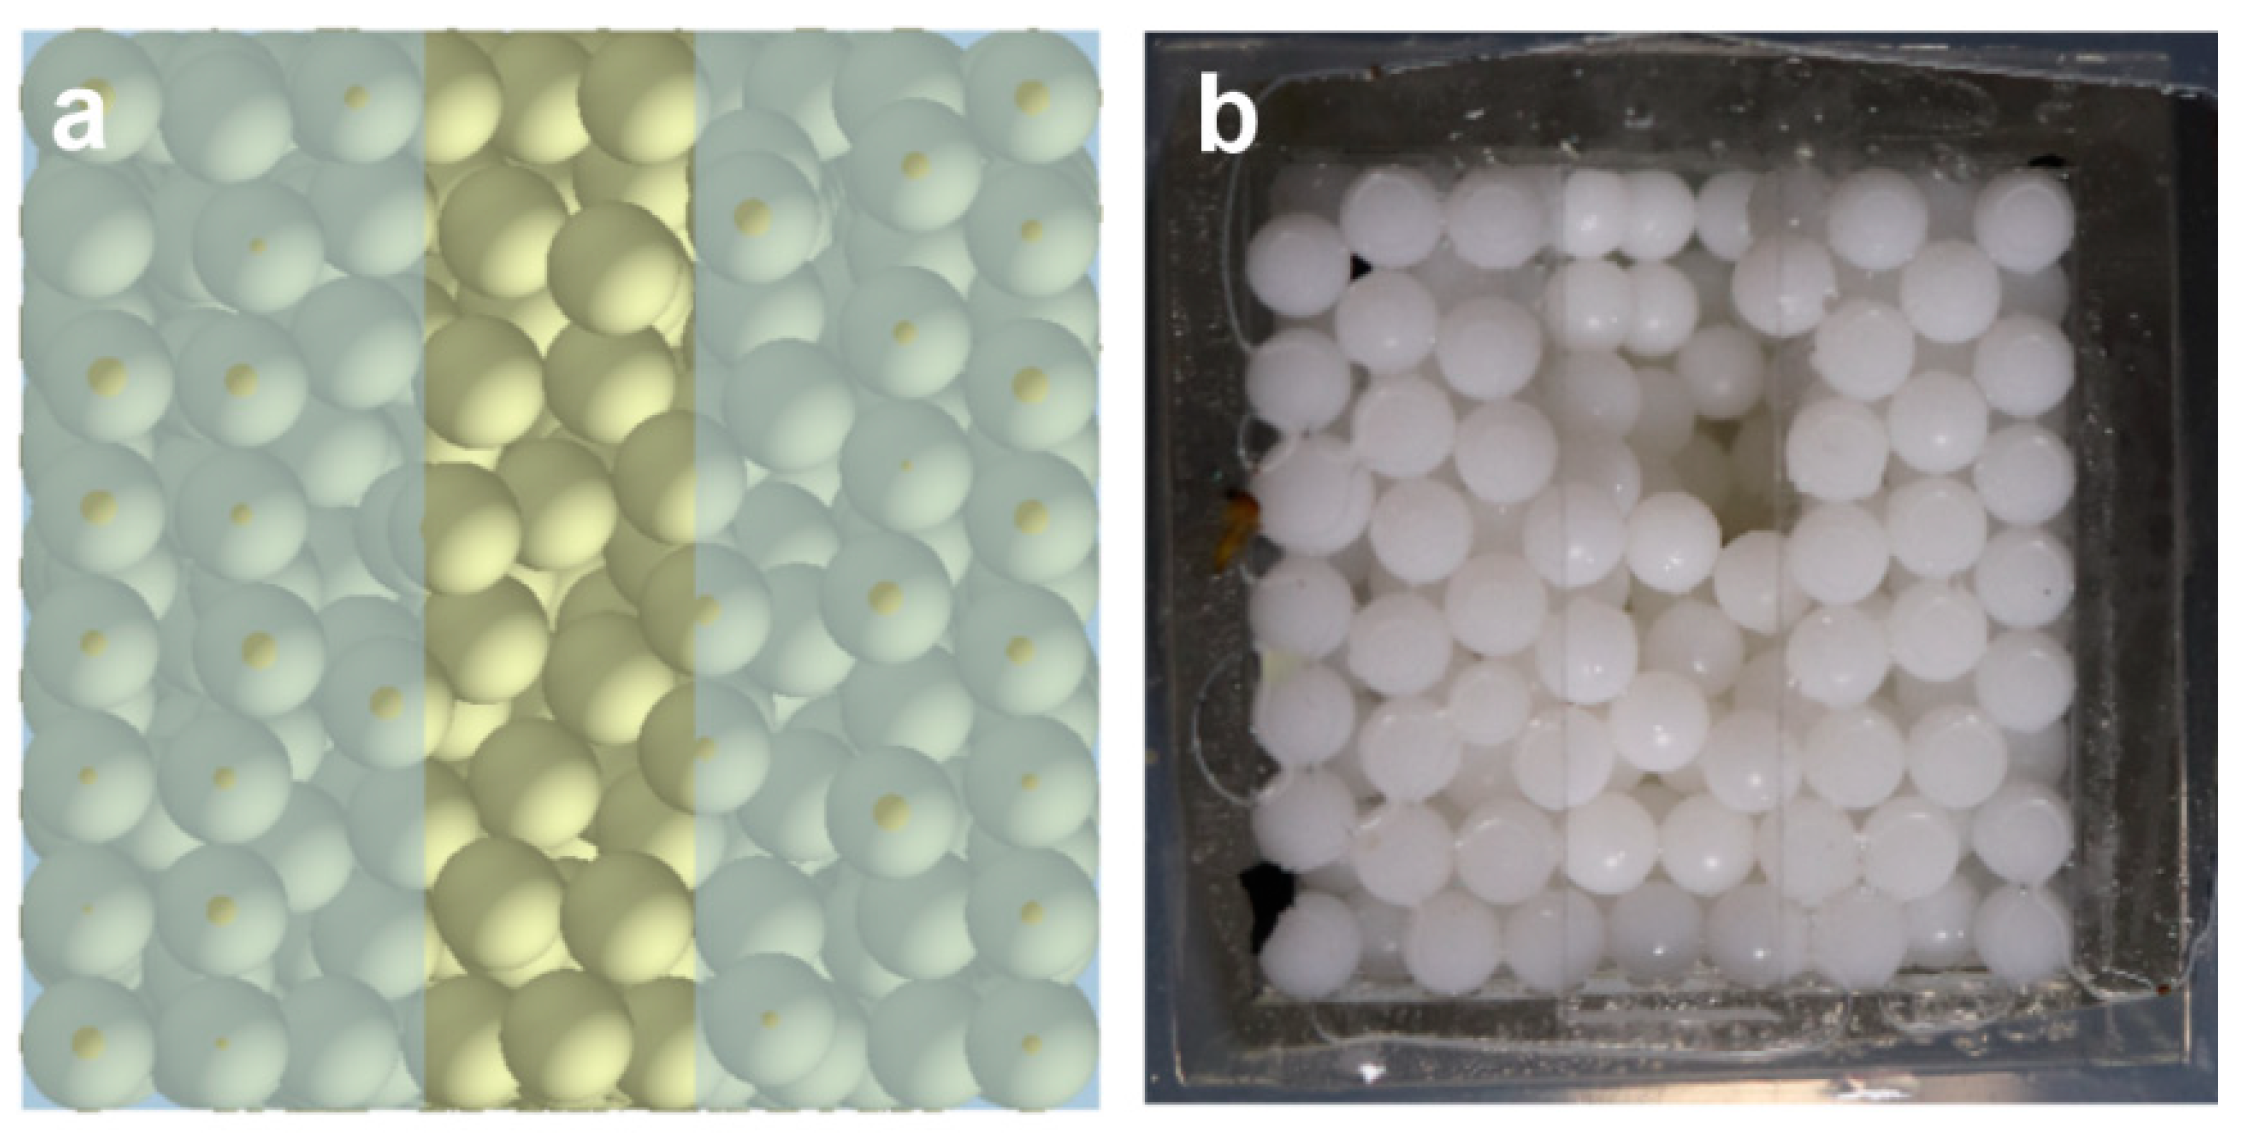
Utilizing the experimental results of the model with unchanged fracture height and suddenly contracted fracture width to 12 mm as the subject, the parameters employed in the numerical simulation are consistent with those used in the physical experiment. The simulation results are depicted in Figure 2. It is evident that the simulation results exhibit a jamming similar to that observed in the experiment, indicating that the established numerical model can accurately reflect the actual physical process.
3.4. Simulation Scenarios
Based on the actual geological characteristics and physical model experiments, four factors are selected to explore their influences on the jamming process in the simulation, including fracture size, injection velocity, particle volume concentration and particle diameter. Table 2 lists the parameters used in the simulation.
4. Results
4.1. Filling and Jamming Process
After conducting the abovementioned numerical simulations, we have identified four sealing processes in the fracture-shrinking structure. The primary influencing factor is the relationship between particle size and the main and secondary fractures. By comprehending these four sealing processes and analyzing their underlying mechanisms, we thus can effectively elucidate the principle of particle sealing in fractures and determine conditions conducive to such sealings.
4.2. Sealing Mode 1: Normal Filling
Sealing mode 1 refers to the normal filling phenomenon, which occurs when the ratio of diameter to fracture width (D/W) is less than or equal to 0.4 under simulated conditions of concentration and velocity. For instance, the simulation scenario, including a diameter of 2 mm, a fracture width ranging from 8 mm to 5 mm, a concentration of 4%, and a velocity of 0.6 m/s, is introduced to unravel the characteristics of its filling process. The main filling and sealing process can be divided into two stages (Figure 3).
- Accumulation in the main fracture: When the particles did not reach the shrinking position of the fracture, regulator particles subjected to a combined action of fluid drag force and gravity within the fracture subsided in large quantities, forming an accumulation of sandpile, due to gravitational differences. The entire stacking process is comprised of an initial settling of the modulator, establishment of equilibrium height for modulator accumulation, forward growth of the modulator bed, and arrival at the shrinking position (Figure 3).
- Accumulation in the narrow fracture: Upon reaching the shrinking position of the fracture, due to the smaller particle size of the regulator compared to that of the secondary fracture (2.5 times smaller), its migration state through the secondary fracture is less affected by the shrinkage neck, allowing for smooth passage of regulator particles through the shrinkage position and achieving normal accumulation. Despite this, a few bridging structures may still form in the local position between particles, hindering the movement of local regulator particles. However, these unstable local bridging structures cannot withstand high-velocity fluid erosion and are easily destroyed, thus failing to jam the flow effectively. From another perspective, the sealing process is characterized by dynamic, and the extent of particle sealing at the neck is closely related to the formation and destruction of particle bridging structures. When the particle bridging structure is robust and stable, its failure and disintegration rate are lower than that of bridging structure formation, resulting in an effective particle sealing effect. However, if the particle bridging structure is unstable, its destruction and disintegration velocity will exceed the formation velocity of the bridge structure, rendering it ineffective in sealing. Considering the current simulation scenario, a relatively stable sealing structure cannot be formed due to the particle size being smaller than that of the narrow fracture. Consequently, an effective seal cannot be achieved, and a normal filling process ensues.
As indicated by Figure 4, the accumulation of particles results in a significant pressure drop within the fracture due to increased fluid resistance. Figure 4 depicts that the primary pressure drop occurs at the rear of the fracture due to the narrow fracture width. Proper particle accumulation reduces fluid resistance and increases pressure drop through the main crack. In contrast, in the case of proper particle accumulation, the fluid resistance through the main fracture is lower, resulting in a significant pressure drop. This leads to a more uniform pressure distribution throughout the entire fracture and eliminates any noticeable pressure drops caused by sealing.
4.3. Sealing Mode 2: Local Jamming
This mode refers to local blockage, which occurs when the ratio of particle diameter to fracture width is between 0.4 and 0.625 under simulated conditions of concentration and velocity. In the following, we describe the characteristics of its filling process with a given scenario which has a particle diameter of 2 mm, a fracture width ranging from 8 mm to 4 mm, a concentration of 4%, and a velocity of 0.6 m/s. The main filling and jamming process can be divided into two stages as follows (Figure 5).
- Accumulation in the main fracture: The accumulation in the main fracture is similar to that of the first type. Before reaching the fracture shrinking position, the particles of the flow regulator in the fracture are subjected to both fluid drag and gravity, resulting in a large number of deposits in the fracture and forming a sand dune. The entire process is consistent with sealing mode 1.
- Local jamming: The particles with a size of 2 mm can pass through shrinkage fracture with a change width from 8 mm to 4 mm, resulting in an apparently local jamming effect, while flow-regulating particles can form local bridging structures. However, due to the relatively large width of the narrow fracture (twice the particle size), the formed bridge structure is not completely stable and is constantly generated and destroyed by particle bridging until reaching dynamic equilibrium after a certain period of time. Therefore, it cannot effectively seal the extension. Thus, it does not form the sealing extension along the vertical direction, resulting in incomplete sealing.
Figure 6 illustrates the pressure distribution, indicating that the accumulation of particles results in a significant pressure drop within the fracture due to increased resistance of fluid flowing through the particles. Since no particle accumulation occurs at the half height of the fracture in the flow regulator, pressure drop primarily occurs due to the necking effect. The flow resistance is essentially equivalent to that in the wide fracture, resulting in uniform pressure throughout and no significant sealing.
4.4. Sealing Mode 3: Complete Jamming
A complete sealing is observed at the shrinking position of this mode. Under simulated conditions of concentration and velocity, it manifests as a particle diameter to fracture width ratio with a range of 0.625 < D/W ≤ 0.77. To illustrate this phenomenon, hereafter, an instance is described with a particle diameter of 2 mm, fracture width varying from 8 mm to 3 mm, a concentration of 4%, and a velocity of 0.6 m/s. In this scenario, we delve into the characteristics exhibited during its filling process, which can be effectively divided into three distinct stages (Figure 7).
- Accumulation in the main fracture: This stage is similar to the previous two modes.
- Jamming process at the fracture-shrinking position: When the regulator particles reach the constriction of the fracture, a significant number of them become trapped in the wide fracture and are unable to migrate to the narrow fracture due to particle bridging with the wall. Nevertheless, due to the particle size being larger than the width of the narrow fracture, a relatively stable local bridging structure is formed between particles and between particles and the wall, which can also maintain its stability under fluid erosion. Hence, the particles flowing through the shrinkage position of fracture are significantly fewer in number than those involved in bridging to establish a stable structure. Consequently, regulatory particles gradually accumulate and obstruct the fracture-shrinking position until it is completely sealed.
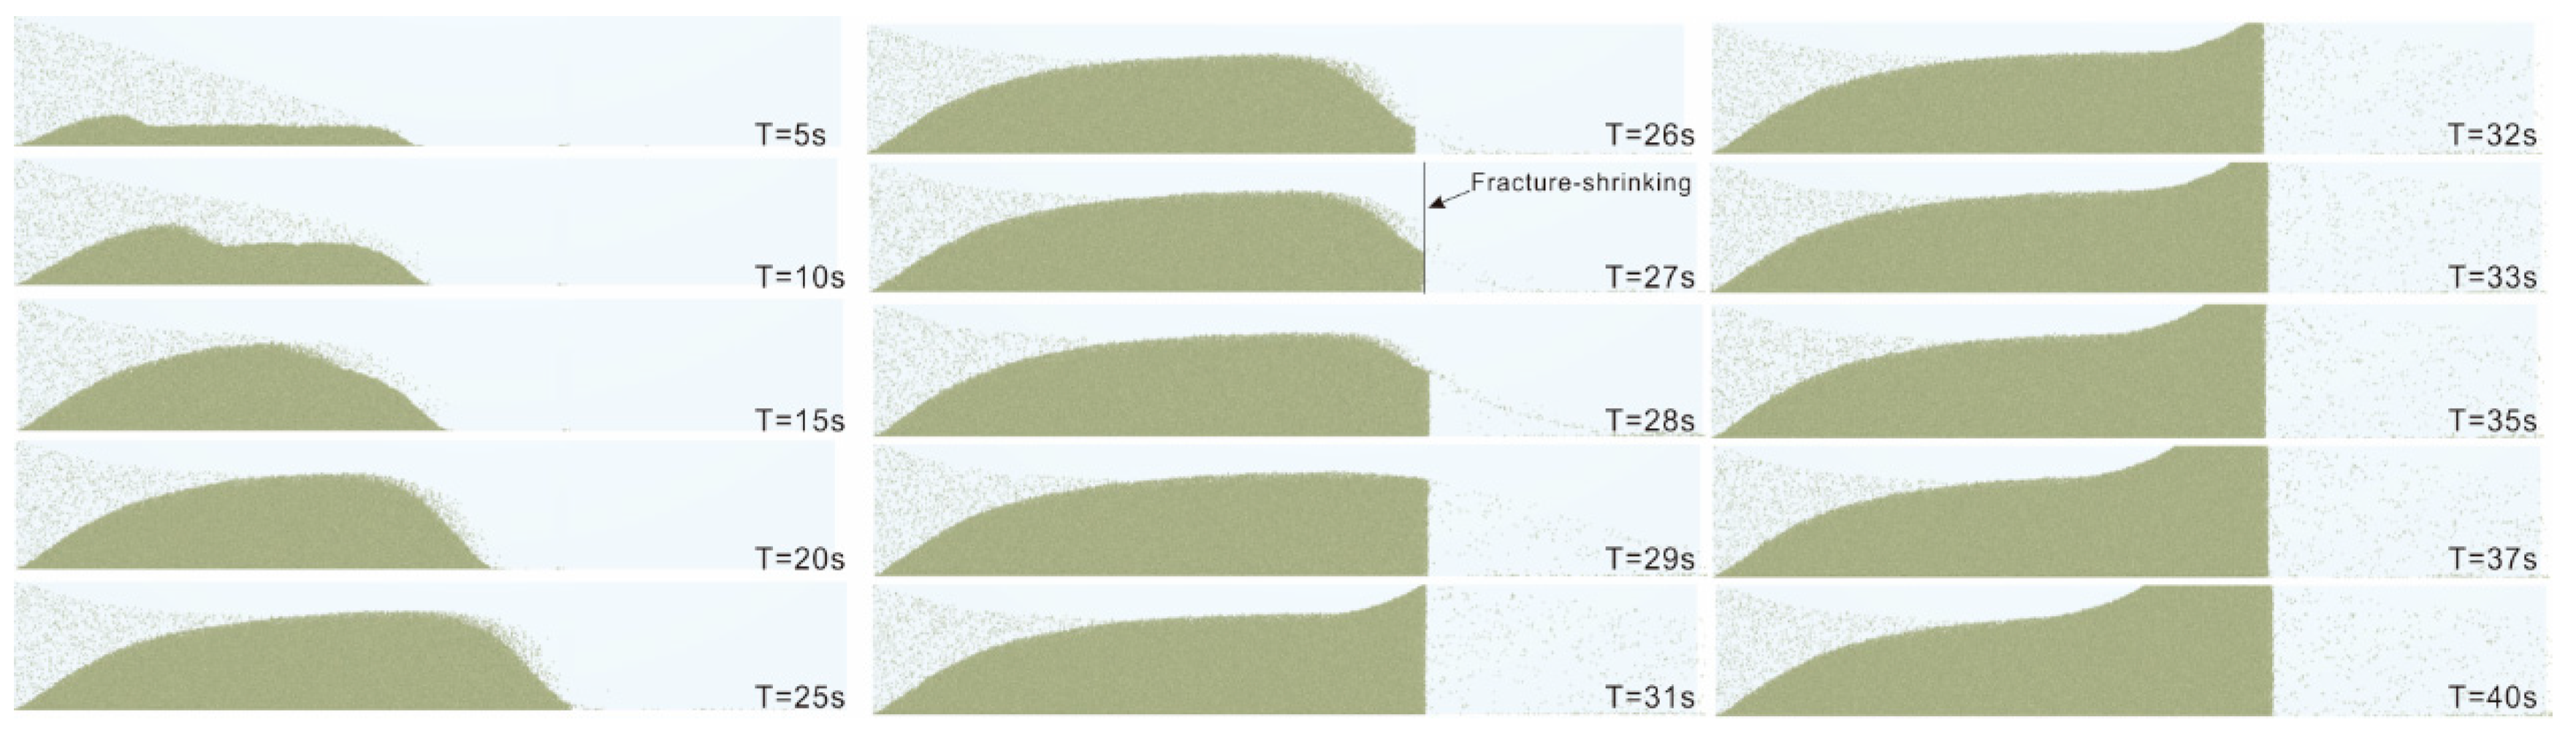
- Accumulating backward in the main fracture: After the complete sealing of the shrinkage position, a small amount of local bridging structure is eroded by fluid and enters the narrow fracture. However, due to the structural stability, subsequent injection particles rapidly replenish the damaged bridging structure, resulting in significantly fewer particles entering the narrow fracture compared to the number of bridging particles. Thus, the extra particles accumulate in reverse order within the wide fracture, causing the particle bed to grow backward as a whole until it completely fills up the main fracture (Figure 7).
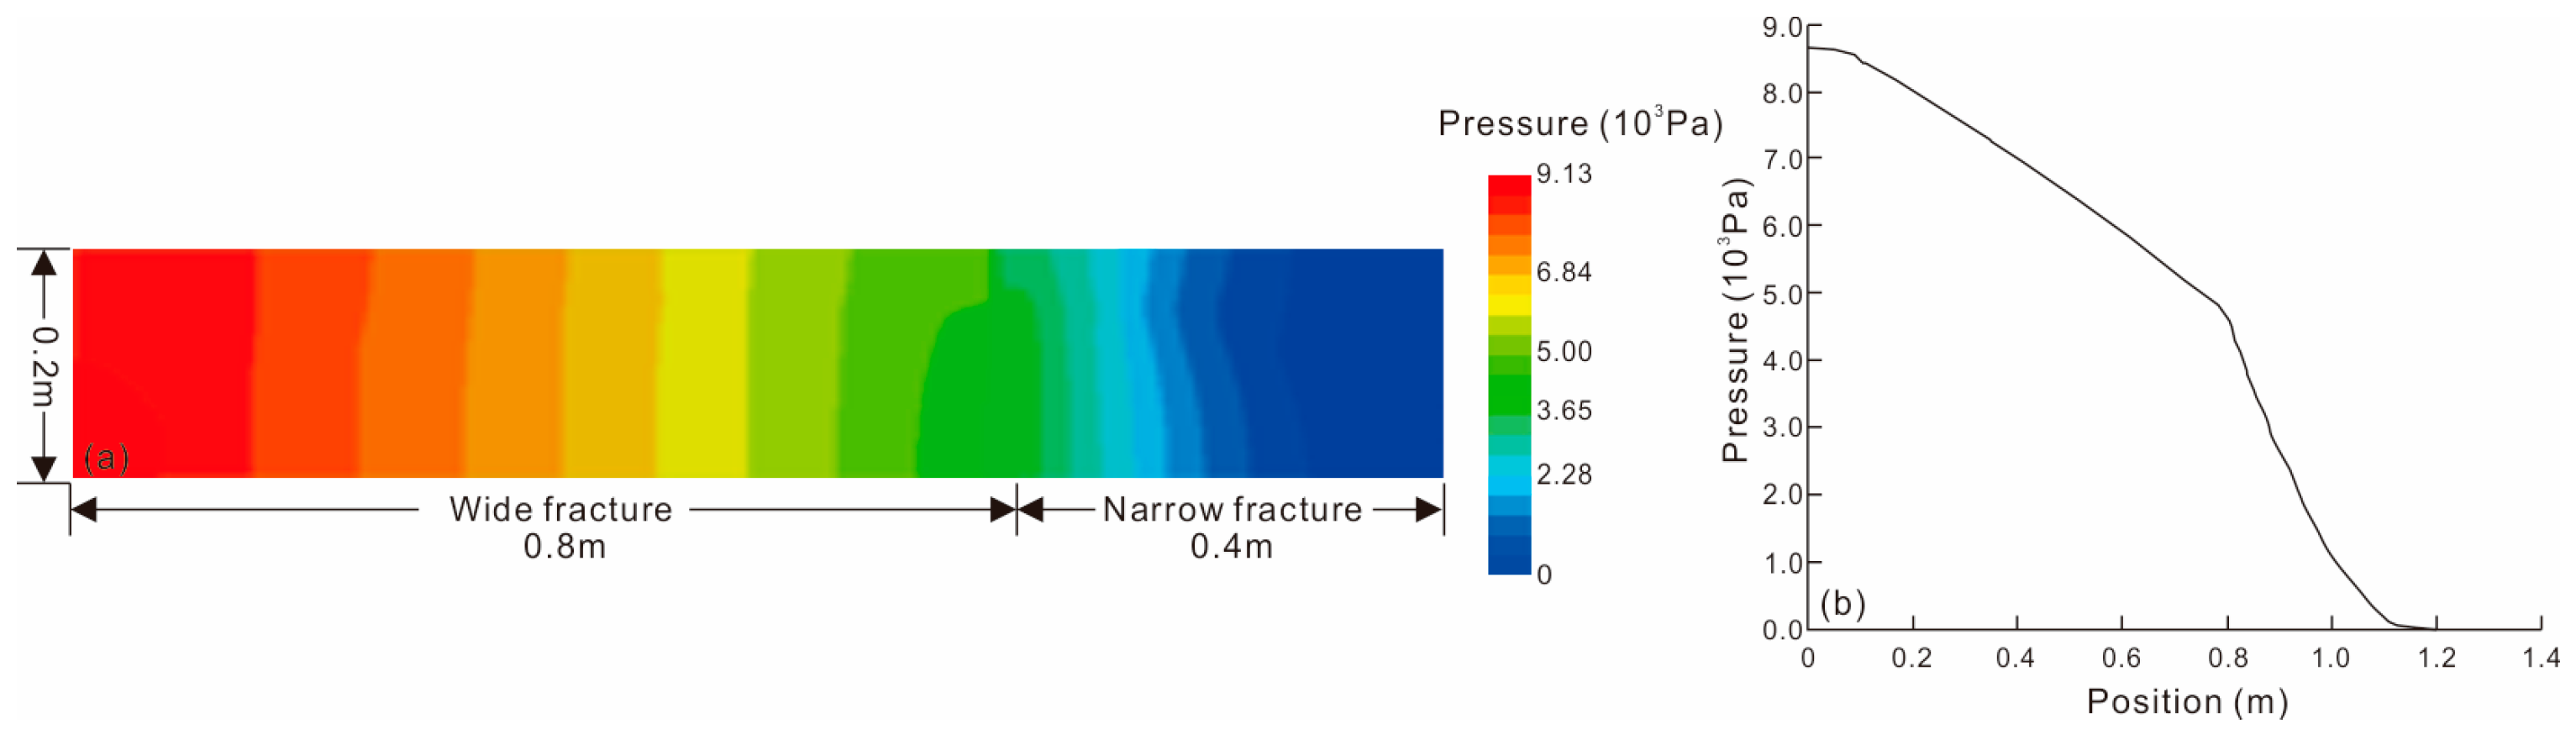
The accumulation of particles results in a significant pressure drop within the fracture due to increased fluid flow resistance through the particle pack (Figure 8). However, minimal particle accumulation occurs at the narrow fracture, and thus, any pressure drop generated by fluid flow is primarily attributed to heightened flow resistance after the fracture shrank. The pressure drop in the main fracture is evidently composed of two distinct curves with different slopes. This phenomenon can be attributed to the accumulation of particles and high porosity near the injection port, which results in minimal impact on fluid flow through this region. During the process of backward accumulation, the main fracture at 0.6–0.8 m will undergo continuous compaction, resulting in localized particle voids and a significant pressure drop for fluid flow. This leads to the formation of two distinct sections with varying slopes on the pressure drop curve. This indicates that the primary pressure drop during the sealing process of the modulator particles is not solely caused by the fluid passing through the accumulated particles but also vastly influenced by compaction during backward accumulation.
4.5. Sealing Mode 4: Sealing in the Main Fracture
This mode refers to a local sealing occurring in the main fracture when the particle size is less than one-third of the main fracture. In this case, with a particle size of 3 mm, fracture width varying from 8 mm to 5 mm, concentration of 4%, and velocity of 0.6 m/s, the following section demonstrates the characteristics of its filling process. The primary filling and sealing process can be divided into two stages (Figure 9).
- Accumulation in the main fracture: When the particles within a fracture are rare, the modulator particles in fracture experience a joint effect of fluid drag force and gravity. As such, these modulator particles settle normally within the fracture and accumulate significantly at its entrance of narrow fracture. However, there is a minimal forward extension of the sand embankment. It forms a deposit at the entrance. Thus, accumulating processes differ from the abovementioned modes.
- Local jamming in the main fracture: With the increase in the injection of flow regulator particles, the effect of particle–particle and particle–wall interactions is enhanced. This leads to a hindered movement of particles within the fracture, preventing them from advancing normally. Thus, the particles gradually accumulate within the main fracture and progressively block it. Once the front of the fracture is blocked, the modulator particles slowly advance, ultimately achieving complete blockage within the main fracture.
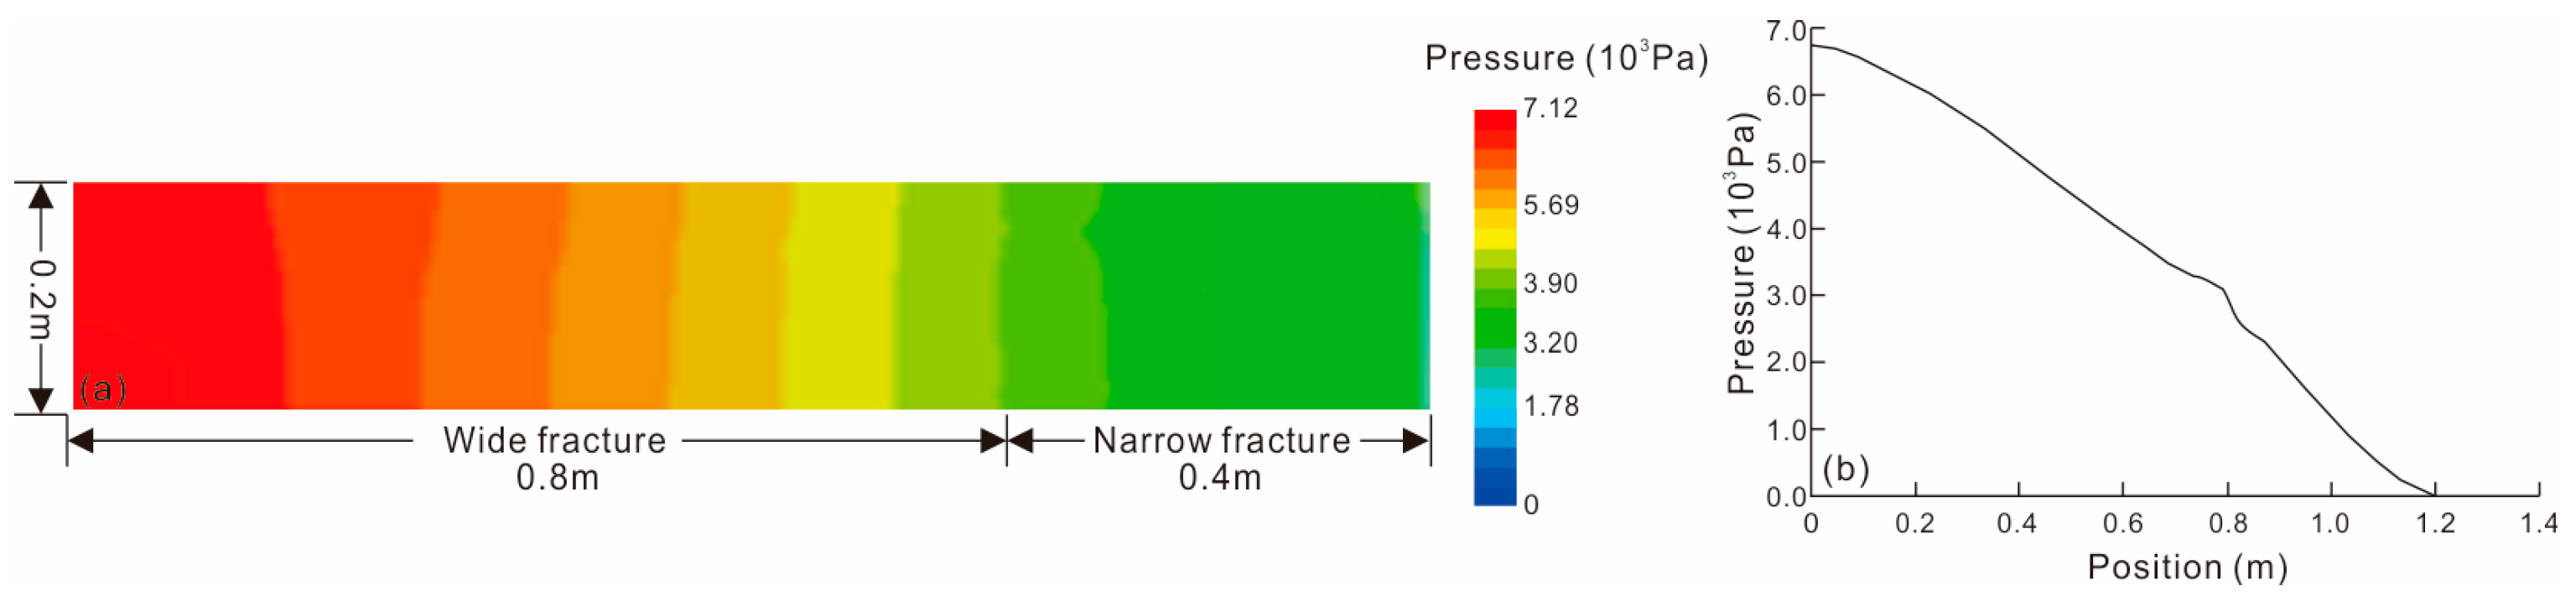
Figure 10 depicts the pressure distribution of this mode. Particles predominantly accumulate within the main fracture, resulting in a significant pressure drop across the fracture due to heightened fluid resistance through the particle-filled layer. Conversely, rare particles are observed in the narrow fracture, where the pressure drop primarily arises from increased flow resistance subsequent to fracture necking. The pressure drop across the main fracture exhibits a linear trend, indicating uniform particle distribution within the fracture and the absence of local extrusion. The sealing performance is primarily influenced by the particle accumulation state in the main fracture.
5. Microscopic Analysis of Local Accumulation
Figure 11 shows the local sealing structure of particles corresponding to different sealing modes. Figure 11a shows the typical filling behavior of mode 1, where no local bridging structure is formed in the main fracture due to the presence of small particles. The particle size to narrow fracture width ratio at the neck is 0.4, which prevents effective bridging structure formation during fracture contraction and allows for easier flow into a narrow fracture. However, this flow cannot achieve three particles flowing side by side in the same plane and will be hindered, resulting in the uneven filling of the local regulator. Figure 11b illustrates sealing mode 2, which also lacks a localized bridging structure in the main fracture. The ratio of particle size to narrow fracture width is 0.5, resulting in the formation of a bridge structure with a certain degree of stability at the crack neck, impeding the flow of particles. However, due to the relatively large width of the narrow fracture, its structural stability is insufficient, resulting in a lower sealing height and only local sealing being achieved. Figure 11c depicts the complete sealing of mode 3. It is evident that no local bridging structure forms in the main fracture due to small particles. Nevertheless, at neck shrinkage, where the ratio of particle size to narrow fracture width is 0.66, an effective bridging structure forms and remains relatively stable even under fluid erosion. Figure 11d demonstrates sealing mode 4, which forms a localized bridging structure in the main fracture due to the ratio of particle size to the width of the main fracture, leading to uneven filling of regulator particles and resulting in local jamming.
Figure 12 shows the specific sealing structures corresponding to different ratios of particle to fracture width. As depicted in the figure, for mode 1, the small particle size compared to the fracture width results in only the boundary layer particles experiencing strong forces, while the inner particles are subject to weak wall constraints and a large number of particles on the cross-section. Therefore, a stable bridging structure cannot be formed to achieve sealing of the crack.
For mode 2, the ratio of particle size to fracture width is greater than that of type 1, resulting in an enhanced wall force on particles located in the middle of the crack section. However, since the critical value for a sufficiently large ratio has not been reached, only certain angles can form stable structures, while other areas struggle to achieve stable blocking structures. Therefore, the entire sealing remains difficult to realize.
For mode 3, the particle size distribution range is 0.625 < D/W ≤ 0.77. Due to its larger ratio of particle size to fracture width, it can form a stable triangular structure at the joint with an angle range close to 45°, thereby creating a structurally robust formation that resists destruction. This enables entire sealing at the joint during particle transportation. Conversely, particles larger than 0.77 times the fracture width, which are close to the fracture width, result in smaller angles formed between particles and walls or between adjacent particles. Consequently, these particles fail to establish stable blockages compared to smaller particles effectively.
6. Discussion
6.1. Influence of Particle Size
The influence analysis of particle size parameters was conducted based on the parameter settings provided in Table 3. In this section, we maintained a consistent fracture size while varying the particle size within the range of 1.5–3 mm, and ensured that the particle concentration remained constant.
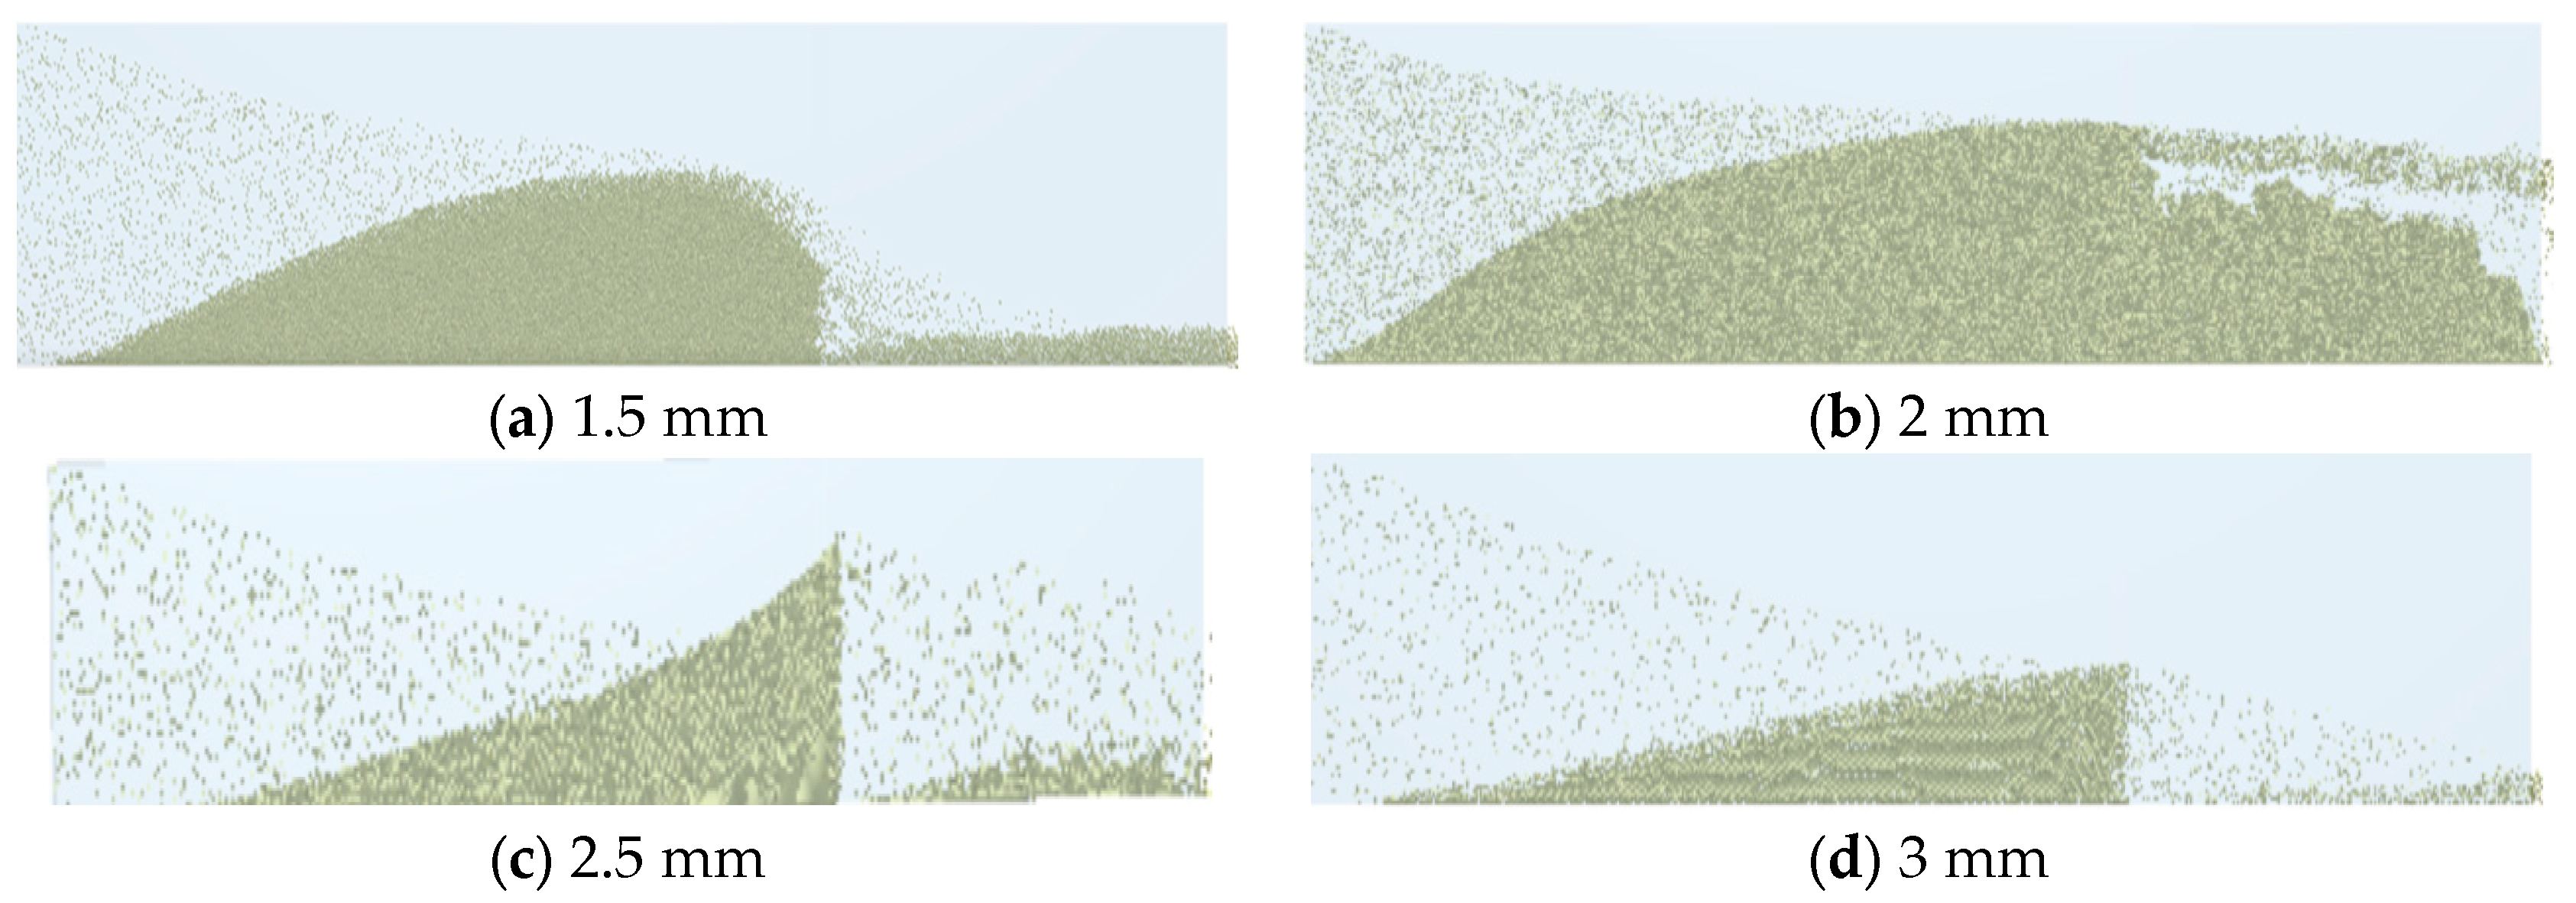
Firstly, it is important to note that due to the consistent concentration of particle volume, the quantity of particles injected into the fracture simultaneously by larger particle sizes is relatively lower compared to smaller particles. Therefore, we analyze the sealing effect not based on particle accumulation form but rather on the sealing condition at the shrinkage joint. Simulation results indicate that as the modulator’s particle size gradually increases, its blocking effect improves (Figure 13). Nevertheless, 3 mm particles exhibit a weaker blocking effect than 2.5 mm particles. Preliminary analysis suggests that this may be attributed to the large size of 3 mm particles, which hinders the effective formation of a “bridge” between them and the wall at the shrinkage joint, thus preventing local stable structure formation and allowing most of them to pass through.
The cause of this phenomenon can be elucidated by analyzing the local sealing structure (Figure 14). It is evident that when the particle size is small (2 mm), the particles only form a localized bridge and do not establish a stable structure on the fracture width, resulting in poor sealing effectiveness. As the particle size gradually increases to 2.5 mm, it forms a more stable bridging structure at the joint and avoids destruction, leading to better sealing performance of prticles. However, as particle size continues to increase (3 mm), since a single particle occupies almost the entire width of the fracture, its bridging structure with other particles and walls becomes extremely unstable and difficult to form effectively, thus resulting in a poor blocking effect.
The pressure drop (Figure 15) illustrates the impact of particle size blocking. It is evident from the pressure contour plot that the local pressure drop resulting from a 2.5 mm blockage is the most significant, indicating optimal blocking efficiency.
6.2. Influence of Particle Concentration
The influence analysis of particle size parameters is conducted based on the parameter settings provided in Table 4. Herein, we maintain a consistent fracture size while varying the particle concentration within the range of 4% to 6%, ensuring that the particle size remains constant.
Through the simulation results of varying particle concentrations, it is noted that an increase in the concentration of the regulator within the local position leads to enhanced particle collisions, thereby resulting in greater settlement within the wide fracture (Figure 16). Similarly, at the neck of the fracture, a substantial number of particles come into contact with each other and exhibit increased interaction with the wall surface, consequently facilitating the effective formation of localized jamming structures and subsequently yielding improved sealing efficacy.
It can be observed from the fracture pressure drop curve that the pressure drop generated in the fracture under 6% particle concentration is significantly higher than that under 4% particle concentration, indicating a superior sealing effect of 6% particles (Figure 17). Similar results were obtained through simulation in Group 2, where high-concentration groups effectively increased accumulation body within fractures and enhanced local sealing (Figure 18).
From the local particle structure (Figure 19), it is observed that low-concentration modulator particles exhibit weak local interaction and are unable to form a stable structure with the wall surface. As concentration increases, contact opportunities between particles and between particles and the wall increase, resulting in enhanced contact force and the formation of a more expansive and stable blocking structure at the fracture contraction joint.
6.3. Influence of Injection Velocity
The influence of particle size parameters was analyzed based on the parameter settings presented in Table 5. Specifically, while maintaining a consistent fracture size and particle concentration, we varied the particle pumping velocity from 0.4 m/s to 0.8 m/s.
The main manifestation for Group 1 is the second mode of local jamming. Through simulation results at various injection velocities, it can be observed that an increase in velocity leads to a deteriorating blocking effect of the flow regulator (Figure 20). This phenomenon arises due to the high shear forces generated by larger particles, which disrupts the stable structure formed between the regulator and wall at the contraction joint, consequently causing more regulator particles to advance.
For Group 2, sealing mode 3 of complete sealing is predominant (Figure 21). The simulation results demonstrate that regulator particles can achieve full jamming in the fracture at a low velocity of 0.6 m/s, whereas an increase in velocity to 1.2 m/s fails to attain complete sealing due to insufficient fracture height.
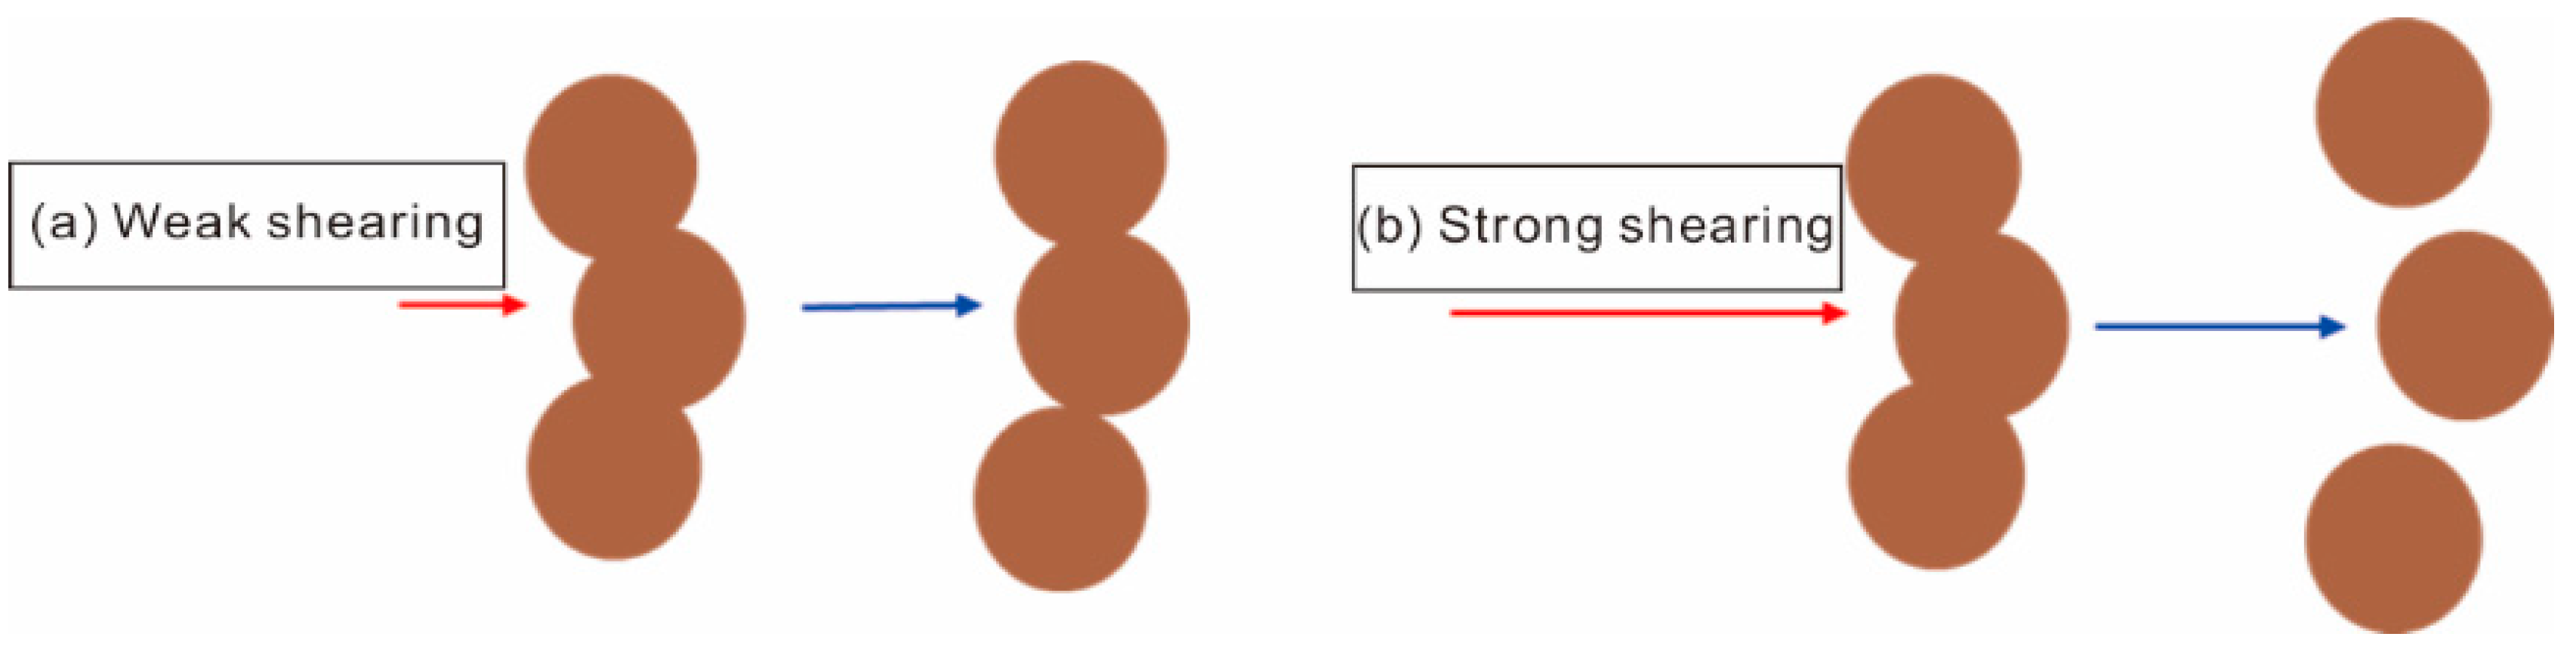
The local particle sealing structure of the formed particles, as depicted in Figure 22, and the local fracture−particle structure, exhibit minimal disruption under low flow rate conditions, thereby preserving its integrity. However, as fluid velocity increases, the sealing structure experiences escalating fluid shear forces, leading to its eventual deterioration and subsequent reduction in overall sealing performance.
7. Conclusions
This paper investigated the sealing process of particles in the fracture-shrinking model and examined the influences of particle concentration, size, flow velocity, and density on the sealing process by conducting the CFD−DEM coupled simulations. The influences of particle size, particle concentration, and injection velocity on particle jamming were analyzed, subsequently proposing a predictive approach for fractures and vugh sealing.
- Four sealing modes are revealed: normal filling, local jamming, complete sealing, and sealing in the main fracture. Among the four sealing modes, the ratio of particle size to main fracture width exerts the primary role, while the ratio of particle diameter to fracture width with a range of 0.625 < D/W ≤ 0.77, shows the complete jamming.
- With an increase in particle size, the sealing effect of particles is enhanced, while an optimal particle size for achieving stable sealing is observed. When the particle size varies from 2 to 2.5 mm, a more stable bridging structure at the joint and avoids destruction is observed. However, as particle size continues to increase (3 mm), the bridging structure becomes extremely unstable.
- The influence of particles on jamming is complex and varies with the particle concentration and the injection velocity. A higher concentration of particles yields better results in the fracture-shrinking model. With the increase of the velocity, the fluid drag exerted on the clogged particles increases, leading to increased local blocking effects on damage within such structures and consequently worsening the sealing effect on fractures.
Author Contributions
Conceptualization, J.Z.; methodology, J.Z.; software, J.Z.; validation, C.L.; formal analysis, T.Z.; data curation, T.Z.; writing—original draft, J.Z.; writing—review & editing, C.L., T.Z. and J.G.; supervision, J.G.; funding acquisition, C.L. All authors have read and agreed to the published version of the manuscript.
Funding
This research was funded by the National Natural Science Foundation of China (52374044) and Sichuan Province Science and Technology Planning Projects (2023JDRC0008).
Data Availability Statement
The data presented in this study are available on request from the corresponding author.
Acknowledgments
This article was prepared under the auspices of the National Key Laboratory of Oil and Gas Reservoir Geology and Exploitation at Southwest Petroleum University.
Conflicts of Interest
The authors declare no conflict of interest.
References
- Zhang, Y.; Zhang, L.; He, J.; Zhang, H.; Zhang, X.; Liu, X. Fracability evaluation method of a fractured-vuggy carbonate reservoir in the shunbei block. ACS Omega 2023, 8, 15810–15818. [Google Scholar] [CrossRef]
- Martyushev, D.A.; Davoodi, S.; Kadkhodaie, A.; Riazi, M.; Kazemzadeh, Y.; Ma, T. Multiscale and diverse spatial heterogeneity analysis of void structures in reef carbonate reservoirs. Geoenergy Sci. Eng. 2024, 233, 212569. [Google Scholar] [CrossRef]
- Chang, F.F. Acid fracturing stimulation. In Fluid Chemistry, Drilling and Completion; Gulf Professional Publishing: Oxford, UK, 2022; pp. 387–419. [Google Scholar]
- Sun, Q.; Zhang, N.; Fadlelmula, M.; Wang, Y. Structural regeneration of fracture-vug network in naturally fractured vuggy reservoirs. J. Pet. Sci. Eng. 2018, 165, 28–41. [Google Scholar] [CrossRef]
- Qu, M.; Hou, J.; Qi, P.; Zhao, F.; Ma, S.; Churchwell, L.; Wang, Q.; Li, H.; Yang, T. Experimental study of fluid behaviors from water and nitrogen floods on a 3-D visual fractured-vuggy model. J. Pet. Sci. Eng. 2018, 166, 871–879. [Google Scholar] [CrossRef]
- He, D.; Jia, C.; Zhao, W.; Xu, F.; Luo, X.; Liu, W.; Tang, Y.; Gao, S.; Zheng, X.; Li, D.; et al. Research progress and key issues of ultra-deep oil and gas exploration in China. Pet. Explor. Dev. 2023, 50, 1333–1344. [Google Scholar] [CrossRef]
- Yao, Y.; Zeng, L.; Mao, Z.; Han, J.; Cao, D.; Lin, B. Differential deformation of a strike-slip fault in the Paleozoic carbonate reservoirs of the Tarim Basin, China. J. Struct. Geol. 2023, 173, 104908. [Google Scholar] [CrossRef]
- Zheng, S.; Yang, M.; Kang, Z.; Liu, Z.; Long, X.; Liu, K.; Li, X.; Zhang, S. Controlling factors of remaining oil distribution after water flooding and enhanced oil recovery methods for fracture-cavity carbonate reservoirs in Tahe Oilfield. Pet. Explor. Dev. 2019, 46, 786–795. [Google Scholar] [CrossRef]
- Méndez, J.N.; Jin, Q.; González, M.; Zhang, X.; Lobo, C.; Boateng, C.D.; Zambrano, M. Fracture characterization and modeling of karsted carbonate reservoirs: A case study in Tahe oilfield, Tarim Basin (western China). Mar. Pet. Geol. 2020, 112, 104104. [Google Scholar] [CrossRef]
- Zhang, Y.; Zhang, S.; Huang, B.; Lu, Z.; Ye, N.; Zhu, B.; Hou, X.; Xie, F.; Bai, X.; Zhang, X. Fluid Inclusion, Isotopic, and Elemental Geochemistry Studies of Cave-Filling Calcite in the Lower–Middle Ordovician Yingshan Formation of Tahe Oilfield, NW China: Implication for Karstification in Non-exposed Limestone. Front. Earth Sci. 2022, 10, 842386. [Google Scholar] [CrossRef]
- Li, Y.; Sun, J.; Wei, H.; Song, S. Architectural features of fault-controlled karst reservoirs in the Tahe oilfield. J. Pet. Sci. Eng. 2019, 181, 106208. [Google Scholar] [CrossRef]
- Xu, X.; Chen, Q.; Zhang, Y.; Wang, J.; Li, Y.; Kang, Z.; Zhang, Y. Research progress and prospect of Ordovician carbonate rocks in Tahe oilfield: Karst feature. J. Pet. Explor. Prod. Technol. 2021, 11, 3889–3902. [Google Scholar] [CrossRef]
- Li, X.; Huang, X.; Yu, S.; Lu, D.; Du, X. Numerical study on the transient pressure response of the vug in carbonate reservoirs. Pet. Sci. Technol. 2023, 1–20. [Google Scholar] [CrossRef]
- Cheng, W.; Liu, Z.; Yang, H.; Wang, W. Non-linear seepage characteristics and influential factors of water injection in gassy seams. Exp. Therm. Fluid Sci. 2018, 91, 41–53. [Google Scholar] [CrossRef]
- Liu, Y.; Hou, J.; Zhao, H.; Liu, X.; Xia, Z. Numerical simulation of simultaneous exploitation of geothermal energy and natural gas hydrates by water injection into a geothermal heat exchange well. Renew. Sustain. Energy Rev. 2019, 109, 467–481. [Google Scholar] [CrossRef]
- Crandall, D.; Bromhal, G.; Karpyn, Z.T. Numerical simulations examining the relationship between wall-roughness and fluid flow in rock fractures. Int. J. Rock Mech. Min. Sci. Geomech. Abstr. 2010, 47, 784–796. [Google Scholar] [CrossRef]
- Hawez, H.K.; Sanaee, R.; Faisal, N.H. A critical review on coupled geomechanics and fluid flow in naturally fractured reservoirs. J. Nat. Gas Sci. Eng. 2021, 95, 104150. [Google Scholar] [CrossRef]
- Zhao, X.; Chen, Z.; Wang, B.; Liao, X.; Li, D.; Zhou, B. A Multi-medium and Multi-mechanism model for CO2 injection and storage in fractured shale gas reservoirs. Fuel 2023, 345, 128167. [Google Scholar] [CrossRef]
- Sun, K.; Liu, H.; Leung, J.Y.; Wang, J.; Feng, Y.; Liu, R.; Zhang, Y. Impact of effective stress on permeability for carbonate fractured-vuggy rocks. J. Rock Mech. Geotech. Eng. 2023, 16, 942–960. [Google Scholar] [CrossRef]
- Huang, J.; Zhang, J.; Xu, D.; Zhang, S.; Tong, H.; Xu, N. From jammed solids to mechanical metamaterials: A brief review. Curr. Opin. Solid State Mater. Sci. 2023, 27, 101053. [Google Scholar] [CrossRef]
- Behera, N.; Agarwal, V.K.; Jones, M.G.; Williams, K.C. CFD modeling and analysis of dense phase pneumatic conveying of fine particles including particle size distribution. Powder Technol. 2013, 244, 30–37. [Google Scholar] [CrossRef]
- Raynal, L.; Augier, F.; Bazer-Bachi, F.; Haroun, Y.; da Fonte, C.P. CFD Applied to Process Development in the Oil and Gas Industry—A Review. Oil Gas Sci. Technol. Rev. d’IFP Energies Nouv. 2016, 71, 42. [Google Scholar] [CrossRef]
- Ramakrishna, P.; Singh, J.K.; Sahoo, A.; Mohapatra, S.S. CFD simulation for coal gasification in fluidized bed gasifier. Energy 2023, 281, 128272. [Google Scholar]
- Niu, B.; Ahmed, M.; Wen, T.; Xu, G.; Liu, X. Particle-resolved CFD modeling of the flow and heat transfer characteristics of the fluid in a fixed bed. Powder Technol. 2023, 421, 118445. [Google Scholar] [CrossRef]
- Marquez, M.; Williams, W.; Knobles, M.M.; Bedrikovetsky, P.; You, Z. Fines Migration in Fractured Wells: Integrating Modeling with Field and Laboratory Data. SPE Prod. Oper. 2014, 29, 309–322. [Google Scholar] [CrossRef]
- Damjanac, B.; Cundall, P. Application of distinct element methods to simulation of hydraulic fracturing in naturally fractured reservoirs. Comput. Geotech. 2016, 71, 283–294. [Google Scholar] [CrossRef]
- Tomac, I.; Gutierrez, M. Micromechanics of hydraulic fracturing and damage in rock based on DEM modeling. Granul. Matter 2020, 22, 1–17. [Google Scholar] [CrossRef]
- Li, Y.; Hu, W.; Wei, S.; Li, L.; Zhang, Z.; Song, S. Influence of preexisting discontinuities on hydraulic fracture complexity in a naturally fractured reservoir. Eng. Geol. 2022, 311, 106919. [Google Scholar] [CrossRef]
- Shan, T.; Zhao, J. A coupled CFD-DEM analysis of granular flow impacting on a water reservoir. Acta Mech. 2014, 225, 2449–2470. [Google Scholar] [CrossRef]
- Krzaczek, M.; Nitka, M.; Tejchman, J. Effect of gas content in macropores on hydraulic fracturing in rocks using a fully coupled DEM/CFD approach. Int. J. Numer. Anal. Methods Geomech. 2021, 45, 234–264. [Google Scholar] [CrossRef]
- Wang, Z.; Hurter, S.; You, Z.; Honari, V.; Sun, Y.; Zhang, S. Influences of negative pressure on air-leakage of coalseam gas extraction: Laboratory and CFD-DEM simulations. J. Pet. Sci. Eng. 2021, 196, 107731. [Google Scholar] [CrossRef]
- Yang, Y.; Yuan, W.; Hou, J.; You, Z. Review on physical and chemical factors affecting fines migration in porous media. Water Res. 2022, 214, 118172. [Google Scholar] [CrossRef] [PubMed]
- Zhu, T.; Wei, X.; Zhang, Z. Numerical simulation of hydraulic-mechanical-chemical field coupled acid fracturing in complex carbonate reservoir. Comput. Geotech. 2023, 156, 105277. [Google Scholar] [CrossRef]
- Zhang, H.; Tan, Y.; Yang, D.; Trias, F.X.; Jiang, S.; Sheng, Y.; Oliva, A. Numerical investigation of the location of maximum erosive wear damage in elbow: Effect of slurry velocity, bend orientation and angle of elbow. Powder Technol. 2012, 217, 467–476. [Google Scholar] [CrossRef]
- Varga, M.; Goniva, C.; Adam, K.; Badisch, E. Combined experimental and numerical approach for wear prediction in feed pipes. Tribol. Int. 2013, 65, 200–206. [Google Scholar] [CrossRef]
- Chu, K.; Yu, A. Numerical simulation of complex particle–fluid flows. Powder Technol. 2008, 179, 104–114. [Google Scholar] [CrossRef]
- Chu, K.W.; Yu, A.B. Numerical Simulation of the Gas−Solid Flow in Three-Dimensional Pneumatic Conveying Bends. Ind. Eng. Chem. Res. 2008, 47, 7058–7071. [Google Scholar] [CrossRef]
- Anderson, T.B.; Jackson, R.O.Y. Fluid mechanical description of fluidized beds. Equations of motion. Ind. Eng. Chem. Fundam. 1967, 6, 527–539. [Google Scholar] [CrossRef]
- Cundall, P.A.; Strack, O.D.L. A discrete numerical model for granular assemblies. Géotechnique 1979, 29, 47–65. [Google Scholar] [CrossRef]
- Silbert, L.E.; Ertaş, D.; Grest, G.S.; Halsey, T.C.; Levine, D.; Plimpton, S.J. Granular flow down an inclined plane: Bagnold scaling and rheology. Phys. Rev. E 2001, 64, 051302. [Google Scholar] [CrossRef]
- Hu, W. Development technology and research direction of fractured-vuggy carbonate reservoirs in Tahe Oilfield. Reserv. Eval. Dev. 2020, 10, 1–10. [Google Scholar]
Figure 1.
Geometry of the fracture-shrinking model.

Figure 2.
Comparison and validation of numerical simulation (a) and physical experiment (b).

Figure 3.
Filling process of sealing mode 1.

Figure 4.
Significant pressure drop caused by accumulation of particles. (a) Fluid pressure drop in the fracture, (b) pressure curve along the middle section of the model (sealing mode 1).
Figure 4.
Significant pressure drop caused by accumulation of particles. (a) Fluid pressure drop in the fracture, (b) pressure curve along the middle section of the model (sealing mode 1).

Figure 5.
Accumulating and jamming process of sealing mode 2.

Figure 6.
Pressure distribution due to the accumulation of particles. (a) Fluid pressure drop in the fracture, (b) pressure curve along the middle section of the model (sealing mode 2).
Figure 6.
Pressure distribution due to the accumulation of particles. (a) Fluid pressure drop in the fracture, (b) pressure curve along the middle section of the model (sealing mode 2).

Figure 7.
Accumulating and jamming process of the model.

Figure 8.
Pressure distribution due to the accumulation of particles. (a) Fluid pressure drop in the fracture, (b) pressure curve along the middle section of the model (sealing mode 3).
Figure 8.
Pressure distribution due to the accumulation of particles. (a) Fluid pressure drop in the fracture, (b) pressure curve along the middle section of the model (sealing mode 3).

Figure 9.
Accumulating and local jamming in the main fracture.

Figure 10.
Pressure distribution due to the accumulation of particles. (a) Fluid pressure drop in the fracture, (b) pressure curve along the middle section of the model (sealing mode 4).
Figure 10.
Pressure distribution due to the accumulation of particles. (a) Fluid pressure drop in the fracture, (b) pressure curve along the middle section of the model (sealing mode 4).

Figure 11.
Local microscopic views of four modes of sealing.

Figure 12.
Jamming mechanisms corresponding to different D/W. Blue line is the connection between particles while the different colors of particle mean the locations of particles.
Figure 12.
Jamming mechanisms corresponding to different D/W. Blue line is the connection between particles while the different colors of particle mean the locations of particles.

Figure 13.
Jamming morphology with different particle sizes.

Figure 14.
Local stuck morphology under different particle sizes.

Figure 15.
Fluid pressure drop in the fracture with different particle sizes.

Figure 16.
Blocking effect of modulator particles under different concentration conditions (Group 1).
Figure 16.
Blocking effect of modulator particles under different concentration conditions (Group 1).

Figure 17.
Pressure drop distribution under different concentration conditions.

Figure 18.
Sealing effect of flow regulator particles at different volume concentrations (Group 2).

Figure 19.
Schematic diagram of particle arrangement under different concentration conditions.

Figure 20.
Sealing effect of flow regulator particles under different injection velocities (Group 1).
Figure 20.
Sealing effect of flow regulator particles under different injection velocities (Group 1).

Figure 21.
Sealing effect of flow regulator particles at different pumping velocities (Group 2).

Figure 22.
Variations in particle motion related to different concentration conditions. Arrows are the moving direction for flows.
Figure 22.
Variations in particle motion related to different concentration conditions. Arrows are the moving direction for flows.


Table 1.
Geometry parameters of three models.
| Models | Main Fracture Length (m) | Main Fracture Width (mm) | Main Fracture Height (m) | Secondary Fracture Length (m) | Secondary Fracture Width (mm) | Secondary Fracture Height (m) |
|---|---|---|---|---|---|---|
| Model I | 0.8 | 8 | 0.2 | 0.4 | 3 | 0.2 |
| Model II | 0.8 | 8 | 0.2 | 0.4 | 4 | 0.2 |
| Model III | 0.8 | 8 | 0.2 | 0.4 | 5 | 0.2 |
Table 2.
Simulation scenarios.
| Scenario | Fracture Width Combination (Wide/Narrow) (mm) | Injection Velocity (m/s) | Particle Volume Concentration (%) | Particle Diameter (mm) |
|---|---|---|---|---|
| 1 | 8 mm–3 mm | 0.6 | 4 | 2 |
| 2 | 8 mm–3 mm | 0.6 | 4 | 3.5 |
| 3 | 8 mm–3 mm | 0.6 | 4 | 3 |
| 4 | 8 mm–3 mm | 0.6 | 4 | 2.5 |
| 5 | 8 mm–3 mm | 0.8 | 4 | 3 |
| 7 | 8 mm–4 mm | 0.6 | 4 | 2.66 |
| 8 | 8 mm–4 mm | 0.6 | 4 | 1 |
| 9 | 8 mm–4 mm | 0.6 | 4 | 1.5 |
| 10 | 8 mm–4 mm | 0.6 | 4 | 2 |
| 11 | 8 mm–4 mm | 0.6 | 4 | 2.5 |
| 12 | 8 mm–4 mm | 0.6 | 4 | 3 |
| 13 | 8 mm–4 mm | 1 | 4 | 1 |
| 14 | 8 mm–4 mm | 1 | 4 | 1.5 |
| 15 | 8 mm–4 mm | 1 | 4 | 2 |
| 16 | 8 mm–4 mm | 1 | 4 | 2.5 |
| 17 | 8 mm–4 mm | 1 | 4 | 3 |
| 18 | 8 mm–4 mm | 0.83 | 8 | 3 |
| 19 | 8 mm–4 mm | 0.6 | 6 | 3 |
| 20 | 8 mm–4 mm | 0.83 | 4 | 1 |
| 21 | 8 mm–4 mm | 0.83 | 4 | 1.5 |
| 22 | 8 mm–4 mm | 0.83 | 4 | 2 |
| 23 | 8 mm–4 mm | 0.83 | 4 | 2.5 |
| 24 | 8 mm–4 mm | 0.83 | 4 | 3 |
| 25 | 8 mm–5 mm | 0.6 | 4 | 2 |
| 26 | 8 mm–5 mm | 0.6 | 4 | 3 |
| 27 | 8 mm–5 mm | 0.6 | 4 | 3.33 |
| 28 | 8 mm–5 mm | 0.6 | 4 | 4 |
| 29 | 8 mm–5 mm | 0.6 | 4 | 5 |
| 30 | 8 mm–5 mm | 0.6 | 4 | 5.5 |
Table 3.
Simulated scenarios of different particle sizes.
| Fracture Width (Wide) (mm) | Fracture Width (Narrow) (mm) | Particle Volume Concentration (%) | Fluid Viscosity | Injection Velocity (m/s) | Particle Size (mm) |
|---|---|---|---|---|---|
| 8 | 4 | 4 | 1 | 0.6 m/s | 1.5, 2, 2.5, 3 |
Table 4.
Influence of different particle concentrations on simulated working conditions.
| Groups | Fractures (Narrow) (mm) | Particle Volume Concentration (%) | Fluid Viscosity | Injection Velocity (m/s) | Particle Size (mm) |
|---|---|---|---|---|---|
| 1 | 4 | 4, 6 | 1 | 0.6 | 3 |
| 2 | 4 | 4, 8 | 1 | 0.6 | 2 |
Table 5.
Simulated scenarios with different velocities.
| Groups | Fractures (Narrow) (mm) | Particle Volume Concentration (%) | Fluid Viscosity | Injection Velocity (m/s) | Particle Size (mm) |
|---|---|---|---|---|---|
| 1 | 4 | 4 | 1 | 0.4~0.8 | 3 |
| 2 | 3 | 4 | 1 | 0.6, 1.2 | 2 |
Disclaimer/Publisher’s Note: The statements, opinions and data contained in all publications are solely those of the individual author(s) and contributor(s) and not of MDPI and/or the editor(s). MDPI and/or the editor(s) disclaim responsibility for any injury to people or property resulting from any ideas, methods, instructions or products referred to in the content. |
© 2024 by the authors. Licensee MDPI, Basel, Switzerland. This article is an open access article distributed under the terms and conditions of the Creative Commons Attribution (CC BY) license (https://creativecommons.org/licenses/by/4.0/).
Share and Cite
MDPI and ACS Style
Zhang, J.; Lu, C.; Zhang, T.; Guo, J. CFD−DEM Simulation of a Jamming Mechanism and Influencing Factors of a Fracture-Shrinking Model. Processes 2024, 12, 822. https://doi.org/10.3390/pr12040822
AMA Style
Zhang J, Lu C, Zhang T, Guo J. CFD−DEM Simulation of a Jamming Mechanism and Influencing Factors of a Fracture-Shrinking Model. Processes. 2024; 12(4):822. https://doi.org/10.3390/pr12040822
Chicago/Turabian StyleZhang, Jiabin, Cong Lu, Tao Zhang, and Jianchun Guo. 2024. "CFD−DEM Simulation of a Jamming Mechanism and Influencing Factors of a Fracture-Shrinking Model" Processes 12, no. 4: 822. https://doi.org/10.3390/pr12040822
Note that from the first issue of 2016, this journal uses article numbers instead of page numbers. See further details here.