
Production of Mannooligosaccharides from Açaí Seed by Immobilized β-Mannanase

1
São Paulo State University (UNESP), Institute of Chemistry, Araraquara 14800-900, SP, Brazil
2
Departamento de Ingeniería Química, Instituto de Biotecnología y Agroindustria, Universidad Nacional de Colombia sede Manizales, Caldas 170003, Colombia
3
Departamento de Física y Química, Instituto de Biotecnología y Agroindustria, Universidad Nacional de Colombia sede Manizales, Caldas 170003, Colombia
*
Author to whom correspondence should be addressed.
Processes 2024, 12(5), 847; https://doi.org/10.3390/pr12050847
Submission received: 27 March 2024
/
Revised: 19 April 2024
/
Accepted: 20 April 2024
/
Published: 23 April 2024
(This article belongs to the Special Issue Separation and Extraction Techniques in Food Processing and Analysis)
Abstract
:In this work, an enzyme cocktail with β-mannanase as the main activity was immobilized on epoxy resin foams filled with fibers from annatto capsules. The catalytic system was characterized by SEM, FTIR, and a mechanical crush resistance test. The behavior of the pH and temperature for the hydrolysis of the locust bean gum were also studied. With the same substrate and with respect to the free enzyme, the immobilized enzyme showed an activity retention of 79.61%. Its operational stability in ten reuse cycles did not show any statistically significant loss of activity. This catalytic system was used to study the preferential release of MOS of two to five degrees of polymerization from mannan present in dried and ground açaí seeds, which were not subjected to any other pretreatment. Using an experimental response surface design, the predicted quadratic models for the M2–M5 MOS content were obtained and they fit well with the experimental data, predicting a production range between 0.435 and 20 g/L of MOS (M2–M5). In addition, the production reached about 12 g/L under the optimized conditions. These results indicate that the used foamed epoxy resin supports and immobilization methodology are suitable for catalyzing the hydrolysis of mannan from açaí seeds.
1. Introduction
The açaí palm (Euterpe oleracea Mart.), widely recognized for its remarkable nutritional benefits, has gained increasing popularity worldwide [1]. Despite its notable nutritional value, the extraction of its pulp has faced a challenge due to a relatively low yield, largely attributable to the substantial seed content occupying both volume and weight within the fruit [2]. For optimal use of the biomass present in the fruit, significant efforts have been undertaken for the valorization of açaí seeds, leading to the discovery of various applications, including the generation of antioxidant extracts [3], activated carbon [4], and biofuels such as biogas [5]. Açaí seeds are mainly composed of lignocellulosic material, specifically cellulose (34–53%), hemicellulose (6–18%), and lignin (3–25%). However, their composition varies significantly depending on the region and agroecological conditions of cultivation and harvest. Different authors have estimated a total carbohydrate content higher than 75%, with mannose polymers as the main constituent [6,7]. Special attention has been paid to a component of particular interest: mannan, which represents almost 50% of the carbohydrates present in the seed [8]. In previous studies, the authors have suggested the potential of açaí seeds as a source for the production of mannooligosaccharides [6].
Mannooligosaccharides (MOS) are D-mannose oligosaccharides arranged in chains of two to ten units, linked by β-1,4 glycosidic bonds. Derived from mannan, a component of hemicellulose prevalent in various botanical sources, legumes, and seeds, MOS exhibit prebiotic properties comparable to fructooligosaccharides and inulin [9,10]. Furthermore, MOS exhibit antioxidative and anticancer properties, positioning them as a promising choice in the realms of nutrition and health [11].
The efficacy of MOS’ bioactive properties is influenced by the degree of polymerization (DP). Srivastava et al. found that mannobiose and mannotriose promoted probiotic growth more effectively than fructooligosaccharides and mannopentaose [12]. Additionally, Kumar Suryawanshi and Kango (2021) found that MOS with lower DP (<4) exhibited superior inhibition of cancer cells compared to those with higher DP [13]. These findings demonstrate that the controlled enzymatic hydrolysis of oligosaccharide substrates can yield oligosaccharides with specific desired biological properties. In this work, enzymatic hydrolysis to produce MOS was aimed at producing oligosaccharides with a low degree of polymerization.
The production of MOS can be achieved through various hydrolysis methods, with enzymatic hydrolysis considered as the most suitable option due to its selectivity and mild conditions. However, in lignocellulosic materials like açaí seeds, MOS production requires the collaboration of various enzymes, with endo-1,4-β-mannanases being the primary enzymes responsible for cleaving the glycosidic bonds of mannan. Since these materials also contain chains of D-glucose and D-galactose, synergy with other hydrolases is essential for efficient MOS production [14]. The industry has addressed this need by providing enzymatic cocktails that include cellulases, xylanases, and pectinases. Nevertheless, challenges such as the high cost of enzymes and issues related to their stability, denaturation, and reuse persist. These limitations have been mitigated using immobilized enzymes, offering advantages like enzyme reusability, enhanced stability, simplified purification processes, scalability, utilization of different reactor configurations, and reduced operational costs [15].
To meet these challenges, reduce immobilization costs, and promote environmentally friendly practices, this work proposes the use of composite materials consisting of a partially biobased epoxy resin foam filled with lignocellulosic waste from the annatto capsules, a by-product of another crop that coexists in the same Colombian regions where açaí is cultivated. The employment of immobilized enzymatic systems in the context of sustainable composite materials represents an innovative strategy addressing significant industrial and environmental challenges. To date, the authors have not found any literature related to the production of MOS from açaí seeds using heterogeneous systems, much less with natural fibers from annatto capsules used as a filler for a resin as a support for the immobilization of enzymes.
Hence, the primary aim of this research is to highlight açaí seeds as a potential alternative for MOS production via enzymatic hydrolysis, employing an immobilized system within an epoxy resin filled with annatto capsules fiber. This study also seeks to optimize MOS yield within a specified operational parameter range, considering factors such as pH, temperature, enzyme loading, and reaction time.
2. Materials and Methods
2.1. Raw Materials and Reagents
The seeds utilized in this study were provided by Refrescos del Litoral Ltda. (Quibdo, Colombia). All the chemicals, buffers, and reagents used in this research were of analytical grade. The procurement source for these chemicals was primarily Sigma Chemical Co. (Cleveland, OH, USA), unless explicitly mentioned. The standards for mannooligosaccharides, including manobiose (M2), mannotriose (M3), mannotetraose (M4), and mannopentaose (M5), were procured from Megazyme (Wicklow, Ireland). The enzyme used in the experimentation was Rohalase® GMP, an enzymatic preparation that contains mannanase as the main activity, and manosidase, glucanase, xylanase, and cellulase as side activities, sourced from AB Enzymes (Darmstadt, Germany). The bioepoxy support ingredients, such as epoxy resin and hardener were purchased from Entropy Resins (Hayward, NC, USA). Finally, the annatto capsules filler of the bioepoxy support was obtained from the local market in Quibdó City.
2.2. Pretreatment
The plant-based raw materials, comprising annatto capsules and seeds, were received in resealable bags, and kept in a light-free environment at a temperature below 0 °C for a maximum period of two weeks before undergoing pretreatment. The seeds and annatto capsules were individually subjected to drying at 70 °C until a consistent temperature was achieved. Afterwards, the annatto capsules were finely ground using a Wiley-type knife mill (TE-650/1 Tecnal, Brazil) to a particle size below 350 μm, ensuring uniformity. Simultaneously, the seeds were pulverized. The processed samples were then securely stored in dry, light-free, and resealable bags.
2.3. Enzymatic Immobilization
The partially bio-based composite foam (CF) cubes (10.0 mm side length) used as enzyme carriers were prepared by mixing ground and dried annatto husk (5.5% w/w), epoxy resin (63.2% w/w), hardener (26.6% w/w), and a foaming agent (2.5% w/w) according to the detailed procedure of Pradeep et al. 2022 [16], with some modifications. Fibers derived from wood or lignocellulosic crop residues are inexpensive, low-density, stiff reinforcements that have been used in synthetic epoxy composites since the early 1990s. Although physical and chemical treatments of the fibers have been widely used to improve their compatibility with the polymer, Alzomor et al. (2021) incorporated untreated wood fibers into petroleum and bio-based epoxy foams and observed an increase in storage modulus from ∼1 MPa for unfilled bioepoxy foam to ∼3.5 MPa for a filled bioepoxy composite [17]. In this work, to simplify the process and increase the mechanical strength of the epoxy foam acting as an immobilization support, this methodology was used in combination with the technique of delayed addition of the foaming agent, which allows for a smaller cell size and density to improve the thermal and mechanical properties of the foam [18].
During the initial stages of the curing process, a previously activated commercial enzyme (2.2% w/w) was introduced to allow for the bonding of the enzyme within the cured pellets. Finally, after 5 h of curing, the pellets were treated with a hydraulic press to break most of the closed bubbles generated by the foaming agent, thus facilitating the mass transfer into the CF support. The pellets, prior to use, were washed with a pH 6.5 buffer to remove any enzyme residues that did not bind to the support.
Activity retention after immobilization was determined as the ratio of specific activity between the immobilized enzyme and the free enzyme, expressed as a percentage. The measurement of specific activity for both free and immobilized enzymes was performed using a pure substrate, specifically locust bean gum, ensuring an amount of enzyme on the support equal to that used in the free system, based on the material balances of the pellet production (approximately 10 mg enzyme cocktail per pellet). The conditions for the specific activity tests consisted of a 20 mL solution containing 0.05% locust bean gum and 10 mg of enzyme at pH 6.5 (50 µM) at 50 °C for 5 min.
2.4. Enzymatic Activity Assay
Enzymatic activity was determined using the dinitrosalicylic acid (DNS) method to measure the quantity of reducing sugar produced from hydrolysis. The employed DNS method was based on the procedure reported by Wood et al., 2012, with some modifications [19]. The calibration curve was generated within a range of 0–30 g L−1 using mannose as the standard. In summary, the DNS reagent contained 3,5-dinitrosalicylic acid (10 g L−1), sodium potassium tartrate (30 g·L−1), and NaOH (16 g L−1), stored in the dark at 8 °C until use. The reaction mixture consisted of 20 mL that contained 0.5% w/v locust bean gum as a substrate in a 50 µM buffer in pH that corresponded and the same for temperature conditions mentioned in Section 2.5.1 and Section 2.5.2 with 1 gr of CF pellet with immobilized enzyme (equivalent to approximately 30 mg of free enzyme), 5 min of reaction. The reaction was finalized by extracting the pellets by filtration and cooling the sample in cold water. For the assay, 40 µL of the sample was mixed with 1960 µL of the DNS mixture, and, after concluding the reaction, the catalyst was picked up, the reaction mixture was heated at 100 °C for five minutes and subsequently cooled in water at 20 °C for an additional 5 min. Subsequently, 1 mL of distilled water was added, and the mixture was left to stand in a cuvette for 3 min before measuring absorbance at 540 nm. One unit of enzymatic activity was defined as the amount of enzyme in milligrams that released 1 μmol of reducing sugar per minute under the assay conditions.
2.5. Characterization of the Enzymatic System
Following the procedure outlined in Section 2.4, the effect of pH, temperature, and the operational stability of the CF pellet with immobilized enzyme is presented below.
2.5.1. Effect of pH on Enzymatic Activity
Enzymatic activity was evaluated over a pH range of 5.5–8.5 to determine the optimal pH value using different buffer solutions: pH 5.5, 6.5, and 7.5 with sodium phosphate buffer and pH 8.5 with boric acid–borate buffer. The reaction mixture consisted of 1 gr of CF pellet with immobilized enzyme, which was incubated with 20 mL of 0.5% w/v locust bean gum as a substrate in a 50 µM buffer for 5 min at 50 °C. The highest enzymatic activity value encountered was assigned as 100% activity.
2.5.2. Effect of Temperature on Enzymatic Activity
The effect of temperature was examined by calculating activity at different temperature ranges from 40 to 70 °C with a 10° interval. The reaction mixture comprising 1 g of immobilized enzyme pellets was incubated with 20 mL of 0.5% w/v locust bean gum as a substrate in a 50 µM sodium phosphate buffer (pH 6.5) for 5 min. The highest enzymatic activity value encountered was assigned as 100% activity.
2.5.3. Operational Stability
The operational stability of the immobilized enzyme in CF was assayed in repeated batches, employing locust bean gum substrate at 50 °C and a pH of 6.5, for 5 min. Following each run, the supports were removed from the reaction medium, washed with distilled water to eliminate any substrate residue, and directly added into fresh medium and reused in the subsequent batch. This process was repeated 10 times. Biocatalyst activities were estimated at the end of each batch respecting the activity of the first batch that was used as the reference.
2.5.4. Scanning Electron Microscopy (SEM)
A morphological analysis was conducted on the fiber-reinforced support, both with and without the enzyme, utilizing a high-resolution FEI Company QUANTA 250 scanning electron microscope (Eindhoven, The Netherlands), equipped with a low-vacuum secondary electron detector and large-field capability. The evaluated samples were CF supports with and without enzyme immobilized. They were prepared for SEM analysis performing gold sputter coating under vacuum and were examined using 15 kV at 60× and 90× magnification after fracturing the pellets in half. The porosity and pore diameter distribution of CF supports were measured by image visualization software, ImageJ v1.53 t (National Institutes of Health, Bethesda, MD, USA).
2.5.5. Fourier Transform Infrared Spectroscopy (FTIR)
The spectra of the CF supports with and without immobilized enzymes were measured using a NICOLET i5 FTIR spectrometer with a DTGS detector, in a KBr pellet (sample: KBr ratio 5:95) at 20 °C and 62% humidity, scanning from 450 to 4000 cm−1 with a spectral resolution of 4 cm−1.
2.5.6. Measurement of Mechanical Strength
The mechanical strength of CF supports was made only for support with immobilized enzymes and it was determined from the average compression stress of the support following the ASTM method D4179-01 [20] using a texture analyzer (TA.XT Plus, Stable Micro Systems, Godalming, Surrey, UK) with a 75 mm diameter platinum probe at a rate of 2 mm/s to a defined depth of 10 mm at room temperature. Data were processed using TA.XT Exponential software V.6.1.23.0 [21]. Typical load-displacement curves were obtained, and the maximum force applied before CF pellet rupture was recorded as the crushing strength. All measurements were reported as mean ± standard deviation (n = 50).
2.5.7. Heterogeneous Enzymatic Hydrolysis for MOS Production from Açaí Seeds Using Response Surface Methodology
Section 1 introduces the experimental design, providing a detailed description of the specific conditions chosen for conducting the enzymatic hydrolyses. The predetermined conditions of the experimental design, including the concentration of the solution, the types of buffers selected, and the sample extraction method for quantifying the soluble oligosaccharides in the solutions are described in Section 2.
2.5.8. Experimental Design and Procedure
A study on the hydrolysis of açaí seed was conducted, varying several parameters (pH, temperature, enzyme loading, and time), utilizing Design Expert V.13.0.5.0 software (Stat-Ease, Minneapolis, MN, USA). The aim was to optimize the production of mannooligosaccharides (MOS) while minimization the generation of mannose and time. The influence of these parameters was previously validated through a factorial design. Conditions selected for the design were based on preliminary experimental results. A D-optimal design was employed to generate experimental conditions, as detailed in Table 1, comprising 5 replicates to enhance model power and reduce prediction errors. Furthermore, pH, enzyme loading, and temperature were considered as discrete variables with 3 levels, while time was treated as a continuous variable considering the experimental ease of modulation.
Two response variables were recorded, representing concentrations in grams per liter of the sum of different mannooligosaccharides (M2, M3, M4, M5) and mannose. To ensure statistical validity, the sequence of experimental runs was randomized, aiming to mitigate the potential impact of unforeseen variations in the observed responses. Subsequently, a numerical optimization in MOS production was conducted using the same software, which was then experimentally validated to ensure the model’s validity. The obtained result was compared with the same experimental conditions but with free enzymes for further comparative analysis.
2.5.9. Enzymatic Hydrolysis for MOS Production
The preparation of the hydrolysates was conducted by mixing 50 mL of a 0.05 µM buffer solution with finely ground açaí seed at 10% (w/v), maintaining temperature, enzyme loading, time, and pH conditions in accordance with the predefined values of the experimental design described in Section 2.5.7. Subsequently, the reaction was halted by filtering the hydrolysate to extract pellets, and then a 2 mL aliquot of the reaction mixture was taken, which underwent centrifugation at 13.500 revolutions per minute for 5 min. The resulting supernatant was carefully extracted and filtered through 0.2 µm nylon filters. Finally, this filtered solution was transferred to glass vials and stored in a dark environment at a temperature of 4 °C until subsequent analysis.
2.5.10. Determination of MOS and Mannose
To determine the MOS and mannose content in the enzymatic hydrolysates, high-performance liquid chromatography (HPLC) analysis was performed using a Hitachi Lachrom Elite L-2490/EZChrom Elite system equipped with a refractive index detector. A Eurokat Ca column (10 µm, 300 × 4 mm) with water as the eluent (0.15 mL/min) was used for separation. The column and detector temperatures were set at 65 °C and 35 °C, respectively [6]. Each mannooligosaccharide was calibrated using mannobiose (M2), mannotriose (M3), mannotetraose (M4), and mannopentaose (M5) standards (Megazyme, Ireland). The mannooligosaccharide results are presented as the summation of M2 to M5.
2.5.11. Statistical Analysis
Activity measurements were conducted in triplicate (n = 3) and reported as mean ± standard deviation. Data were analyzed through one-way analysis of variance (ANOVA) in Microsoft Excel with a 95% confidence level to detect significant differences. Additionally, statistical analysis related to the experimental design involved the use of ANOVA using Design Expert V.13.0.5.0 software (Stat-Ease, Minneapolis, MN, USA). The significance of the models and their terms was assessed through p-values < 95%, and the efficacy of the polynomial model was determined using the coefficients of determination R2 and R2 (adj). Finally, to optimize the parameters, a numerical optimization package integrated into the same software was applied.
3. Results and Discussion
3.1. Immobilization of the Enzymatic Cocktail in CF
The procedure outlined in Section 2.3 was followed to prepare supports with immobilized enzymes, which were then stored under refrigeration. The supports were 10 mm square, highly porous, and exhibited a rigid appearance. The retained activity was 79.61 ± 1.41%. This value is among the typical activity retention during β-mannanase immobilization. In a study by Dhiman et al. (2020), immobilizing β-mannanase on chitin resulted in an activity retention of approximately 72.17% [22]. Conversely, when β-mannanase was immobilized on cyclodextrin grafted with sodium alginate, the activity retention values were of 91.5% [15].
3.2. Characterization of the Enzymatic System
3.2.1. SEM
Scanning electron microscope images of two samples of CF pellets, with and without enzymatic cocktail, are depicted in Figure 1. The non-enzymatic pellet samples are complex, with uneven cavities and other minor irregularities that include channels and pores (Figure 1A). On the other hand, the image of the support with the immobilized enzyme (Figure 1B) shows open bubbles or open pores, some of which are interconnected, with the number of pores per unit area estimated by the imaging software at 10.6 pores per mm2 and the average pore diameter at 115.87 ± 13.35 µm. These parameters for the pellets without enzyme are 6.8 pores per mm2 and 112.485 ± 9.44 µm mean pore diameter. In a work with micro-cellulose fiber-filled epoxy foams, the average bubble size ranged from 201 to 367 µm and the bubble size ranged from 4.8 to 14.8 bubbles/mm2 [23]. However, it is crucial to highlight that an increase in pore quantity could lead to a decrease in the mechanical stability of the support, limiting its applicability in bioreactors. Nevertheless, increased porosity is considered beneficial for the catalytic system, as higher porosity facilitates better substrate access to the immobilized enzymes in the matrix.
3.2.2. Fourier Transform Infrared (FTIR) Spectroscopy
Fourier transform infrared (FTIR) spectroscopy was utilized to analyze the variation in intensity of functional groups in both enzyme-loaded and enzyme-free supports. The resulting spectra are displayed in Figure 2. The stretching vibration of the epoxy group of the support shows an absorption peak at 838 cm−1 [24]. After immobilizing the enzyme, a decrease in the intensity of the amide I (1600 cm−1–1700 cm−1) and amide II (1480 cm−1–1600 cm−1) bands was observed. This is associated with the presence of enzymes bound to the support, which undergo changes in secondary structure after binding to the support [25]. The epoxy groups of the CF can react with not only amino groups but also other nucleophilic groups present on the surface of enzyme molecules, such as hydroxyl groups. Furthermore, the epoxy and amine reactants interact with each other, leading to the formation of an -OH group through a ring opening reaction [26]. The -OH groups, along with the natural fiber groups used as filler in the CF, can form hydrogen bonds. In general, small changes in the intensity of peaks corresponding to specific functional groups of the CF after immobilization may indicate hydrogen interactions between the matrix surface and the enzyme [27]. For example, reductions in intensity were observed in peaks located at 2920, 1515, 1250, and 1183 cm−1. Furthermore, the decrease in the intensity of the band at 3400 cm−1, caused by the O-H stretching vibration, observed for the immobilized system in Figure 2, is likely due to the multiple interactions of the hydroxyl groups with the polymerization intermediates and enzyme during curing. In addition, the increase at 1042 cm−1, corresponding to the increase in the intensity of the C-O stretch mode, could indicate that a cross-linking reaction has occurred [28].
3.2.3. Mechanical Strength of the Catalyst
In this study, we found that the average crushing strength of cubic pellets was 178.39 ± 31.77 N. Wu et al. (2007) evaluated the crushing strength of six commercial catalysts and found average values ranging from 167.58 ± 42.92 to 335.16 ± 109.76 N [29]. Iron, copper, and chromium oxide catalysts for gas exchange reactions in water were evaluated and had average values ranging from 93.79 ± 7.25 to 143.86 ± 22.44 N [30]. Therefore, the catalyst’s mechanical resistance to compression in this study falls within the accepted range for industrial or inorganic catalysts, such as certain metal oxides.
3.2.4. Effect of pH
Figure 3 illustrates the effect of pH on the specific activity of immobilized and free enzymes, based on reducing sugar analysis. An increase in maximum activity is observed under more alkaline conditions compared to the free enzyme (pH 6.5). Immobilization of an enzyme on any charged support will generally cause a change in the apparent pH optimum. Charged supports cause microenvironmental effects that explain this. Negatively charged supports create a lower pH in the interface between the support and the bulk solution, and consequently the enzyme is in a more acidic environment compared to the bulk reaction medium. Therefore, a higher overall pH is required to raise the pH in the interface to the true optimal pH [31,32].
This trend of shifting the optimal pH toward less acidic conditions was also noted by Dhiman et al. (2020) for β-mannanase supported on cyclodextrin grafted with sodium alginate [22], and by Chen et al. (2023), who also immobilized β-mannanase on sodium alginate [33]. This alteration in the optimal pH is typically associated with variations in the ionic environment surrounding the enzyme’s active sites.
3.2.5. Effect of Temperature
In Figure 4, changes in activity are depicted as a function of increasing temperature for locust bean gum hydrolysis. Although an increase in activity is observed at a temperature of 50 °C for the immobilized system compared to the free system, a decrease in activity is evident as the temperature rises after that specific hydrolysis temperature, particularly in the case of the pure substrate This atypical result in immobilized systems contrasts with the general trend of improved stability observed in supported enzymes, as documented in the literature [34]. However, this discrepancy could be attributed to changes in the conformational structure of the enzyme–support system as the hydrolysis temperature increases [35]. This may be due to the heat released by the epoxy resin support’s curing enthalpy, as observed through differential scanning calorimetry (DSC). The peak width values were found in the range of 42–68 °C, with a peak temperature of 50 °C, which are the same temperature values used in the hydrolysis assays. This, in turn, could lead to a decrease in enzymatic activity.
3.2.6. Operational Stability
Figure 5 illustrates the behavior of residual activity in each recycling cycle. The analysis of variance (ANOVA) for residual activity yielded a p-value > 0.05 (p-value 0.73), indicating no significant differences over the 10 cycles performed. Since there is no statistically significant decrease or change in activity over the ten cycles observed, it is likely that the majority of the covalently bound enzyme remains functional and active.
Other authors who have immobilized β-mannanase have also conducted stability tests, typically for 10 cycles. However, in their studies, they observed a more pronounced decrease in activity compared to what was reported in this work [9,33]. This result demonstrates the effectiveness of the immobilization methodology and the type of support used to retain enzymatic activity.
3.3. Analysis of MOS Production through Response Surface Experimental Design
The following section presents the results of obtaining MOS (M2–M5) with minimal mannose production using a 10% w/v dispersion of dehydrated powder and grounded açaí seeds as a substrate. In the previous section, we found the optimal pH and temperature for the heterogeneous catalytic system when it acted on a pure substrate (locust bean gum). The ranges in which the response surface experimental design was carried out were established around these operating conditions.
3.3.1. Modeling and Influence of Design Parameters on MOS Production Using an Immobilized Enzymatic System
As previously noted, numerous studies indicate that the effectiveness of MOS bioactivities is closely linked to its degree of hydrolysis, especially when the degree of polymerization (DP) is below 6. Additionally, while mannose offers health benefits [36], maximizing its extraction was not the primary focus of this study; instead, the focus was on maximizing MOS production.
In this context, identifying optimization variables is crucial for achieving MOS with limited mannose production while maximizing the utilization of immobilized enzymes. This requires precise management of factors such as temperature, pH, enzyme loading, and processing duration during enzymatic hydrolysis. To achieve optimal control, this study introduces two quadratic response surface models elucidating the pivotal variables in oligomer generation from açaí seeds. These variables were systematically varied and adjusted to specific levels through a planned series of 29 randomized experimental iterations, as detailed in Table 2.
The analysis of variance conducted in relation to both models revealed a significant and adequate correlation (p-value < 0.05) in the case of quadratic models. The correlation values showed a correspondence exceeding 90% for the correlation coefficient of the model and 80% for its corresponding adjusted value, indicating substantial agreement between these models and the collected experimental data. This finding in the correlation coefficients of quadratic models was also encountered in previous research conducted by other authors focusing on optimizing the hydrolysis of homogeneous enzymatic systems for the production of mannose oligosaccharides (DP < 6) from lignocellulosic raw materials [37,38,39].
The quadratic regression models, without eliminating non-significant terms, are expressed by Equations (1) and (2). In these equations, A, B, C, and D represent, respectively, time, pH, enzyme loading, and temperature, with the response variables expressed in mg/L. Parameters accompanied by a superscript * indicate a 95% significance level (p-value < 0.05), while superscripts of ** would indicate 99% or higher significance (p-value < 0.01). Parameters without values are not significant. In this regard, it is observed that time is a variable that affects both models, as well as pH, being more influential for mannose production. On the other hand, enzyme loading and temperature variables do not seem to be significant on their own, but their combined interactions do influence the production of different products in each model. Additionally, the behavior of quadratic interactions appears to influence the MOS model, while for mannose, time and temperature do not seem to be influential variables.
MOS (M2–M5) = −102,218 + 3933.78A – 22,160.17B − 1224.72C + 1511.55D − 435.79AB + 38.08AC − 5.19AD + 30.67BC + 63.34BD + 2.06CD − 80.57A^2 − 1696.99B^2 + 10.62C^2 − 18.25D^2
M1 = 39,355.75 + 710.73A − 8691.93B − 352.13C − 10.58D − 124.62AB + 0.634AC + 4.66AD + 19.48BC + 6.30BD + 1.25CD + 0.532A^2 + 52.94B^2 + 1.78C^2 − 0.998D^2
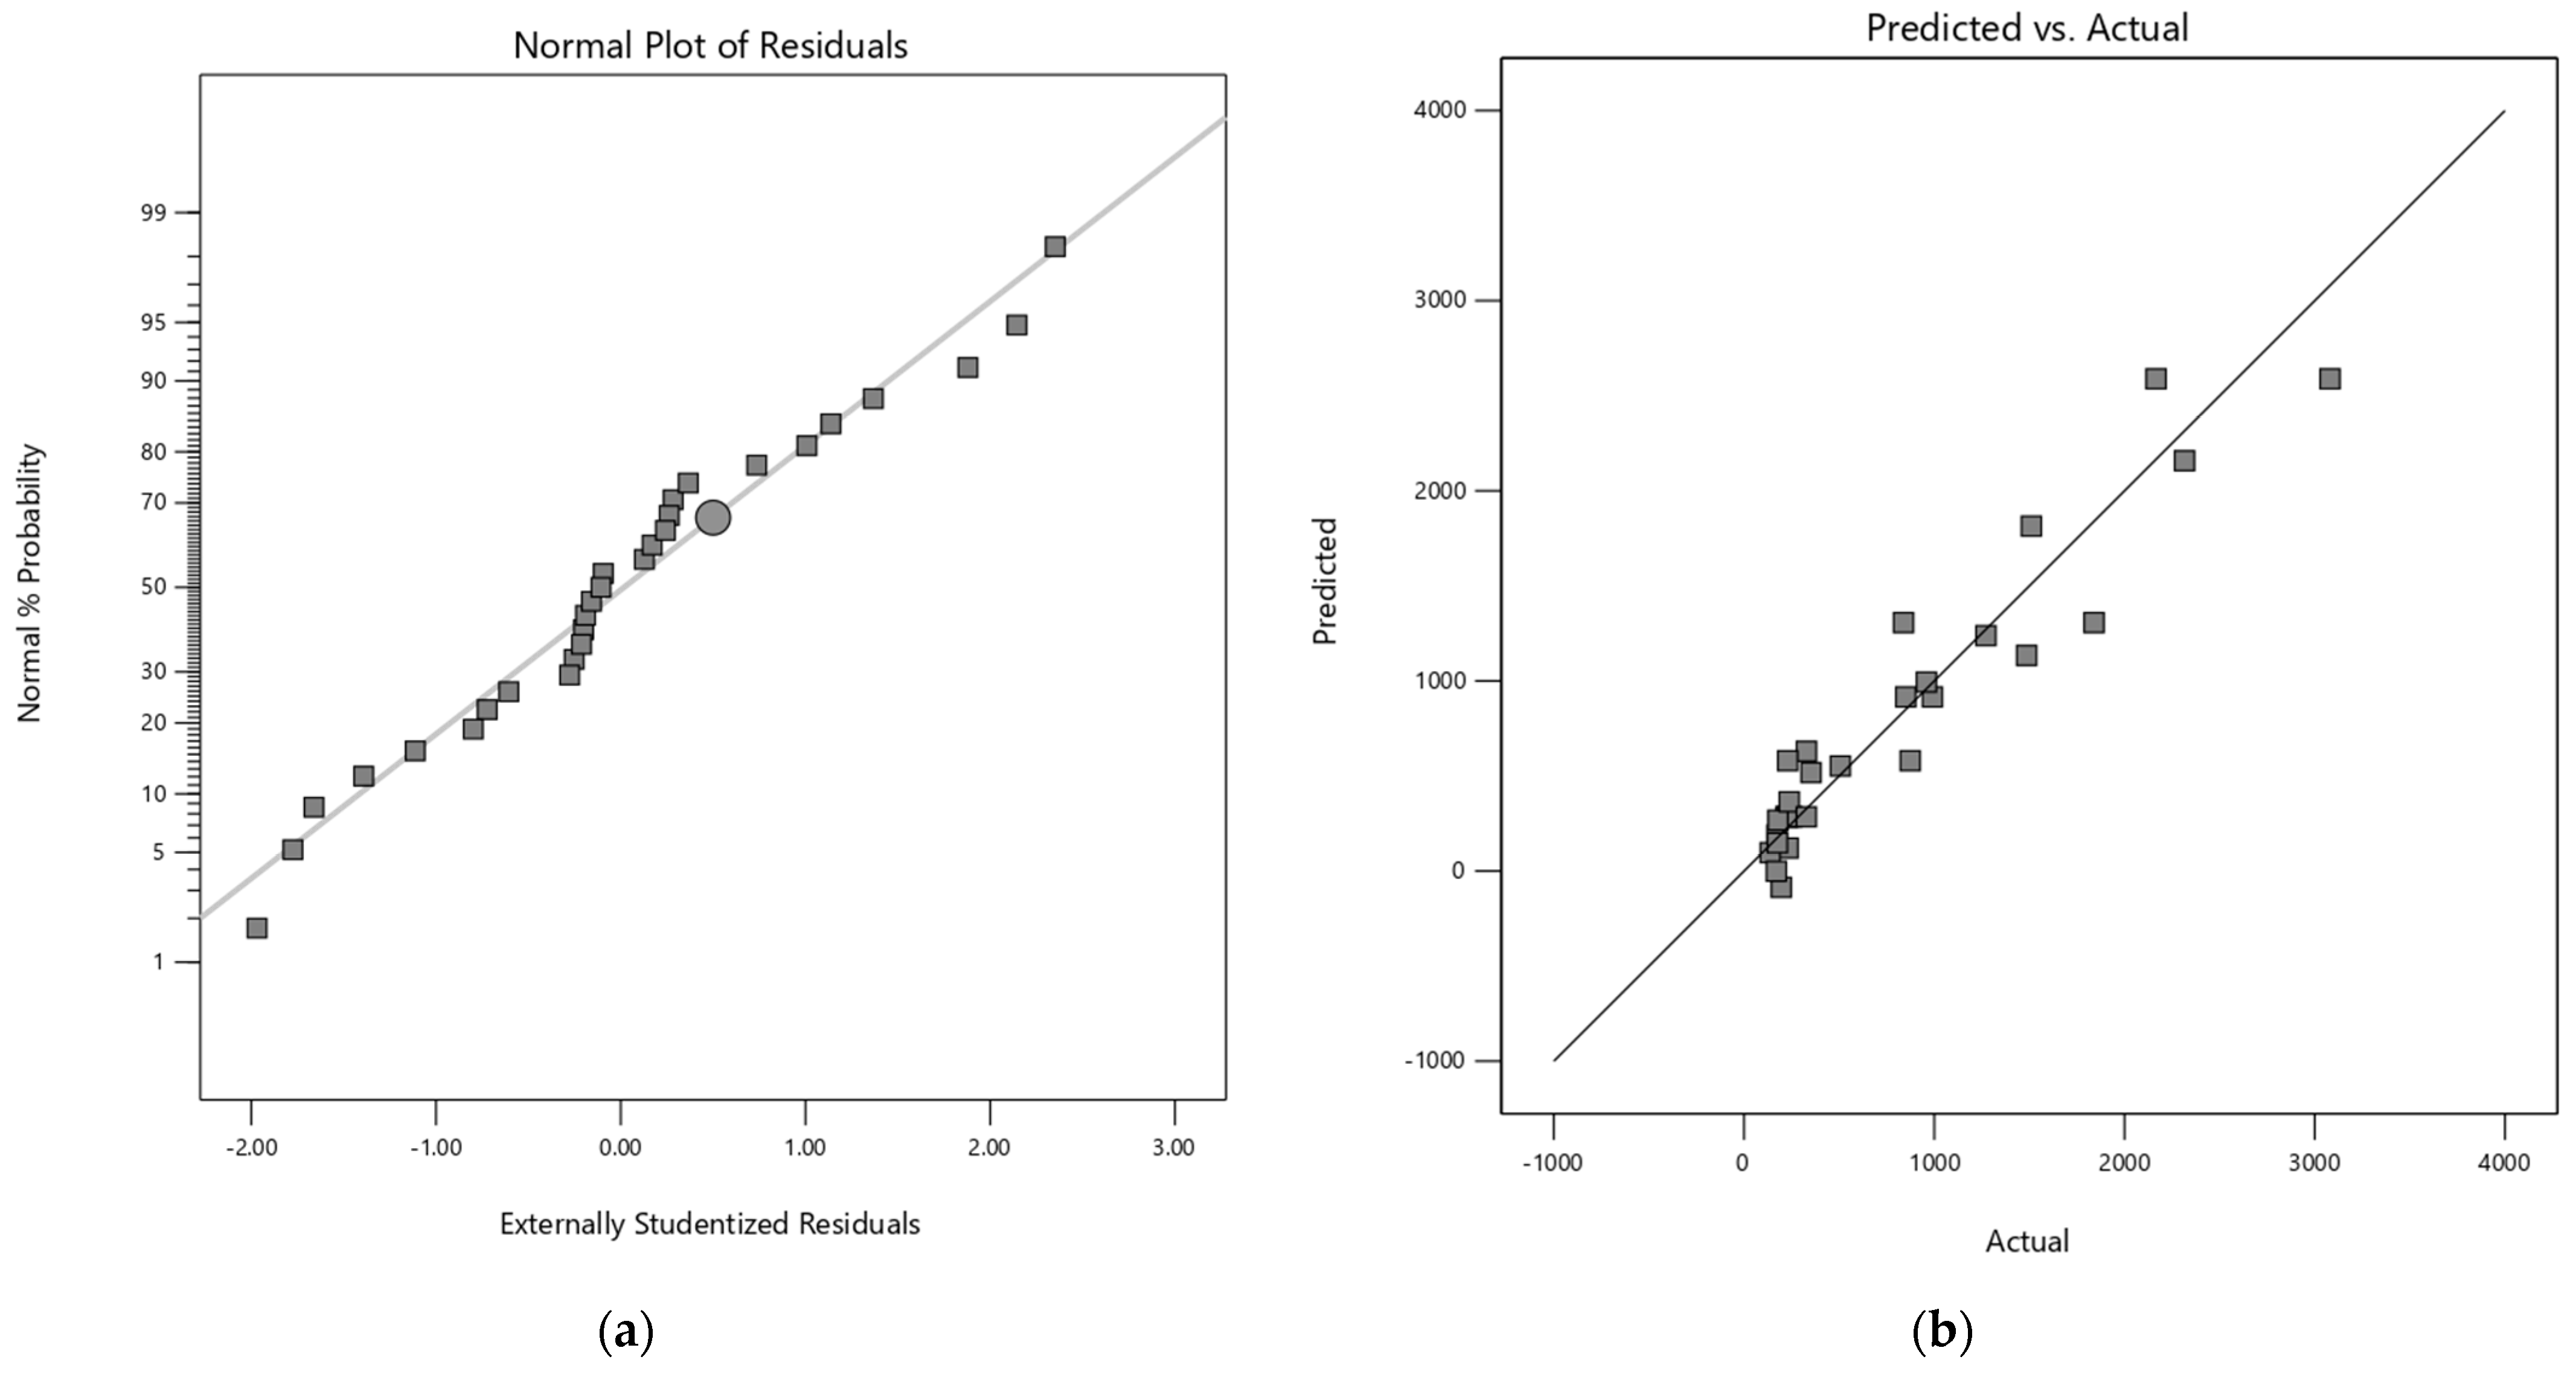
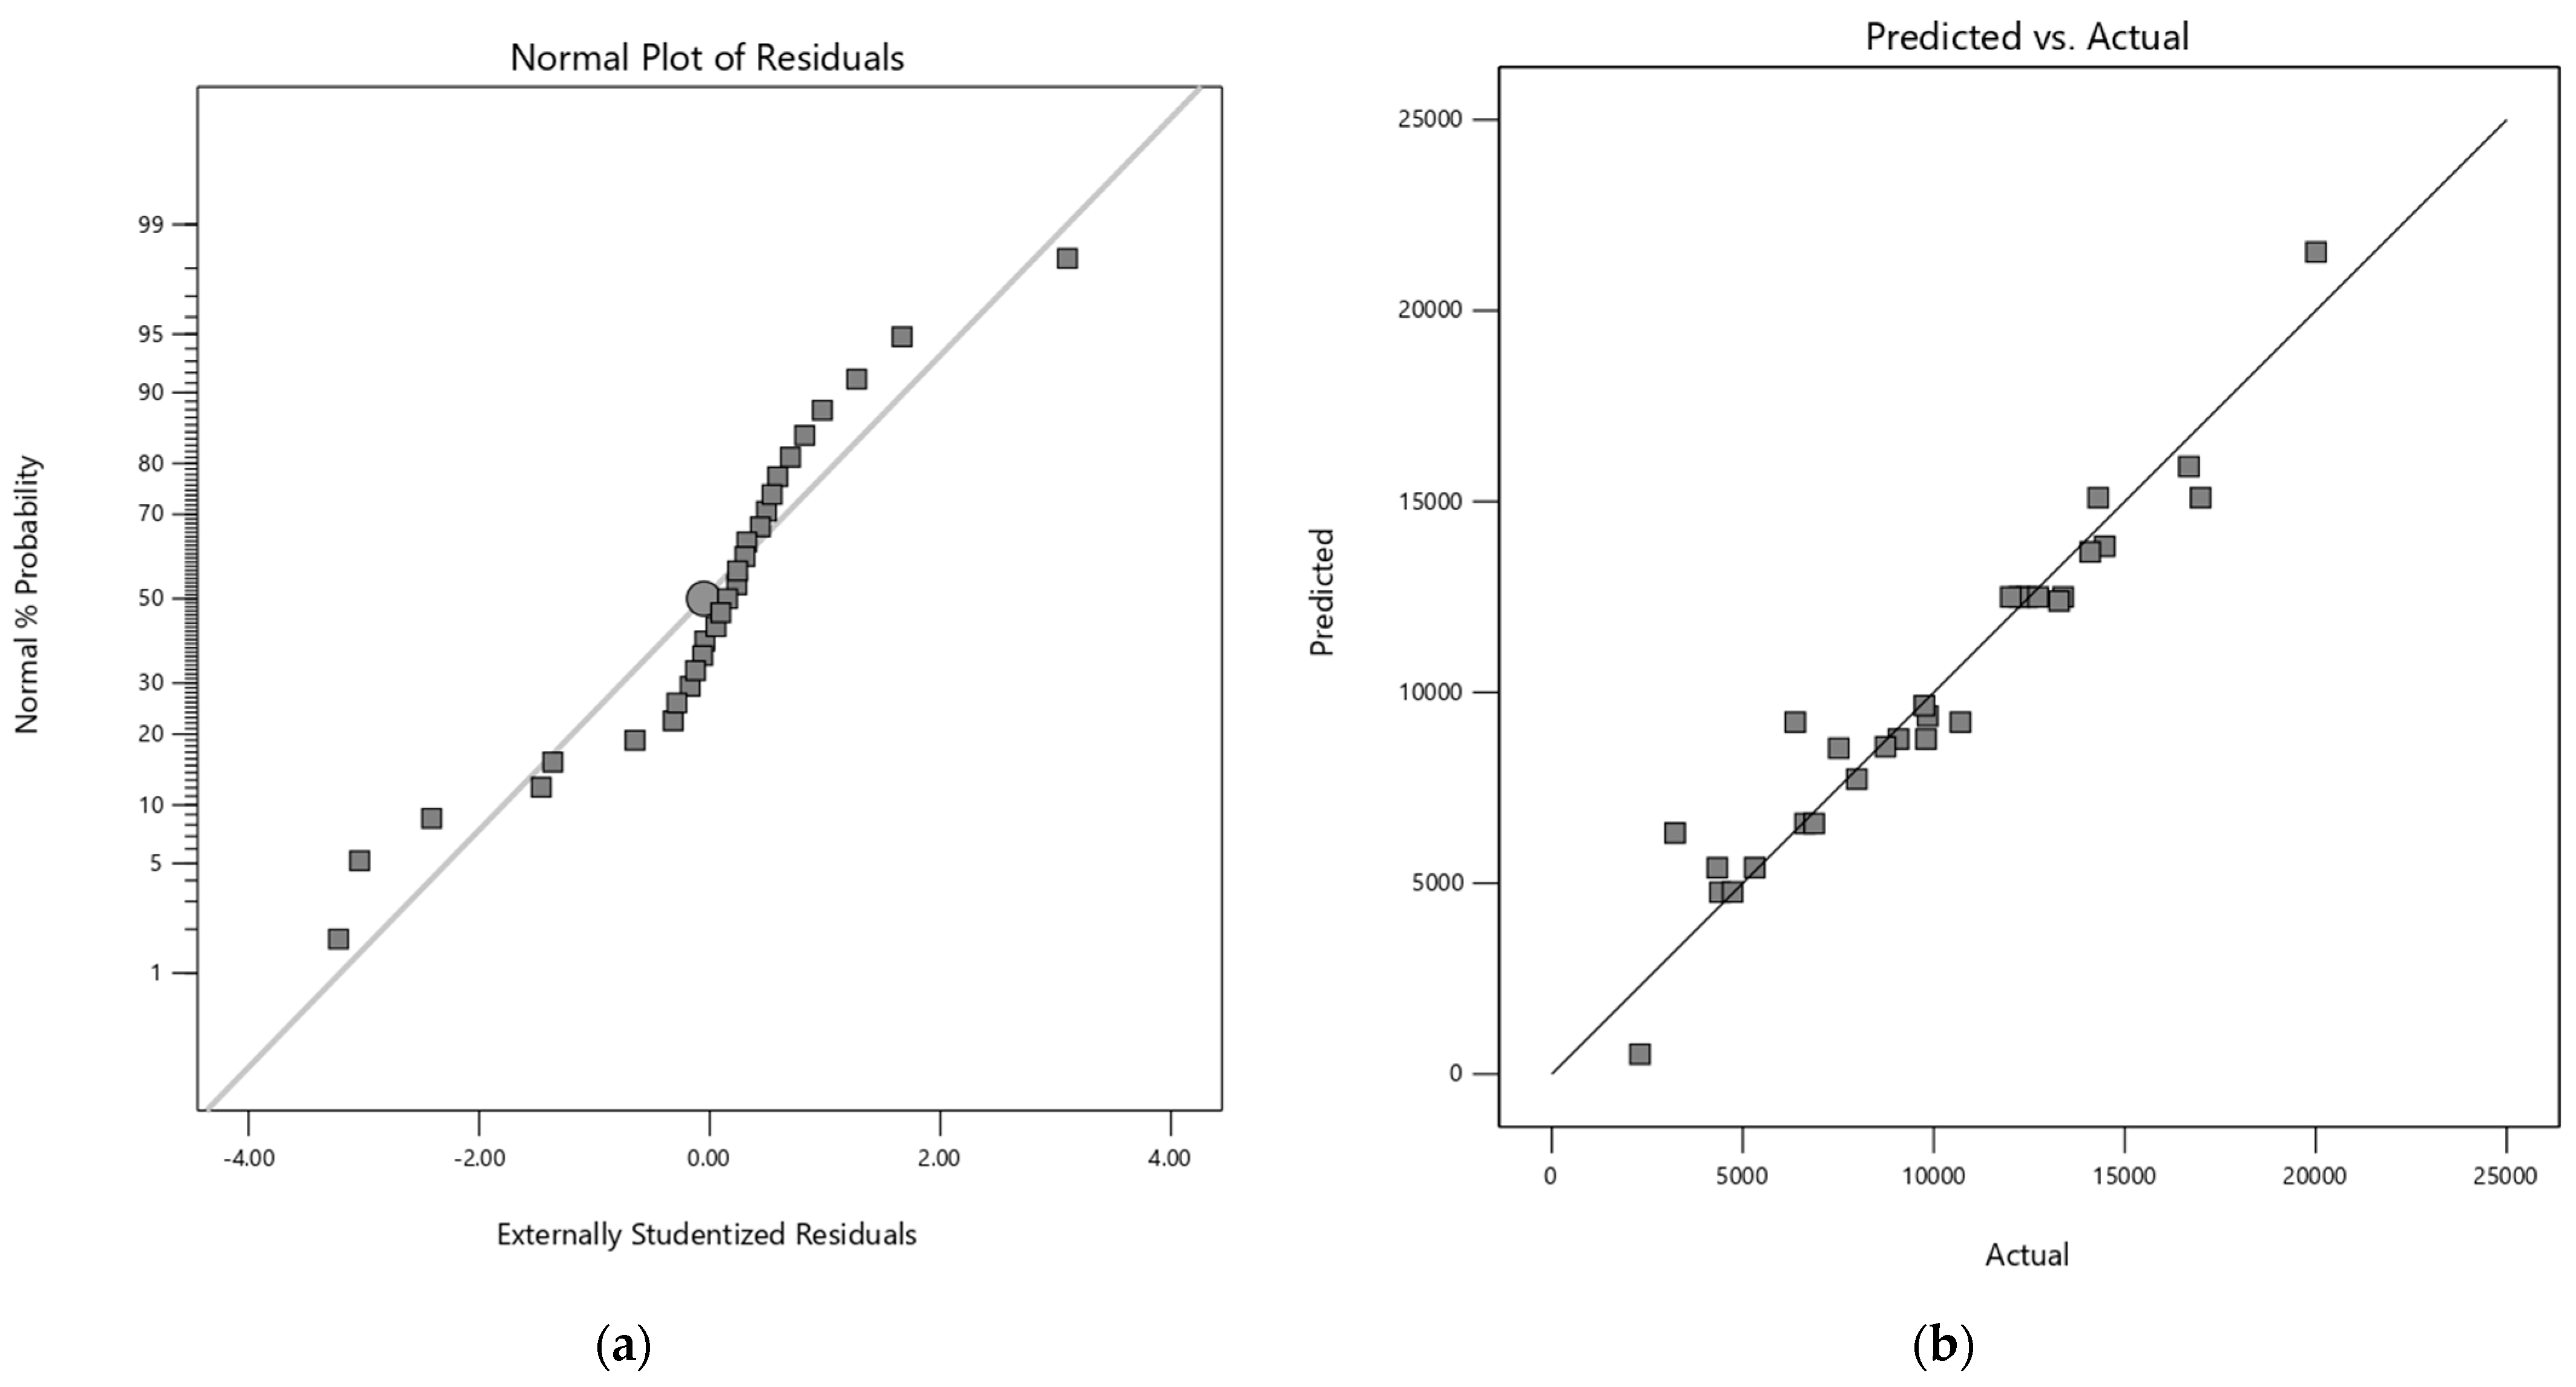
The adequacy of each model was verified by residual analysis (Appendix A). The normal probability plot of the residuals showed linearity for both response variables, confirming the assumption of normality for the models. Additionally, the respective graphs of residuals versus predicted responses have a random dispersion, indicating the reliability of the models.
Figure 6 displays the MOS production surfaces along with their corresponding contours in relation to two key variables. Overall, the results of the surface models reveal MOS production ranging from 0.435 to 20 g per liter within the proposed design ranges. It is observed that, using the appropriate reaction conditions, it is possible to achieve at least 50% of the maximum hydrolysis yield in a relatively short processing time, not exceeding 3 h. Furthermore, it is evident that longer processing times and higher enzyme loading tend to increase MOS production. This increase is directly related to enhanced contact between the enzyme and the substrate, facilitating MOS production. Likewise, a peak MOS production is observed under conditions near 50 °C. However, temperature does not seem to be a significant variable under neutral or basic pH conditions. On the other hand, pH appears to have no significant impact in the initial hours of processing, but as the hydrolysis time increases, conditions closer to the lower pH favor MOS production. This result could be related to the influence of pH on enzyme activation before coming into contact with the resin, as the enzyme seems to remember and function more effectively at the pH of the last aqueous solution it came from, due to the limited amount of water present around the enzyme in a hydrophobic organic environment [40].
On the other hand, mannose reaches its maximum value at 2 g/L. These results are obtained under conditions of low pH, long processing times, and high temperatures. This finding is consistent with previous studies aiming to hydrolyze lignocellulosic material to produce monomeric sugars. However, the use of extreme and prolonged conditions may also lead to an increase in the generation of undesirable by-products such as furfural and its derivatives [41].
3.3.2. Model Verification and Optimal Reaction Conditions
The optimal hydrolysis conditions were determined based on the previously selected conditions for the homogeneous system, aiming to maximize the production of manno-oligosaccharides (MOS) (M2 to M5) and minimize mannose generation while maintaining short processing times. Prolonged processing times often favor the production of undesirable compounds [41]. This was achieved through a numerical optimization process. The initial solution generated by the software obtained a maximum desirability score of 0.554. Despite appearing as an intermediate desirability value, the results can be deemed satisfactory, as adequate amounts of MOS are achieved with a lower enzyme quantity and less extreme pH conditions. The optimal solution includes a reaction time of 2.74 h, a pH of 7.9, an enzyme loading of 17.5 U/g, and a temperature of approximately 59 °C. It is important to note that these results differ from the ideal conditions observed in Figure 6 because the minimization of time and mannose content influences the system’s behavior.
Table 3 presents the model validation, showcasing the optimized conditions proposed by the software. Only one optimal condition was used for validation, as the other optimization conditions did not significantly differ from those presented in the initial solution. The percentage error between predicted and observed values for various responses was below 10%, indicating the adequacy of the model. Additionally, the results were compared by evaluating the same conditions in the homogeneous system, which yielded respective concentrations of 6502.31 ± 56.21 for MOS and 493.76 ± 7.59 for mannose. In the context of the heterogeneous system, which showed superior results to the homogeneous one, these findings can be linked to the influence of water present in the material. The resin acts as a hydrophobic barrier that restricts water interaction in the catalytic system.
The mechanism of action of mannanases involves a double displacement process in which water plays a crucial role, as explained by Dawood and Ma (2020) [39]. This process initiates with a glutamic acid residue acting as the main nucleophile, catalyzing an attack on the anomeric center, displacing a leaving group, and forming an acylal glycosyl–enzyme intermediate [42]. This mechanism, similar to mannosidase, involves the release of the enzyme in its original state when water attacks the intermediate [43]. Other reactive donor molecules, like oligosaccharides or monomeric sugars, may substitute water, leading to transglycosylation instead of hydrolysis [44]. The ionic environment within the support structure accelerates the release of the enzyme–substrate complex, favoring oligomeric formation by mannanase in the presence of excess mannose [42]. This explanation correlates with the nearly twofold increase in MOS content observed in the heterogeneous system compared to the homogeneous system. Tang et al. (2020) suggested that water limitations in a reactive system may promote a higher degree of polymerization in produced mannooligosaccharides [45].
Below is a comparison of the results of this study with those of other researchers who also used immobilized mannanase for MOS production. Blibech et al. (2011) immobilized mannanase on chitin using glutaraldehyde, producing oligosaccharides of varying polymerization degrees identified via thin layer chromatography [15]. Similarly, Anderson et al. (2022) achieved immobilization on a chitosan particle support and hydrolyzed soybean flour, identifying only mannobiose, reaching a concentration of 350 mg/L [9]. In another study, Chen et al. (2023) immobilized mannanases and released 7.94 (g/L) of MOS (M2–M3) from konjac flour after 8 h of hydrolysis [33]. The present study demonstrates superior results compared to the above-mentioned works. Furthermore, when comparing our results with studies using free enzymes in homogeneous systems, the highest concentration reported was 17.4 g/L (M2–M5) when the substrate was steam-pretreated palm kernel cake [46]. Therefore, our results are particularly promising, as we were able to achieve up to 20 g/L MOS without adding pretreatments to the material, which is equivalent to the hydrolysis of almost 70% of the hydrolysable substrate.
4. Conclusions
The epoxy resin support with annatto residue has demonstrated effectiveness in the successful immobilization of the enzymatic cocktail, supported by FT-IR analysis and operational stability assessment. After immobilization, enzymatic activity retention exceeds 75%, persisting through at least 10 cycles of support recycling without significant protein losses. Immobilization enhances porosity and stability at alkaline pH, although substantial improvements in stability at high temperatures are not observed, possibly related to the curing process of the bio-composite material.
The response surface methodology allowed for a detailed analysis of variable interactions, providing advantages for immobilization. Promising results were achieved for obtaining MOS, surpassing current findings and results obtained under similar conditions working with a homogeneous system. Experimental results align with model predictions, identifying optimal parameters for efficient MOS production through heterogeneous enzymatic hydrolysis of mannan present in the açaí seed.
5. Recommendation and Future Perspectives
The positive conclusions of this study suggest areas for further research and improvements that could significantly enhance the impact of the epoxy resin support with annatto residues. It is recommended to extend the assessment of this support to the immobilization of other enzymes, exploring its versatility and efficiency in different enzymatic contexts to broaden its industrial applications.
In the field of mannooligosaccharides (MOS) production, there is a significant opportunity to further research the bioactive properties of the obtained MOS. This approach may involve exploring its viability as a nutritional supplement, as well as evaluating its potential beneficial impact on health. This avenue of research could open new doors in nutraceutical and pharmaceutical applications of MOS, contributing to the advancement of innovative bioactive solutions. These perspectives align with the constant pursuit of improvements and optimizations to elevate biotechnology to new levels of efficacy and applicability.
Author Contributions
Conceptualization, S.L.M.-F. and C.E.O.; Formal analysis, S.L.M.-F.; Investigation, S.L.M.-F. and J.D.G.-N.; Methodology, S.L.M.-F. and J.D.G.-N.; Project administration, C.E.O.; Resources, C.E.O.; Supervision, C.E.O.; Visualization, S.L.M.-F. and J.D.G.-N.; Writing—original draft, S.L.M.-F.; Writing—review and editing, S.L.M.-F., J.D.G.-N. and C.E.O. All authors have read and agreed to the published version of the manuscript.
Funding
This research was funded by Universidad Nacional de Colombia-Manizales (UNC) through project Hermes, grant number 57755 and the National Call for the Support of International Mobility of the UNC 2022–2024.
Data Availability Statement
The original data presented in the study are openly available in https://repositorio.unal.edu.co/handle/unal/85465.
Conflicts of Interest
The authors declare no conflicts of interest.
Appendix A
Appendix A.1. Chromatogram of Refractive Index for Mannose and MOS (M2–M5) in HPLC Analysis
Figure A1.
Chromatogram of refractive index for mannose (1), manobiose (2), manotriose (3), manotetraose (4), and manopentose (5).
Figure A1.
Chromatogram of refractive index for mannose (1), manobiose (2), manotriose (3), manotetraose (4), and manopentose (5).

Appendix A.2. Analysis of Variance (ANOVA) for Quadratic Models for Response Variables
Appendix A.2.1. Response 1: Mannose
The Model F-value of 9.22 implies the model is significant. There is only a 0.01% chance that an F-value this large could occur due to noise. p-values less than 0.0500 indicate model terms are significant. In this case A, B, C, AB, AD, BC, CD, B2, C2 are significant model terms. Values greater than 0.1000 indicate the model terms are not significant. If there are many insignificant model terms (not counting those required to support hierarchy), model reduction may improve your model. The Lack of Fit F-value of 0.61 implies the Lack of Fit is not significant relative to the pure error. There is a 71.89% chance that a Lack of Fit F-value this large could occur due to noise. Non-significant lack of fit is good—we want the model to fit.

Table A1.
ANOVA for quadratic Mannose model.
| Source | Sum of Squares | df | Mean Square | F-Value | p-Value |
|---|---|---|---|---|---|
| Model | 1.54 × 10⁷ | 14 | 1.10 × 10⁶ | 9.22 | <0.0001 |
| A-Time | 9.90 × 10⁵ | 1 | 9.90 × 10⁵ | 8.31 | 0.0121 |
| B-pH | 4.56 × 10⁶ | 1 | 4.56 × 10⁶ | 38.25 | <0.0001 |
| C-Enzyme Load | 7.40 × 10⁵ | 1 | 7.40 × 10⁵ | 6.21 | 0.0259 |
| D-Temperature | 1.06 × 10⁵ | 1 | 1.06 × 10⁵ | 0.893 | 0.3607 |
| AB | 2.65 × 10⁶ | 1 | 2.65 × 10⁶ | 22.21 | 0.0003 |
| AC | 1.74 × 10⁴ | 1 | 1.74 × 10⁴ | 0.1464 | 0.7078 |
| AD | 8.24 × 10⁵ | 1 | 8.24 × 10⁵ | 6.92 | 0.0198 |
| BC | 7.49 × 10⁵ | 1 | 7.49 × 10⁵ | 6.29 | 0.0251 |
| BD | 7.63 × 10⁴ | 1 | 7.63 × 10⁴ | 0.6408 | 0.4368 |
| CD | 1.02 × 10⁶ | 1 | 1.02 × 10⁶ | 8.54 | 0.0111 |
| A2 | 5.73 × 10² | 1 | 5.73 × 10² | 0.0048 | 0.9457 |
| B2 | 1.80 × 10⁶ | 1 | 1.80 × 10⁶ | 15.1 | 0.0016 |
| C2 | 1.13 × 10⁶ | 1 | 1.13 × 10⁶ | 9.52 | 0.0081 |
| D2 | 2.66 × 10⁵ | 1 | 2.66 × 10⁵ | 2.23 | 0.1577 |
| Residual | 1.67 × 10⁶ | 14 | 1.19 × 10⁵ | ||
| Lack of Fit | 5.23 × 10⁵ | 6 | 8.71 × 10⁴ | 0.609 | 0.7189 |
| Pure Error | 1.15 × 10⁶ | 8 | 1.43 × 10⁵ | ||
| Cor Total | 1.71 × 10⁷ | 28 |
Appendix A.2.2. Response 2: MOS (M2–M5)
The Model F-value of 14.31 implies the model is significant. There is only a 0.01% chance that an F-value this large could occur due to noise. p-values less than 0.0500 indicate model terms are significant. In this case A, B, AB, AC, A2, B2, C2, D2 are significant model terms. Values greater than 0.1000 indicate the model terms are not significant. If there are many insignificant model terms (not counting those required to support hierarchy), model reduction may improve your model. The Lack of Fit F-value of 2.06 implies the Lack of Fit is not significant relative to the pure error. There is a 17.01% chance that a Lack of Fit F-value this large could occur due to noise. Non-significant lack of fit is good—we want the model to fit.
Table A2.
ANOVA for quadratic MOS (M2–M5) model.
| Source | Sum of Squares | df | Mean Square | F-Value | p-Value |
|---|---|---|---|---|---|
| Model | 5.23 × 10⁸ | 14 | 3.74 × 10⁷ | 14.31 | <0.0001 |
| A-Time | 1.64 × 10⁸ | 1 | 1.64 × 10⁸ | 62.62 | <0.0001 |
| B-pH | 1.83 × 10⁷ | 1 | 1.83 × 10⁷ | 7 | 0.0192 |
| C-Enzyme Load | 5.74 × 10⁶ | 1 | 5.74 × 10⁶ | 2.2 | 0.1604 |
| D-Temperature | 4.05 × 10⁶ | 1 | 4.05 × 10⁶ | 1.55 | 0.2333 |
| AB | 3.24 × 10⁷ | 1 | 3.24 × 10⁷ | 12.39 | 0.0034 |
| AC | 6.29 × 10⁷ | 1 | 6.29 × 10⁷ | 24.09 | 0.0002 |
| AD | 1.02 × 10⁶ | 1 | 1.02 × 10⁶ | 0.391 | 0.5419 |
| BC | 1.86 × 10⁶ | 1 | 1.86 × 10⁶ | 0.7114 | 0.4132 |
| BD | 8.22 × 10⁶ | 1 | 8.22 × 10⁶ | 3.15 | 0.0977 |
| CD | 2.77 × 10⁶ | 1 | 2.77 × 10⁶ | 1.06 | 0.3209 |
| A2 | 1.31 × 10⁷ | 1 | 1.31 × 10⁷ | 5.03 | 0.0416 |
| B2 | 1.89 × 10⁷ | 1 | 1.89 × 10⁷ | 7.25 | 0.0175 |
| C2 | 4.04 × 10⁷ | 1 | 4.04 × 10⁷ | 15.49 | 0.0015 |
| D2 | 8.86 × 10⁷ | 1 | 8.86 × 10⁷ | 33.94 | <0.0001 |
| Residual | 3.66 × 10⁷ | 14 | 2.61 × 10⁶ | ||
| Lack of Fit | 2.22 × 10⁷ | 6 | 3.70 × 10⁶ | 2.06 | 0.1701 |
| Pure Error | 1.44 × 10⁷ | 8 | 1.80 × 10⁶ | ||
| Cor Total | 5.60 × 10⁸ | 28 |
Appendix A.3. Diagnostic Plots for the Quadratic Models
Appendix A.3.1. Response 1: Mannose
Figure A2.
(a) Normal plot of the residuals for quadratic model of mannose and (b) Predicted vs Actual values plot of quadratic model of mannose.
Figure A2.
(a) Normal plot of the residuals for quadratic model of mannose and (b) Predicted vs Actual values plot of quadratic model of mannose.

Appendix A.3.2. Response 2: MOS (M2–M5)
Figure A3.
(a) Normal plot of the residuals for quadratic model of MOS (M2–M5) and (b) Predicted vs Actual values plot of quadratic model of MOS (M2–M5).
Figure A3.
(a) Normal plot of the residuals for quadratic model of MOS (M2–M5) and (b) Predicted vs Actual values plot of quadratic model of MOS (M2–M5).
References
- de Lima Yamaguchi, K.K.; Pereira, L.F.R.; Lamarão, C.V.; Lima, E.S.; da Veiga-Junior, V.F. Amazon Acai: Chemistry and Biological Activities: A Review. Food Chem. 2015, 179, 137–151. [Google Scholar] [CrossRef]
- Pessoa, J.D.C.; Arduin, M.; Martins, M.A.; de Carvalho, J.E.U. Characterization of Açaí (E. oleracea) Fruits and Its Processing Residues. Braz. Arch. Biol. Technol. 2010, 53, 1451–1460. [Google Scholar] [CrossRef]
- Melo, P.S.; Selani, M.M.; Gonçalves, R.H.; de Oliveira Paulino, J.; Massarioli, A.P.; de Alencar, S.M. Açaí Seeds: An Unexplored Agro-Industrial Residue as a Potential Source of Lipids, Fibers, and Antioxidant Phenolic Compounds. Ind. Crops Prod. 2021, 161, 113204. [Google Scholar] [CrossRef]
- Sato, M.K.; de Lima, H.V.; Costa, A.N.; Rodrigues, S.; Pedroso, A.J.S.; de Freitas Maia, C.M.B. Biochar from Acai Agroindustry Waste: Study of Pyrolysis Conditions. Waste Manag. 2019, 96, 158–167. [Google Scholar] [CrossRef] [PubMed]
- Maciel-Silva, F.W.; Mussatto, S.I.; Forster-Carneiro, T. Integration of Subcritical Water Pretreatment and Anaerobic Digestion Technologies for Valorization of Açai Processing Industries Residues. J. Clean. Prod. 2019, 228, 1131–1142. [Google Scholar] [CrossRef]
- Murillo-Franco, S.L.; Galvis-Nieto, J.D.; Orrego, C.E. Physicochemical Characterization of Açaí Seeds (Euterpe oleracea) from Colombian Pacific and Their Potential of Mannan-Oligosaccharides and Sugar Production via Enzymatic Hydrolysis. Biomass Conv. Bioref. 2023. [Google Scholar] [CrossRef]
- Buratto, R.T.; Cocero, M.J.; Martín, Á. Characterization of Industrial Açaí Pulp Residues and Valorization by Microwave-Assisted Extraction. Chem. Eng. Process.-Process Intensif. 2021, 160, 108269. [Google Scholar] [CrossRef]
- Monteiro, A.F.; Miguez, I.S.; Silva, J.P.R.B.; da Silva, A.S. High Concentration and Yield Production of Mannose from Açaí (Euterpe oleracea Mart.) Seeds via Mannanase-Catalyzed Hydrolysis. Sci. Rep. 2019, 9, 10939. [Google Scholar] [CrossRef] [PubMed]
- Anderson, A.S.; Mkabayi, L.; Malgas, S.; Kango, N.; Pletschke, B.I. Covalent Immobilisation of an Aspergillus Niger Derived Endo-1,4-β-Mannanase, Man26A, on Glutaraldehyde-Activated Chitosan Nanoparticles for the Effective Production of Prebiotic MOS from Soybean Meal. Agronomy 2022, 12, 2993. [Google Scholar] [CrossRef]
- Kango, N.; Jana, U.K.; Choukade, R.; Nath, S. Advances in Prebiotic Mannooligosaccharides. Curr. Opin. Food Sci. 2022, 47, 100883. [Google Scholar] [CrossRef]
- Jana, U.K.; Suryawanshi, R.K.; Prajapati, B.P.; Kango, N. Prebiotic Mannooligosaccharides: Synthesis, Characterization and Bioactive Properties. Food Chem. 2021, 342, 128328. [Google Scholar] [CrossRef] [PubMed]
- Srivastava, P.K.; Panwar, D.; Prashanth, K.V.H.; Kapoor, M. Structural Characterization and in Vitro Fermentation of β-Mannooligosaccharides Produced from Locust Bean Gum by GH-26 Endo-β-1,4-Mannanase (ManB-1601). J. Agric. Food Chem. 2017, 65, 2827–2838. [Google Scholar] [CrossRef] [PubMed]
- Kumar Suryawanshi, R.; Kango, N. Production of Mannooligosaccharides from Various Mannans and Evaluation of Their Prebiotic Potential. Food Chem. 2021, 334, 127428. [Google Scholar] [CrossRef] [PubMed]
- Malgas, S.; van Dyk, J.S.; Pletschke, B.I. A Review of the Enzymatic Hydrolysis of Mannans and Synergistic Interactions between β-Mannanase, β-Mannosidase and α-Galactosidase. World J. Microbiol. Biotechnol. 2015, 31, 1167–1175. [Google Scholar] [CrossRef] [PubMed]
- Blibech, M.; Chaari, F.; Bhiri, F.; Dammak, I.; Ghorbel, R.E.; Chaabouni, S.E. Production of Manno-Oligosaccharides from Locust Bean Gum Using Immobilized Penicillium Occitanis Mannanase. J. Mol. Catal. B Enzym. 2011, 73, 111–115. [Google Scholar] [CrossRef]
- Pradeep, S.A.; Rodríguez, L.J.; Kousaalya, A.B.; Farahani, S.; Orrego, C.E.; Pilla, S. Effect of Silane-Treated Pine Wood Fiber (PWF) on Thermal and Mechanical Properties of Partially Biobased Composite Foams. Compos. Part C Open Access 2022, 8, 100278. [Google Scholar] [CrossRef]
- Alzomor, A.; Rus, A.Z.M.; Wahab, H.A.; Salim, N.S.M.; Marsi, N.; Zulhakimie, M.A.; Farid, M.M. Dynamic Mechanical Analysis and Morphology of Petroleum-Based and Bio-Epoxy Foams with Wood Filler. In AIP Conference Proceedings; AIP Publishing: Arau, Malaysia, 2021; p. 020042. [Google Scholar]
- Agnihotri, S.; Shukla, S.; Pradeep, S.A.; Pilla, S. Biobased Thermosetting Cellular Blends: Exploiting the Ecological Advantage of Epoxidized Soybean Oil in Structural Foams. Polymer 2019, 177, 111–119. [Google Scholar] [CrossRef]
- Wood, I.P.; Elliston, A.; Ryden, P.; Bancroft, I.; Roberts, I.N.; Waldron, K.W. Rapid Quantification of Reducing Sugars in Biomass Hydrolysates: Improving the Speed and Precision of the Dinitrosalicylic Acid Assay. Biomass Bioenergy 2012, 44, 117–121. [Google Scholar] [CrossRef]
- ASTM D 4179; Standard Test Method for Single Pellet Crush Strength of Formed Catalyst Shapes. ASTM International: West Conshohocken, PA, USA, 2001.
- Liu, Y.-C.; Ku, Y.; Tseng, Y.-H.; Lee, H.-Y.; Kuo, Y.-L. Fabrication of Fe2O3/TiO2 Oxygen Carriers for Chemical Looping Combustion and Hydrogen Generation. Aerosol Air Qual. Res. 2016, 16, 2023–2032. [Google Scholar] [CrossRef]
- Dhiman, S.; Srivastava, B.; Singh, G.; Khatri, M.; Arya, S.K. Immobilization of Mannanase on Sodium Alginate-Grafted-β-Cyclodextrin: An Easy and Cost Effective Approach for the Improvement of Enzyme Properties. Int. J. Biol. Macromol. 2020, 156, 1347–1358. [Google Scholar] [CrossRef]
- Stefani, P.M.; Perez, C.J.; Alvarez, V.A.; Vazquez, A. Microcellulose Fibers-filled Epoxy Foams. J. Appl. Polym. Sci. 2008, 109, 1009–1013. [Google Scholar] [CrossRef]
- Bai, Y.-X.; Li, Y.-F.; Wang, M.-T. Study on Synthesis of a Hydrophilic Bead Carrier Containing Epoxy Groups and Its Properties for Glucoamylase Immobilization. Enzym. Microb. Technol. 2006, 39, 540–547. [Google Scholar] [CrossRef]
- Liu, H.; Hao, C.; Zhang, Y.; Yang, H.; Sun, R. The Interaction of Graphene Oxide-Silver Nanoparticles with Trypsin: Insights from Adsorption Behaviors, Conformational Structure and Enzymatic Activity Investigations. Colloids Surf. B Biointerfaces 2021, 202, 111688. [Google Scholar] [CrossRef]
- Mateo, C.; Grazu, V.; Palomo, J.M.; Lopez-Gallego, F.; Fernandez-Lafuente, R.; Guisan, J.M. Immobilization of Enzymes on Heterofunctional Epoxy Supports. Nat. Protoc. 2007, 2, 1022–1033. [Google Scholar] [CrossRef] [PubMed]
- Zdarta, J.; Klapiszewski, L.; Jedrzak, A.; Nowicki, M.; Moszynski, D.; Jesionowski, T. Lipase B from Candida Antarctica Immobilized on a Silica-Lignin Matrix as a Stable and Reusable Biocatalytic System. Catalysts 2016, 7, 14. [Google Scholar] [CrossRef]
- Dahari, R.F.; Ongkudon, C.M.; Misson, M. Effect of Crosslinkers on Immobilization of β-Galactosidase on Polymethacrylate Monolith. Trans. Sci. Technol. 2018, 5, 106–113. [Google Scholar]
- Wu, D.; Zhou, J.; Li, Y. Mechanical Strength of Solid Catalysts: Recent Developments and Future Prospects. AIChE J. 2007, 53, 2618–2629. [Google Scholar] [CrossRef]
- Bahmani, M.; Nazari, M.; Mehreshtiagh, M. A Study on the Mechanical Strength of Fe2O3/Cr2O3/CuO Catalyst for High Temperature Water Gas Shift Reaction. J. Porous Mater. 2021, 28, 683–693. [Google Scholar] [CrossRef]
- Weetall, H.H. Preparation of Immobilized Proteins Covalently Coupled through Silane Coupling Agents to Inorganic Supports. Appl. Biochem. Biotechnol. 1993, 41, 157–188. [Google Scholar] [CrossRef]
- Karim, M.R.; Hashinaga, F. Preparation and Properties of Immobilized Pummelo Limonoid Glucosyltransferase. Process Biochem. 2002, 38, 809–814. [Google Scholar] [CrossRef]
- Chen, X.; Tian, Z.; Zhou, H.; Zhou, G.; Cheng, H. Enhanced Enzymatic Performance of β-Mannanase Immobilized on Calcium Alginate Beads for the Generation of Mannan Oligosaccharides. Foods 2023, 12, 3089. [Google Scholar] [CrossRef]
- Miletić, N.; Nastasović, A.; Loos, K. Immobilization of Biocatalysts for Enzymatic Polymerizations: Possibilities, Advantages, Applications. Bioresour. Technol. 2012, 115, 126–135. [Google Scholar] [CrossRef]
- Sichina, W.J. Characterization of Polymers by TMA 2000. In Thermal Analysis Application Note; PerkinElmer Instruments TM: Norwalk, CT, USA; Available online: https://thermalsupport.com/wp-content/uploads/2018/05/PETech-28.pdf (accessed on 5 January 2024).
- Dhanalakshmi, M.; Sruthi, D.; Jinuraj, K.R.; Das, K.; Dave, S.; Andal, N.M.; Das, J. Mannose: A Potential Saccharide Candidate in Disease Management. Med. Chem. Res. 2023, 32, 391–408. [Google Scholar] [CrossRef]
- Chen, J.; Liu, D.; Shi, B.; Wang, H.; Cheng, Y.; Zhang, W. Optimization of Hydrolysis Conditions for the Production of Glucomanno-Oligosaccharides from Konjac Using β-Mannanase by Response Surface Methodology. Carbohydr. Polym. 2013, 93, 81–88. [Google Scholar] [CrossRef]
- Intaratrakul, K.; Nitisinprasert, S.; Nguyen, T.-H.; Haltrich, D.; Keawsompong, S. Manno-Oligosaccharides from Copra Meal: Optimization of Its Enzymatic Production and Evaluation Its Potential as Prebiotic. Bioact. Carbohydr. Diet. Fibre 2022, 27, 100292. [Google Scholar] [CrossRef]
- Jian, H.-L.; Zhu, L.-W.; Zhang, W.-M.; Sun, D.-F.; Jiang, J.-X. Enzymatic Production and Characterization of Manno-Oligosaccharides from Gleditsia Sinensis Galactomannan Gum. Int. J. Biol. Macromol. 2013, 55, 282–288. [Google Scholar] [CrossRef]
- Punekar, N.S. ENZYMES: Catalysis, Kinetics and Mechanisms; Springer: Singapore, 2018; ISBN 9789811307843. [Google Scholar]
- Chato, R.J.A.; Cuevas, C.C.R.; Tangpuz, J.S.N.; Cabatingan, L.K.; Go, A.W.; Ju, Y.-H. Dilute Acid Hydrolysis as a Method of Producing Sugar-Rich Hydrolysates and Lipid-Dense Cake Residues from Copra Cake. J. Environ. Chem. Eng. 2018, 6, 5693–5705. [Google Scholar] [CrossRef]
- Dawood, A.; Ma, K. Applications of Microbial β-Mannanases. Front. Bioeng. Biotechnol. 2020, 8, 598630. [Google Scholar] [CrossRef] [PubMed]
- Rovira, C.; Males, A.; Davies, G.J.; Williams, S.J. Mannosidase Mechanism: At the Intersection of Conformation and Catalysis. Curr. Opin. Struct. Biol. 2020, 62, 79–92. [Google Scholar] [CrossRef] [PubMed]
- Polizeli, M.; Polizeli, M.d.L.T.M.; Rai, M. (Eds.) Fungal Enzymes; CRC Press: Boca Raton, FL, USA, 2016; ISBN 978-0-429-07420-2. [Google Scholar]
- Tang, X.; Zhu, X.; Yang, Y.; Qi, Z.; Mu, Y.; Huang, Z. Research Article Product Composition Analysis and Process Research of Oligosaccharides Produced from Enzymatic Hydrolysis of High-Concentration Konjac Flour. ACS Omega 2020, 5, 2480–2487. [Google Scholar] [CrossRef] [PubMed]
- Li, Y.; Yi, P.; Liu, J.; Yan, Q.; Jiang, Z. High-Level Expression of an Engineered β-Mannanase (mRmMan5A) in Pichia Pastoris for Manno-Oligosaccharide Production Using Steam Explosion Pretreated Palm Kernel Cake. Bioresour. Technol. 2018, 256, 30–37. [Google Scholar] [CrossRef]
Figure 1.
Scanning electron microscope images of CF pellets with and without enzymatic cocktail. (A) Non-enzymatic pellet samples exhibit complex structures with uneven cavities, channels, and pores. (B) The image of the support with immobilized enzyme shows open bubbles and pores, some of which are interconnected.
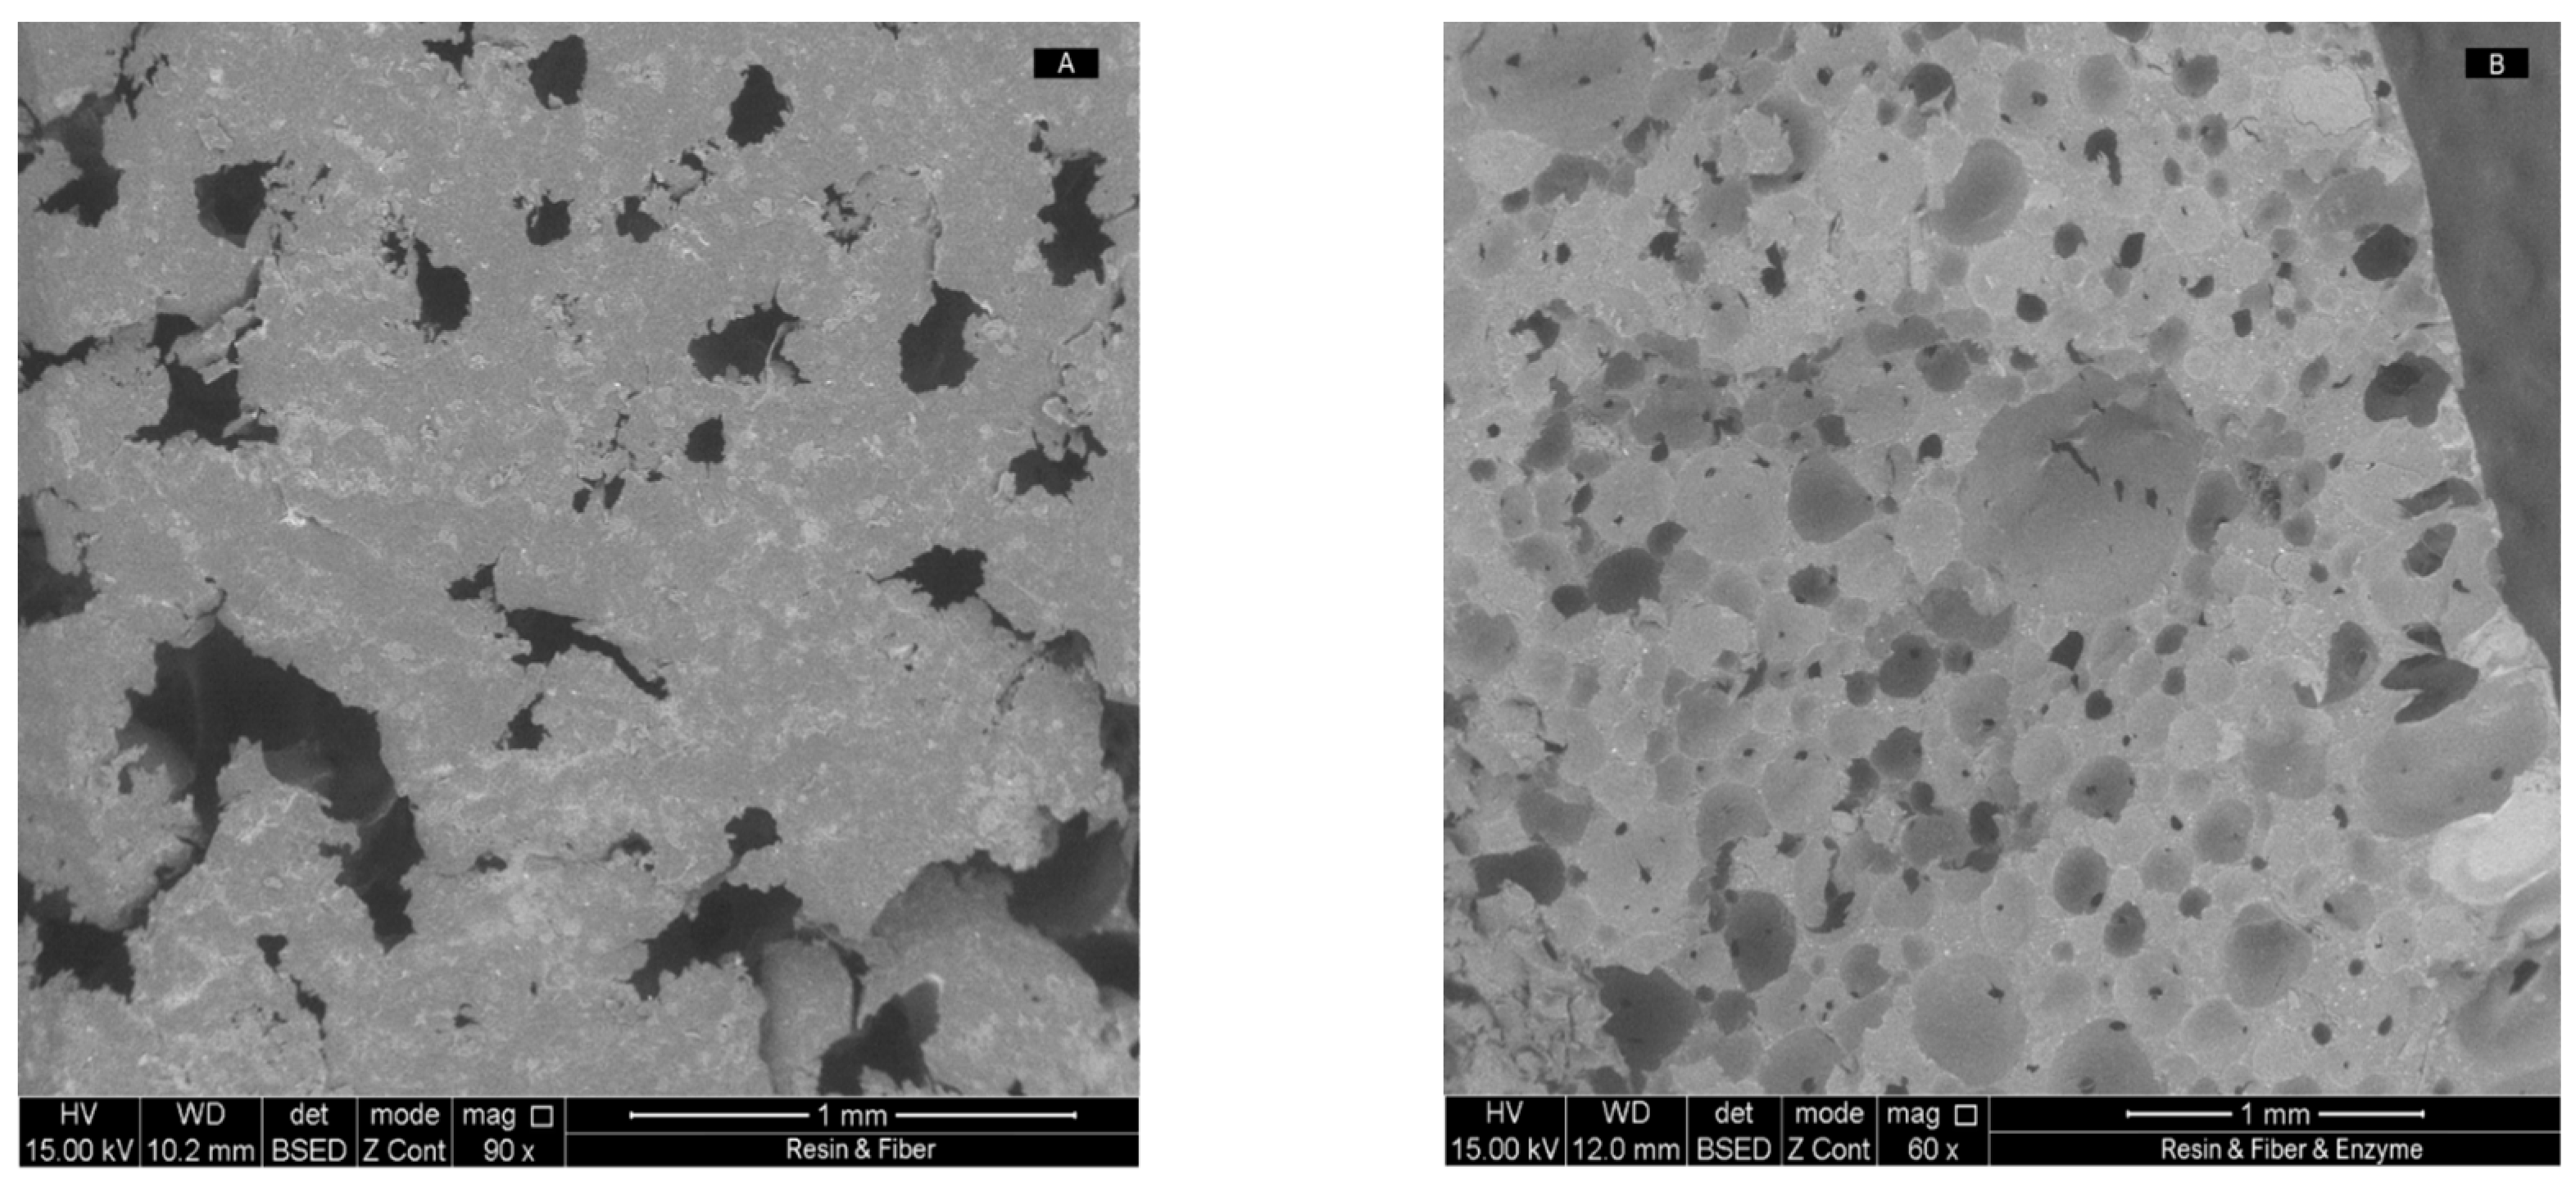
Figure 2.
FTIR spectrum of the resin filled with fibers from annatto capsules with and without enzyme. The red spectrum corresponds to the support with fiber without enzyme, while the blue spectrum represents the support with fiber and enzyme.
Figure 2.
FTIR spectrum of the resin filled with fibers from annatto capsules with and without enzyme. The red spectrum corresponds to the support with fiber without enzyme, while the blue spectrum represents the support with fiber and enzyme.
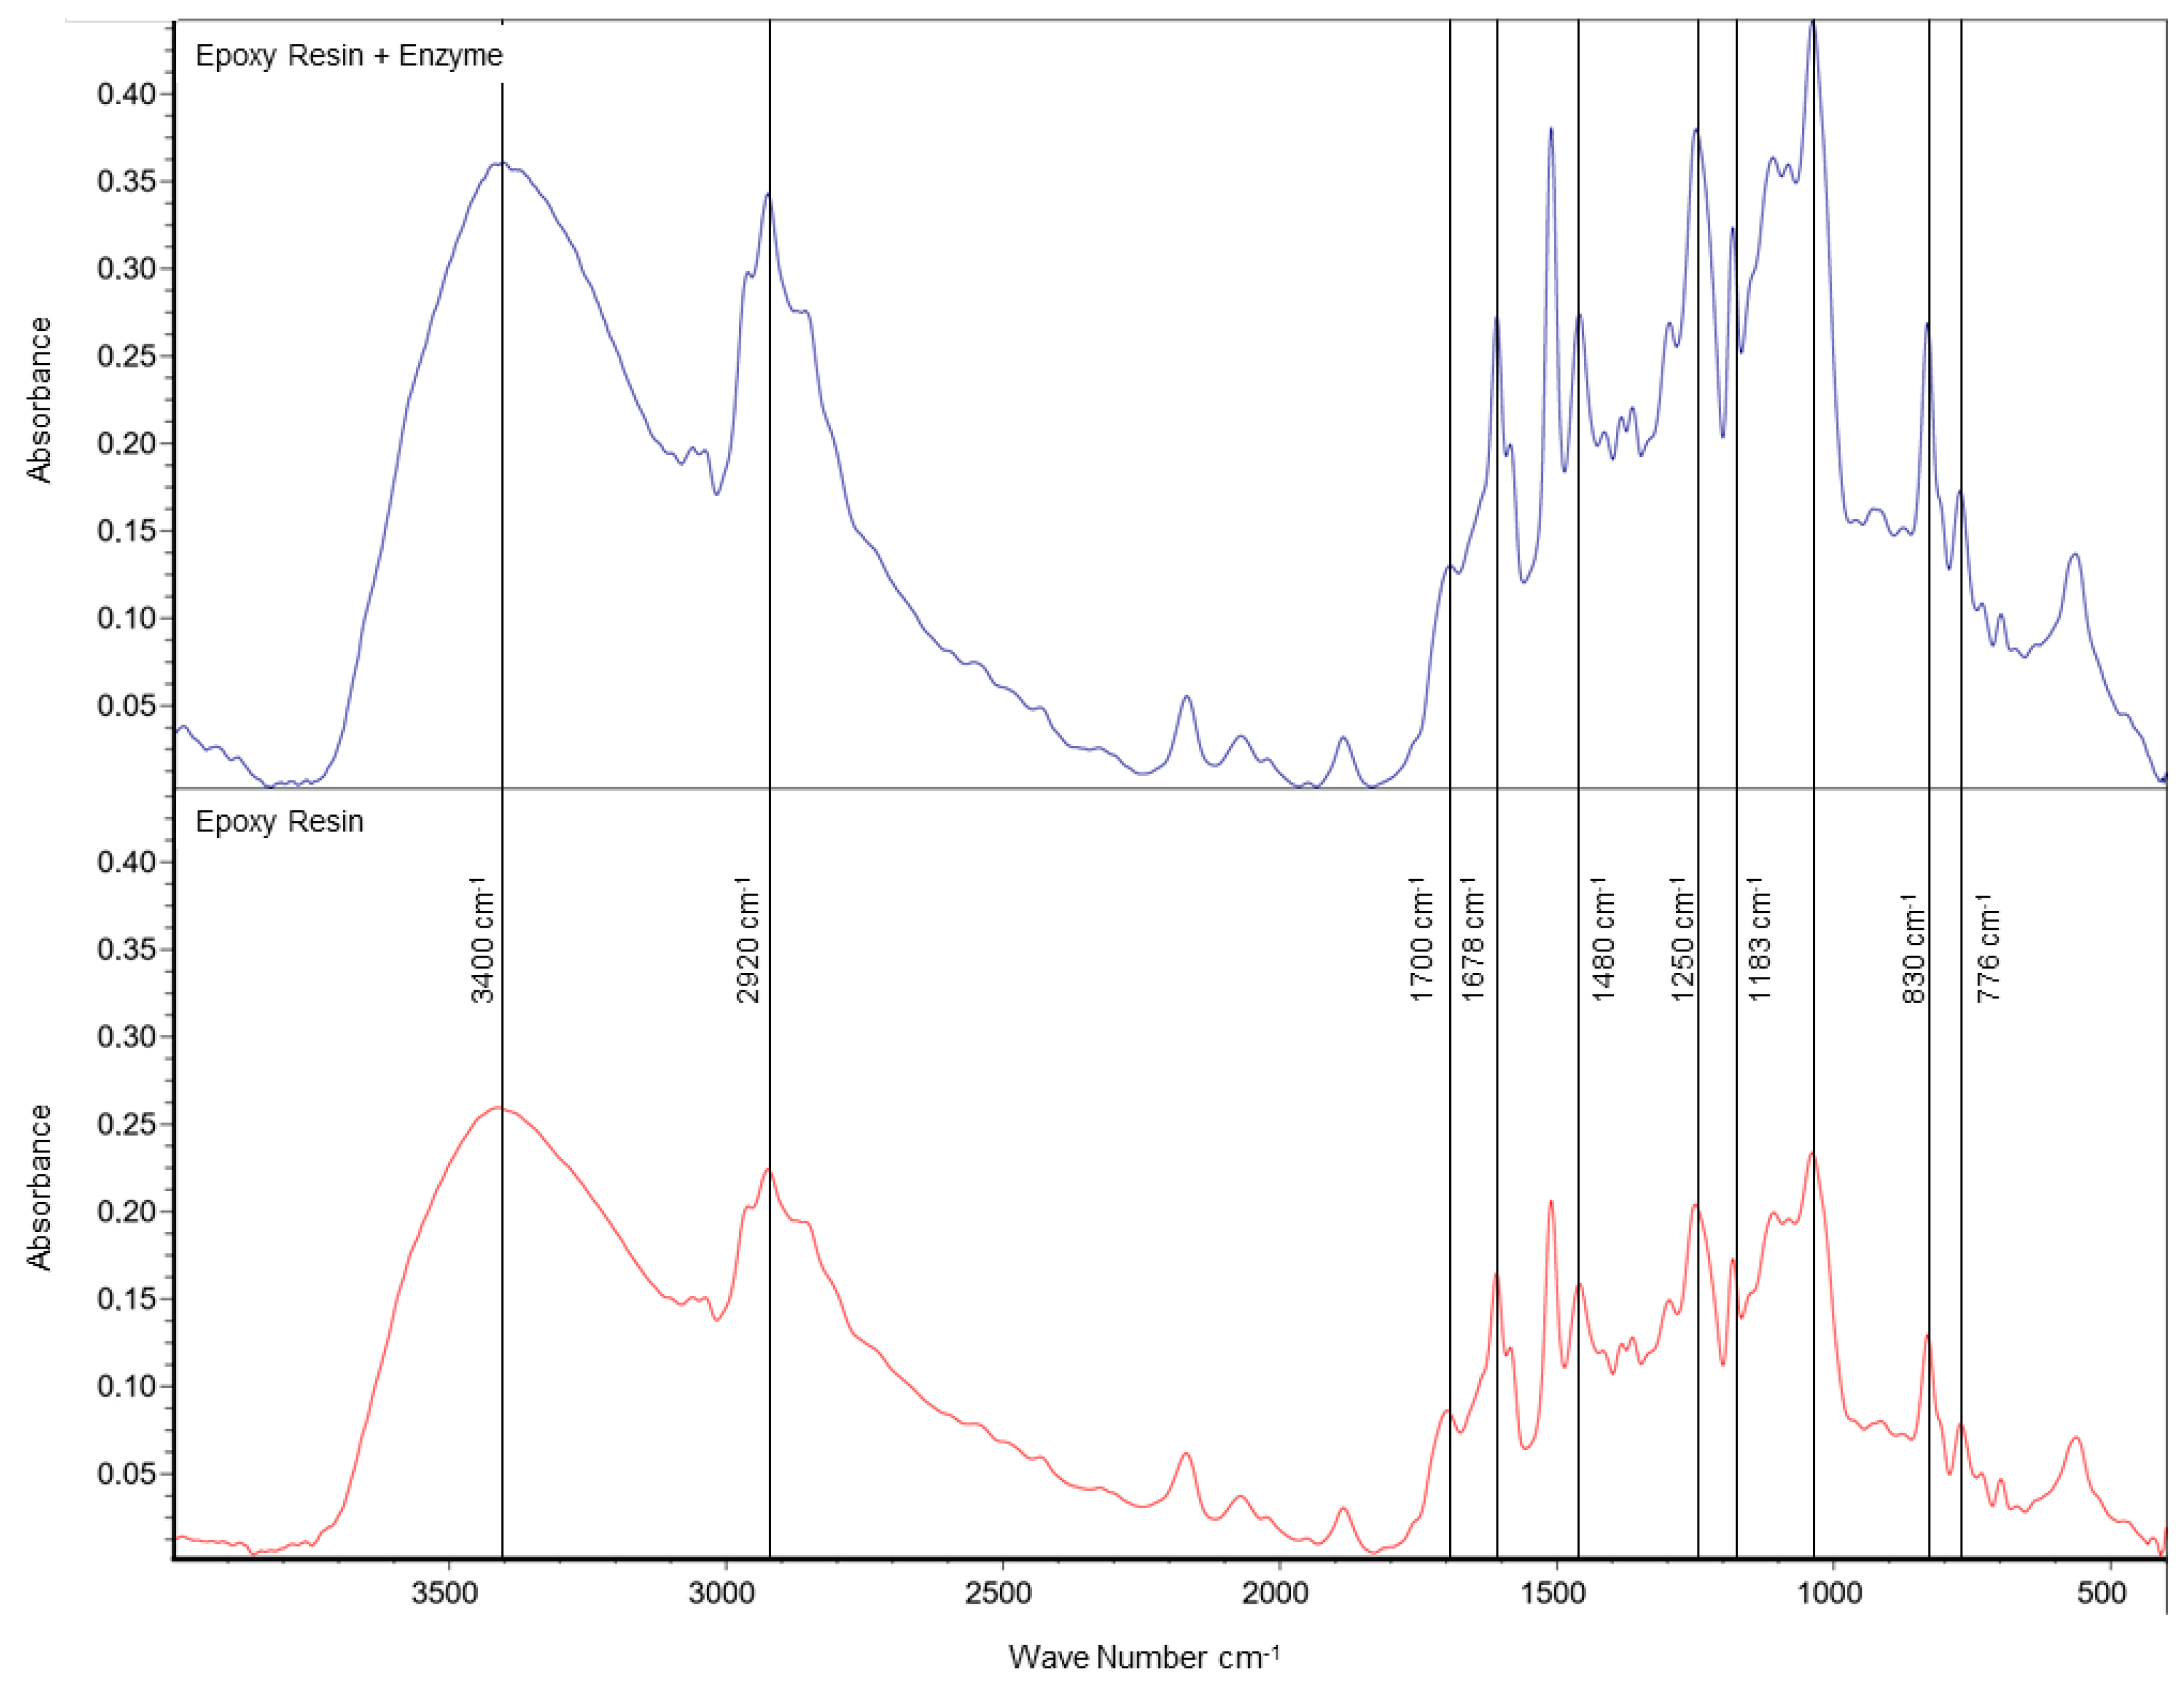
Figure 3.
Effect of pH on enzymatic activity on a dispersion of locust bean gum (20 mL of 0.5% w/v) for 5 min at 50 °C. The points represent the average effect of specific activity at a specific pH, along with their respective standard deviations. * The activity units are reported per dry weight of the enzyme cocktail powder used.
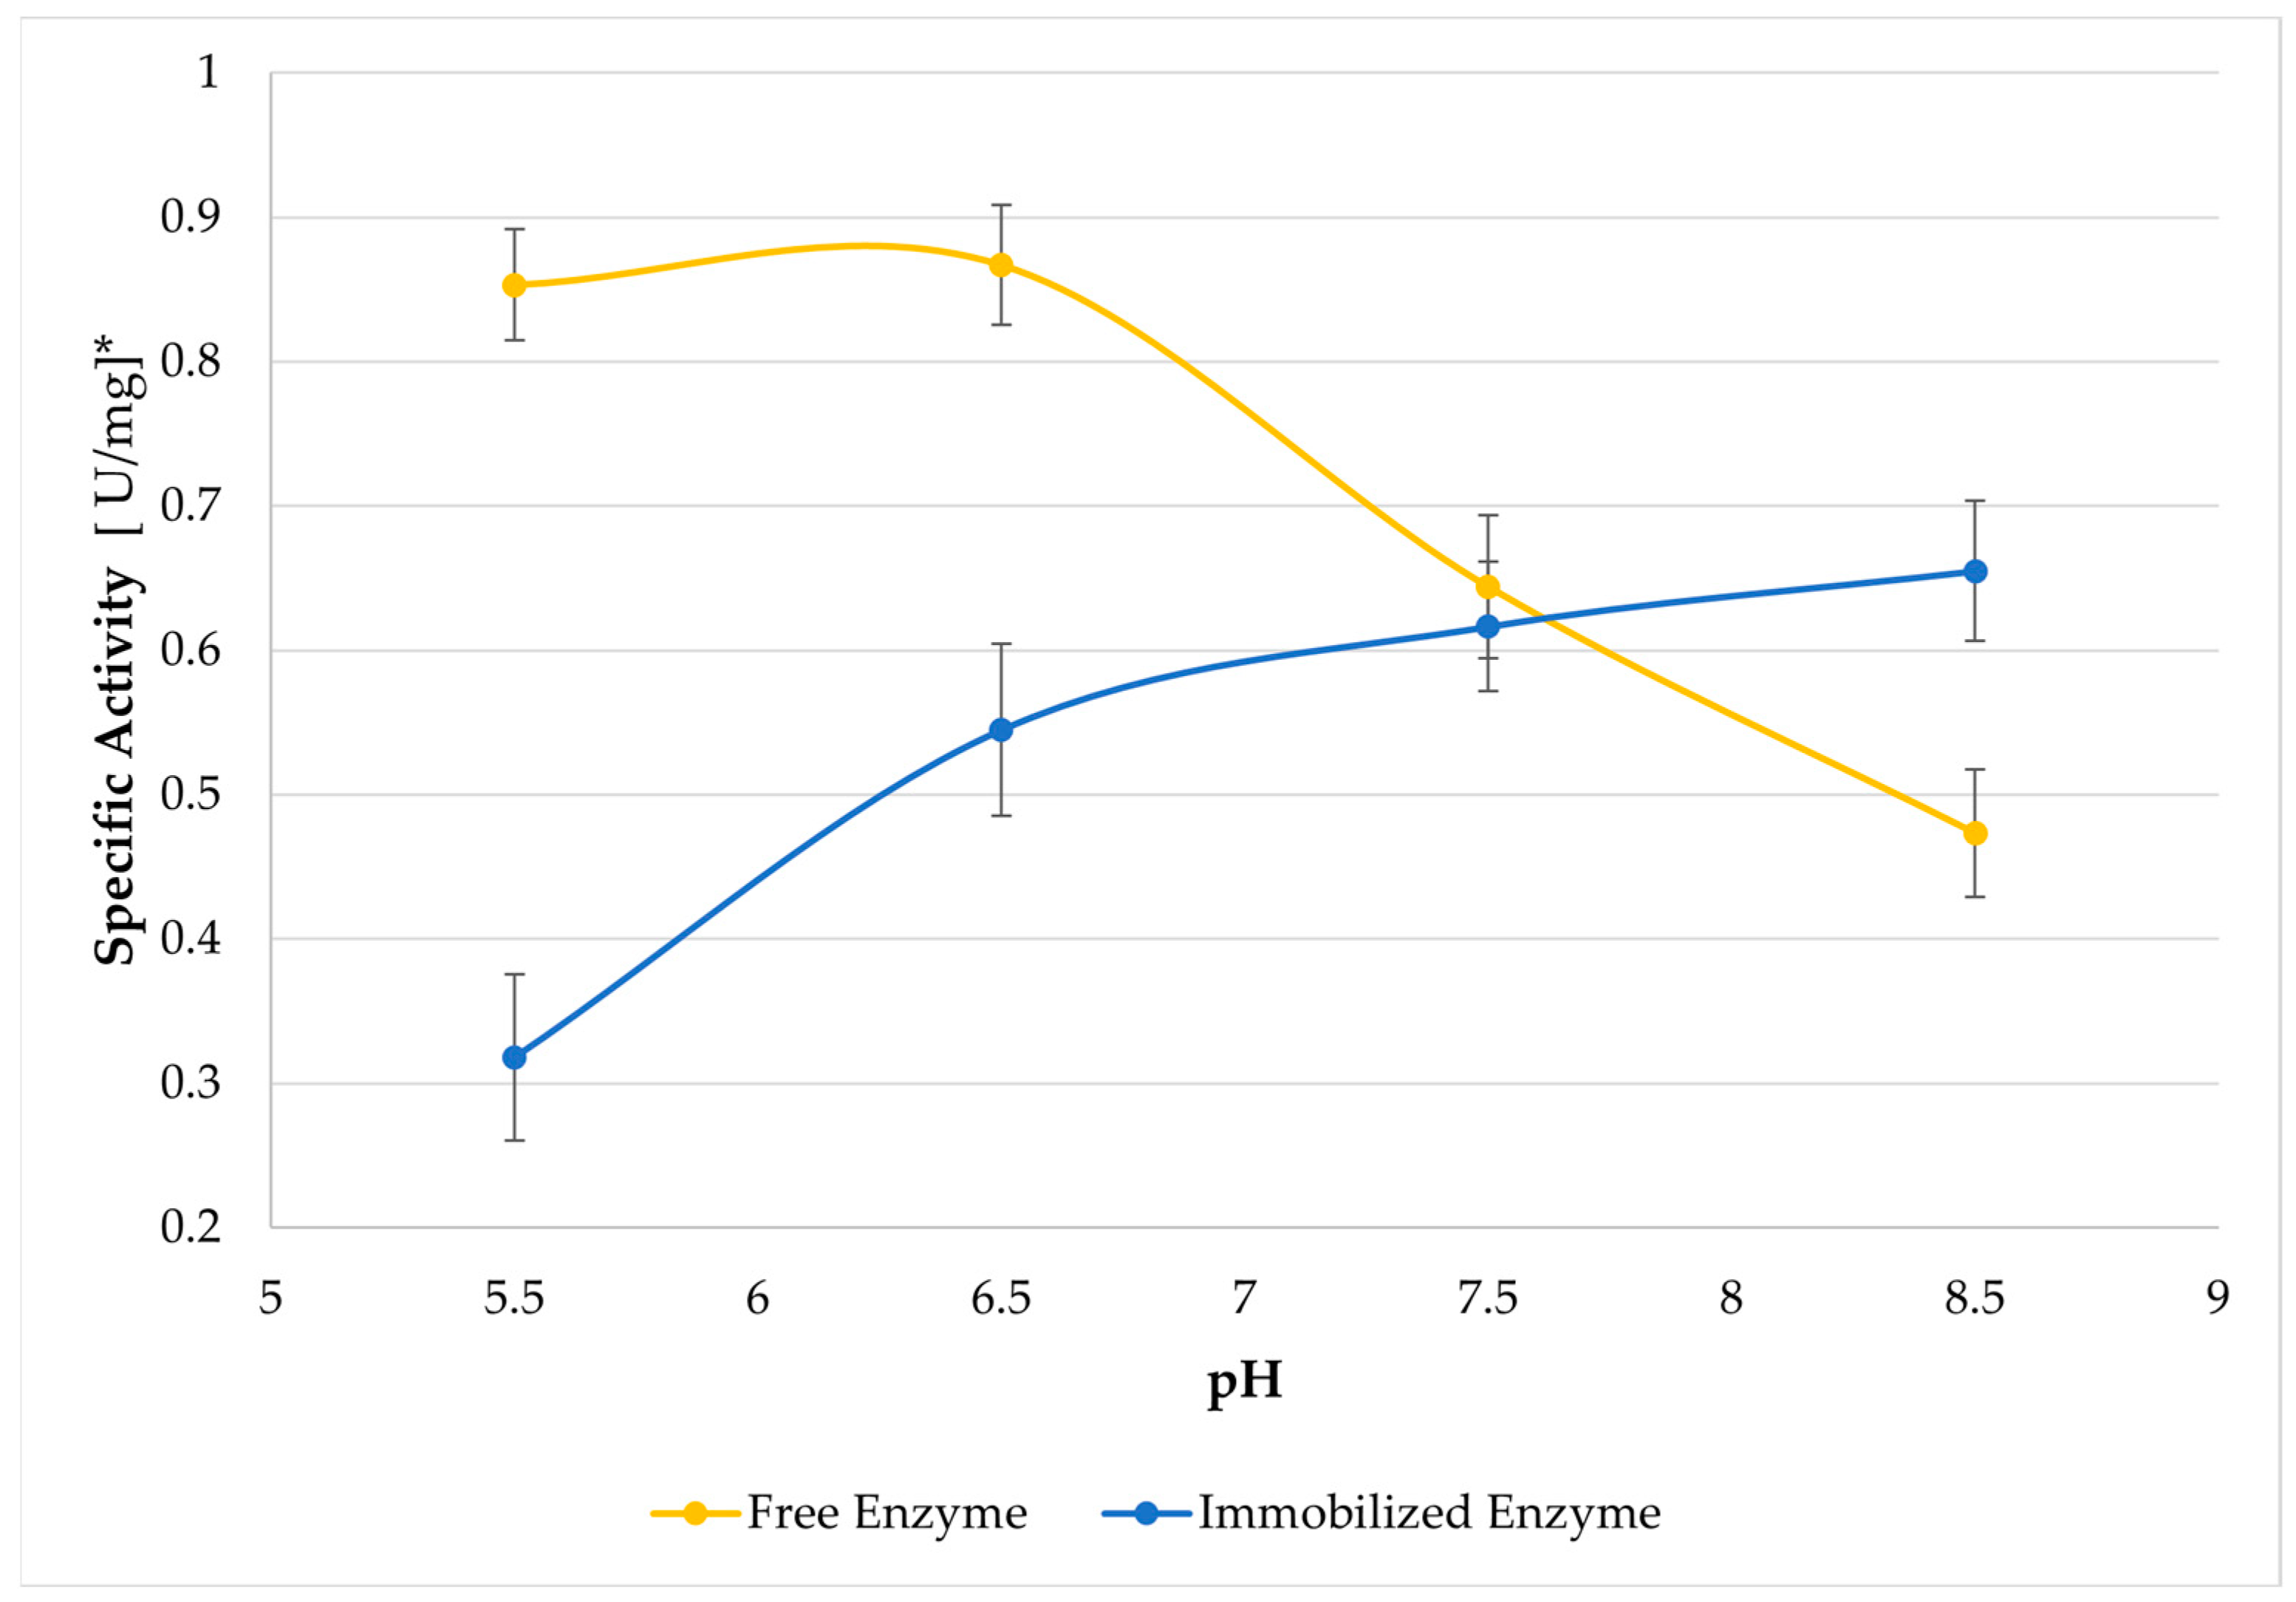
Figure 4.
Effect of temperature on enzymatic activity in locust bean gum. Substrate: a dispersion of locust bean gum (20 mL of 0.5% w/v) in a 50 µM sodium phosphate buffer pH 6.5 for 5 min. The points represent the average effect of specific activity at a specific pH, along with their respective standard deviations. * The activity units are reported per dry weight of the enzyme cocktail powder used.
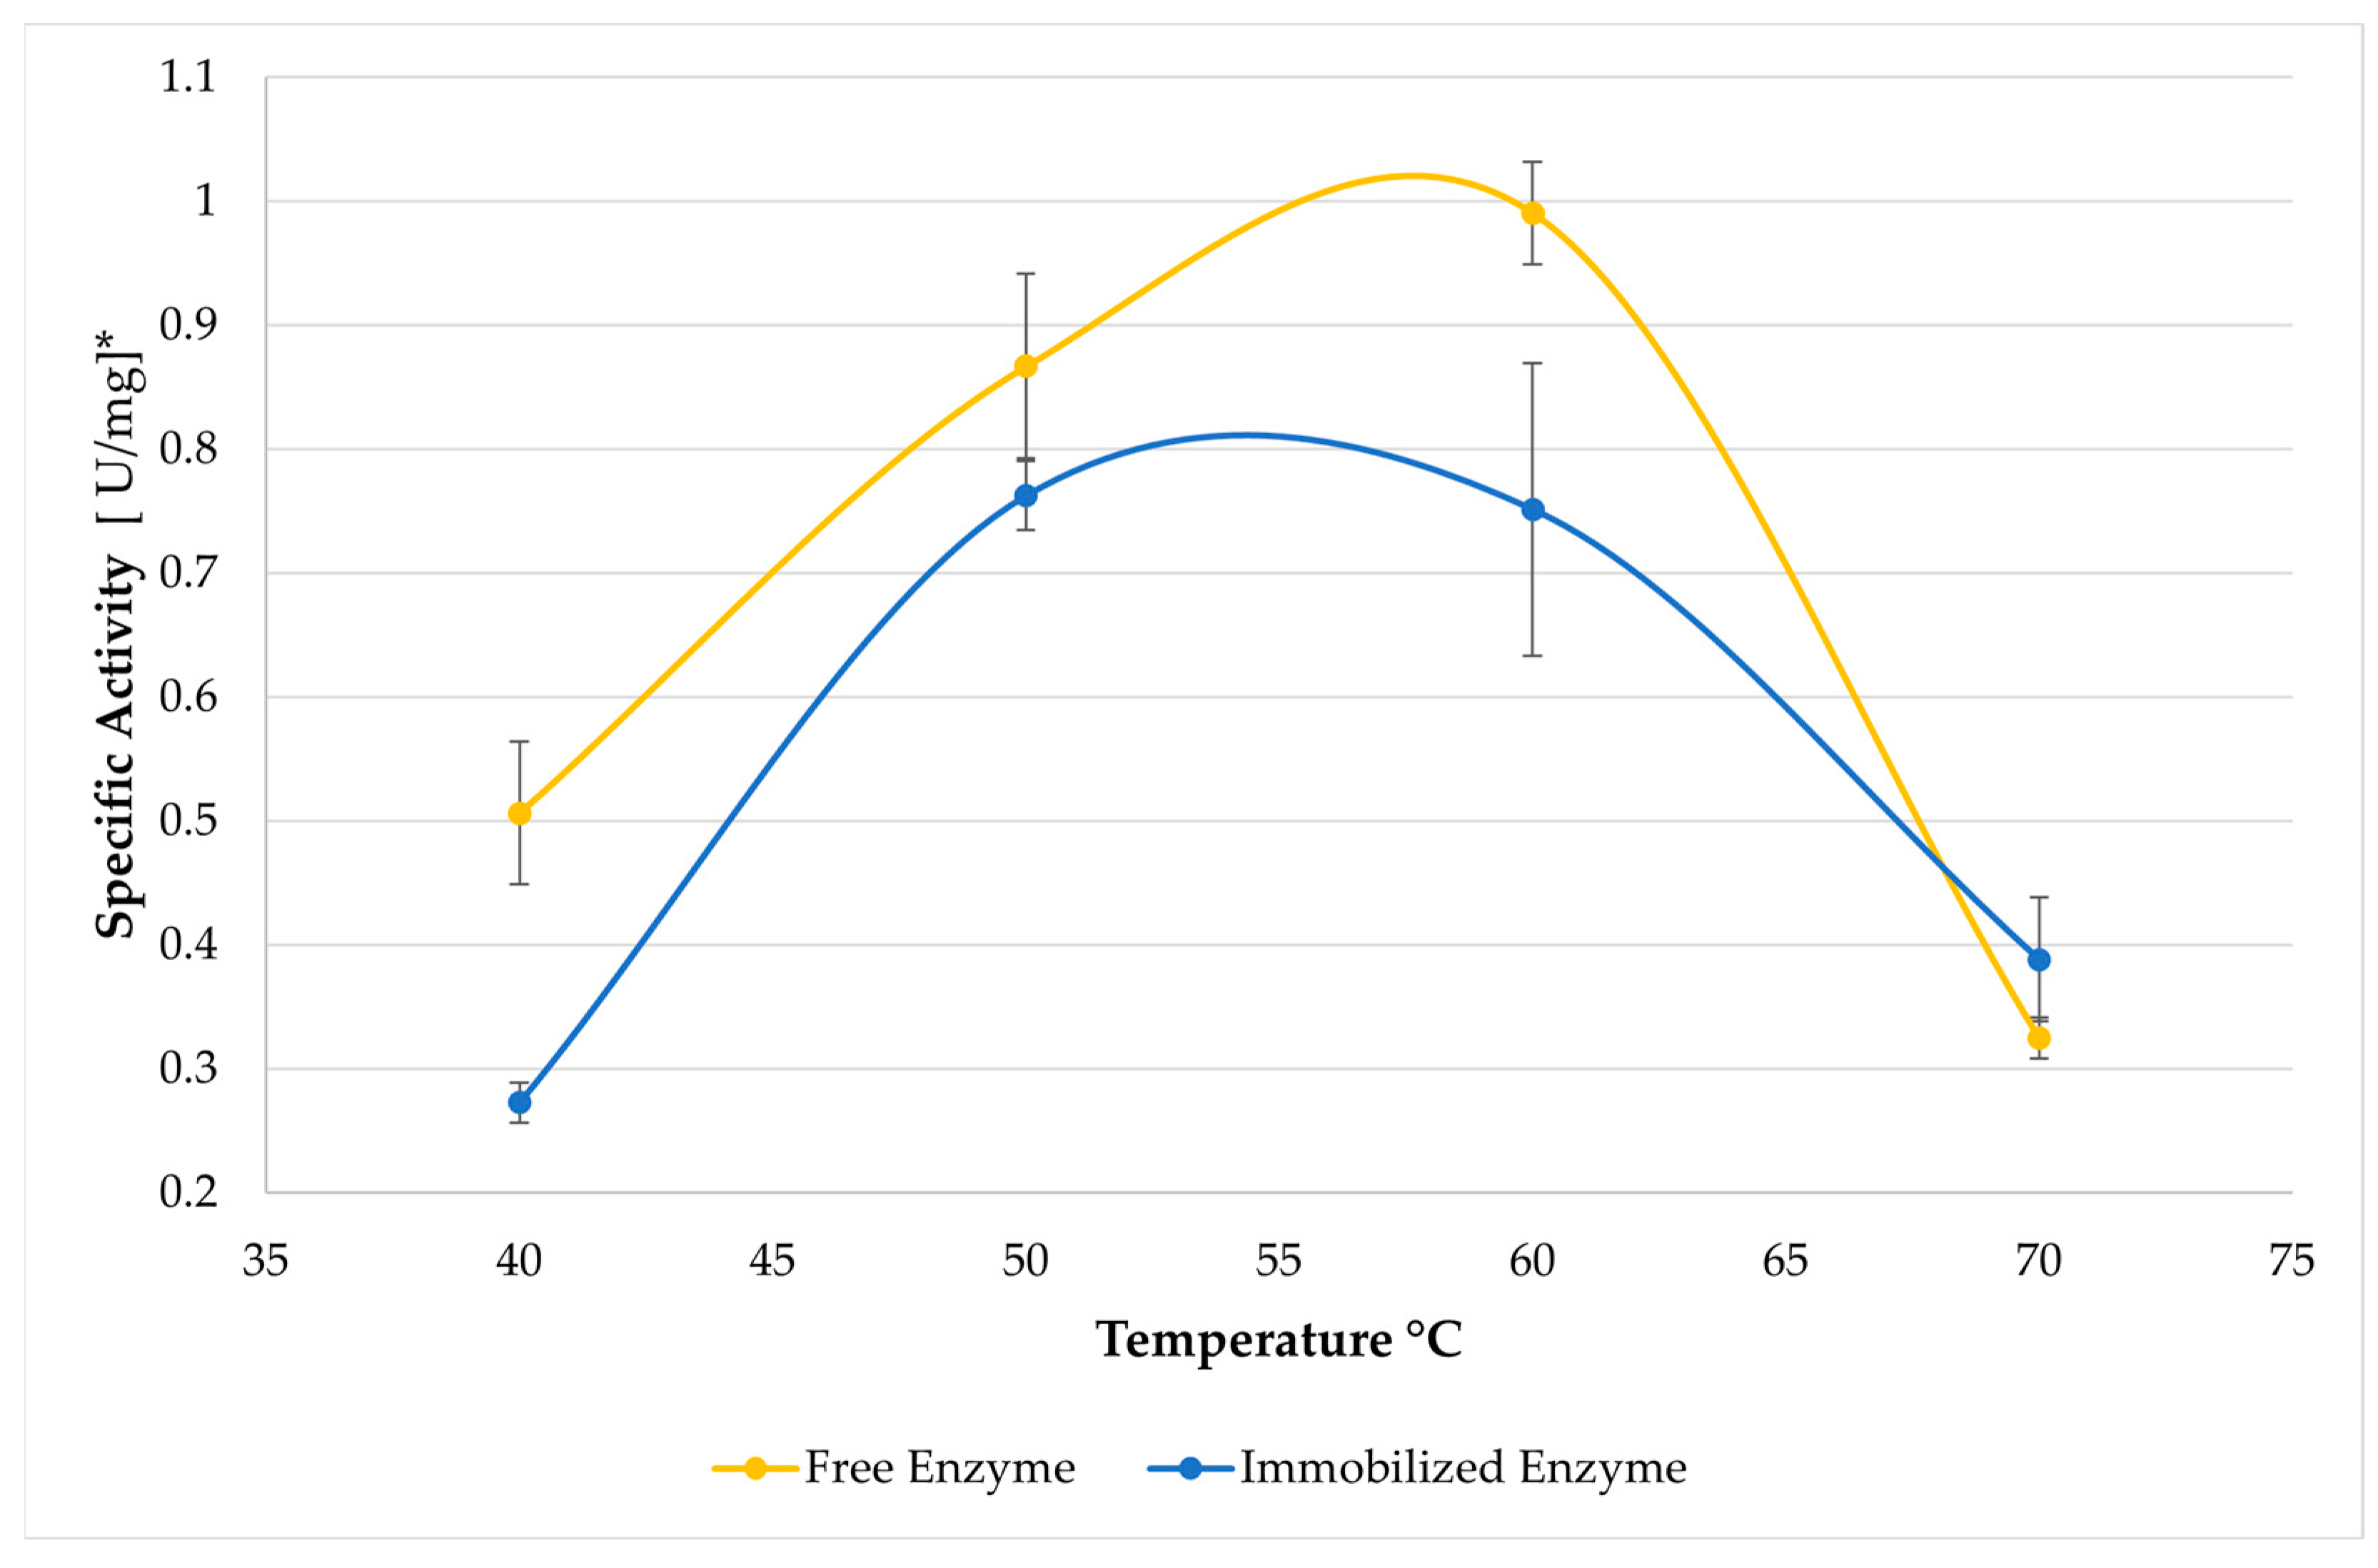
Figure 5.
Percentage of residual activity of immobilized systems on CF after each recycle batch. The data points in the figure represent the mean of four replicates and error bars the standard deviation. No significant differences were observed in the means.
Figure 5.
Percentage of residual activity of immobilized systems on CF after each recycle batch. The data points in the figure represent the mean of four replicates and error bars the standard deviation. No significant differences were observed in the means.

Figure 6.
Response surface and corresponding contour curves of the effects of (a) time and pH (b) time and enzyme loading, (c) time and temperature, (d) pH and enzyme loading, (e) pH and temperature, (f) enzyme loading and temperature on the concentration of açaí seeds-derived MOS (DP 2–5).
Figure 6.
Response surface and corresponding contour curves of the effects of (a) time and pH (b) time and enzyme loading, (c) time and temperature, (d) pH and enzyme loading, (e) pH and temperature, (f) enzyme loading and temperature on the concentration of açaí seeds-derived MOS (DP 2–5).
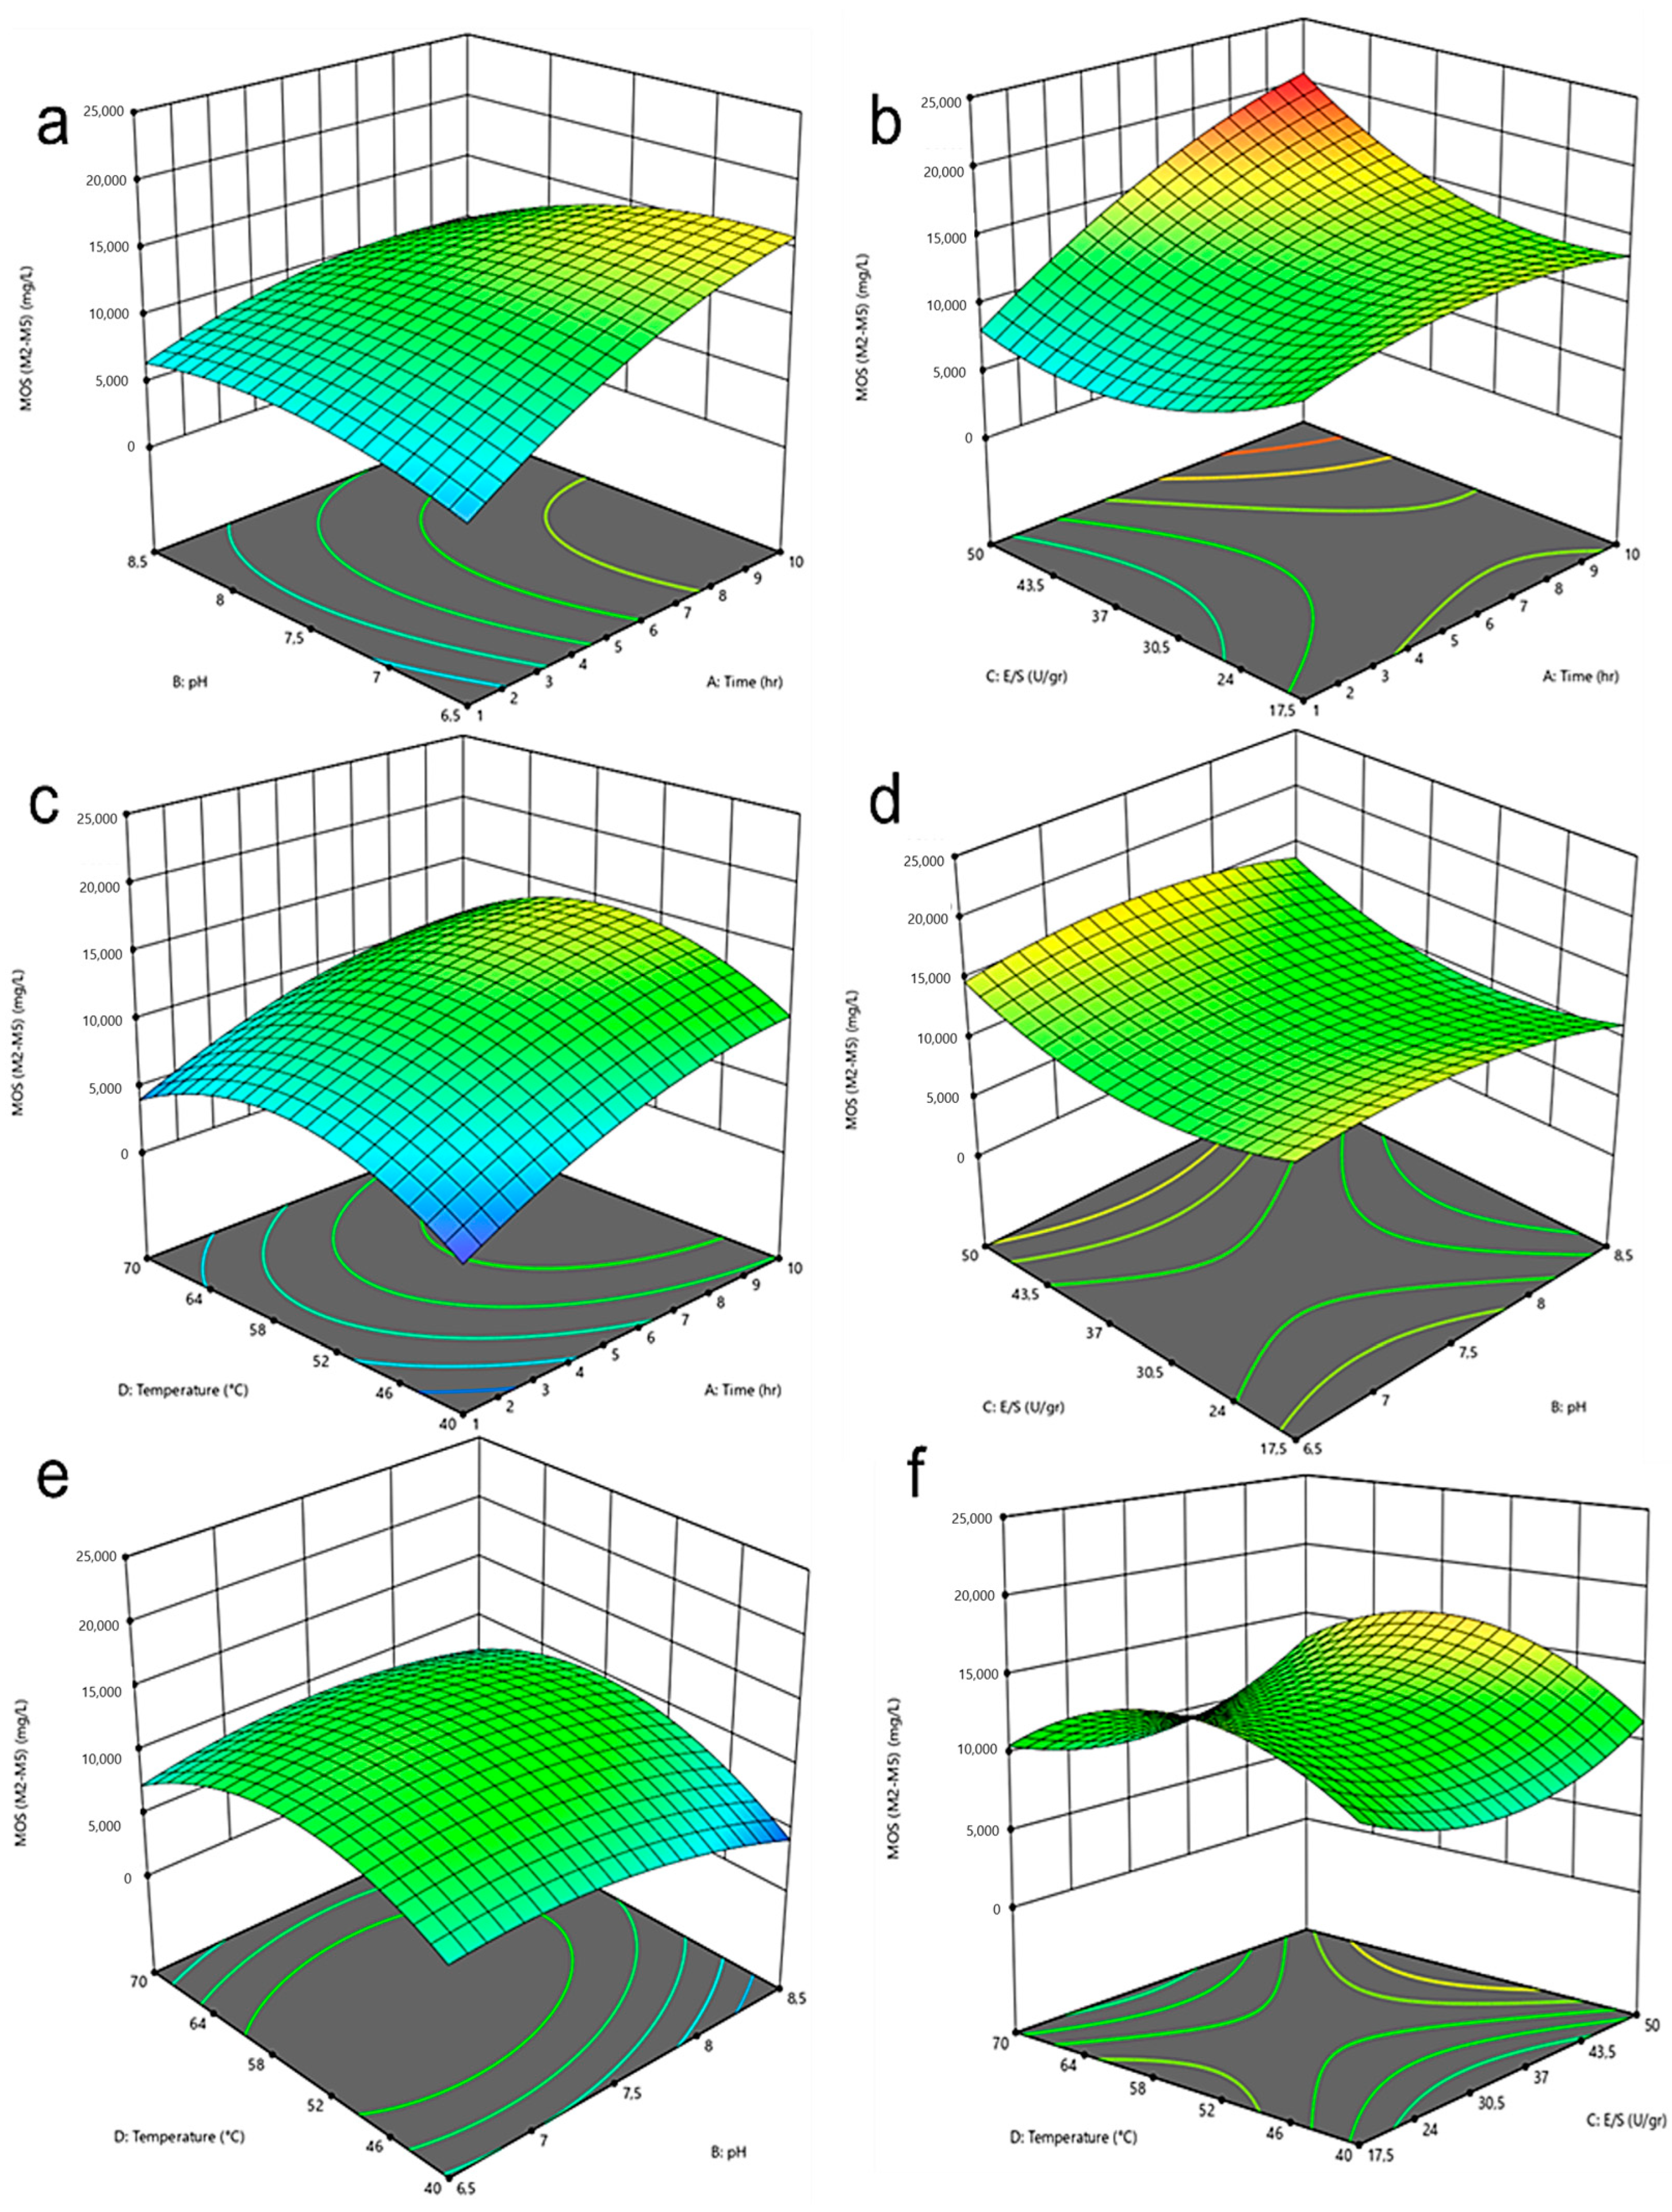
Table 1.
Independent variables and their corresponding levels for MOS production.
| Independent Variable | Unit | Type | Level 1 | Level 2 | Level 3 |
|---|---|---|---|---|---|
| A-Time | Hr | Continuous | 1 | 10 | - |
| B-pH | - | Discrete | 6.5 | 7.5 | 8.5 |
| C-Enzyme Load | (U/gr substrate) | Discrete | 17 | 33.5 | 50 |
| D-Temperature | (°C) | Discrete | 40 | 50 | 70 |
Table 2.
Response values for the experimental design of MOS and mannose production.
| Run | Time | pH | E/S | T° | Mannose | MOS (M2–M5) |
|---|---|---|---|---|---|---|
| hr | U/gr | °C | mg/L | mg/L | ||
| 1 | 8.65 | 8.5 | 50 | 70 | 958.81 | 14,095.90 |
| 2 | 10 | 8.5 | 33.75 | 55 | 170.10 | 9757.76 |
| 3 | 10 | 7.5 | 17.5 | 70 | 850.25 | 6370.89 |
| 4 | 5.5 | 7.5 | 33.75 | 55 | 250.90 | 12,016.70 |
| 5 | 1 | 6.5 | 33.75 | 55 | 352.58 | 4400.62 |
| 6 | 8.65 | 8.5 | 17.5 | 40 | 178.35 | 4733.63 |
| 7 | 7.75 | 7.5 | 33.75 | 40 | 231.59 | 9840.03 |
| 8 | 1 | 6.5 | 50 | 40 | 237.77 | 2307.15 |
| 9 | 1 | 8.5 | 33.75 | 55 | 874.04 | 6632.93 |
| 10 | 6.94 | 6.5 | 33.75 | 70 | 838.90 | 9797.41 |
| 11 | 3.79 | 8.5 | 17.5 | 70 | 175.49 | 8739.32 |
| 12 | 1 | 8.5 | 33.75 | 55 | 229.53 | 6870.05 |
| 13 | 5.5 | 7.5 | 33.75 | 55 | 327.53 | 12,734.40 |
| 14 | 10 | 6.5 | 50 | 55 | 2315.96 | 20,011.70 |
| 15 | 1 | 7.5 | 17.5 | 40 | 1271.63 | 7985.93 |
| 16 | 10 | 6.5 | 33.75 | 40 | 1510.52 | 13,282.00 |
| 17 | 1 | 7.5 | 50 | 70 | 195.91 | 4333.87 |
| 18 | 6.94 | 6.5 | 33.75 | 70 | 1840.33 | 9076.04 |
| 19 | 4.15 | 6.5 | 33.75 | 40 | 1485.81 | 3225.43 |
| 20 | 1 | 6.5 | 17.5 | 70 | 506.53 | 5311.39 |
| 21 | 5.5 | 7.5 | 33.75 | 55 | 223.67 | 12,435.90 |
| 22 | 6.895 | 6.5 | 17.5 | 55 | 2165.95 | 14,307.10 |
| 23 | 6.4 | 8.5 | 50 | 40 | 172.89 | 7514.69 |
| 24 | 5.5 | 7.5 | 33.75 | 55 | 233.80 | 12,240.80 |
| 25 | 5.5 | 7.5 | 33.75 | 55 | 220.19 | 13,389.00 |
| 26 | 6.895 | 6.5 | 17.5 | 55 | 3080.27 | 16,988.50 |
| 27 | 10 | 7.5 | 50 | 40 | 137.58 | 16,682.30 |
| 28 | 6.175 | 7.5 | 50 | 70 | 328.52 | 14,476.60 |
| 29 | 10 | 7.5 | 17.5 | 70 | 990.43 | 10,698.70 |
Table 3.
Model validation with optimized conditions.
| Product mg/L | Predicted | Experimental | Error |
|---|---|---|---|
| M1 | 577.02 | 565.36 | 2.06% |
| MOS (M2–M5) | 12,347.92 | 12,954.62 | 4.68% |
Conditions: Time (hr) 2.74, pH 7.9, CE (U/gr) 17.5, Temperature (°C) 59.
Disclaimer/Publisher’s Note: The statements, opinions and data contained in all publications are solely those of the individual author(s) and contributor(s) and not of MDPI and/or the editor(s). MDPI and/or the editor(s) disclaim responsibility for any injury to people or property resulting from any ideas, methods, instructions or products referred to in the content. |
© 2024 by the authors. Licensee MDPI, Basel, Switzerland. This article is an open access article distributed under the terms and conditions of the Creative Commons Attribution (CC BY) license (https://creativecommons.org/licenses/by/4.0/).
Share and Cite
MDPI and ACS Style
Murillo-Franco, S.L.; Galvis-Nieto, J.D.; Orrego, C.E. Production of Mannooligosaccharides from Açaí Seed by Immobilized β-Mannanase. Processes 2024, 12, 847. https://doi.org/10.3390/pr12050847
AMA Style
Murillo-Franco SL, Galvis-Nieto JD, Orrego CE. Production of Mannooligosaccharides from Açaí Seed by Immobilized β-Mannanase. Processes. 2024; 12(5):847. https://doi.org/10.3390/pr12050847
Chicago/Turabian StyleMurillo-Franco, Sarha Lucia, Juan David Galvis-Nieto, and Carlos E. Orrego. 2024. "Production of Mannooligosaccharides from Açaí Seed by Immobilized β-Mannanase" Processes 12, no. 5: 847. https://doi.org/10.3390/pr12050847
Note that from the first issue of 2016, this journal uses article numbers instead of page numbers. See further details here.