Article

In Silico Identification of Microbial Partners to Form Consortia with Anaerobic Fungi

1
Department of Chemical Engineering, University of California, Santa Barbara, CA 93106, USA
2
Department of Computer Science, University of California, Santa Barbara, CA 93106, USA
*
Author to whom correspondence should be addressed.
Processes 2018, 6(1), 7; https://doi.org/10.3390/pr6010007
Submission received: 27 December 2017 / Revised: 10 January 2018 / Accepted: 12 January 2018 / Published: 15 January 2018

Abstract

:
Lignocellulose is an abundant and renewable resource that holds great promise for sustainable bioprocessing. However, unpretreated lignocellulose is recalcitrant to direct utilization by most microbes. Current methods to overcome this barrier include expensive pretreatment steps to liberate cellulose and hemicellulose from lignin. Anaerobic gut fungi possess complex cellulolytic machinery specifically evolved to decompose crude lignocellulose, but they are not yet genetically tractable and have not been employed in industrial bioprocesses. Here, we aim to exploit the biomass-degrading abilities of anaerobic fungi by pairing them with another organism that can convert the fermentable sugars generated from hydrolysis into bioproducts. By combining experiments measuring the amount of excess fermentable sugars released by the fungal enzymes acting on crude lignocellulose, and a novel dynamic flux balance analysis algorithm, we screened potential consortia partners by qualitative suitability. Microbial growth simulations reveal that the fungus Anaeromyces robustus is most suited to pair with either the bacterium Clostridia ljungdahlii or the methanogen Methanosarcina barkeri—both organisms also found in the rumen microbiome. By capitalizing on simulations to screen six alternative organisms, valuable experimental time is saved towards identifying stable consortium members. This approach is also readily generalizable to larger systems and allows one to rationally select partner microbes for formation of stable consortia with non-model microbes like anaerobic fungi.

1. Introduction

Modern biotechnology is well poised to take advantage of the current shift towards a more sustainable chemical industry [1]. Harnessing the estimated 1.3 billion tons of energy rich, lignocellulosic agricultural waste generated world wide each year is a promising avenue towards this goal [2]. However, extracting cellulose (40–50%) and hemicellulose (20–40%) from raw plant biomass has proven to be challenging due to the high lignin content of the substrate [3]. Current industrial techniques used to overcome this barrier include physical, chemical and biological treatment (e.g., milling, acid hydrolysis and enzyme treatment, respectively) [4].
Biological conversion attempts to exploit natural mechanisms to produce chemicals from lignocellulose. Currently, two competing alternatives are being investigated: consolidated bioprocessing and microbial consortia approaches [5]. The former seeks to engineer a single organism to both degrade biomass and produce a high value commodity chemical [6]. The latter seeks to leverage specialist organisms to split the associated metabolic burden between them [7]. Exploiting the natural degradation powers of non-model fungi could prove beneficial in this endeavor.
Currently, fungal enzymes from a handful of organisms, e.g., Trichoderma reesei or Aspergillus sp., are utilized on an industrial scale to break down plant biomass [8]. A recent report illustrates the utility of developing consortia between a cellulose degrader like T. reesei and the model bacterium Escherichia coli [9]. A potential drawback of this pairing is that T. reesei encodes for the smallest diversity of cellulolytic enzymes of any fungus capable of plant cell wall degradation [10]. This could necessitate the addition of (expensive) beta-glucosidases, to convert cellobiose to glucose, in some applications. It is hypothesized that under-explored fungal clades, like Neocallimastigomycota, coud offer substantial benefits in this regard [11].
Anaerobic gut fungi, in the phylum Neocallimastigomycota, found in the gastrointestinal tract of ruminants, have been shown to be prodigious degraders of plant biomass [12]. Moreover, they possess the highest diversity of lignocellulolytic enzymes, largely untapped, within the fungal kingdom [13]. These organisms play a pivotal role in the digestion of plant biomass in herbivores, due to the physical and chemical way in which they degrade plant biomass [14]. Recent work highlights the bounty of biotechnological applications of these fungi [15]. Given that these organisms typically thrive in consortia, it is desirable to emulate nature to unlock their potential for bioconversion of unpretreated lignocellulose.
However, these organisms are under-studied, and the mechanisms that promote the formation of stable microbial consortia with anaerobic fungi are unknown. Given the wealth of omics-related data available, we speculate that model driven design could elucidate some of these questions [11]. Indeed, model driven analysis has successfully been used to study anaerobic organisms [16]. Necessary components for such analyses are accurate genome-scale models of anaerobic gut fungi and their consortia partners. While a full genome-scale model of the gut fungi is still under active development, it is possible to narrow the field in search of potential consortia partners by making use of extant high quality genome-scale models to highlight mechanisms of interaction that would promote microbial partnership and consortium stability.
In this work, we present a marriage of experimental and computational tools used to identify suitable consortia partners for anaerobic gut fungi. Given the vast number of potential candidates, it is infeasible to experimentally test all combinations. Instead, we filter microbes by simulation to test their compatibility in silico. As a first approximation, we assume no interaction between the organisms in consortia: the excess fermentable sugars released by fungal hydrolysis of plant biomass, measured experimentally, is available for consumption regardless of the identity of the partner microbe. By predicting the growth rate and waste production of the partner, we can rank order microbes by the likelihood that they would stably co-exist with the gut fungi over the course of active fungal growth in a batch bioreactor. This is a valuable tool to reduce the number of costly and time-consuming wet-lab experiments necessary to identify suitable partners for anaerobic gut fungal-based consortia. Finally, we introduce a novel dynamic flux balance analysis algorithm specifically developed for this task.

2. Materials and Methods

2.1. Strains and Culture Conditions

Three isolated anaerobic gut fungi were investigated in this work: Neocallimastix californiae, Anaeromyces robustus and a previously uncharacterized fungus Neocallimastix sp. S1 (confirmed by ITS sequencing, see the Supplementary Materials). Anaerobic conditions, as described in [17], were maintained for all experiments. Starter cultures for each experiment were grown on complex media [17], with reed canary grass used as a substrate, in 75 mL serum bottles. After four days of growth, these cultures were used to start experiments by inoculating 4 mL from them into the experiment serum bottles. Gas accumulation in the head space of the starter cultures was vented daily. All experiments were conducted in triplicate using 40 mL of M2 media [18] loaded with 2 g of corn stover grass, (4 mm particle size) supplied by the USDA-ARS research center (Madison, WI, USA), in 75 mL serum bottles.

2.2. Growth and Metabolite Measurements

Fungal growth was monitored by measuring pressure in the head space of the serum bottles twice daily, approximately 12 h apart [19]. Cultures that accumulated significantly more pressure than a control set, without the carbon source corn stover, were deemed to be growing. The gaseous product is primarily composed of hydrogen and carbon dioxide. After the pressure was measured, and prior to venting, 0.2 mL of media was sampled for sugar concentration analysis on a high performance liquid chromatography (HPLC) device. Samples were stored at 20 °C for batch-wise analysis. After thawing the samples at room temperature, they were centrifuged for 5 min at 21,000 ×g. By avoiding the pellet, 100 μ L was transfered to HPLC vials containing 100 μ L de-ionized, 0.45 μ m filtered water (1:1 dilution). Subsequently, 20 μ L of each sample was run on an Agilent 1260 Infinity HPLC (Agilent, Santa Clara, CA, USA) using a Bio-Rad Aminex HPX-87P column (Part No. 1250098, Bio-Rad, Hercules, CA, USA) with inline filter (Part No. 5067-1551, Agilent, Santa Clara, CA, USA), Bio-rad Micro-Guard De-Ashing column (Part No. 1250118, Bio-Rad, Hercules, CA, USA), and Bio-Rad Micro-Guard CarboP column (Part No. 1250119, Bio-Rad, Hercules, CA, USA) in the following orientation: inline filter → De-Ashing → CarboP → HPX-87P columns. Samples were run with water acting as the mobile phase at a flow rate of 0.6 mL/min and column temperature of 60 °C. Signals were detected using a refractive index detector (RID) with a temperature set point of 40 °C. HPLC standards were created in triplicate for cellobiose, glucose, fructose, xylose and arabinose at 5 g/L, 1 g/L, and 0.1 g/L concentrations in M2. The concentration of each sugar was measured by subtracting the RID signal from a blank M2 sample.

2.3. Evaluation and Selection of Model Organisms

The BIGG database is an online repository of curated genome-scale metabolic models [20]. Currently (Accessed December 2017) the database consists of 84 models from a wide diversity of organisms. We hypothesized that the higher level of understanding implied by these models may be leveraged into the formation of stable consortia with the relatively understudied anaerobic fungi. The first step in identifying possible consortia partners is to screen the modeled organisms by three criteria: (1) is the organism an obligate aerobe, (2) is the organism pathogenic and (3) is the organism obviously incompatible with the anaerobic fungi? If any of these criteria were positive, the model was discarded. For example, Helicobacter pylori is a modeled pathogen and is therefore excluded. In addition, Thermotoga maritima is a modeled hyperthermophilic bacterium; it cannot be co-cultured with the anaerobic fungi and is immediately discarded as a potential consortia partner. By filtering all 84 potential models, we are left with six possible partners, shown in Table 1.

2.4. Dynamic Flux Balance Analysis Formulation

Flux balance analysis (FBA) is a widely used computational tool that simplifies and recasts the metabolic reaction network of a cell into a linear program by making use of a genome-scale model [27]. Central to FBA is the assumption of metabolic steady state, d x d t = S v = 0 . The space of fluxes, v , that satisfy the mass balance implied by the stoichiometric matrix, S , is reduced by assuming that the cell strives to maximize an empirically defined biomass objective function, μ v , subject to additional flux constraints, v min v v max . Typically, FBA is applied to systems in a steady state; this poses a problem for modeling anaerobic gut fungi because no continuous reactor has been developed for them yet.
Dynamic flux balance analysis (dFBA) is a well-established tool used to extend FBA to dynamic settings [28]. It relies on the assumption that intra-cellular dynamics are much faster than extra-cellular dynamics. This allows one to discretize time and apply classical FBA at each time step. The resultant fluxes are then used to update the biomass (X), external substrate ( s ), and product ( p ), concentrations by integrating
d X d t = μ X , d s d t = v s X , d p d t = v p X ,
where μ , v s and v p are the growth rate, substrate and product fluxes, respectively. These are then used to update the flux constraints,
v min s , P v v max s , P ,
used in the FBA algorithm for the next time step [29]. dFBA has been successfully applied to mono-culture [30,31] and community [32,33] modeling.
An inherent weakness of FBA, and by extension dFBA, is the non-uniquess of the fluxes that maximize the cellular growth rate [34]. Sampling from the space of optimal fluxes is feasible for FBA applications because the computational cost is paid only once (typically a mixed integer linear program needs to be solved [35]). For dFBA applications, this is prohibitively expensive due to the iterative nature of the algorithm. However, it is well recognized that non-uniqueness of the fluxes can pose problems when integrating Equation (1).
Techniques developed to deal with this problem typically involve hierarchal optimization, subsequent to the biomass maximization, to constrain the fluxes further. One possibility is to maximize the growth rate and then sequentially optimize each external flux using the previous optimization problem as a constraint in the current one [36,37]. This method effectively deals with the non-uniqueness problem but requires additional assumptions per external flux. These assumptions can dramatically affect the results of the simulation but seem to be a problem only when modeling multiple species [37].
An alternative method is to perform only a single secondary optimization subsequent to the biomass maximization, in the hope that this constrains the fluxes sufficiently to ameliorate the non-uniqueness issue when performing the integration of Equation (1). An example of this approach is to minimize the absolute fluxes, based on the principle of maximum enzyme efficiency [38]. The drawback with this approach is that it requires the solution of a quadratic program (QP) at each time step. For larger models, this can be computationally expensive.
We chose to keep the imposition of additional assumptions on the modeled systems to a minimum because the work is exploratory in nature. Therefore, we combine aspects of [37] with the single secondary optimization approach. In our case, the secondary optimization seeks to ensure that the derivative change of each modeled flux is minimized between each time step. The rationale for this is that over small time steps the flux is unlikely to jump suddenly. Therefore, at each time step, the following procedure is followed:
  • The flux bounds, Equation (2), are updated. Typically, Michaelis–Menten kinetics are assumed [39]. Since detailed expression for glucose and xylose uptake rates are not known for all the organisms, we assumed, for comparative fairness,
    v min , glucose = max v Glc max , G + Δ t f G produced Δ t X m glucose , v max , glucose = 0 , v min , xylose = max v Xyl max , Z + Δ t f Z produced Δ t X m xylose 1 1 + G 0.005 , v max , xylose = 0 ,
    where f G produced , f Z produced are the fluxes of glucose and xylose produced by the extracellular enzymes, G, Z are the current concentrations of glucose and xylose, and m glucose , m xylose are the respective molar masses. The glucose inhibition term ensures that glucose is preferentially metabolized before xylose [32]. The maximum flux constants, v Glc max and v Xyl max , were taken from literature and are supplied in Section 2.5. See the Supplement for motivation of the derivation of Equation (3).
  • A linear program feasibility problem,
    min s 1 , s 2     i = 1 N s 1 , i + s 2 , i ( where N is the number of fluxes ) , s . t . S v + s 1 s 2 = b ( where b is typically the zero vector in this context ) , v min v v max , 0 s 1 , i , s 2 , i i 1 , , N ,
    is solved to ensure that the genome-scale model is feasible for steps 3 and 4. This problem is solved for the “relaxation variables” s 1 and s 2 (see [36] for justification).
  • A standard FBA linear program (LP) is solved to determine the optimal growth rate of the organism given the constraints of step 1. This problem,
    max v     μ ( v ) , s . t . S v + s 1 s 2 = b , v min v v max ,
    is solved for the unique optimal growth rate μ * . Given μ * from Equation (5), it is possible to solve for the organism biomass concentration by using d X d t = μ * X for at least one time step into the future.
  • A secondary LP,
    min v     i γ i for i M , s . t . S v + s 1 s 2 = b , v min v v max , μ ( v ) = μ * , γ i 1 v t 1 , i v t 1 , i v t 2 , i v t , i v t 1 , i v t 2 , i γ i for i M ,
    is solved to ensure that the resultant fluxes used to integrate Equation (1) are sufficiently smooth. Here, M is the index set of all modeled substrates and products. A full derivation of Equation (6) is given in the Supplement. Briefly, the objective function asserts that i 1 d v i d t t / d v i d t t 1 i M is minimized, where the flux derivative at time t, d v i d t t , is approximated to first order.
  • Using an integration scheme of choice, e.g., backward Euler, the full dynamic profile of the system may be iteratively simulated. If products are being generated at each time step, Equation (1) needs to include those fluxes as well.
The primary benefit of Equation (6) is that there is only a single secondary LP imposed on the system. From a computational point of view, this is very desirable compared to the other existing algorithms that solve either a QP or multiple sequential LPs.

2.5. Simulation Parameters

All simulations restricted the oxygen flux into the system to zero. It was assumed that the gas produced by the fungi is 90% carbon dioxide and 10% hydrogen on a mole basis. This is in line with previous experimental observations. The maximum glucose and xylose uptake flux constraints, shown in Equation (3), were taken from the papers introducing the models (see Table 1 for the references). These are summarized in Table 2.
Note that M. barkeri does not consume glucose or xylose. Instead, it autotrophically metabolizes hydrogen and carbon dioxide into methane. The maximum hydrogen uptake rate was set at v H 2 = 41.5 mmol g DW h , and the maximum carbon dioxide uptake rate was unbounded [25]. All products P produced by the fungi, e.g., sugar and gas (in the form of pressure accumulation) were assumed to follow the logistic function,
P ( t ) = k 1 1 + e k 2 t k 3 ,
where the constants were fit to experimental data. Henry’s law was used to model the concentration of dissolved gases (hydrogen, carbon dioxide and methane) in the liquid fraction given the gas pressure. A backward Euler scheme was used to integrate Equation (1) with a time step of 0.1 h. The initial conditions for all the substrates and products consumed and produced by the partner microbes were assumed to be zero. The initial biomass concentration was assumed to be 1 mg/L.

3. Results and Discussion

Both experimental and computational data were gathered to evaluate the organisms listed in Table 1 for their ability to form stable consortia with anaerobic gut fungi. Batch growth experiments were used to model the rate of sugar release from the raw plant biomass during fungal digestion, as well as the gas accumulation profile. This sheds light on the ability of the fungi to accommodate another organism, likely through nutritional linkage of primary metabolites. Computational experiments were then used to predict growth rates and waste generation of a model partner microbe, given the excess fermentable products determined via the batch experiments.

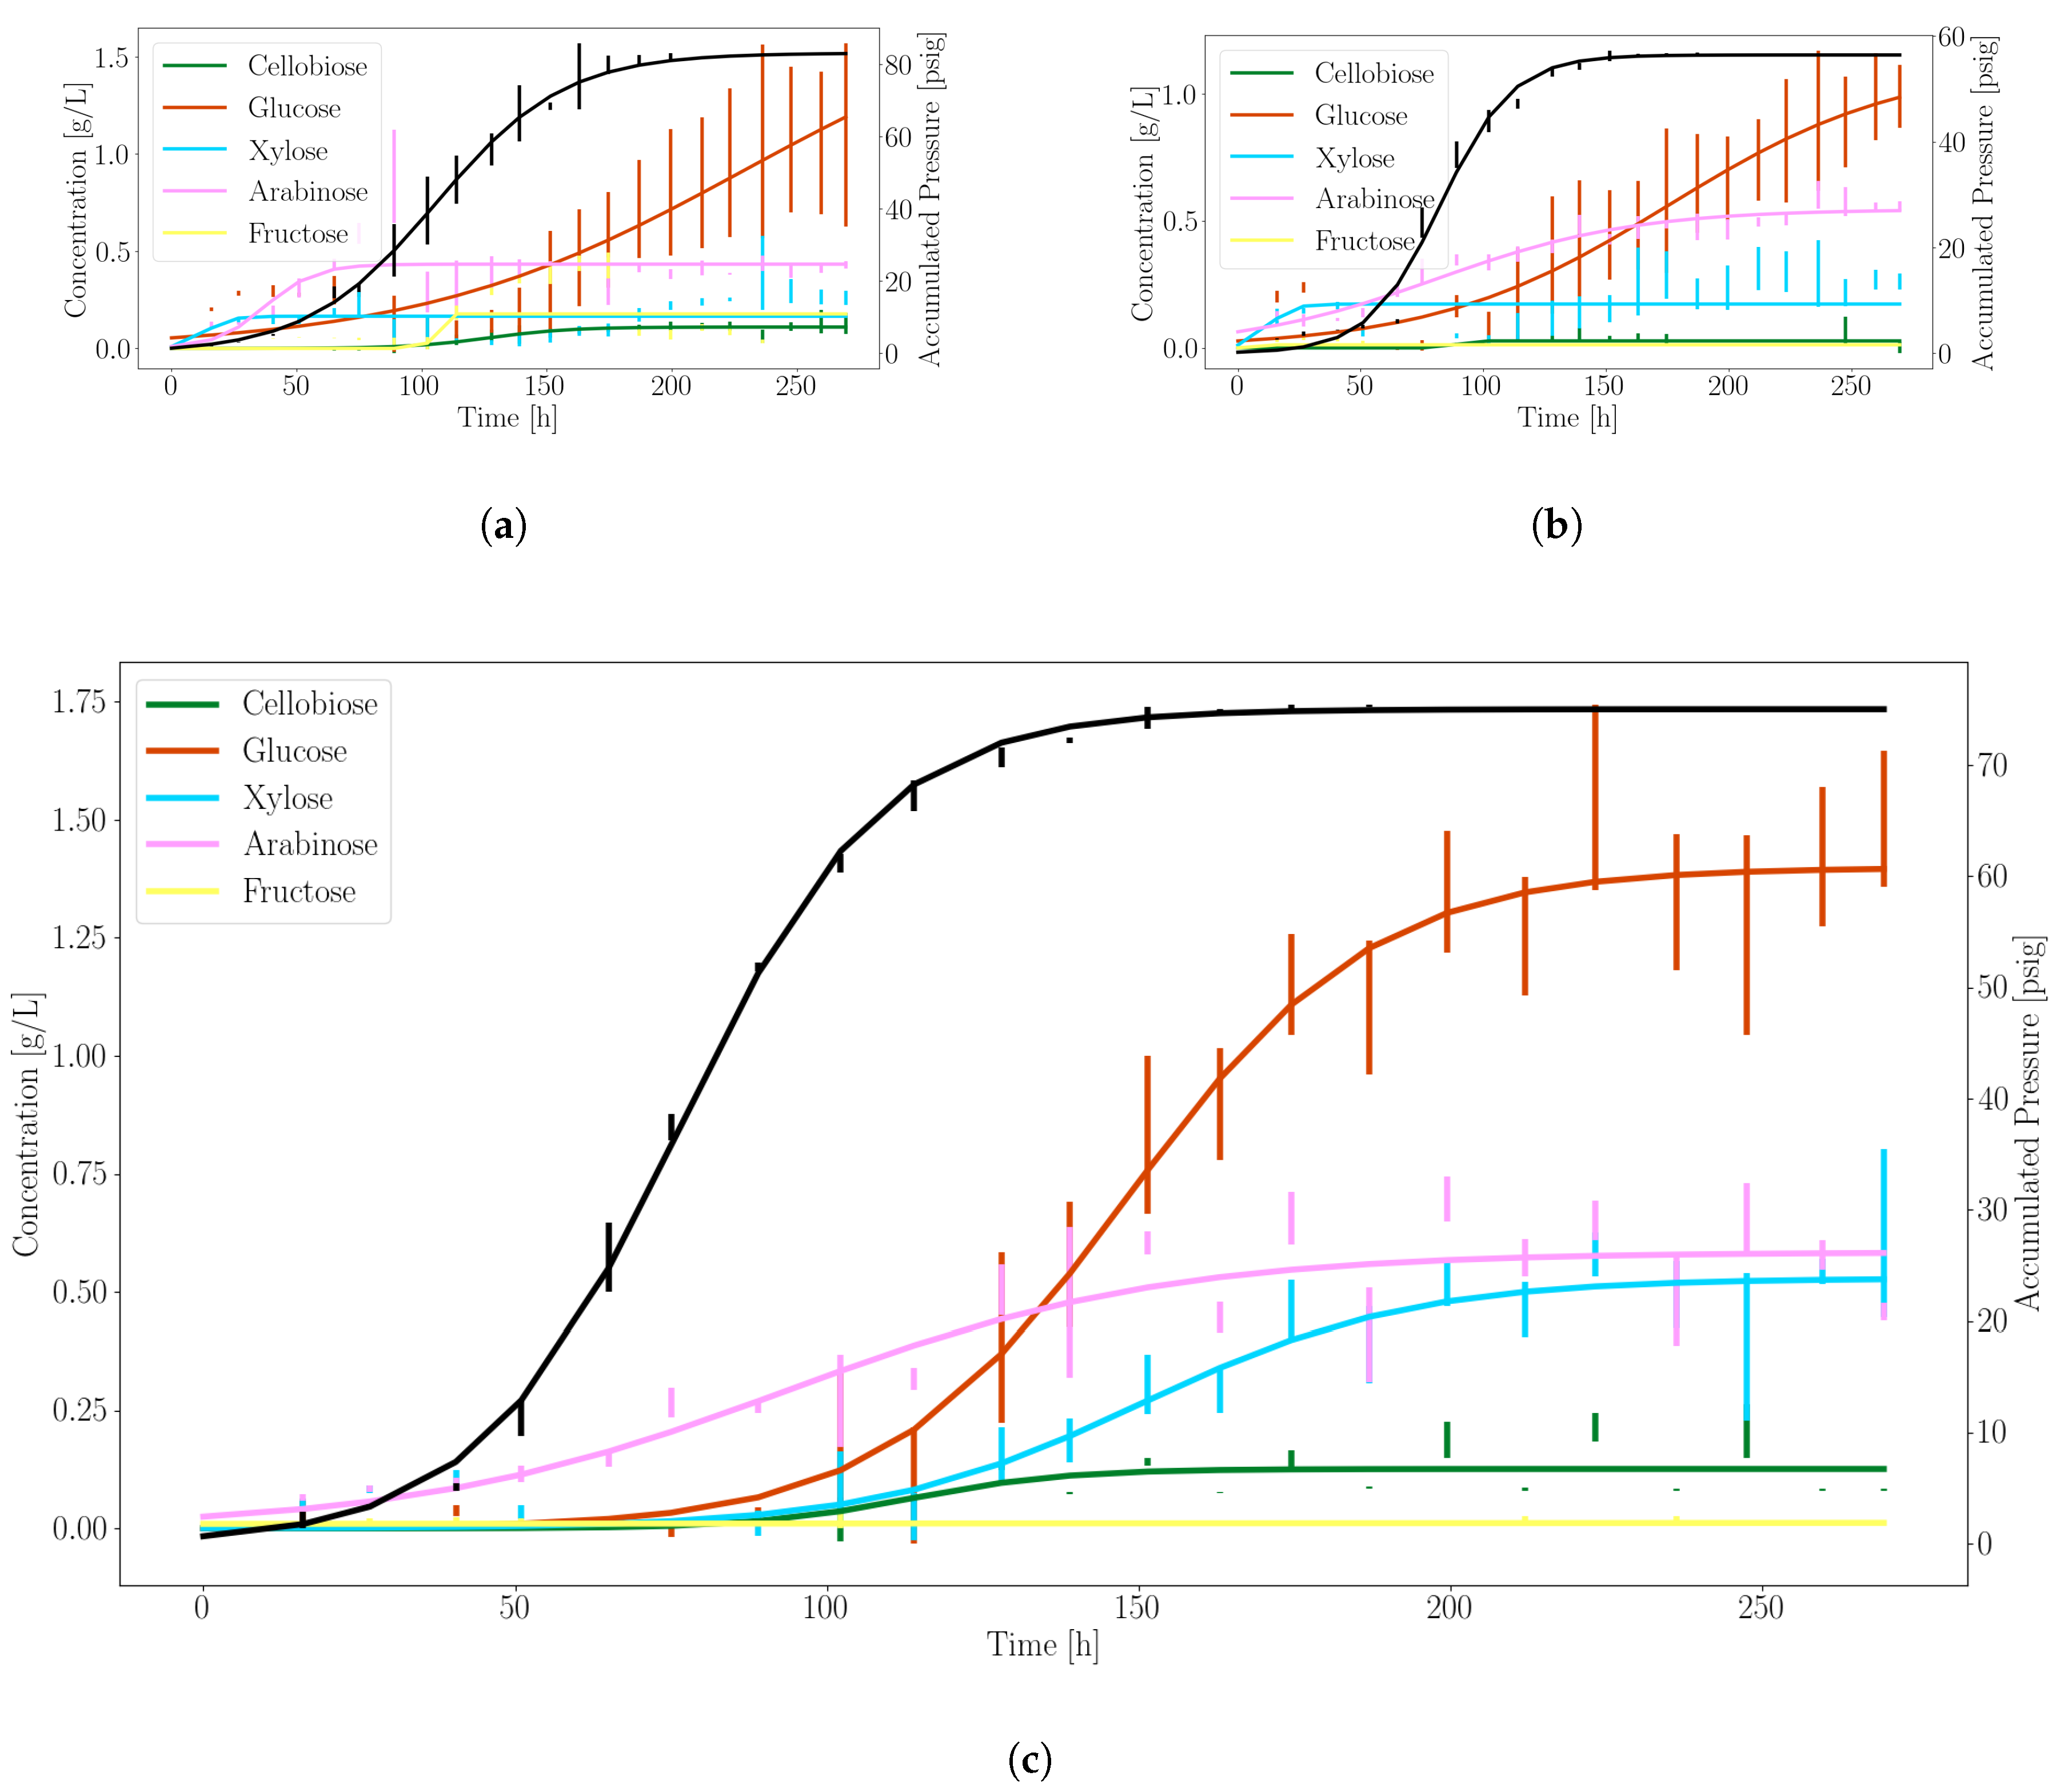
3.1. Anaerobic Fungi Release an Assortment of Products to Enable Consortia Formation

Figure 1 shows the experimentally observed sugar release and gas production profiles over time of the three anaerobic fungi we investigated. It can be seen that A. robustus produced the highest concentration of soluble sugars and the next to highest accumulated pressure. In accordance with the variance between culture replicates, N. californiae displayed more erratic growth. This behavior is uncharacteristic of the fungus when cultured in complex media. We speculate that the M2 defined minimal media was a contributing factor to this phenomenon. Neocallimastix sp. S1 performed between the other two fungi in terms of stability and sugar/gas production.
Based on these data, we selected A. robustus as the best candidate for consortia experiments that combine anaerobic fungi with model microbes due to the more stable sugar and gas production rates. Constants used to model substrate production rates for glucose, xylose and pressure accumulation were fit to Equation (7) using A. robustus data, as shown in Table 3.
For completeness, we compare the measured gut fungal net specific growth rates found in M2 defined media, used here, with that of complex media (see Table 4). Predictably, the growth rates are lower in minimal defined media. A. robustus consistently outperforms the other fungi when grown on corn stover. The superior growth characteristics of A. robustus further motivate its selection as the gut fungus to investigate in greater depth.

3.2. Dynamic Simulations Predict Consortia Partner Feasibility

By making use of the dFBA algorithm introduced in Section 2.4, and using the experimental data of A. robustus to fit Equation (7) for both glucose and xylose separately, we can simulate the growth of the co-cultured partner organisms listed in Table 1 dynamically. We chose to focus only on glucose and xylose utilization at this stage of modeling because more is known about the relative preference of each sugar in microbial metabolism [40]. The two classes, fermentable sugar consuming heterotrophs, and hydrogen/carbon dioxide consuming autotrophs, of possible consortia partners were treated separately.

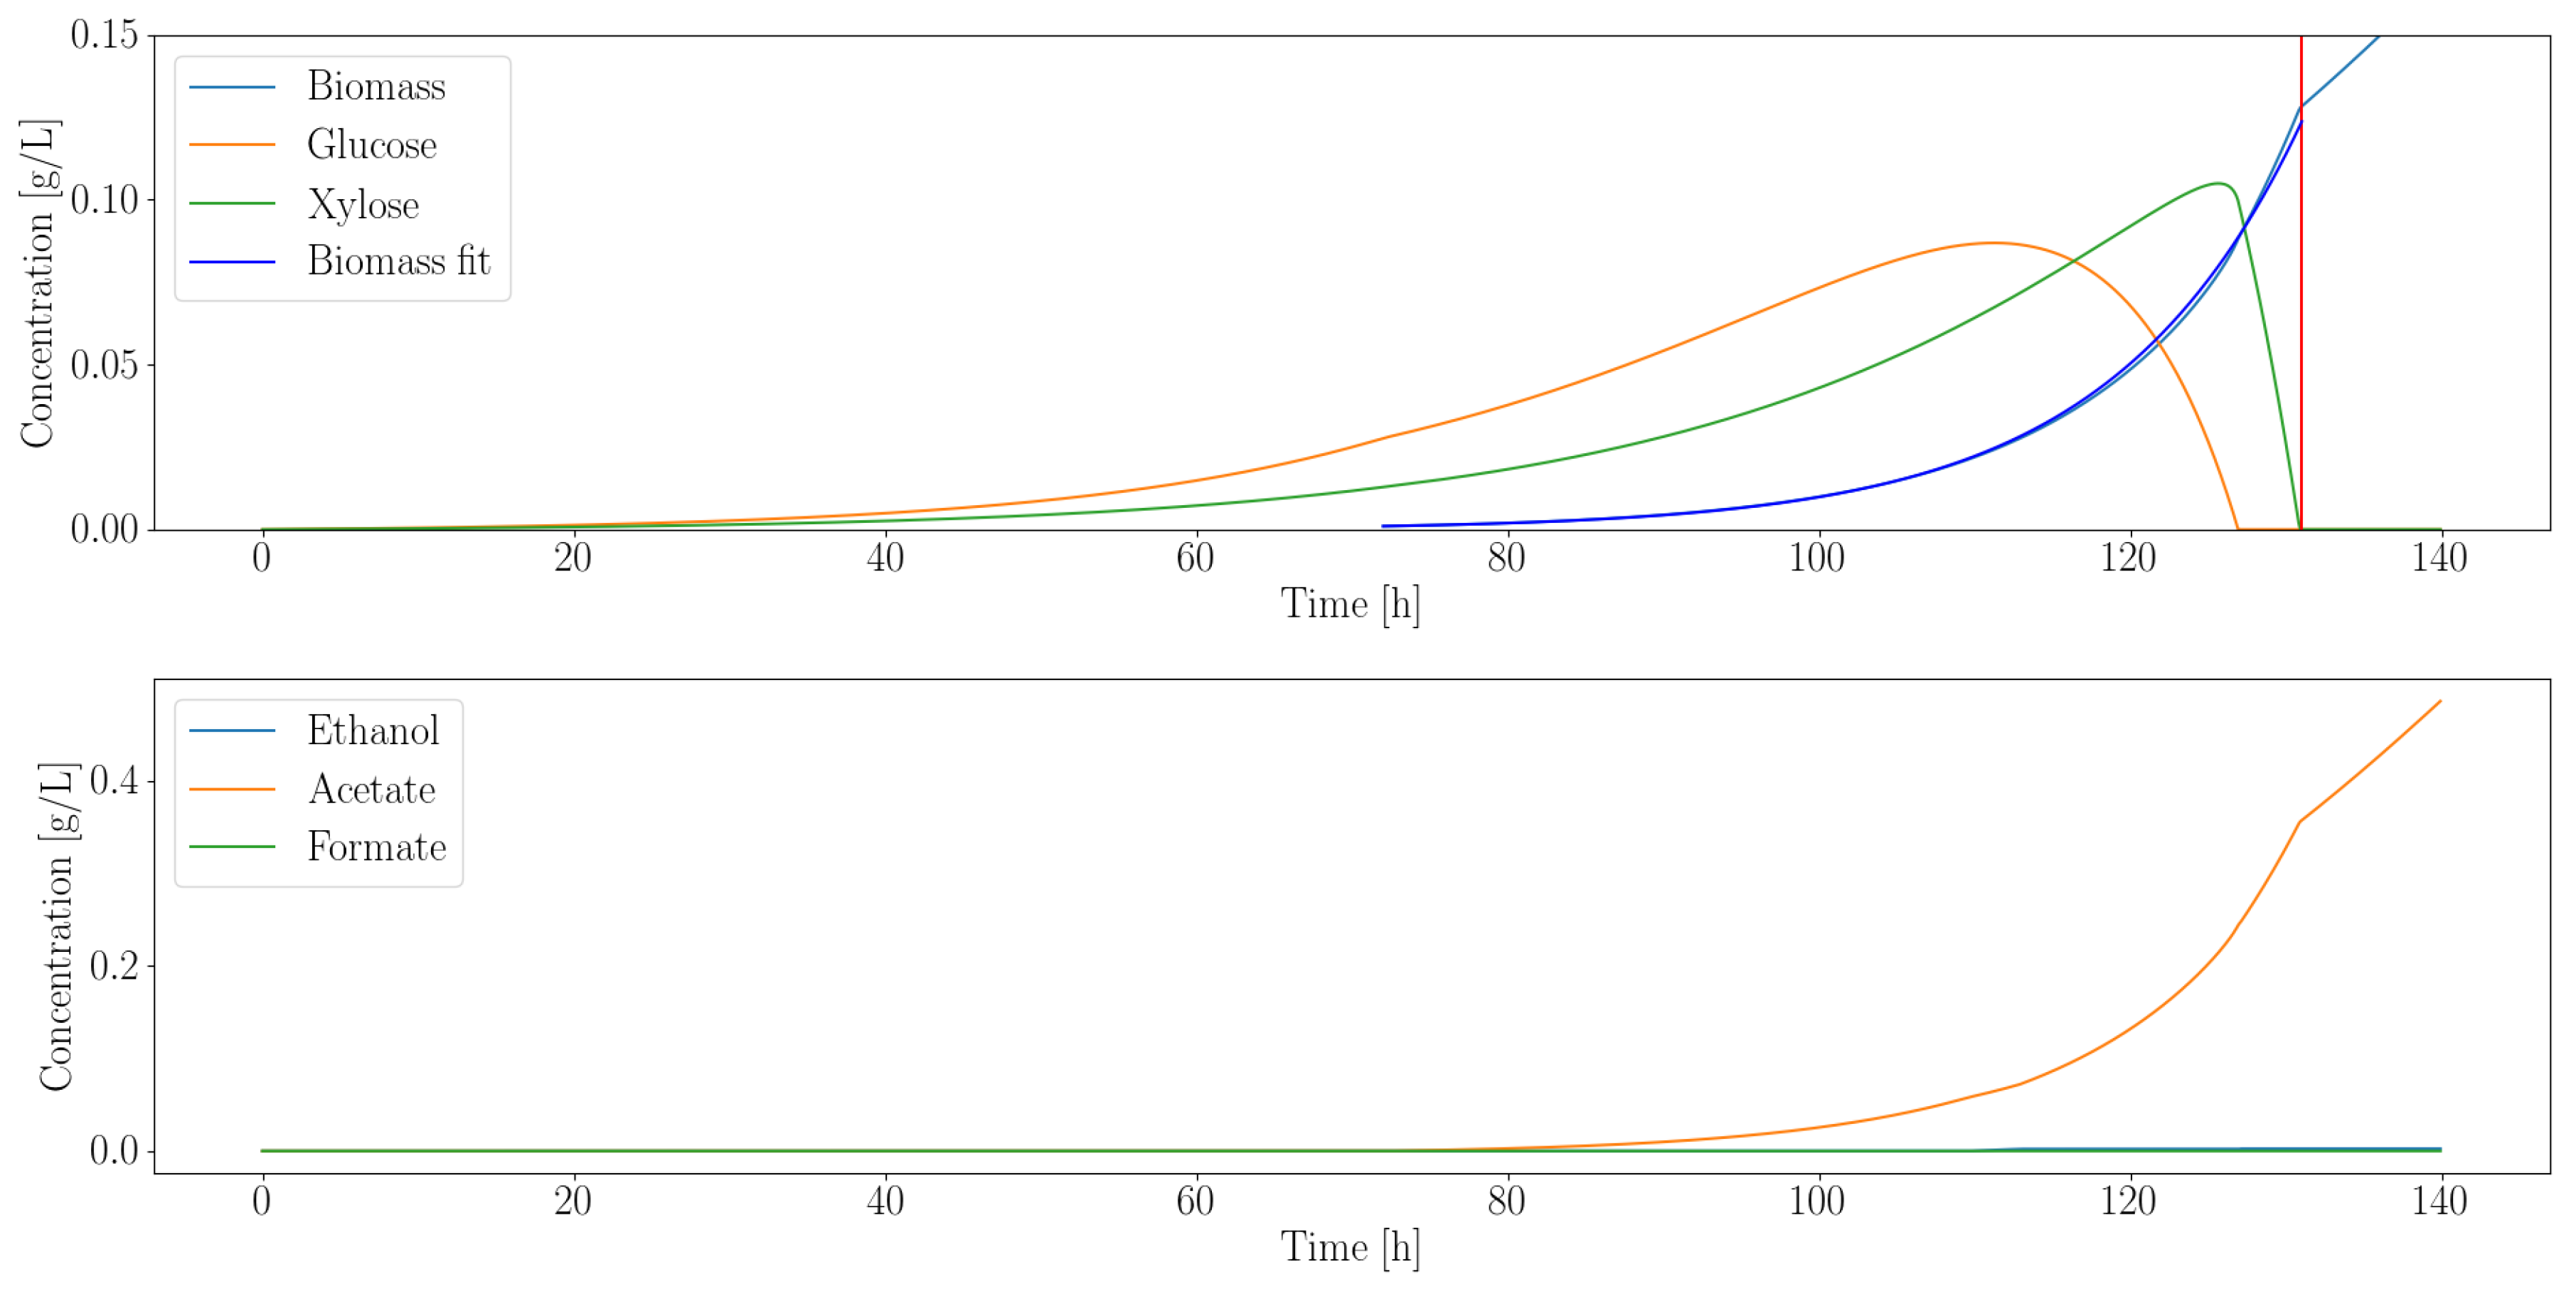
3.2.1. Heterotroph Partnership with Anaerobic Fungi

As suggested by Equation (3), we assumed, for simplicity, that only glucose and xylose are capable of being fermented by each organism under analysis. Furthermore, we assumed that glucose would be consumed preferentially to xylose whenever possible. Figure 2 illustrates the output of the dFBA algorithm when pairing the anaerobic bacterium C. ljungdahlii with the gut fungus A. robustus. Similar results are available for the other organisms of Table 1 in the Supplement.
C. ljungdahlii can metabolize both glucose and xylose; this is reflected in the sequential utilization of the substrates in the simulated time course. To determine the effective average growth rate, we fit d X d t = e μ t to the simulated biomass output. The fit indicated that μ 0.08 1/h. The growth rate is the primary criterion we used to determine suitability for consortia with the gut fungi. We hypothesized that an optimal pairing would occur if the growth rates of the organisms are similar. This would reduce the risk of them out-competing each other. Inter-cellular communication, another pivotal component of consortia, is neglected at this stage of analysis, as it requires detailed experimental data to model.
Each modeled organism is also capable of producing metabolic by-products, e.g., ethanol, acetate and formate, that are known to inhibit microbial growth. We also recorded the final concentration of each compound as a secondary criteria to ascertain compatibility with the fungi. The summarized characteristics of each organism, simulated to pair with A. robustus, are shown in Table 5.
The models predicted that both S. cerevisiae and E. coli MG1655 have a significantly higher growth rate than A. robustus. This suggests that maintaining population stability could be difficult for these co-cultures if paired with anaerobic fungi [41]. While L. lactis has a comparable growth rate to A. robustus, it is unable to metabolize xylose; therefore, it would directly compete for glucose. Additionally, L. lactis produces a wide spectrum of metabolic by-products (ethanol, acetate and formate) at relatively high concentrations; this lessens its attractiveness as a consortia partner. The glucose deficient E. coli strain ZSC113 also has a comparable growth rate but produces less metabolic waste products. Additionally, it is genetically amenable to engineering [42]—this suggests that it could be a favorable organism for consortia formation. Finally, C. ljungdahlii is also a competitive choice for consortia. While its growth rate is higher than A. robustus, it is not in the range of S. cerevisiae and E. coli MG1655. C. ljungdahlii can ferment a wide range of sugars as well as autotrophically consume hydrogen (not modeled); this suggests that the organism can take full advantage of the fungal products. Recently, genetic engineering tools have become available for C. ljungdahlii, further increasing its viability as a consortia partner.

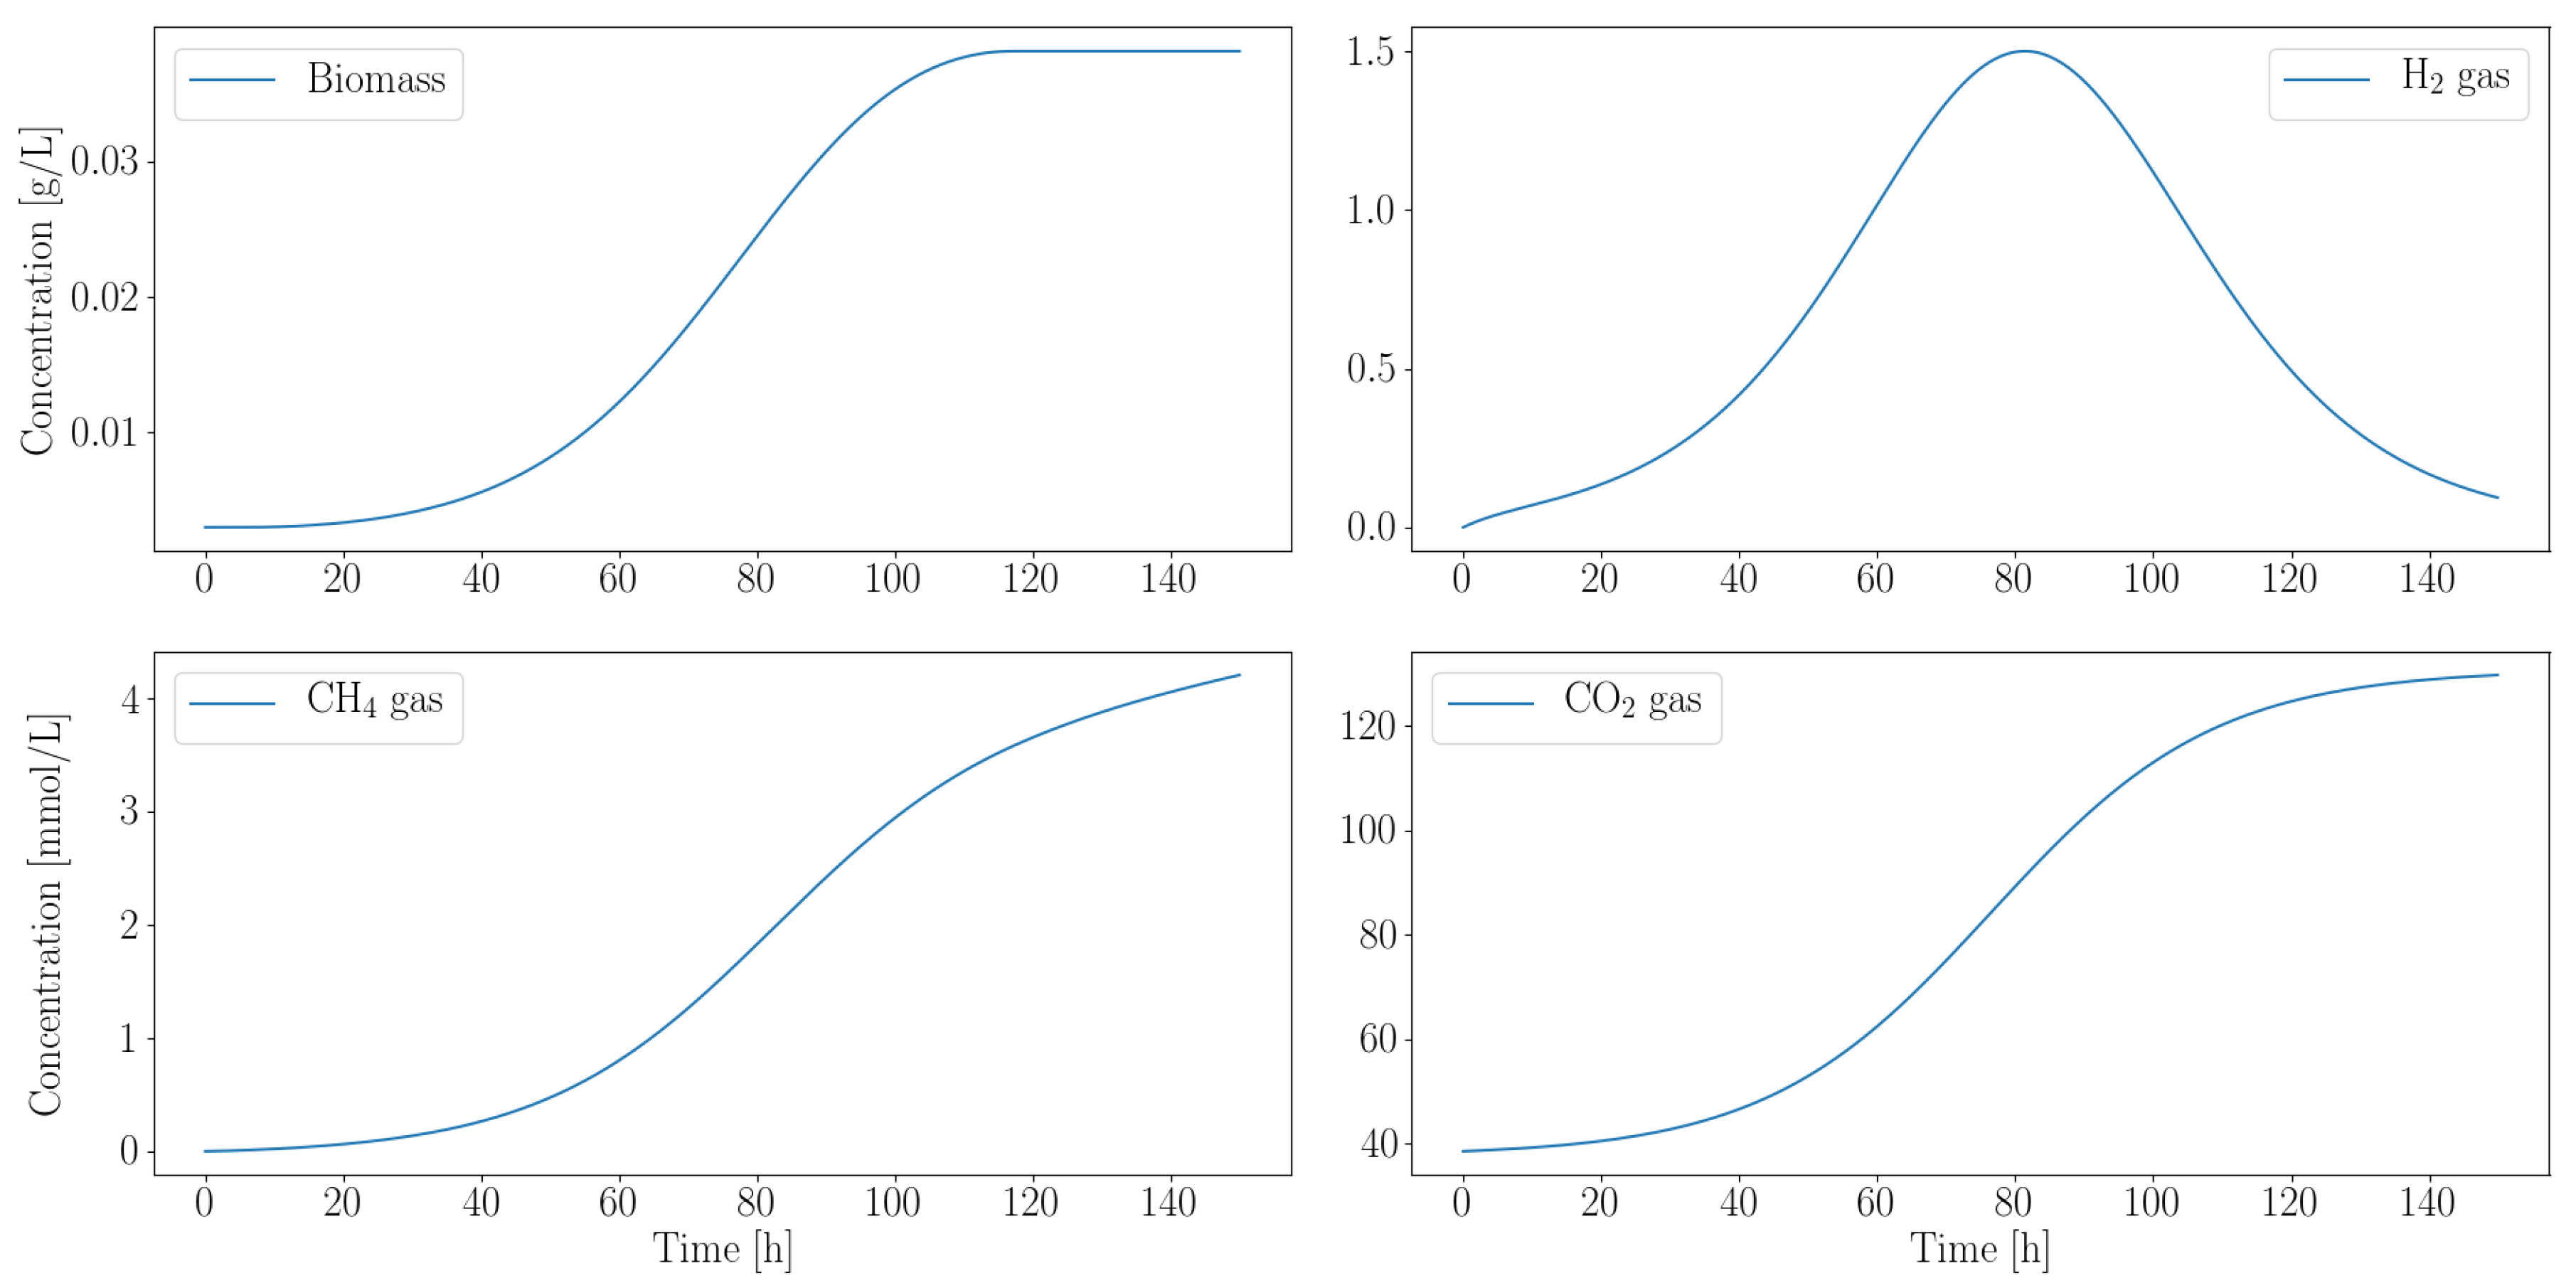
3.2.2. Autotroph Partnership with Anaerobic Fungi

While the organisms shown in Section 3.2.1 utilized the fermentable sugars released by the gut fungal enzymes as their carbon source (or preferred carbon source in the case of C. ljungdahlii), M. barkeri, a methanogen, metabolizes carbon dioxide and hydrogen. It is well known that methanogens are natural consortia partners of gut fungi due to their symbiotic relationship [43]. Methanogens consume the hydrogen gas, a likely growth inhibitor, produced by an intracellular organelle of the fungi called the hydrogenosome [44]. Furthermore, it has been shown that methanogens co-cultured with gut fungi significantly increase their cellulolytic efficiency [45].
Figure 3 illustrates the simulated growth profile of M. barkeri. Negligible quantities of ethanol, acetate and formate are produced, while hydrogen is almost completely consumed. The effective growth rate is 0.03 1/h. Since the gas produced by the fungi drive their growth, it is not surprising that their growth rates are similar.
M. barkeri is also an attractive candidate for synthetic gut fungal consortia due to the mutualism exhibited by the pairing of fungi and methanogens in nature [46]. The recent development of genetic technology to manipulate Methanosarcina suggests that the pairing is also feasible for bioproduction [47]. Finally, given the low levels of by-products generated by M. barkeri, it is plausible to consider tri-cultures of A. robustus, M. barkeri and another microbe, like C. ljungdahlii. Such a system would be, theoretically, minimally negatively interactive due to the reduced substrate competition. This is a desirable property for community stability.
The benefit of using the dFBA, to screen for consortia partners, is that it is readily generalizable to higher order systems. Known interactions can easily be accounted for, and quantitative predictions of by-product generation can be used to evaluate partner suitability (cf. qualitative literature surveys). The simulation approach is particularly useful for non-model organisms, like anaerobic fungi, because growth rate predictions in their unique culture conditions are not often readily available.
Experimental validation of these predictions will take the form of community composition tracking and by-product generation monitoring. The latter technique is particularly applicable to the anaerobic fungi because it is one of the few non-invasive methods that can be used to measure growth in gut fungal systems [19]. For example, in the case of the A. robustus and M. barkeri pairing, the methane, carbon dioxide and hydrogen production over time, compared to the mono-cultures, will indicate the success of the co-culture. Similar indirect measurements could be used to validate the other predictions. However, these detailed experiments are beyond the scope of the current work.

4. Conclusions

To assess the suitability of each organism in Table 1 to form stable microbial consortia with anaerobic fungi, the identities and contributions of both the gut fungus and partner microbe need to be justified. In this work, experiments were used to select an anaerobic fungus and simulations, making the least number of assumptions, were used to screen possible consortia partners.
The experimental results of Section 3.1 indicate that A. robustus is a more desirable building block for consortia (or even mono-cultures) compared to other strains tested here—both in terms of higher growth rates on corn stover (see Table 4) as well as enzyme effectiveness at releasing fermentable sugars (see Figure 1). Barring the generation of unknown inhibitory agents, it should be prioritized for further experimentation.
M. barkeri, a methanogen, is a natural consortia partner for gut fungi [45]. This is clear from the similar growth rates to A. robustus and consumption of hydrogen, a known inhibitor of fungal growth. Additionally, it produces minimal by-products that could retard fungal growth. C. ljungdahlii and E. coli ZSC113 are also potentially suitable consortia partners. On the other hand, L. lactis, S. cerevisiae and E. coli MG1655 were all ruled out due to their by-product generation or significantly higher growth rates. We introduced a novel dFBA algorithm that is computationally efficient and that does not impose many extra assumptions on the system. Making use of computational tools, such as this, to reduce the number of costly and time-consuming experiments is a boon to developing and designing scalable synthetic biosystems [48].
Moreover, building predictive models of consortia systems can be critical to fully leveraging the inherent capabilities of micro-organisms as it allows engineers additional insight into the mechanics of these complex systems [49]. Fully unlocking the inherent capabilities of non-model organisms, like anaerobic gut fungi, will require novel tools to inexpensively generate and test hypotheses. Current consortia analysis techniques typically assume that the identities of the partner microbes are known and that they are modeled. This work provides a framework that can be used to rationally select the them even if some of the microbes are not modeled.

Supplementary Materials

The Supplement is available online at www.mdpi.com/2227-9717/6/1/7/s1. The Supplement contains additional derivations used in the formulation of our dFBA algorithm as well as additional simulation results of the other organisms listed in Table 1.

Acknowledgments

The authors gratefully acknowledge funding support from the Office of Science (BER), U.S. Department of Energy (DE-SC0010352), the Institute for Collaborative Biotechnologies through grant W911NF-09-0001 from the U.S. Army Research Office, the National Science Foundation (MCB-1553721), and the Dow Discovery Fellowship (to SW). The authors also thank John K. Henske for isolation and ITS characterization of Neocallimastix sp. S1, and Paul Weimer from the United States Department of Agriculture (USDA) for providing freshly milled biomass substrates.

Author Contributions

S.E.W., L.R.P. and M.A.O. conceived and designed the experiments; S.E.W. and M.S. performed the experiments; S.E.W. and M.S. analyzed the data; S.E.W. and L.R.P. developed the dFBA algorithm; S.E.W., L.R.P. and M.A.O. wrote the paper.

Conflicts of Interest

The authors declare no conflict of interest. The funding sponsors had no role in the design of the study; in the collection, analyses, or interpretation of data; in the writing of the manuscript, and in the decision to publish the results.

References

  1. Otero, J.M.; Nielsen, J. Industrial systems biology. Biotechnol. Bioeng. 2010, 105, 439–460. [Google Scholar] [CrossRef] [PubMed]
  2. Saini, J.K.; Saini, R.; Tewari, L. Lignocellulosic agriculture wastes as biomass feedstocks for second-generation bioethanol production: Concepts and recent developments. 3 Biotech 2015, 5, 337–353. [Google Scholar] [CrossRef] [PubMed]
  3. Liao, J.C.; Mi, L.; Pontrelli, S.; Luo, S. Fuelling the future: Microbial engineering for the production of sustainable biofuels. Nat. Rev. Microbiol. 2016, 14, 288–304. [Google Scholar] [CrossRef] [PubMed]
  4. Sindhu, R.; Binod, P.; Pandey, A. Biological pretreatment of lignocellulosic biomass—An overview. Bioresour. Technol. 2016, 199, 76–82. [Google Scholar] [CrossRef] [PubMed]
  5. Alper, H.; Stephanopoulos, G. Engineering for biofuels: Exploiting innate microbial capacity or importing biosynthetic potential? Nat. Rev. Microbiol. 2009, 7, 715–723. [Google Scholar] [CrossRef] [PubMed]
  6. Lynd, L.R.; Van Zyl, W.H.; McBride, J.E.; Laser, M. Consolidated bioprocessing of cellulosic biomass: An update. Curr. Opin. Biotechnol. 2005, 16, 577–583. [Google Scholar] [CrossRef] [PubMed]
  7. Brenner, K.; You, L.; Arnold, F.H. Engineering microbial consortia: A new frontier in synthetic biology. Trends Biotechnol. 2008, 26, 483–489. [Google Scholar] [CrossRef] [PubMed]
  8. Paloheimo, M.; Haarmann, T.; Mäkinen, S.; Vehmaanperä, J. Production of Industrial Enzymes in Trichoderma reesei. In Gene Expression Systems in Fungi: Advancements and Applications; Schmoll, M., Dattenböck, C., Eds.; Springer International Publishing: Cham, Switzerland, 2016; pp. 23–57. [Google Scholar]
  9. Minty, J.J.; Singer, M.E.; Scholz, S.A.; Bae, C.H.; Ahn, J.H.; Foster, C.E.; Liao, J.C.; Lin, X.N. Design and characterization of synthetic fungal-bacterial consortia for direct production of isobutanol from cellulosic biomass. Proc. Natl. Acad. Sci. USA 2013, 110, 14592–14597. [Google Scholar] [CrossRef] [PubMed]
  10. Martinez, D.; Berka, R.M.; Henrissat, B.; Saloheimo, M.; Arvas, M.; Baker, S.E.; Chapman, J.; Chertkov, O.; Coutinho, P.M.; Cullen, D.; et al. Genome sequencing and analysis of the biomass-degrading fungus Trichoderma reesei (syn. Hypocrea jecorina). Nat. Biotechnol. 2008, 26, 553–560. [Google Scholar] [CrossRef] [PubMed]
  11. Seppälä, S.; Elmo Wilken, S.; Knop, D.; Solomon, K.V.; O’Malley, M.A. The importance of sourcing enzymes from non-conventional fungi for metabolic engineering & biomass breakdown. Metab. Eng. 2017, 44, 45–59. [Google Scholar] [PubMed]
  12. Resch, M.G.; Donohoe, B.S.; Baker, J.O.; Decker, S.R.; Bayer, E.A.; Beckham, G.T.; Himmel, M.E. Fungal cellulases and complexed cellulosomal enzymes exhibit synergistic mechanisms in cellulose deconstruction. Energy Environ. Sci. 2013, 6, 1858–1867. [Google Scholar] [CrossRef]
  13. Solomon, K.V.; Haitjema, C.H.; Henske, J.K.; Gilmore, S.P.; Borges-Rivera, D.; Lipzen, A.; Brewer, H.M.; Purvine, S.O.; Wright, A.T.; Theodorou, M.K.; et al. Early-branching gut fungi possess a large, comprehensive array of biomass-degrading enzymes. Science 2016, 1431, 1192–1195. [Google Scholar] [CrossRef] [PubMed] [Green Version]
  14. Gruninger, R.J.; Puniya, A.K.; Callaghan, T.M.; Edwards, J.E.; Youssef, N.; Dagar, S.S.; Fliegerova, K.; Griffith, G.W.; Forster, R.; Tsang, A.; et al. Anaerobic fungi (phylum Neocallimastigomycota): Advances in understanding their taxonomy, life cycle, ecology, role and biotechnological potential. FEMS Microbiol. Ecol. 2014, 90, 1–17. [Google Scholar] [CrossRef] [PubMed]
  15. Henske, J.K.; Wilken, S.E.; Solomon, K.V.; Smallwood, C.R.; Shutthanandan, V.; Evans, J.E.; Theodorou, M.K.; O’Malley, M.A. Metabolic characterization of anaerobic fungi provides a path forward for two-stage bioprocessing of crude lignocellulose. Biotechnol. Bioeng. 2017. [Google Scholar] [CrossRef]
  16. Senger, R.S.; Yen, J.Y.; Fong, S.S. A review of genome-scale metabolic flux modeling of anaerobiosis in biotechnology. Curr. Opin. Chem. Eng. 2014, 6, 33–42. [Google Scholar] [CrossRef]
  17. Theodorou, M.K.; Brookman, J.L.; Trinci, A.P. Anaerobic fungi. In Methods in Gut Microbial Ecology for Ruminants, 1st ed.; Makkar, H.P., McSweeney, C.S., Eds.; Springer: Dordrecht, The Netherlands, 2005; Chapter 2.4; pp. 55–67. [Google Scholar]
  18. Teunissen, M.J.; Op den Camp, H.J.M.; Orpin, C.G.; Huis in ’t Veld, J.H.J.; Vogels, G.D. Comparison of growth characteristics of anaerobic fungi isolated from ruminant and non-ruminant herbivores during cultivation in a defined medium. J. Gen. Microbiol. 1991, 137, 1401–1408. [Google Scholar] [CrossRef] [PubMed]
  19. Theodorou, M.K.; Davies, D.R.; Nielsen, B.B.; Lawrence, M.I.; Trinci, A.P. Determination of growth of anaerobic fungi on soluble and cellulosic substrates using a pressure transducer. Microbiology 1995, 141, 671–678. [Google Scholar] [CrossRef]
  20. King, Z.A.; Lu, J.; Dräger, A.; Miller, P.; Federowicz, S.; Lerman, J.A.; Ebrahim, A.; Palsson, B.O.; Lewis, N.E. BiGG Models: A platform for integrating, standardizing and sharing genome-scale models. Nucleic Acids Res. 2016, 44, D515–D522. [Google Scholar] [CrossRef] [PubMed]
  21. Nagarajan, H.; Sahin, M.; Nogales, J.; Latif, H.; Lovley, D.R.; Ebrahim, A.; Zengler, K. Characterizing acetogenic metabolism using a genome-scale metabolic reconstruction of Clostridium ljungdahlii. Microb. Cell Fact. 2013, 12, 118. [Google Scholar] [CrossRef] [PubMed]
  22. Monk, J.M.; Lloyd, C.J.; Brunk, E.; Mih, N.; Sastry, A.; King, Z.; Takeuchi, R.; Nomura, W.; Zhang, Z.; Mori, H.; et al. iML1515, a knowledgebase that computes Escherichia coli traits. Nat. Biotechnol. 2017, 35, 904–908. [Google Scholar] [CrossRef] [PubMed]
  23. Curtis, S.J.; Epstein, W. Phosphorylation of D-glucose in Escherichia coli mutants defective in glucosephosphotransferase, mannosephosphotransferase, and glucokinase. J. Bacteriol. 1975, 122, 1189–1199. [Google Scholar] [PubMed]
  24. Flahaut, N.A.; Wiersma, A.; van de Bunt, B.; Martens, D.E.; Schaap, P.J.; Sijtsma, L.; Dos Santos, V.A.; De Vos, W.M. Genome-scale metabolic model for Lactococcus lactis MG1363 and its application to the analysis of flavor formation. Appl. Microbiol. Biotechnol. 2013, 97, 8729–8739. [Google Scholar] [CrossRef] [PubMed]
  25. Feist, A.M.; Scholten, J.C.; Palsson, B.; Brockman, F.J.; Ideker, T. Modeling methanogenesis with a genome-scale metabolic reconstruction of Methanosarcina barkeri. Mol. Syst. Biol. 2006, 2, 1–14. [Google Scholar] [CrossRef] [PubMed]
  26. Mo, M.L.; Palsson, B.Ø.; Herrgård, M.J. Connecting extracellular metabolomic measurements to intracellular flux states in yeast. BMC Syst. Biol. 2009, 3, 37. [Google Scholar] [CrossRef] [PubMed]
  27. Orth, J.D.; Thiele, I.; Palsson, B.Ø. What is flux balance analysis? Nat. Comput. Biol. 2010, 28, 245–248. [Google Scholar] [CrossRef] [PubMed]
  28. Varma, A.; Palsson, B.O.; Varma, A.; Palsson, B.O. Stoichiometric Flux Balance Models Quantitatively Predict Growth and Metabolic By-Product Secretion in Wild-Type Escherichia coli W3110. Appl. Environ. Microbiol. 1994, 60, 3724–3731. [Google Scholar] [PubMed]
  29. Henson, M.A.; Hanly, T.J. Dynamic flux balance analysis for synthetic microbial communities. IET Syst. Biol. 2013, 8, 214–229. [Google Scholar] [CrossRef] [PubMed]
  30. Henson, J.L.; Hjersted, M.A. Steady-state and dynamic flux balance analysis of ethanol production by Saccharomyces cerevisiae. IET Syst. Biol. 2009, 3, 167–179. [Google Scholar]
  31. Mahadevan, R.; Edwards, J.S.; Doyle, F.J. Dynamic Flux Balance Analysis of Diauxic Growth in Escherichia coli. Biophys. J. 2002, 83, 1331–1340. [Google Scholar] [CrossRef]
  32. Hanly, T.J.; Henson, M.A. Dynamic flux balance modeling of microbial co-cultures for efficient batch fermentation of glucose and xylose mixtures. Biotechnol. Bioeng. 2011, 108, 376–385. [Google Scholar] [CrossRef] [PubMed]
  33. Hanly, T.J.; Urello, M.; Henson, M.A. Dynamic flux balance modeling of S. cerevisiae and E. coli co-cultures for efficient consumption of glucose/xylose mixtures. Appl. Microbiol. Biotechnol. 2012, 93, 2529–2541. [Google Scholar] [CrossRef] [PubMed]
  34. Mahadevan, R.; Schilling, C.H. The effects of alternate optimal solutions in constraint-based genome-scale metabolic models. Metab. Eng. 2003, 5, 264–276. [Google Scholar] [CrossRef] [PubMed]
  35. Saa, P.; Nielsen, L.K. ll-ACHRB: A scalable algorithm for sampling the feasible solution space of metabolic networks. Bioinformatics 2016, 32, 2330–2337. [Google Scholar] [CrossRef] [PubMed]
  36. Hoffner, K.; Harwood, S.M.; Barton, P.I. A Reliable Simulator for Dynamic Flux Balance Analysis. Biotechnol. Bioeng. 2013, 110, 792–802. [Google Scholar] [CrossRef] [PubMed]
  37. Gomez, J.A.; Höffner, K.; Barton, P.I. DFBAlab: A fast and reliable MATLAB code for dynamic flux balance analysis. BMC Bioinform. 2014, 15, 409. [Google Scholar] [CrossRef] [PubMed]
  38. Sánchez, B.J.; Pérez-Correa, J.R.; Agosin, E. Construction of robust dynamic genome-scale metabolic model structures of Saccharomyces cerevisiae through iterative re-parameterization. Metab. Eng. 2014, 25, 159–173. [Google Scholar] [CrossRef] [PubMed]
  39. Hanly, T.J.; Henson, M.A. Unstructured modeling of a synthetic microbial consortium for consolidated production of ethanol. IFAC Proc. Vol. 2013, 12, 157–162. [Google Scholar] [CrossRef]
  40. Eiteman, M.A.; Lee, S.A.; Altman, E. A co-fermentation strategy to consume sugar mixtures effectively. J. Biol. Eng. 2008, 2, 3. [Google Scholar] [CrossRef] [PubMed]
  41. Goers, L.; Freemont, P.; Polizzi, K.M. Co-culture systems and technologies: Taking synthetic biology to the next level. J. R. Soc. Interface 2014, 11. [Google Scholar] [CrossRef] [PubMed]
  42. Bokinsky, G.; Peralta-Yahya, P.P.; George, A.; Holmes, B.M.; Steen, E.J.; Dietrich, J.; Soon Lee, T.; Tullman-Ercek, D.; Voigt, C.A.; Simmons, B.A.; et al. Synthesis of three advanced biofuels from ionic liquid-pretreated switchgrass using engineered Escherichia coli. Proc. Natl. Acad. Sci. USA 2011, 108, 19949–19954. [Google Scholar] [CrossRef] [PubMed]
  43. Haitjema, C.H.; Solomon, K.V.; Henske, J.K.; Theodorou, M.K.; O’Malley, M.A. Anaerobic gut fungi: Advances in isolation, culture, and cellulolytic enzyme discovery for biofuel production. Biotechnol. Bioeng. 2014, 111, 1471–1482. [Google Scholar] [CrossRef] [PubMed]
  44. Müller, M. Review article: The hydrogenosome. J. Gen. Microbiol. 1993, 139, 2879–2889. [Google Scholar] [CrossRef] [PubMed]
  45. Marvin-Sikkema, F.D.; Pedro Gomes, T.M.; Grivet, J.P.; Gottsehal, J.C.; Prins, R.A. Characterization of hydrogenosomes and their role in glucose metabolism of Neocallimastix sp. L2. Arch. Microbiol. 1993, 160, 388–396. [Google Scholar] [CrossRef] [PubMed]
  46. Peng, X.N.; Gilmore, S.P.; O’Malley, M.A. Microbial communities for bioprocessing: Lessons learned from nature. Curr. Opin. Chem. Eng. 2016, 14, 103–109. [Google Scholar] [CrossRef]
  47. Kohler, P.R.; Metcalf, W.W. Genetic manipulation of Methanosarcina spp. Front. Microbiol. 2012, 3, 1–9. [Google Scholar] [CrossRef] [PubMed]
  48. Höffner, K.; Barton, P.I. Design of microbial consortia for industrial biotechnology. Comput. Aided Chem. Eng. 2014, 34, 65–74. [Google Scholar]
  49. Mahadevan, R.; Henson, M.A. Genome-Based Modeling and Design of Metabolic Interactions in Microbial Communities. Comput. Struct. Biotechnol. J. 2012, 3, e201210008. [Google Scholar] [CrossRef] [PubMed]
Figure 1. Anaerobic gut fungi release excess sugars for microbial partnership during growth on corn stover. The solid black line denotes the profile of the accumulated pressure. Other colors represent distinct fermentable sugars generated during growth, as indicated. The vertical bars are standard deviations of errors for each triplicate measurement. (a) N. californiae; (b) Neocallimastix sp. S1; (c) A. robustus.
Processes 06 00007 g001
Figure 2. Dynamic simulation of C. ljungdahlii shows that it consumes all the excess sugars released by A. robustus. The vertical red line indicates the point where both sugars were depleted. Even though the fungal enzymes continuously release sugars, the rate at which they release them is exactly equal to the consumption rate beyond the vertical red line. Simulation artifacts cause the growth to continue linearly beyond this point. All the simulations assume an inoculation time at 72 h into the experiment. This allows the slower-growing gut fungi to establish themselves and produce fermentable products prior to the start of the co-culture.
Processes 06 00007 g002
Figure 3. Computationally predicted growth profile of M. barkeri biomass accumulation over time shows a strong dependence on the fungal metabolic by-products. Hydrogen and carbon dioxide, produced by the fungi, are consumed by the methanogen. Simultaneous inoculation is assumed because the microbes do not compete for their preferred carbon source. All gas concentrations are in mmol/L.
Processes 06 00007 g003
Table 1. Genome-scale models of potential consortia partners for the un-modeled anaerobic gut fungi used in this work.
OrganismNotesReference
Clostridium ljungdahlii str. 13528Bacterium, obligate anaerobe, acetogen[21]
Escherichia coli str. K-12 substr. MG1655Bacterium, facultative anaerobe[22]
Escherichia coli str. ZSC113Bacterium, facultative anaerobe, glucose deficient[23]
Lactococcus lactis subsp. cremoris MG1363Bacterium, facultative anaerobe[24]
Methanosarcina barkeri str. FusaroMethanogen, obligate anaerobe[25]
Saccharomyces cerevisiae S288CFungus, facultative anaerobe[26]
Table 2. Glucose and xylose maximum uptake rates.
Organism v Glc mmol g DW h v Xyl mmol g DW h
Clostridium ljungdahlii str. 1352855
Escherichia coli str. K-12 substr. MG165510.56
Escherichia coli str. ZSC11306
Lactococcus lactis subsp. cremoris MG136314.50
Methanosarcina barkeri str. Fusaro00
Saccharomyces cerevisiae S288C6.440
Table 3. Glucose, xylose and gas production rate constants fit to Equation (7) for A. robustus.
Product k 1 (g/L/h or psi/h) k 2 (1/h) k 3 (h)
Glucose1.390.05148.17
Xylose0.530.05150.41
Pressure75.040.0676.51
Table 4. Anaerobic gut fungi growth rates in defined media compared to rich media.
OrganismGrowth Rate in M2 (1/h)Growth rate in MC [15] (1/h)
N. californiae0.0290.046
A. robustus0.0330.065
Neocallimastix sp. S10.027No data
Table 5. Growth rate and end point metabolic by-product concentrations produced by each partner microbe assuming inoculation after 72 h of fungal growth. The end point concentrations are taken when the fermentable substrates were depleted for each organism.
OrganismGrowth Rate (1/h)Ethanol (g/L)Acetate (g/L)Formate (g/L)
C. ljungdahlii0.0800.350
E. coli MG16550.170.020.020.03
E. coli ZSC1130.040.010.020.03
L. lactis0.040.130.320.51
S. cerevisiae0.120.0200

