Article

Prediction of the Vanadium Content of Molten Iron in a Blast Furnace and the Optimization of Vanadium Extraction

1
College of Metallurgy and Energy, North China University of Science and Technology, Tangshan 063210, China
2
Tangshan Suyu Technology Co., Ltd., Tangshan 063000, China
3
HBIS Group Chengde Iron and Steel Company, Chengde 067102, China
*
Author to whom correspondence should be addressed.
Separations 2023, 10(10), 521; https://doi.org/10.3390/separations10100521
Submission received: 28 August 2023 / Revised: 15 September 2023 / Accepted: 18 September 2023 / Published: 25 September 2023

Abstract

:
The vanadium content of molten iron is an important economic indicator for a vanadium–titanium magnetite smelting blast furnace, and it is of great importance in blast furnace production to be able to accurately predict it and optimize the operation of vanadium extraction. Based on the historical data of a commercial blast furnace, the clean data were obtained by processing the missing data and outlier data for data mining analysis and model development. A combined wavelet-TCN model was used to predict the vanadium content of molten iron. The average Hurst index after wavelet transform was calculated to reduce the complexity of the wavelet transform layer selection and the model computation time. The results show that compared to single models, such as LSTM, LSTM with attention, and TCN, the combined model based on wavelet-TCN (a = 5) had an improvement of about 11~17% in R2, and the prediction accuracy was high and stable, which met the practical requirements of blast furnace production. The factors affecting the vanadium content of molten iron were analyzed, and the measures to increase the vanadium content were summarized. A blast furnace should avoid increasing the titanium dioxide load, increase the vanadium load appropriately, and keep the relevant operating parameters within the appropriate range in order to achieve the optimization of vanadium extraction from molten iron.

1. Introduction

The world’s vanadium–titanium magnetite reserves are huge, totaling more than 40 billion tons, and are of enormous economic and national strategic value [1,2]. Vanadium, a globally recognized strategic metal and an important industrial raw material, is used in many important fields of national industry, including iron and steel, shipbuilding, energy storage, aerospace, railways, and defense [3]. Considering the issues of scale, cost, and the environment, the results of many trials and analyses have concluded that the indirect extraction of vanadium through the blast furnace process continues to have significant advantages. The high-volume, high-efficiency blast furnace production process is the most advanced application in vanadium–titanium magnetite resource development, particularly in China. With the improvement in the concentration level and blast furnace operation technology, the blast furnace smelting process has been continuously strengthened, resulting in the world’s first vanadium–titanium magnetite blast furnace-strengthened smelting technology [4,5,6,7]. Due to the nature of vanadium–titanium magnetite itself and the technical problems of smelting vanadium, the reduction and recovery of vanadium are low, and some challenges have appeared in the research on vanadium extraction in a blast furnace [8]. On the other hand, the limitation of detection technology has resulted in the inability to achieve the stable and accurate online detection of molten iron’s index of vanadium content, and the offline detection time is too long, with a serious delay [9]. Therefore, the establishment of a model to predict the vanadium content of molten iron has positive implications for vanadium extraction in blast furnace production.
A blast furnace ironmaking system has a long process flow and a complex internal reaction mechanism. It is characterized by a large delay, strong coupling, and nonlinearity. In the complex and changing production environment of the blast furnace, the correspondence between the raw material conditions, the blast furnace operation, and the vanadium content of molten iron will vary greatly depending on the “furnace” and “time”, and it is difficult to guarantee prediction accuracy in the traditional prediction model. In recent years, there have been relatively few studies on the prediction of vanadium content of molten iron [10,11,12]. With the development of big data technology in the metallurgical industry, prediction models of silicon content, which is also an important index of molten iron quality, have emerged and guided the actual production operation of blast furnaces [13,14,15]. Combined with the challenges of blast furnaces in the field of traditional vanadium extraction, the application of big data mining technology provides a new direction for the research of vanadium extraction in vanadium–titanium blast furnaces: to establish a prediction model to accurately predict the vanadium content of molten iron and grasp the trend in vanadium content, thus providing a technical basis for the subsequent optimization of blast furnaces for highly efficient and stable vanadium extraction operation.
In view of the above comments, this study adopted a combined wavelet-TCN time series prediction model for the prediction of vanadium content in molten iron. Based on the historical data of vanadium smelting in blast furnaces, the factors affecting the vanadium content of molten iron and the optimization measures for vanadium extraction are summarized. These enable an accurate prediction of the vanadium content of molten iron and the optimization of vanadium extraction measures, providing production guidance to operators.
The main structure of the paper is as follows: Section 1 introduces the background of the study, the current research on the prediction of vanadium content of molten iron, and the structure of the paper. Section 2 introduces the methods and principles of model prediction. It provides a theoretical foundation. Section 3 is the data processing phase. It outlines the data collection and processing work, including the processing of data such as null values and outliers. In Section 4, a combined wavelet-TCN temporal prediction model is used to predict the target parameter and the results are compared with other prediction models to verify the superiority of the model. Section 5 summarizes the factors affecting the vanadium content of molten iron and the vanadium extraction measures, providing production guidance to operators. Section 6 summarizes the research carried out throughout the text and proposes ideas for future optimization.

2. Methods and Principles

A blast furnace is a production system with large hysteresis, time variance, nonlinearity, and strong coupling. It is a long flow process with continuous production based on time. Time series prediction models can automatically learn to extract features and are widely used in many fields due to their high accuracy in massive time series datasets. The quality of the data itself determines the upper limit of the model’s predictive performance. How to accurately capture the changing patterns of time series data is the key to accurate model prediction. The TCN prediction model based on wavelet transform has the advantages of higher accuracy, better performance, enhanced long-term prediction capability, and fewer learning data compared to a single prediction model for fluctuating datasets [16,17,18,19,20]. The flowchart of the combined wavelet-TCN prediction method is shown in Figure 1. Firstly, the original time series data are decomposed into several noise segments and a trend segment using the wavelet transform. Then, the decomposed sequences are predicted separately using the TCN model to obtain the prediction result of each sequence. Finally, the prediction results of each sequence are reconstructed to obtain the final prediction results.

2.1. Wavelet Transform

Discrete wavelet transform was used for data analysis. The original time series was decomposed into a low-frequency approximation set and multiple high-frequency detail sets by discrete wavelet transform using the wavelet function (high-pass filter) and scale function (low-pass filter) [21]. The discrete wavelet transform process is as follows:
The time series X n = [ X 0 , X 1 , , X n 1 ] through the impulse responses g ( n ) and h n of the wavelet and scale functions is used to obtain the first layer of decomposition: the low-frequency approximate solution X 1 , L n and the high-frequency detailed solution X 1 , H n . If further decomposition is required, the low-frequency approximate solution X 1 , L n is high-pass filtered and low-pass filtered to obtain the second layer X 2 , L n and X 2 , H n , and the previous step is repeated until the desired number of decomposition layers is reached. The high-frequency solution and low-frequency solution from the decomposition of layer a are shown in Equations (1) and (2).
X a , L n = n X a 1 , L n g 2 k n
X a , H n = n x a 1 , L n h 2 k n
where a = 1, 2, …, N − 1; k = 0, 1, …, N − 1; N is the number of time series; L denotes the low-frequency filtering result; and H denotes the high-frequency filtering result.
The impulse responses g ( n ) and h n of the wavelet and scale functions are not independent. They have the relationship of Equation (3), where L is the filter length. It can be seen that the two impulses with odd indices of each other alternate inversely and in orthogonal bases, which makes it easy to reconstruct the sequence. For layer a, the reconstruction formula is shown in Equation (4).
g l 1 n = 1 n h n
X a n = n X a + 1 , L n g 2 k n + n X a + 1 , L n h 2 k n + n X a , H n
The original time series X ( n ) undergoes discrete wavelet transform, as shown in Figure 2, and according to Equations (3) and (4), the reconstruction formula of X ( n ) is shown in Equation (5).
X n = a X a , H n + X a , L n

2.2. Temporal Convolutional Networks

TCN contains three components in addition to the underlying 1D fully convolutional network: causal convolution, dilated convolution, and residual connection.

2.2.1. Causal Convolution

TCN follows the principle that the output length of the network is the same as the input length. Future data cannot be input into the network together with past data, which will lead to the leakage of future data into the past data. To ensure that the above principle is implemented, TCN uses a one-dimensional fully convolutional network and causal convolution. Causal convolution relies on the next layer of T moments and their previous values. The difference with traditional convolutional neural networks is that causal convolution cannot see future data, it is a unidirectional structure, not bidirectional [22]. Therefore it is a strictly time-constrained model.

2.2.2. Dilated Convolution

Causal convolution can only capture dependencies linearly by increasing the depth of the network, which makes it unable to solve the task of longer dependencies well. To solve this problem, the dilated convolution is introduced [23]. The formula is shown in Equation (6).
F s = i = 0 k 1 f i X s i
where the one-dimensional sequence is X R n ; the convolution kernel size is k; the filter f : 0 , , k 1 R ; I is ∈ (0, 1, …, k − 1); the expansion factor is D; the element in the sequence is s; and the convolution operation is F.
Expansive convolution makes the size of the effective window grow exponentially with the number of layers (1, 2, 4, 8, …, 2n). This gives the convolutional network a large receptive field with a relatively small number of layers while ensuring that the network can memorize more dependent information. The structure of the dilated convolution is shown in Figure 3a.

2.2.3. Residual Connection

With the introduction of causal convolution and inflationary convolution, the depth of the network increases, which can cause gradient vanishing or gradient explosion and degrade the network performance. Therefore, TCN introduces residual connection, which uses residual modules instead of convolutional layers. Residual connection has proven to be an effective method for training deep networks, which allows the network to pass information across layers [24]. The structure of the residual connection is shown in Figure 3b. A residual module contains two layers of convolution and nonlinear mapping, with WeightNorm and Dropout added in each layer to regularize the network. This residual structure allows the feature extraction process to be able to retain as much information as possible, improving the accuracy of the model.

3. Data Preparation

The data in this study are the actual production data from a 2500 m3 vanadium–titanium commercial blast furnace. This furnace has accumulated a huge amount of production data, but it has many data fields, different storage locations and data quality problems. Therefore, these data needed to be processed before the model was built. This ensured that the data were complete and real, improving the accuracy of the model and guiding the production of vanadium extraction in the blast furnace.

3.1. Data Collection

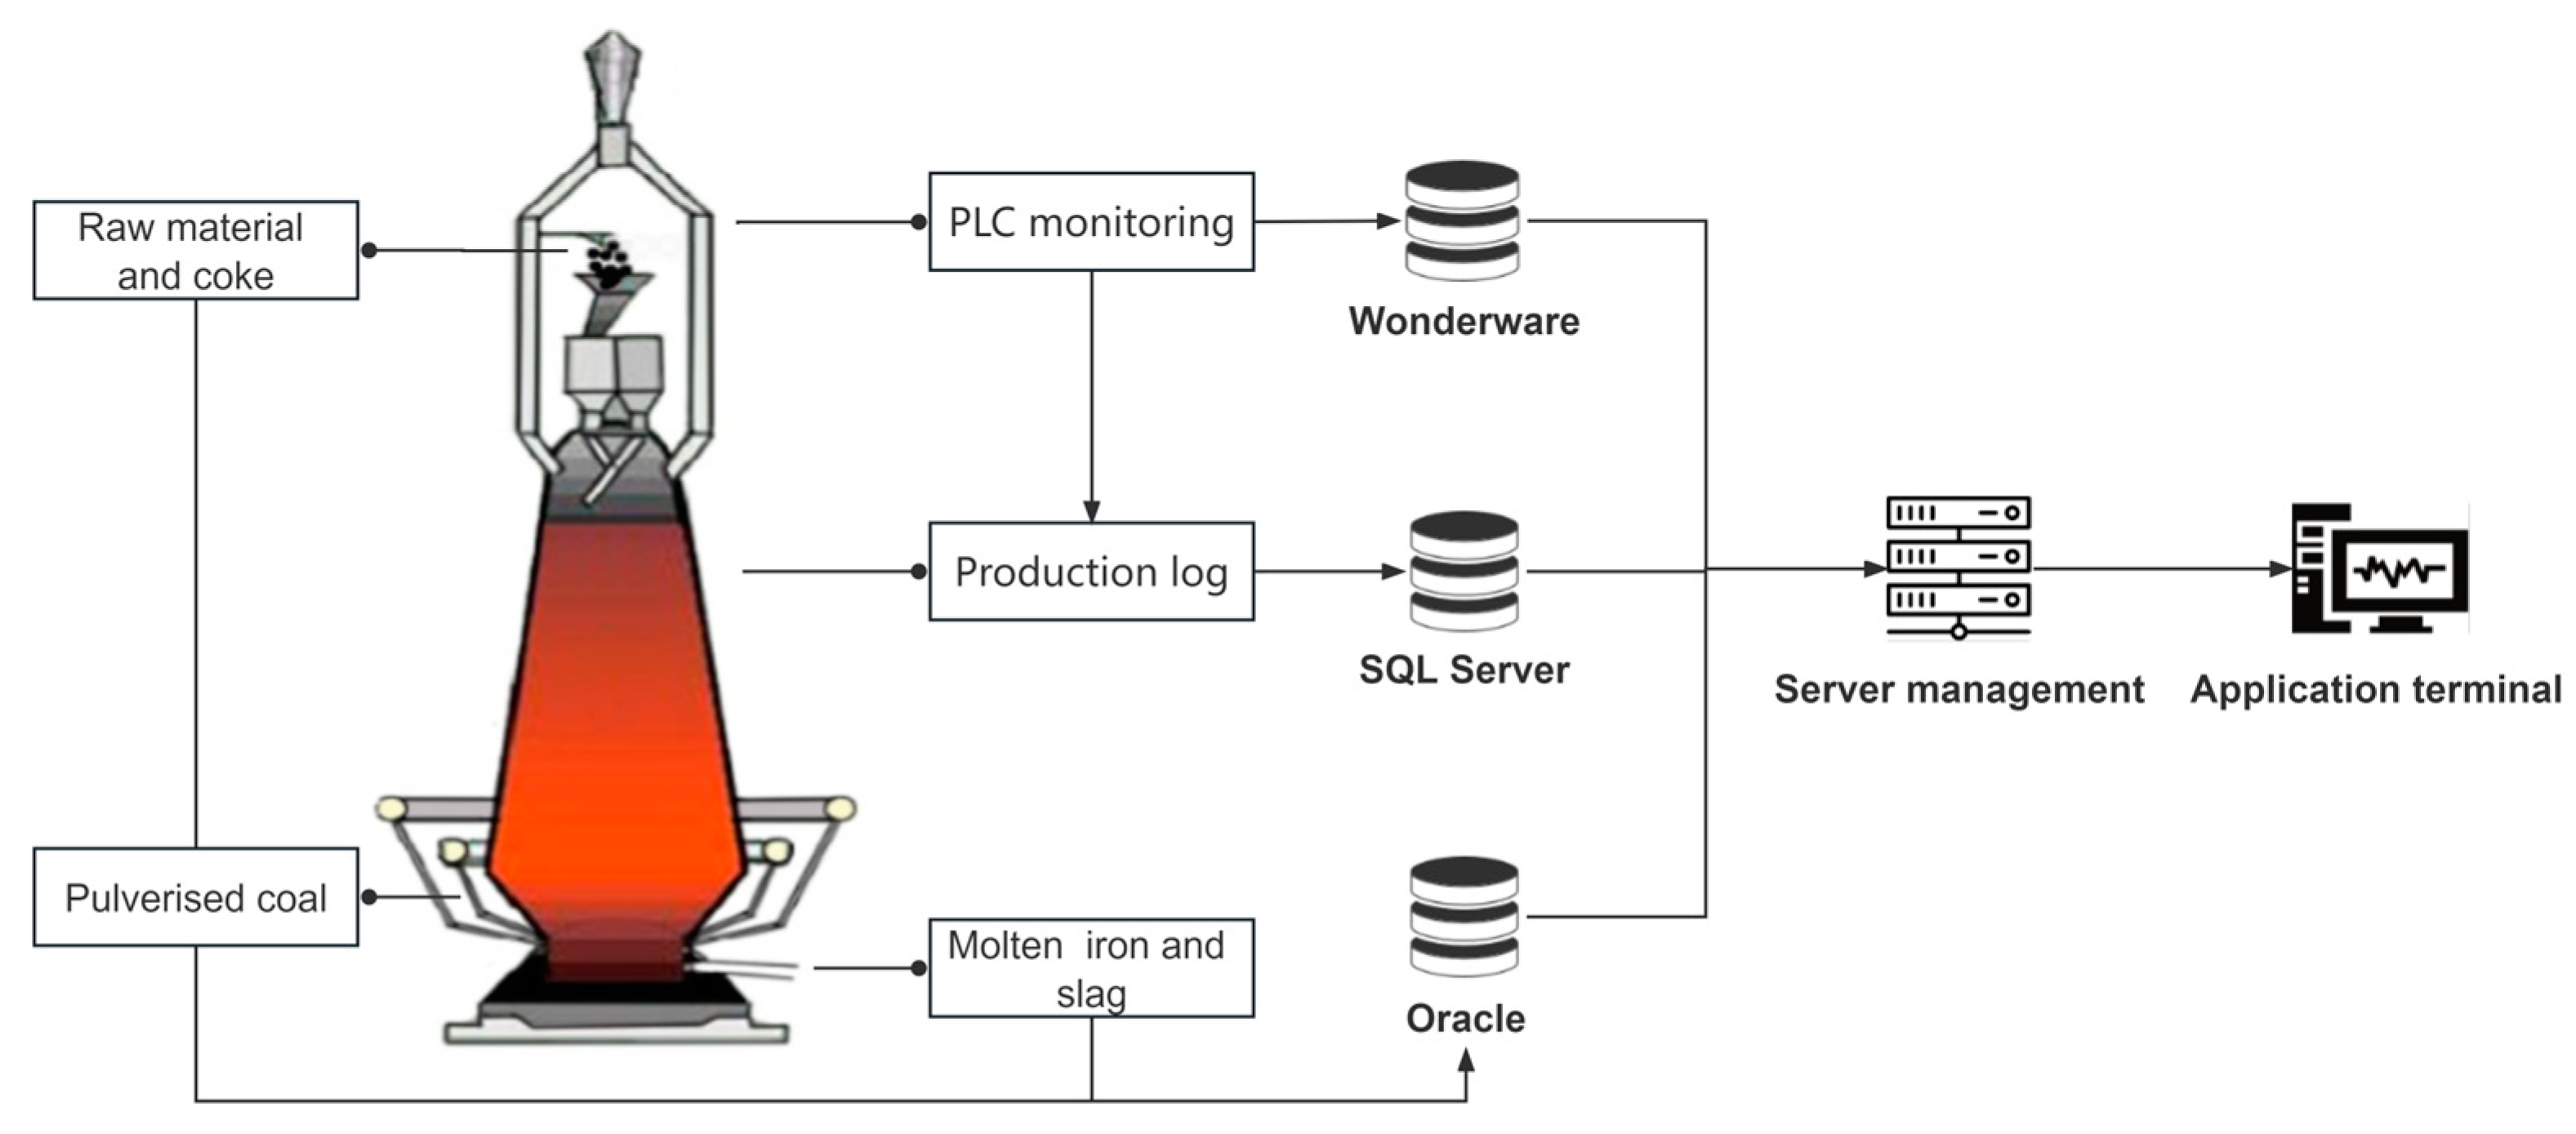
All the data from the blast furnace ironmaking process are stored in three databases: Wonderware, Oracle, and SQL Server. The data storage of the blast furnace is shown in Figure 4. The content and frequency of the data stored in each database are different: The Wonderware database stores the real-time monitoring data of the blast furnace production equipment, the SQL Server database stores the data related to the operation of the blast furnace production, and the Oracle database stores the results of the inspection and testing of the raw fuel and the products of the blast furnace.
The data were collected from a 2500 m3 commercial vanadium–titanium magnetite smelting blast furnace. The data collection and description of the blast furnace are shown in Table 1. According to the production process and the characteristics of the data type, the data were divided into two categories of non-real-time discrete data and real-time continuous data. Non-real-time discrete data include the relevant data recorded during the blast furnace production; these types of data generally include raw material and fuel data, slag and iron test data, and some manually entered production data. Real-time continuous data include the temperature, pressure, and flow data recorded in real time by monitoring equipment.

3.2. Data Processing

Blast furnace production conditions are complex and variable, and the data may have data quality problems, such as missing values and outliers. Therefore, the raw data had to be processed for the above situation. The data processing process improves the usability of data and provides a good database for data mining analysis and model development [25,26,27].

3.2.1. Missing Data Processing

Non-real-time discrete data from inspection data and manually entered production data have missing values caused by inconsistent inspection frequency or human-induced data omissions. These types of data usually have a high correlation between adjacent moments, so the missing values were filled with the correct value from the previous moment. Real-time continuous data have missing values mainly caused by abnormal monitoring and signal interference. The parameters belong to continuous data, so such missing values was filled by the linear interpolation method. Taking the fuel ratio and furnace body pressure as an example, the results of the missing data processing are shown in Figure 5.

3.2.2. Outlier Data Processing

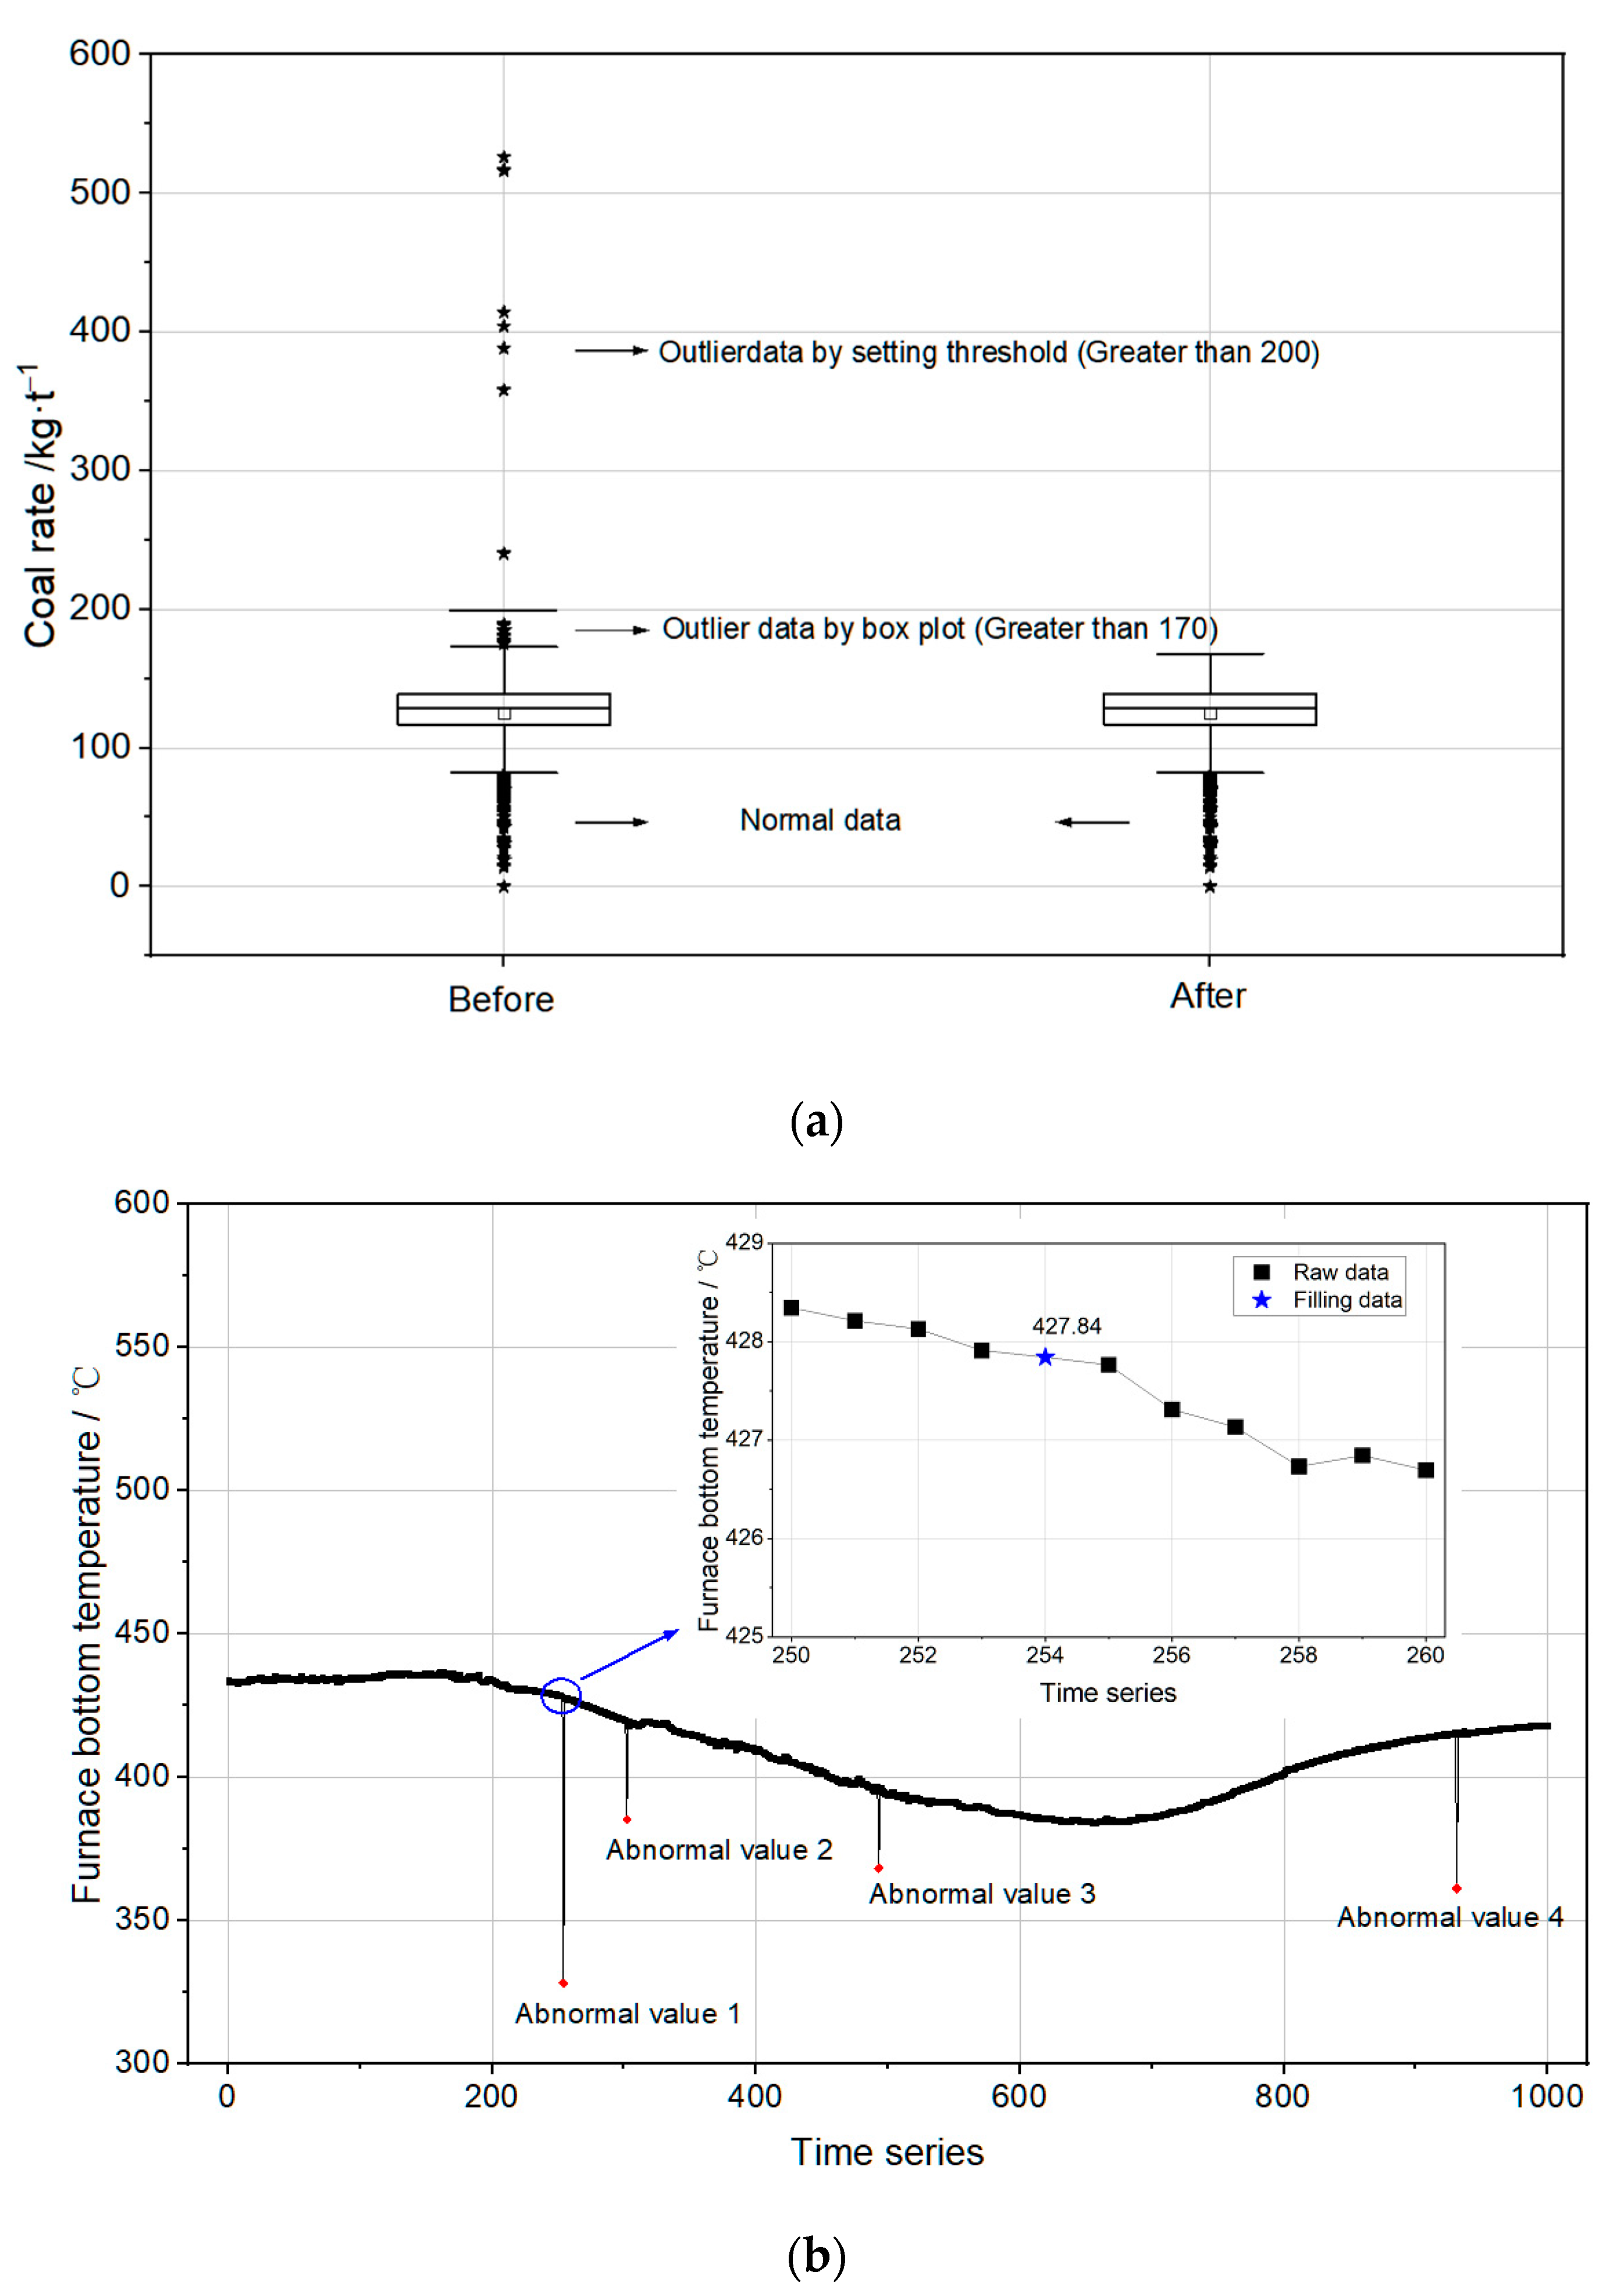
Outlier data include extreme over-limit data under normal blast furnace production conditions, the most intuitive expression being that a relatively stable dataset appeared in the outer region of the “anomaly” points. The outliers of non-real-time data are mainly caused by human errors or abnormal equipment storage. The identification of such outlier data was achieved in two steps. First, the threshold value of each parameter was set according to the actual production situation, and values exceeding the threshold were considered outliers. Then, a box plot algorithm was used to discriminate the data that fell within the threshold range, and according to the distribution of the data, the values that exceeded the limit of extreme outliers (Q3 + 3IQR) were defined as outliers. The processing of the outliers was updated with the correct value from the previous moment. Outliers of real-time data are mainly caused by signal interference or sensitivity deterioration of the monitoring equipment. They were identified using the distance-based sliding window anomaly detection algorithm. The processing of the outliers was updated with the linear interpolation method. Taking the coal rate and furnace bottom temperature as an example, the results of the outlier data processing are shown in Figure 6.

4. Wavelet-TCN Prediction Model

4.1. Analysis of the Forecast Data

Hurst index. The Hurst index reflects the autocorrelation of a time series [28]. The value of the Hurst index varies between 0 and 1 and determines the predictability of a time series. If the Hurst exponent is less than 0.5, it indicates inverse memory persistence; the series has a strong negative correlation, and the predictability is weak. If the Hurst index is greater than 0.5 and less than 1, it indicates positive memory persistence; the series has a strong positive correlation and the predictability is high. In this study, the Hurst index was chosen to help determine the predictability of the forecast dataset for the vanadium content of molten iron.
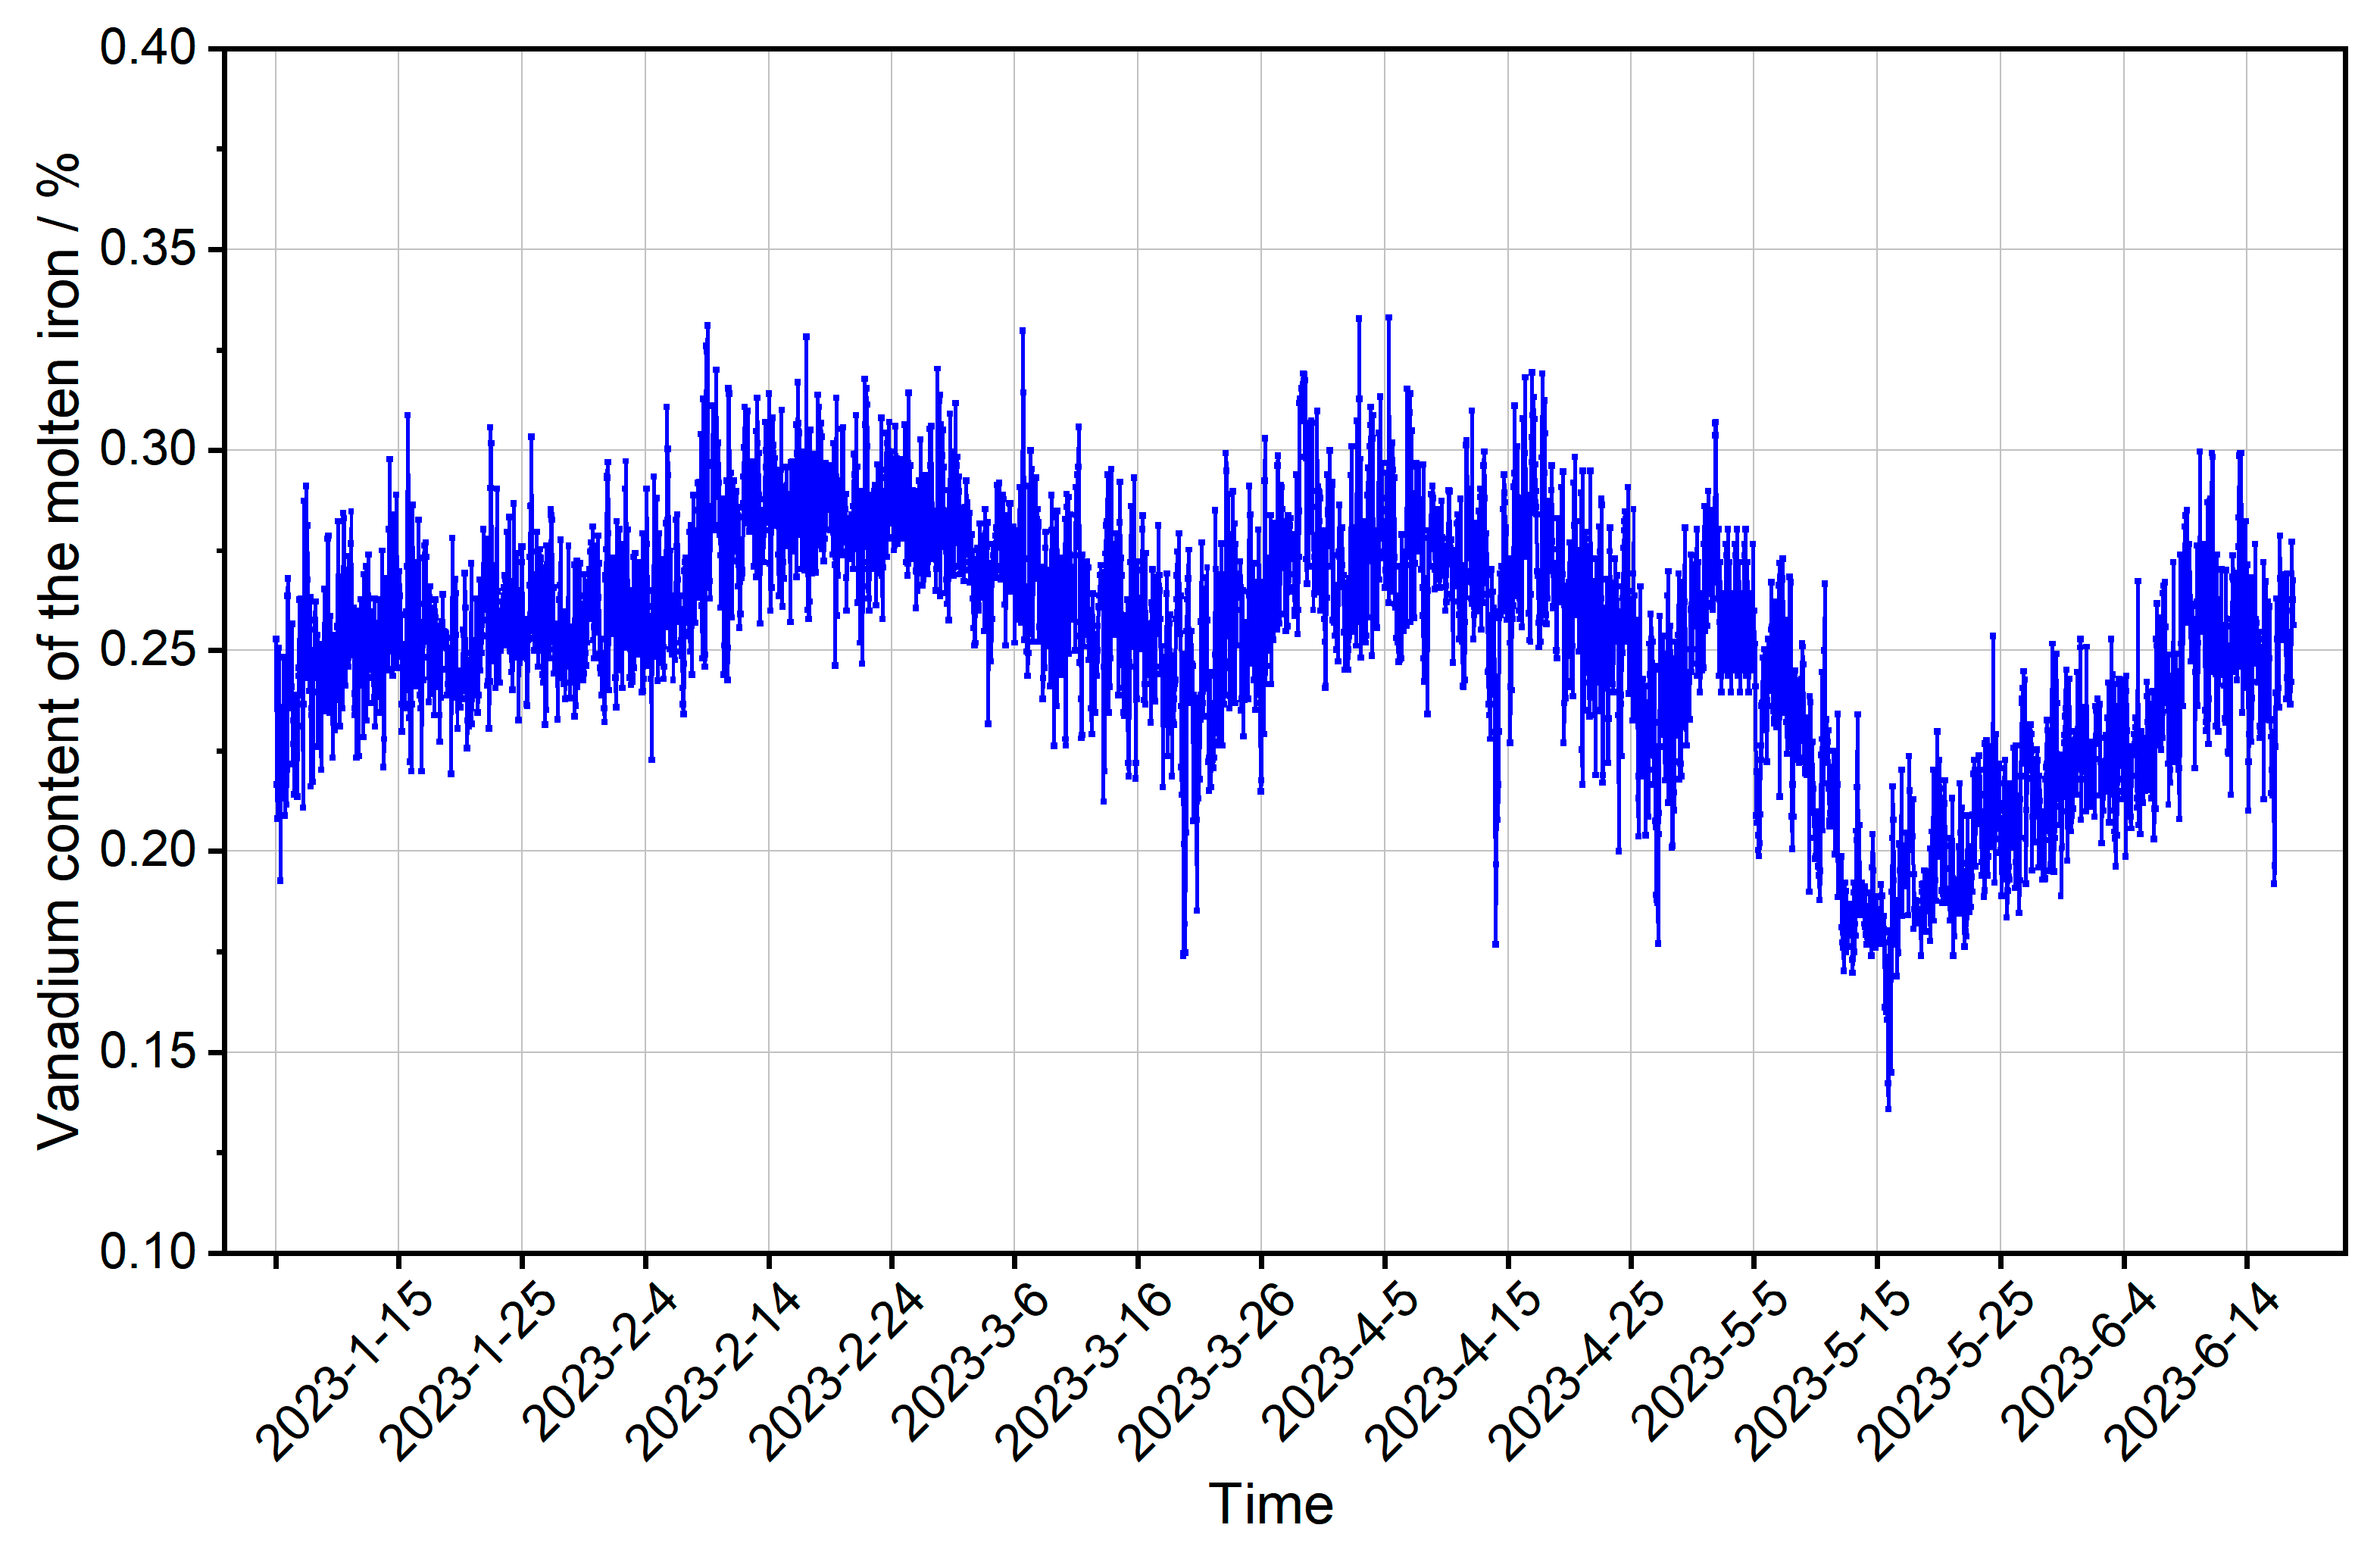
Analysis of forecast data predictability. A time series was built with the vanadium content of molten iron as the target variable, consisting of 3931 datasets from 1 January 2021 to 3 June 2021 at an hourly frequency. The trend of the vanadium content of molten iron is shown in Figure 7. As can be seen in Figure 7, the vanadium content of molten iron ranged from 0.15 to 0.34, and the series had an obvious fluctuation and periodicity. The Hurst index of the series of vanadium content of molten iron was calculated to be 0.563, which is greater than 0.5. This indicates that the series had a high degree of predictability.

4.2. Results and Analysis

4.2.1. Wavelet Transform Layers Selection

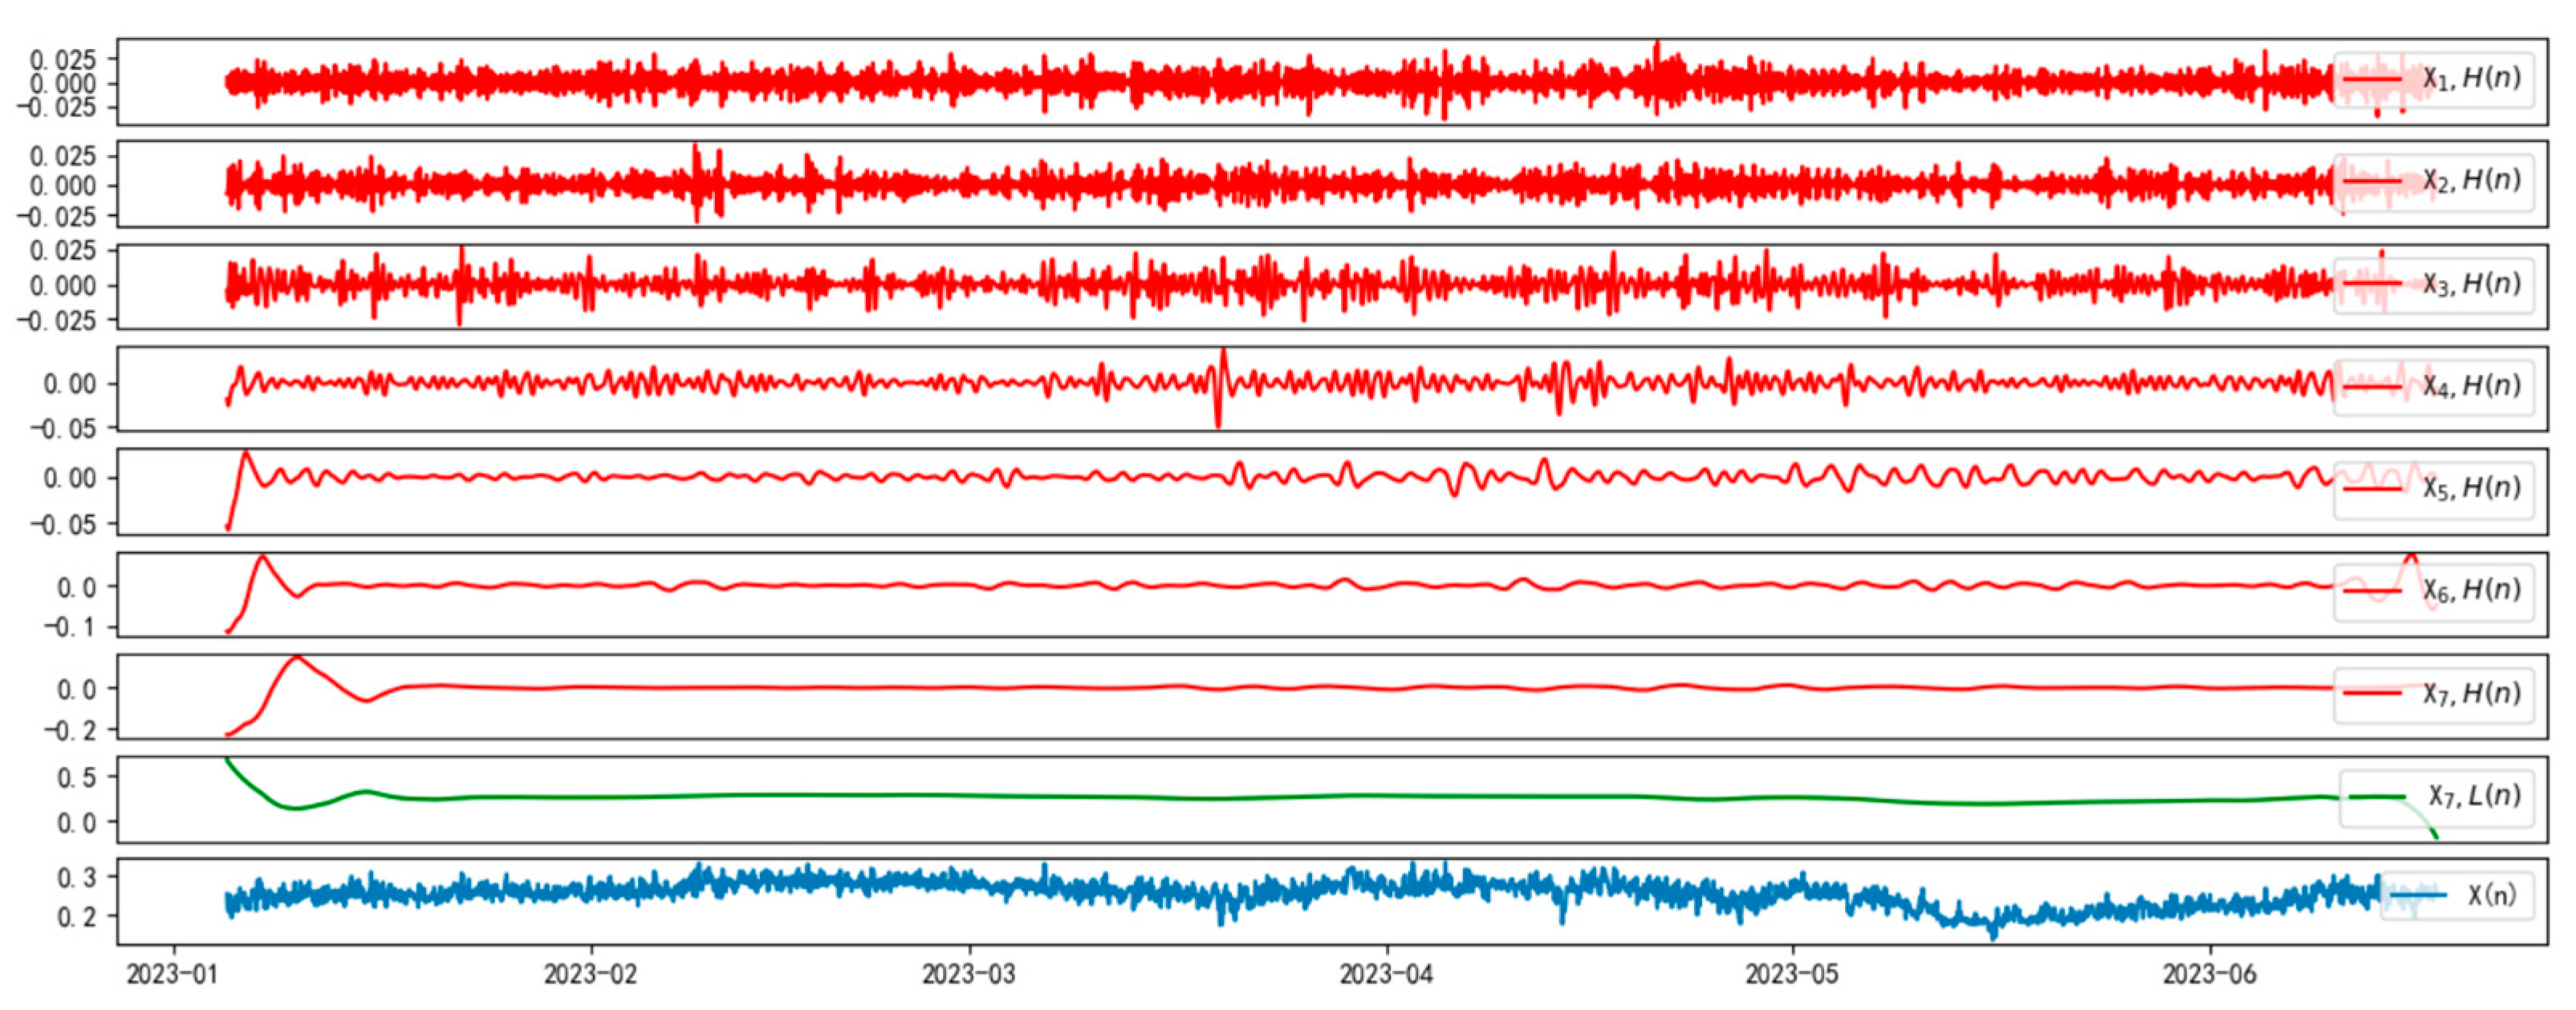
The prediction results of the models built with different layers of wavelet transform were analyzed to determine the optimal layer. The sequences for different wavelet transform layers are shown in Figure 8, where the number of layers of the wavelet transform was set to 7, and the original timing X ( n ) was decomposed into seven high-frequency noise segments and one low-frequency trend segment. The first 90% of the data were selected for the training set and the last 10% for the test set. For each of these seven time series, a predictive model was built using TCN, with a network consisting of 64 convolutional layers, a kernel size of 3 for each convolutional layer, a stack number of 1 for the residual block in the residual connection, inflated convolutions of 2, 4, 8 and 16, an activation function of Relu in the residual block, a training number of 35, and a learning batch size of 6. The prediction results of the models built with different numbers of layers are shown in Table 2.
As the number of wavelet layers increased, the R2 of the model prediction increased. With the number of wavelet layers at a = 5, the R2 of the model reached 0.8747, and then as the number of wavelet transform layers continued to increase, the accuracy of the model improved within limits. Considering the actual production situation, the less time the model takes, the more favorable for the actual production application. Under the condition that the error accuracy met 90%, the number of wavelet layers at a = 5, compared to a = 6, 7, the difference in R2 was less than 0.5%, and the relative time taken by the model was reduced by 125~160%. Therefore, a = 5 was selected as the number of wavelet transform layers for the combined wavelet-TCN model.
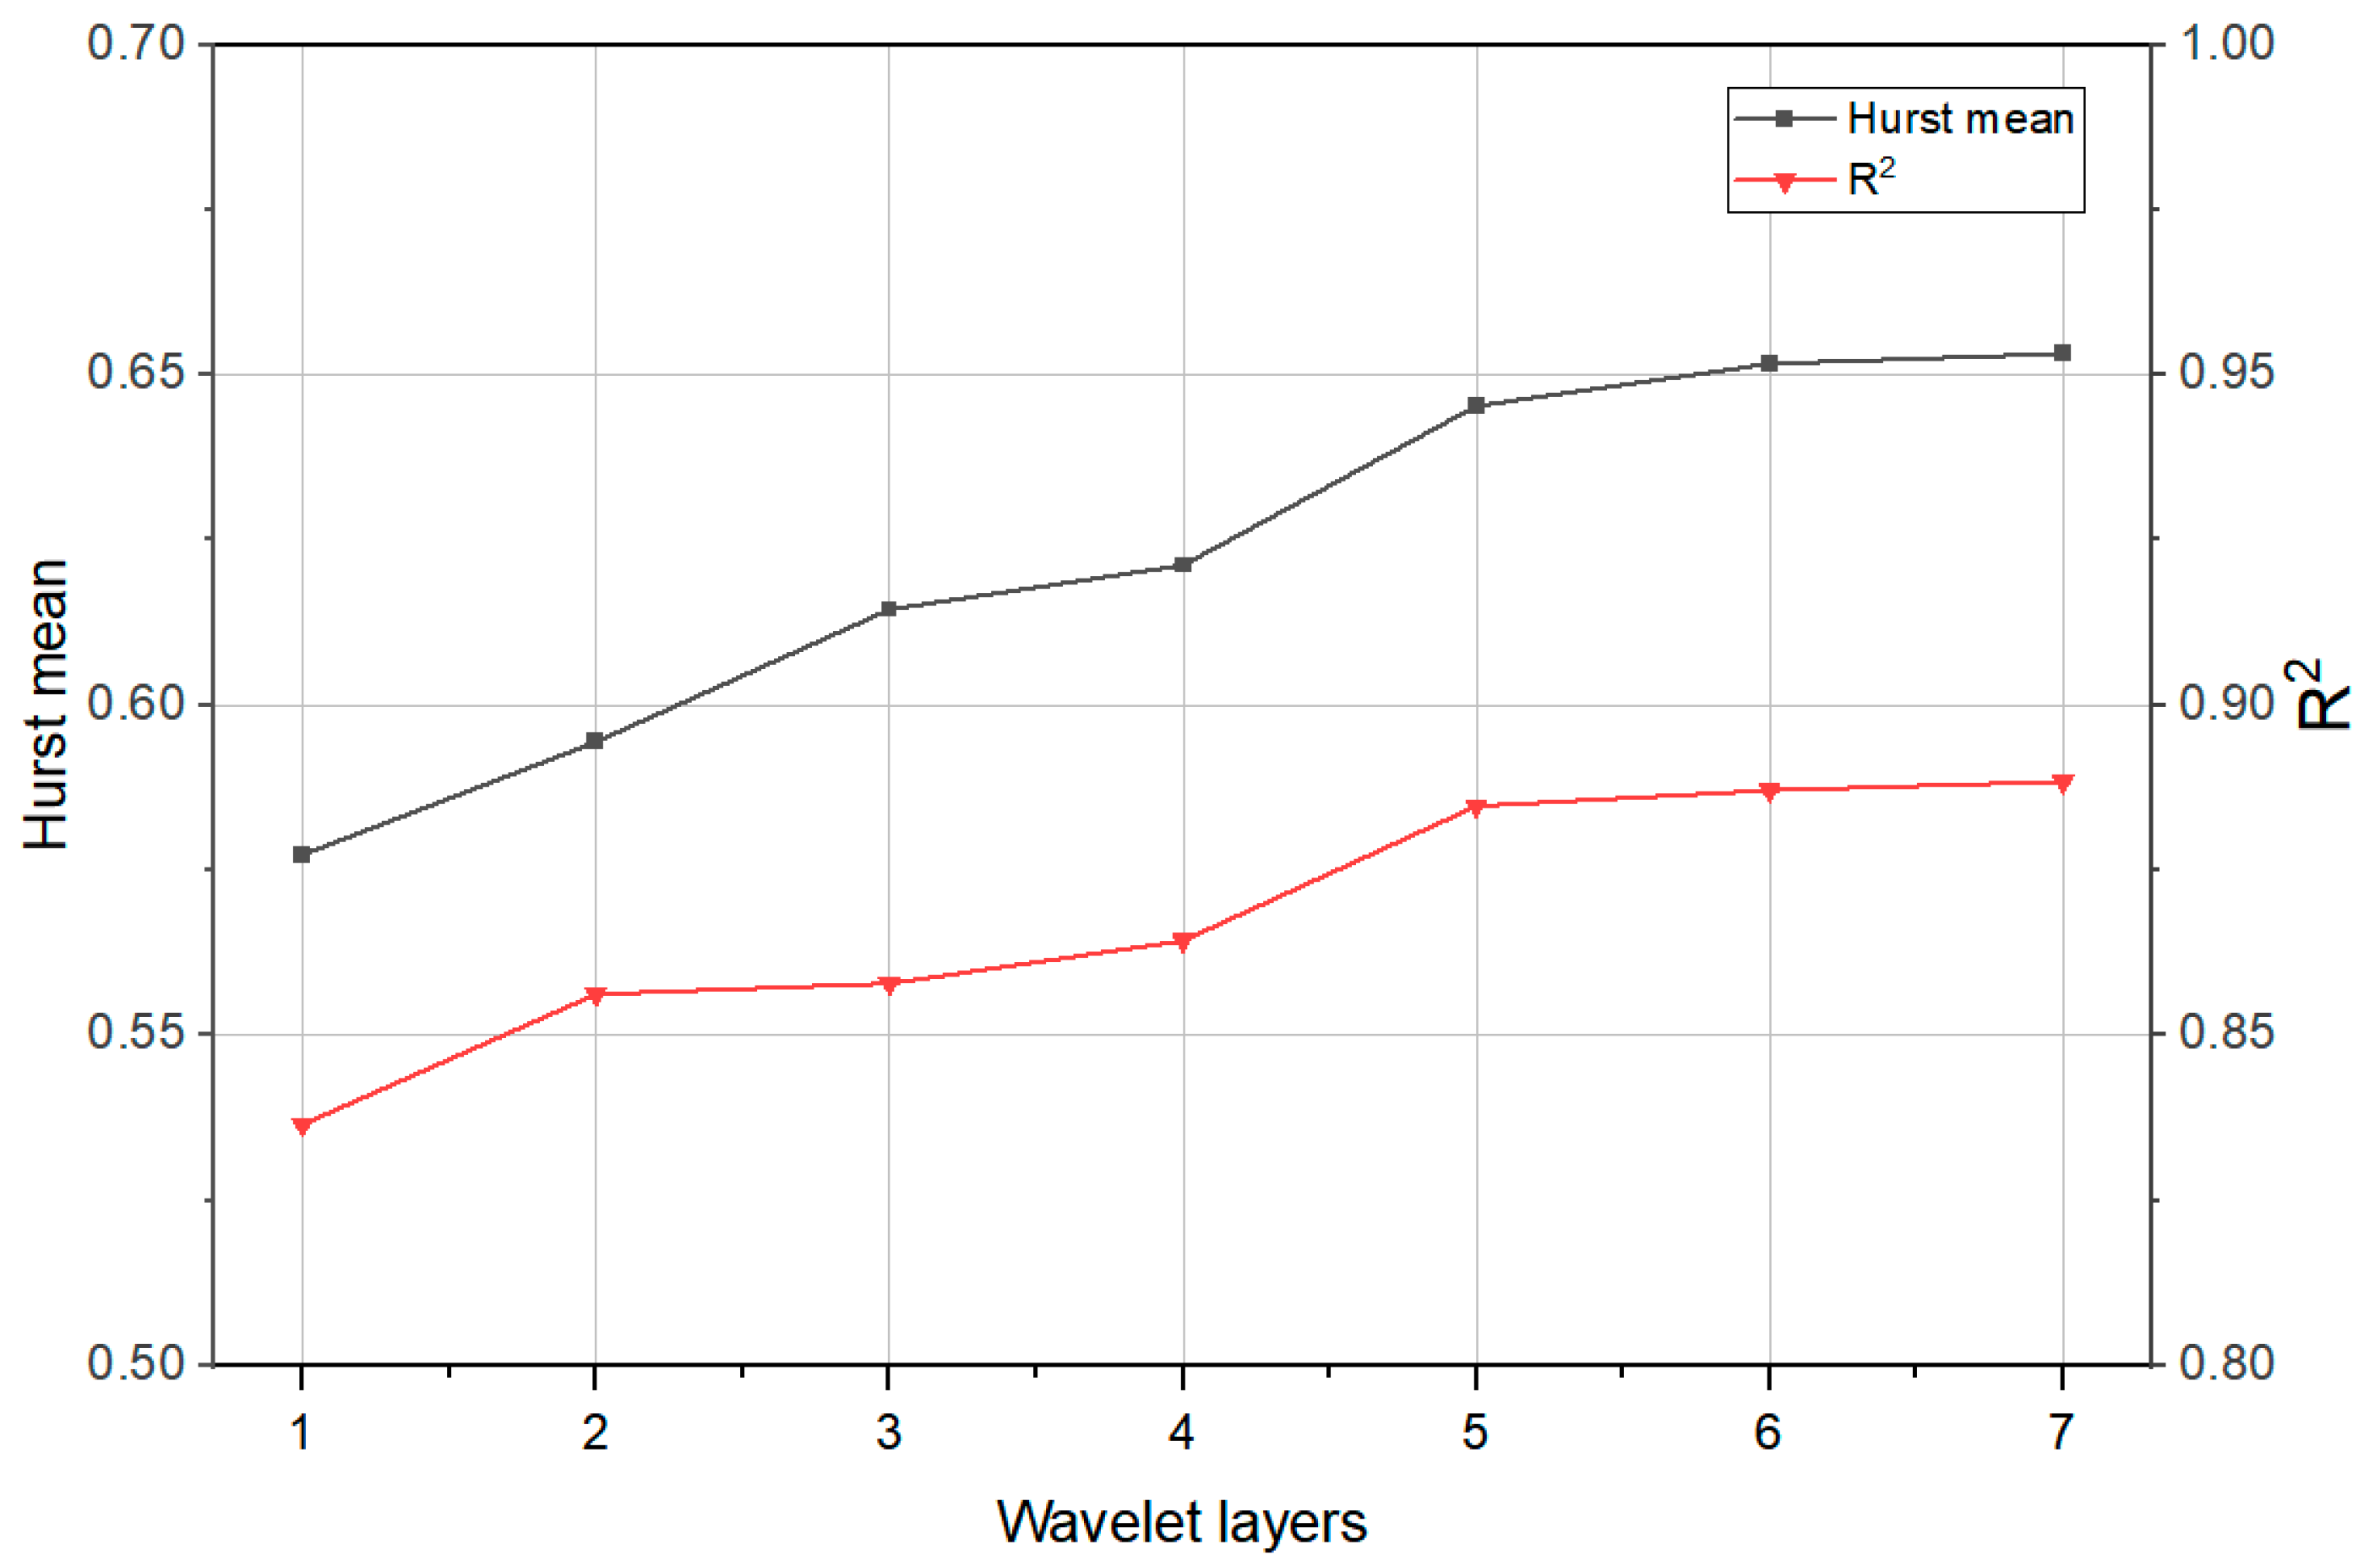
Taking advantage of the fact that the Hurst index can characterize the predictability of the data, this study averaged the Hurst index of the series of each wavelet transform to obtain the Hurst mean H ¯ a . The relationship between H ¯ a and R2 in the different wavelet transform layers is shown in Figure 9.
As can be seen in Figure 9, H ¯ a and R2 had the same trend in different wavelet transform layers. H ¯ a   can characterize the performance of the prediction model built by the wavelet transform. Therefore, this study proposes using the average Hurst index to characterize the predictability of the sequence after wavelet transform, as a reference for the combined model to select the number of wavelet transform decomposition layers. It facilitates the selection of the number of wavelet transform layers and reduces the training time of the model.

4.2.2. Modeling Results

To further verify the effectiveness of the combined wavelet-TCN model, the wavelet-TCN (a = 5) model was compared to LSTM, LSTM with attention, and TCN for prediction results. The results are shown in Table 3 and Figure 10.
As shown in Table 3 and Figure 10, the evaluation indicators of the models with wavelet transform were higher than that those without wavelet transform, indicating that the combined wavelet-TCN method can have a positive effect on improving the model prediction performance. The combined wavelet-TCN (a = 5) model outperformed the other models for all indicators and provided an accurate prediction of the vanadium content of the molten iron. The R2 of the wavelet TCN (a = 5) reached 0.8847, had an improvement of about 11~17%, and the indicator of the prediction accuracy error within ±0.02 reached 90.53%, which met the practical requirements of blast furnace production. Therefore, the prediction model based on the wavelet-TCN method can accurately predict the vanadium content of molten iron and grasp the trend of vanadium content, which is of great significance in assisting vanadium extraction operations.

5. Optimization of Vanadium Extraction Operations

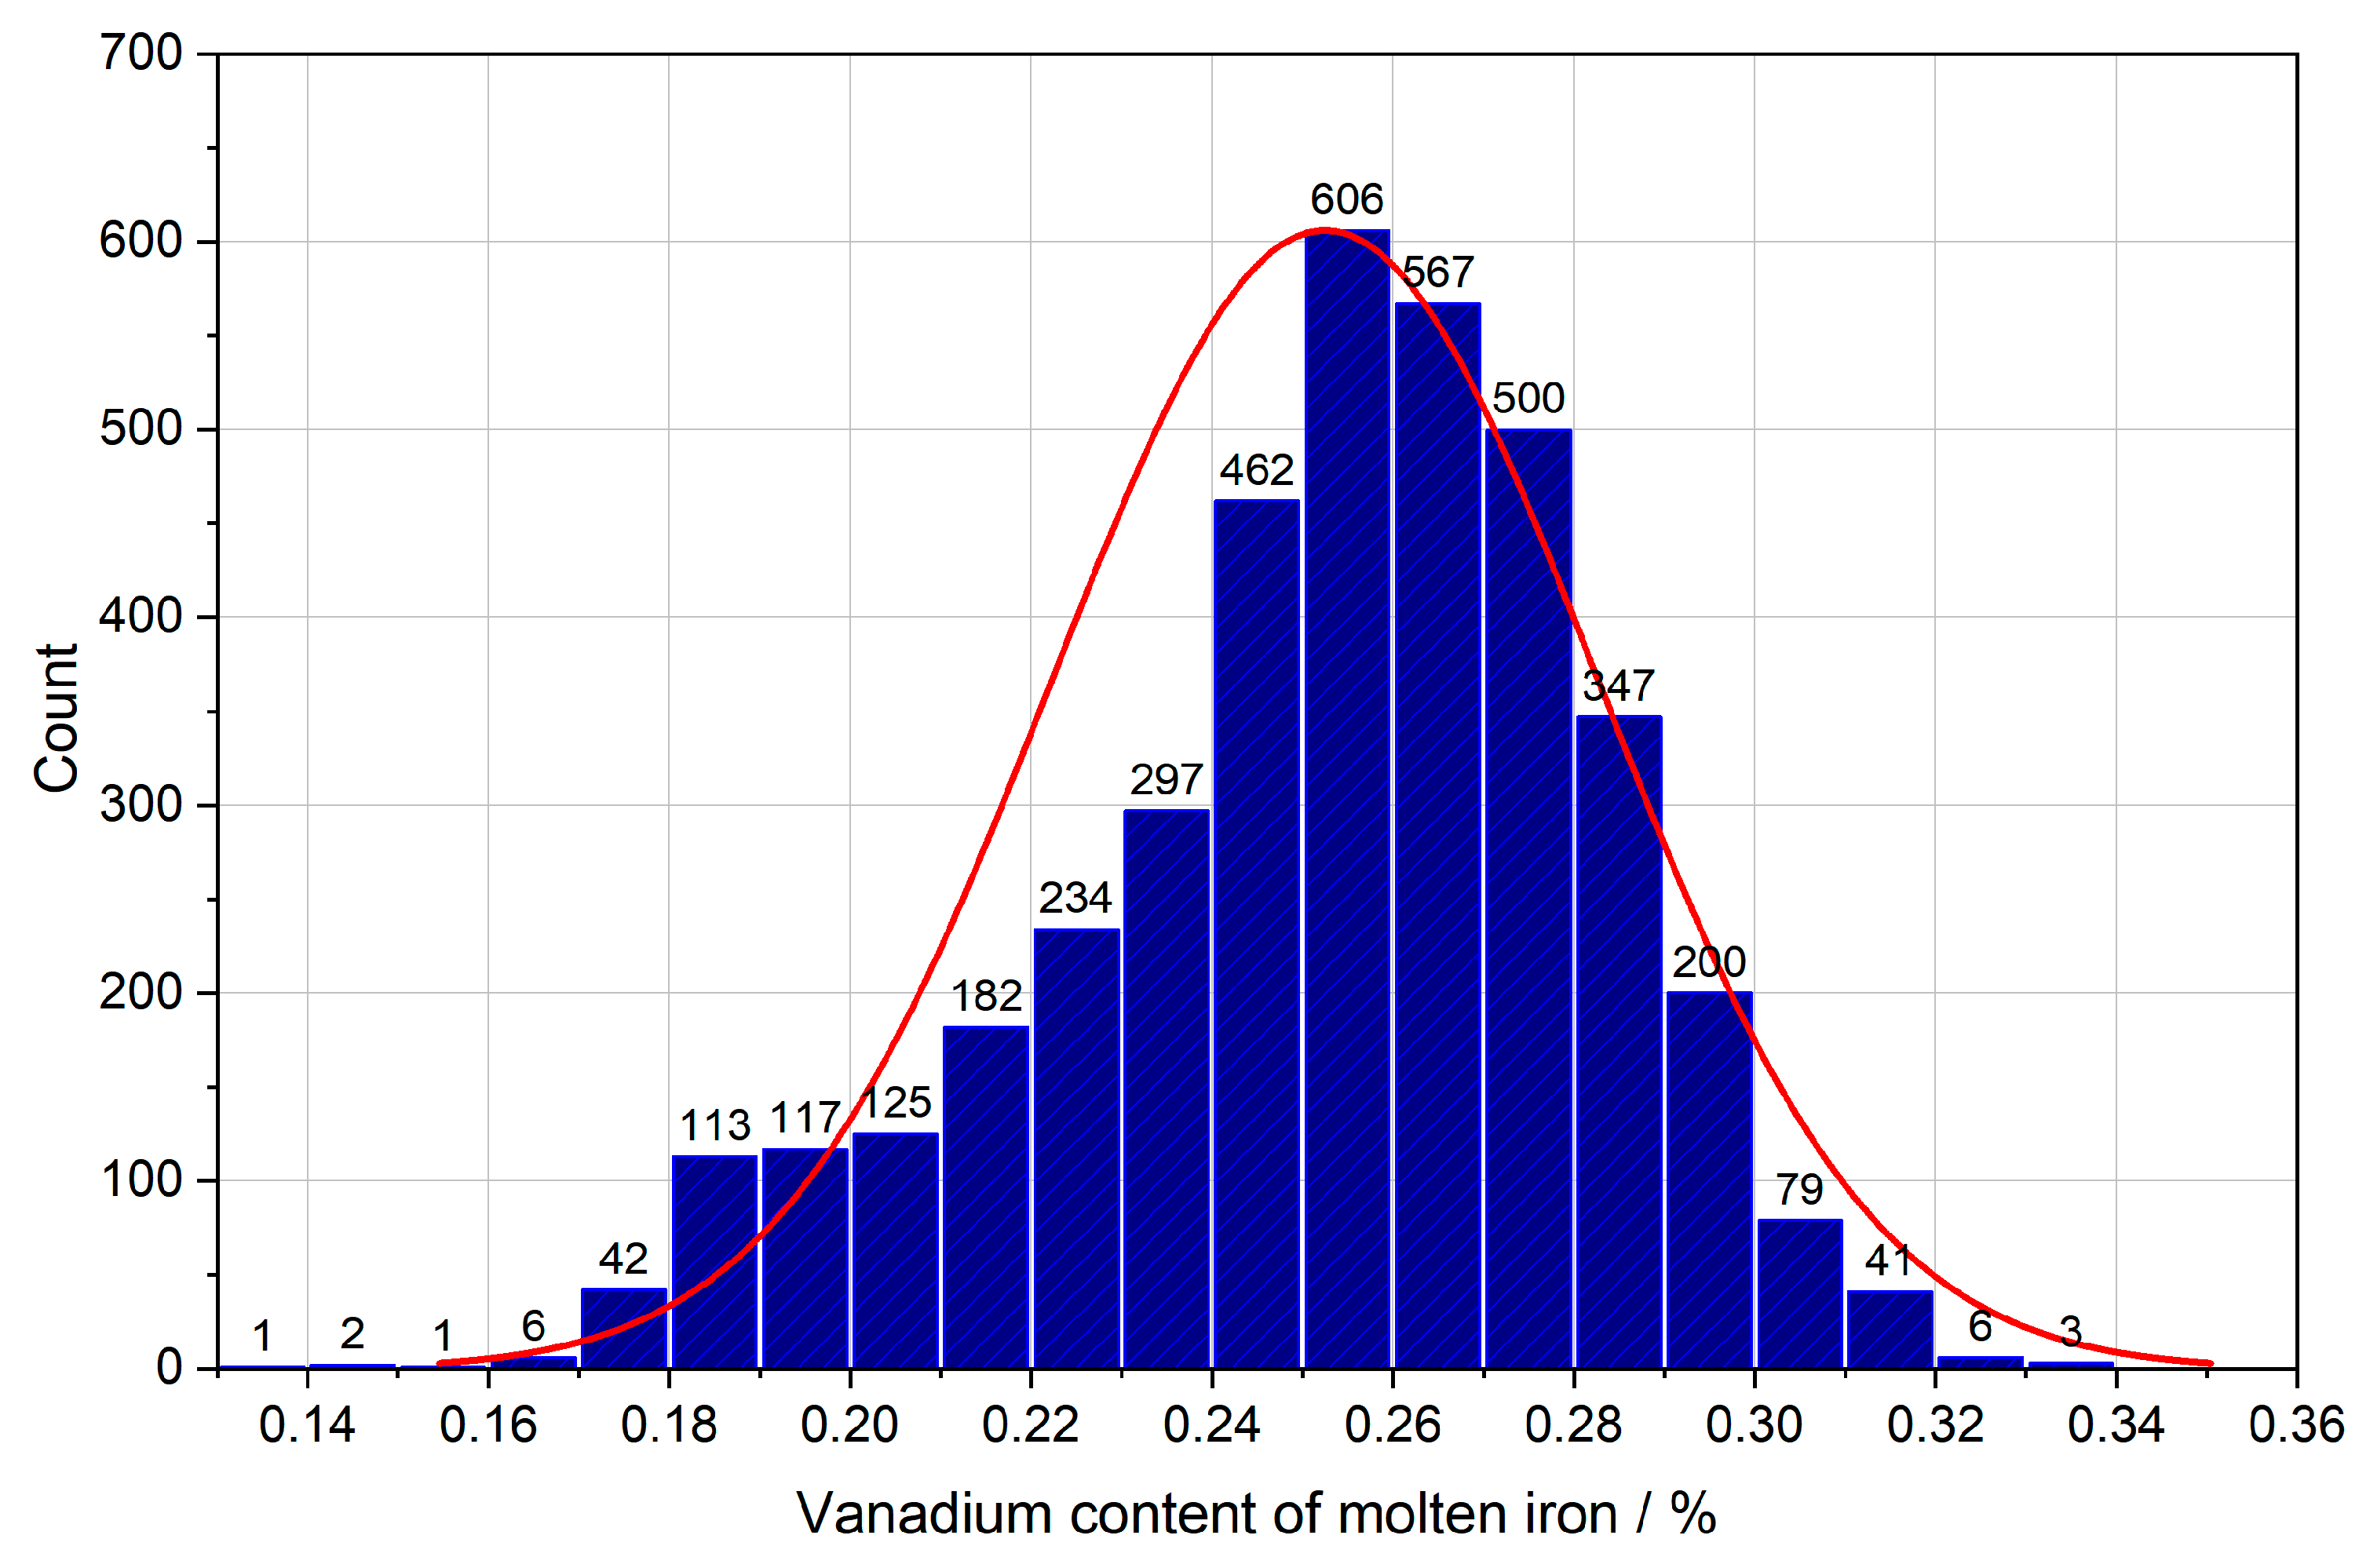
A total of 3931 datasets were collected for January–June 2023 to summarize and analyze the vanadium content of molten iron. The historical distribution of the vanadium content of molten iron is shown in Figure 11. The vanadium content of the molten iron was normally distributed within a range of 0.15–0.34. The concentrated distribution was in the range of 0.25–0.27, representing 50% of the total. With reference to the production logs, during this period, the blast furnace underwent adjustments in the charge structure, air supply, slag, and other measures to increase and maintain the vanadium content of the molten iron at a high level. Based on the historical data of vanadium–titanium blast furnace smelting during the period, the factors affecting the vanadium content of molten iron were analyzed, and the measures to improve the vanadium content are summarized.

5.1. Limitations of Vanadium Content Enhancement

The melting point of slag from vanadium–titanium magnetite blast furnace smelting is 50–100 °C higher than that of ordinary ore smelting slag. TiO2 in the slag can be reduced to TiN and TiC, which are dispersed in the slag as solid particles and wrapped around the iron beads, making the slag thick and difficult to flow, easily causing lower furnace liner bonding and hearth center accumulation [28]. Therefore, a higher slag TiO2 content increases the difficulty of blast furnace smelting.
The fluctuation of vanadium–titanium magnetite smelting blast furnace is characterized by rapid deterioration, a long recovery period, and a repeated recovery process. Once the furnace condition fluctuation occurs, it will definitely affect the technical and economic indexes. Therefore, ensuring the stable and smooth operation of blast furnace is a necessary condition for increasing the vanadium content of molten iron.

5.2. Measures for Increasing Vanadium Content

5.2.1. Increasing the Vanadium Load of Raw Materials of Blast Furnace

Vanadium in the raw material of a blast furnace is mainly from sinter and pellet ores. The vanadium-containing concentrate powder of the sintered allotment are mostly vanadium–titanium symbiotic (Figure 12). A higher proportion of vanadium powder increases the titanium content in sinter ore, resulting in a reduction in the quality of the sinter. In order to avoid the influence of titanium in the raw material on the furnace conditions, the vanadium loading of the blast furnace was increased by increasing the proportion of vanadium-bearing pellet ores without increasing the titanium content of the slag. At present, the pellet ore ratio for the blast furnace was increased to 31%.

5.2.2. Furnace Temperature and Slag Composition Control

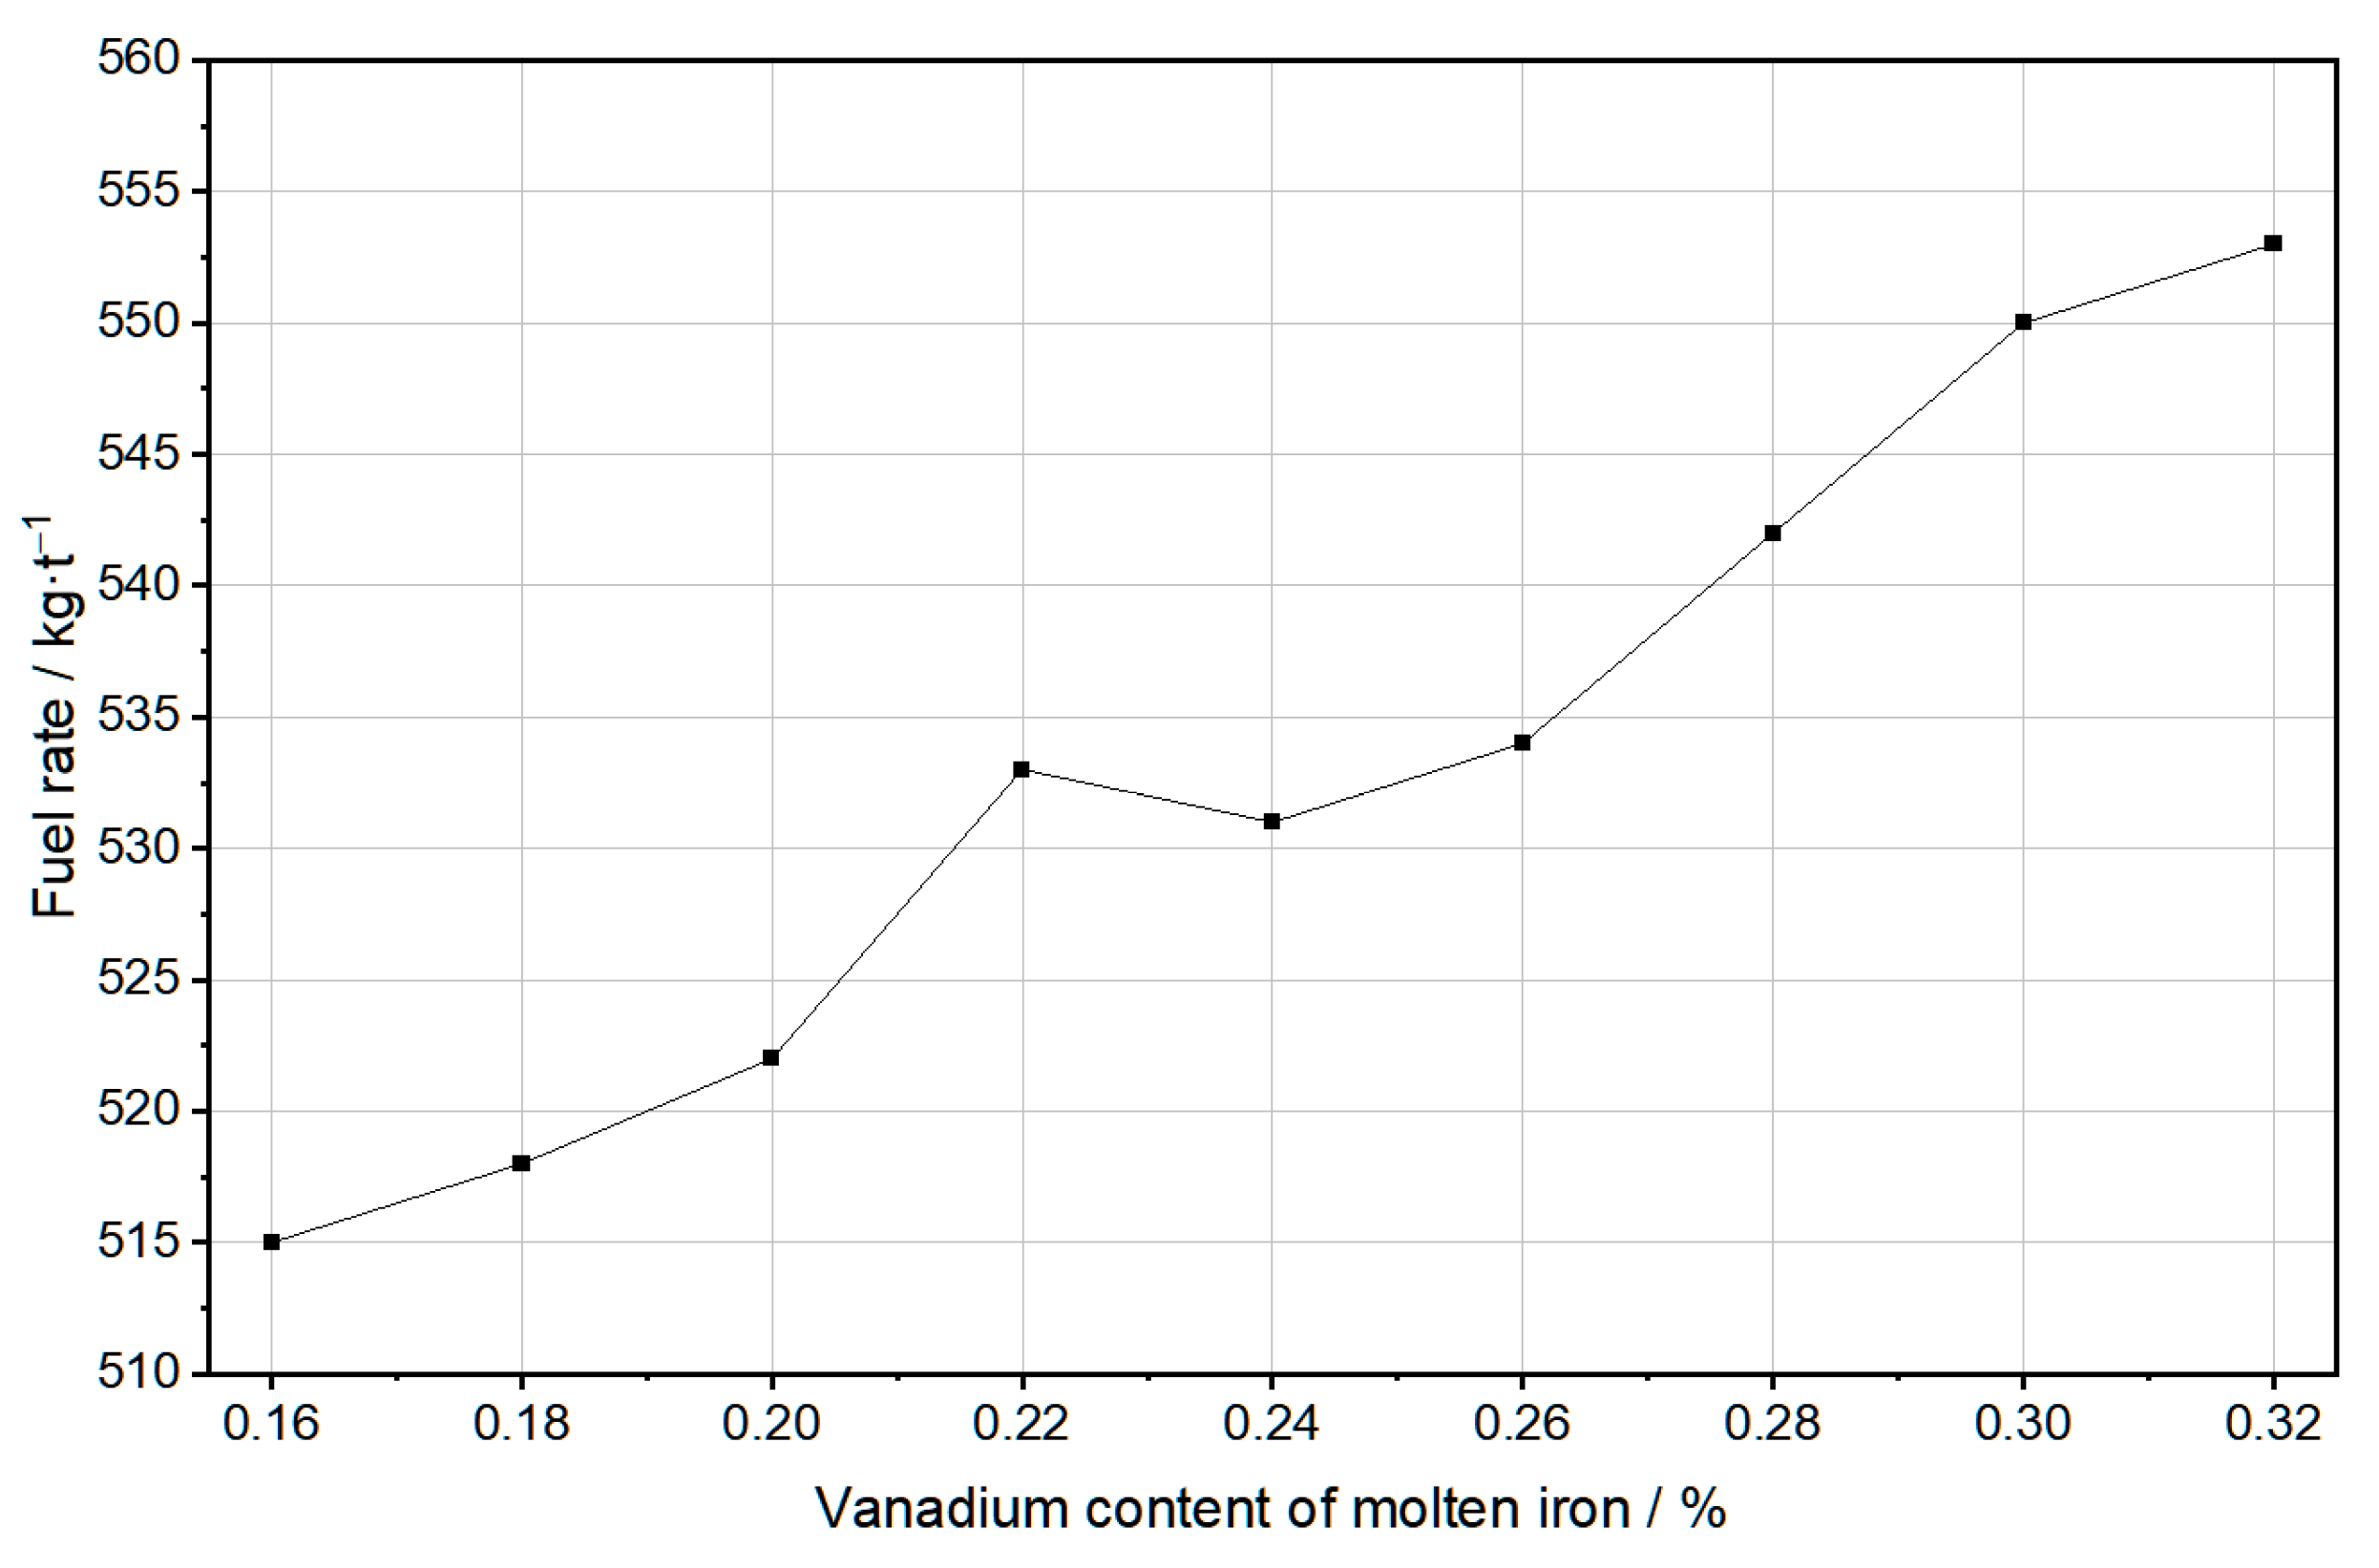
Furnace temperature control. Based on the correspondence between the blast furnace fuel rate and the vanadium content of molten iron (Figure 13), the empirical equation was derived as F r = 447 + 233.5 × [ V ] , which provided a reference for adjusting the furnace temperature of the blast furnace. The operation of the vanadium reduction process was facilitated by increasing the temperature of molten iron within the appropriate slag temperature range. The silicon and titanium content of molten iron should be controlled in the range of 0.2–0.4%, and the physical heat of molten iron should be 1470 ± 10 °C.
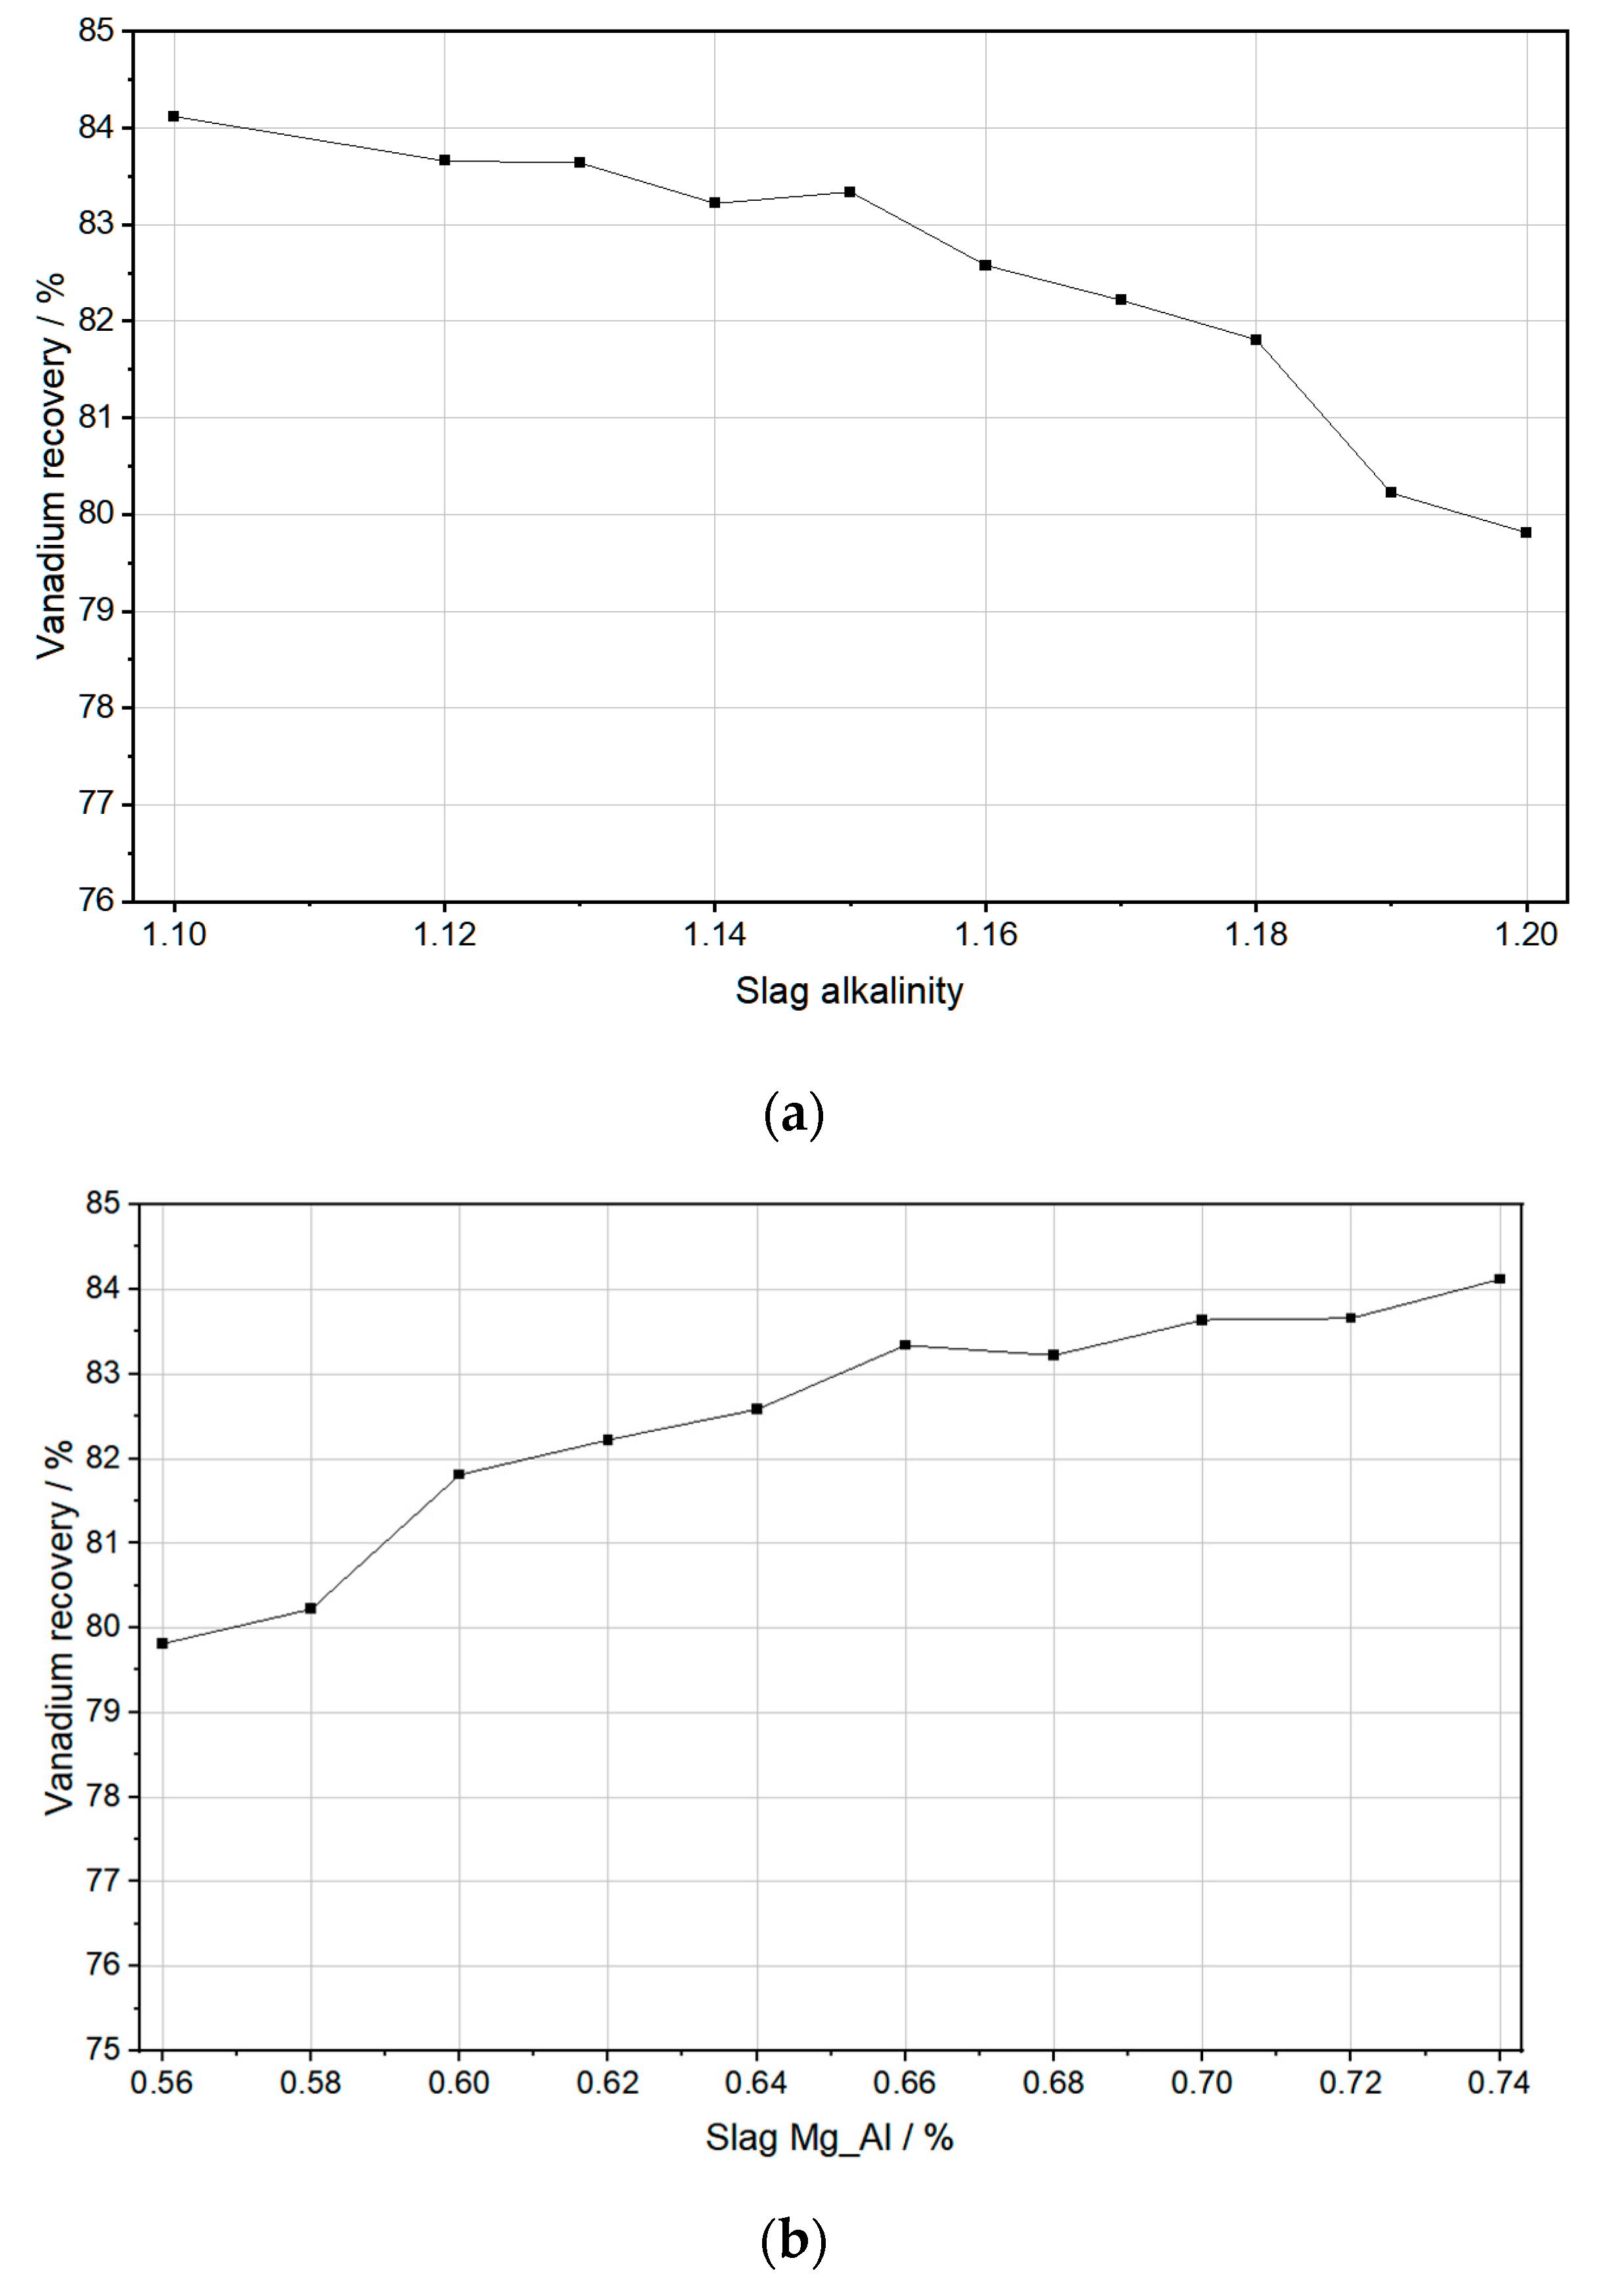
Slag composition control. Under the condition of constant vanadium loading of the blast furnace, the vanadium recovery and slag composition were analyzed to obtain the variations in vanadium recovery with slag alkalinity and an magnesium–aluminum ratio (Figure 14). It can be seen from Figure 14a that vanadium recovery decreased with increasing slag alkalinity. The production practice showed that controlling the slag alkalinity to 1.15 ± 0.05 not only ensured the quality of molten iron but was also conducive to blast furnace smelting. It can be seen from Figure 14b that the correlation between vanadium recovery and the slag magnesium–aluminum ratio is relatively clear. As the slag magnesium–aluminum ratio decreased, the vanadium recovery showed a decreasing trend. If the vanadium recovery rate is required to be above 80%, the magnesium–aluminum ratio should be controlled at about 0.68.
Gas flow adjustment. As the blast furnace vanadium loading increased, the gas permeability of the blast furnace showed a decreasing trend (Figure 15). In order to keep the blast furnace running smoothly, the charging schedule was adjusted to maintain two air flows with “center” and “edge” so that the blast furnace permeability index was maintained at around 34. In order to ensure the active hearth, the kinetic energy of the blast and the wind speed had to be further increased in the lower air supply system, and the lower center was blown through to ensure the stability of the central air flow. The combustion rate of the pulverized coal as maintained, and the coal rate did not exceed than 150 kg/t. W increased the oxygen volume as much as possible according to the upper limit accepted by the blast furnace condition to increase the oxygen potential of the furnace cylinder and reduce the slag viscosity. We maximized air temperature operations to reduce the coke rate and increased the slag–iron temperature by utilizing the heat carried by the hot air.

6. Conclusions

In this study, a predictive model for the vanadium content of molten iron in the blast furnace was established by combining big data mining technology with machine learning. The following conclusions were obtained.
(1).
Based on the data resources of blast furnace ironmaking, the raw data related to the blast furnace parameters were selected, and the clean data were obtained by processing the missing data and outlier data. The data processing process improved the usability of the data and provided a good database for data mining analysis and model development.
(2).
A combined wavelet-TCN method was selected to predict the vanadium content of molten iron in a blast furnace. The wavelet transform layered sequence features are stable, and TCN has the advantages of less parallel training time, strong generalization ability, and complete feature extraction. The results show that compared to single models, such as LSTM, LSTM with attention, and TCN, the combined model based on wavelet-TCN (a = 5) had an improvement of about 11~17% in R2, and the prediction accuracy was high and stable, which met the practical requirements of blast furnace production. This guaranteed the subsequent high efficiency and stability of the vanadium extraction.
(3).
Aiming at the complexity of selecting the number of wavelet transform layers, the average Hurst index was proposed to characterize the predictability of the sequence after the wavelet transform, which was used as a reference index for the combined model to select the number of wavelet transform decomposition layers. The average Hurst index simplified the process of wavelet transform layer selection and reduced the model computation time.
(4).
Based on the historical data of vanadium blast furnace smelting, the factors affecting the vanadium content of molten iron were analyzed and the measures to increase the vanadium content were summarized to provide the production guidance for operators. Ensuring the stable and smooth operation of the blast furnace was the necessary condition for increasing the vanadium content of molten iron. Increasing the vanadium load of the blast furnace and avoiding increasing the TiO2 load, as well as maintaining the corresponding blast furnace operating parameters in the appropriate range to achieve the optimization of vanadium extraction from molten iron.
(5).
The prediction model for the vanadium content of molten iron achieved a satisfactory predicative performance. However, there are still some further optimization works to be carried out. We can try to make predictions for the next two or three hours to obtain a longer-term trend of the vanadium content of molten iron.

Author Contributions

Conceptualization, H.L., X.L. (Xiaojie Liu) and Q.L.; data curation, X.B. and S.C.; formal analysis, H.L. and X.L. (Xin Li); funding acquisition, X.L. (Xin Li) and X.L. (Xiaojie Liu); methodology, H.L. and X.L. (Xiaojie Liu); resources, X.B. and S.C.; project administration, Q.L.; supervision, H.L. and Q.L.; software, H.L. and X.L. (Xin Li); validation, H.L. and S.C.; writing—original draft, H.L., X.B. and K.W.; writing—review & editing, H.L., X.L. (Xin Li) and Q.L. All authors have read and agreed to the published version of the manuscript.

Funding

This research was funded by the National Nature Science Foundation of China (No. 52004096).

Institutional Review Board Statement

Not applicable.

Informed Consent Statement

Not applicable.

Data Availability Statement

Not applicable.

Acknowledgments

Thanks to the North China University of Science and Technology for training and educating, thanks to my teacher Lyu Qing for his careful guidance, and thanks to the classmates on my team for their companionship.

Conflicts of Interest

The authors declare no conflict of interest.

References

  1. Wang, X.; Han, Y.X.; Li, Y.J.; Gao, P. Research Status on Comprehensive Development and Utilization of Vanadium-Titanium Magnetite. Met. Mine 2019, 6, 33–37. [Google Scholar] [CrossRef]
  2. Zhang, Y.M.; Wang, L.N.; Chen, D.S.; Liu, H.Y.; Zhao, H.X.; Qi, T. A method for recovery of iron, titanium, and vanadium from vanadium-bearing titanomagnetite. Int. J. Miner. Metall. Mater. 2018, 25, 131–144. [Google Scholar] [CrossRef]
  3. Li, Z.K.; Liu, X.J.; Hao, L.Y.; Lyu, Q.; Li, H.W. Prediction Model of Vanadium in Blast Furnace Molten Iron Based on AdaBoost Algorithm. J. N. China Univ. Sci. Technol. (Nat. Sci. Ed.) 2020, 42, 20–28. [Google Scholar]
  4. Zhang, Y.S. Introduction to Blast Furnace Smelting Technology for Vanadium-Titanium Magnetite Iron Ores. China Steel Focus 2021, 5, 7–8. [Google Scholar]
  5. Xue, F. 1080 m3 Blast Furnace Fast Recovery Vanadium and Titanium Ore Smelting Practice. Metall. Mater. 2020, 40, 79–82. [Google Scholar]
  6. Yan, C.J.; Chen, S.J.; Zhao, X.J.; Li, F.M.; Lyu, Q.; Qie, Y.N. Experimental Study on Reduction of Vanadium Oxides in Blast Furnace Hearth. Iron Steel Vanadium Titan. 2017, 38, 22–26. [Google Scholar]
  7. Li, L.F.; Zhang, G.X.; Zhang, Y.H.; Yi, F.Y.; Hao, L.Y. Chengsteel 2500 m3 Blast Furnace Iron-Vanadium Smelting Practice. Ironmaking 2021, 40, 37–40. [Google Scholar]
  8. Zhang, W.X.; Li, Z.C.; Rao, J.T.; Fan, Y.D.; He, S.G. Factors Influencing Vanadium Content in Hot Metal Smelted in Pangang Blast Furnace. Iron Steel Vanadium Titan. 1999, 20, 52–57. [Google Scholar]
  9. Deng, Y.; Lyu, Q. Establishment of Evaluation and Prediction System of Comprehensive State Based on Big Data Technology in a Commercial Blast Furnace. ISIJ Int. 2020, 60, 898–904. [Google Scholar] [CrossRef]
  10. Liu, X.J.; Deng, Y.; Li, X.; Hao, L.Y.; Liu, E.H.; Lyu, Q. Prediction of Silicon Content in Hot Molten of Blast Furnace Based on Big Data Technology. China Metall. 2021, 31, 10–16. [Google Scholar] [CrossRef]
  11. Jiang, K.; Jiang, Z.H.; Xie, Y.F.; Pan, D.; Gui, W.H. Online Prediction Method for Silicon Content of Molten Iron in Blast Furnace Based on Dynamic Attention Deep Transfer Network. Acta Autom. Sin. 2021, 49, 949–963. [Google Scholar] [CrossRef]
  12. Jiang, Z.H.; Xu, C.; Gui, W.H.; Jiang, K. Prediction Method of Hot Metal Silicon Content in Blast Furnace Based on Optimal Smelting Condition Migration. Acta Autom. Sin. 2022, 48, 194–206. [Google Scholar] [CrossRef]
  13. Tang, W.W.; Li, X.; Liu, X.J.; Li, H.Y.; Zhang, S.H. Intelligent Application of Big Data Enabling Blast Furnace ironmaking. Metall. Ind. Autom. 2022, 46, 11–22. [Google Scholar]
  14. Liu, X.J.; Li, X.; Liu, E.H.; Liu, S.; Lyu, Q. Research Status and Prospect of Big Data Technology in Blast Furnace Ironmaking Production. Multipurp. Util. Miner. Resour. 2021, 4, 91–96. [Google Scholar]
  15. Han, Y.; Hu, Z.B.; Yang, A.M.; Li, J.; Zhang, Y.Z. Intelligent Recommendation Model for Reducing Silicon Deviation Fluctuation of Hot Metal in BF and Application. Iron Steel 2023, 58, 30–38. [Google Scholar] [CrossRef]
  16. Liu, B.; Wang, M.S.; Li, Y.; Chen, H.L.; Li, J.Q. Deep Learning for Spatio-Temporal Sequence Forecasting: A Survey. J. Beijing Univ. Technol. 2021, 47, 925–941. [Google Scholar] [CrossRef]
  17. Li, P.F.; Hua, P.; Gui, D.W.; Niu, J.; Pei, P.; Zhang, J.; Krebs, P. A Comparative Analysis of Artificial Neural Networks and Wavelet Hybrid Approaches to Long-term Toxic Heavy Metal Prediction. Sci. Rep. 2020, 10, 13439. [Google Scholar] [CrossRef]
  18. Alhnaity, B.; Kollias, S.; Leontidis, G.; Jiang, S.Y.; Schamp, B.; Pearson, B. An autoencoder wavelet based deep neural network with attention mechanism for multi-step prediction of plant growth. Inf. Sci. 2021, 560, 35–50. [Google Scholar] [CrossRef]
  19. Chen, K.; Laghrouche, S.; Djerdir, A. Prognosis of fuel cell degradation under different applications using wavelet analysis and nonlinear autoregressive exogenous neural network. Renew. Energy 2021, 179, 802–814. [Google Scholar] [CrossRef]
  20. Band, S.S.; Heggy, E.; Bateni, S.M.; Karami, H.; Rabiee, M.; Samadianfard, S.; Chau, K.W.; Mosavi, A. Groundwater level prediction in arid areas using wavelet analysis and Gaussian process regression. Eng. Appl. Comput. Fluid Mech. 2021, 15, 1147–1158. [Google Scholar] [CrossRef]
  21. Li, B.; Chen, X.F. Wavelet-based numerical analysis: A review and classification. Finite Elem. Anal. Des. 2014, 81, 14–31. [Google Scholar] [CrossRef]
  22. Ma, H.; Chen, C.; Zhu, Q.; Yuan, H.T.; Chen, L.M.; Shu, M.L. An ECG Signal Classification Method Based on Dilated Causal Convolution. Comput. Math. Methods Med. 2021, 2021, 6627939. [Google Scholar] [CrossRef] [PubMed]
  23. Ahmed, K.R. Smart Pothole Detection Using Deep Learning Based on Dilated Convolution. Sensors 2021, 21, 8406. [Google Scholar] [CrossRef] [PubMed]
  24. Shafiq, C.; Gu, Z.Q. Deep Residual Learning for Image Recognition: A Survey. Appl. Sci. 2022, 12, 8972. [Google Scholar] [CrossRef]
  25. Deng, W.; Guo, Y.X.; Liu, J.; Li, Y.; Liu, D.G.; Zhu, L. A missing power data filling method based on improved random forest algorithm. Chin. J. Electr. Eng. 2019, 5, 33–39. [Google Scholar] [CrossRef]
  26. Dai, H.; Kan, J.F.; Li, W.R.; Zhou, W.D. Outlier detection for sliding window of multi-variable time series. J. Nanjing Univ. Inf. Sci. Technol. (Nat. Sci. Ed.) 2014, 6, 515–519. [Google Scholar] [CrossRef]
  27. Zhao, J.; Chen, S.F.; Liu, X.J.; Li, X.; Li, H.Y.; Lyu, Q. Outlier screening for ironmaking data on blast furnaces. Int. J. Miner. Metall. Mater. 2021, 28, 1001–1010. [Google Scholar] [CrossRef]
  28. Soheila, A.T.; Sabzevari, V.R. Early arrhythmia prediction based on Hurst index and ECG prediction using robust LMS adaptive filter. Signal Image Video Process. 2021, 15, 1813–1820. [Google Scholar]
Figure 1. Flowchart of the combined wavelet-TCN prediction method.
Separations 10 00521 g001
Figure 2. Wavelet transformation structure diagram.
Separations 10 00521 g002
Figure 3. Component of TCN. (a) Dilated convolution. (b) Residual connection.
Separations 10 00521 g003
Figure 4. Data storage of blast furnace.
Separations 10 00521 g004
Figure 5. Results of missing data processing. (a) Non-real-time discrete data. (b) Real-time continuous data.
Separations 10 00521 g005
Figure 6. Results of outlier data processing. (a) Non-real-time discrete data; (b) Real-time continuous data.
Separations 10 00521 g006
Figure 7. Trend of the vanadium content of molten iron.
Separations 10 00521 g007
Figure 8. Sequences for different wavelet transform layers.
Separations 10 00521 g008
Figure 9. Relationship between H ¯ a and R2 in different wavelet transform layers.
Separations 10 00521 g009
Figure 10. Prediction results and errors of wavelet-TCN (a = 5). (a) Prediction result. (b) Prediction errors.
Separations 10 00521 g010
Figure 11. Historical distribution of vanadium content of molten iron.
Separations 10 00521 g011
Figure 12. Relationship between V2O5 and TiO2 in sinter.
Separations 10 00521 g012
Figure 13. Relationship between fuel rate and vanadium content of molten iron.
Separations 10 00521 g013
Figure 14. Relationship between vanadium recovery and slag alkalinity and magnesium–aluminum ratio. (a) Vanadium recovery and slag alkalinity. (b) Vanadium recovery and magnesium–aluminum ratio.
Separations 10 00521 g014
Figure 15. Relationship between permeability index and vanadium load.
Separations 10 00521 g015
Table 1. Data collection and description of blast furnace.
Type of DataData ContentData FrequencyNumber
Non-real-time discrete dataTest data of raw material and fuelBatches60
Test data of slag and ironFurnaces21
Manually entered production dataHours13
Real-time continuous dataOperating parametersSeconds, hours69
Temperature of the hearth and bottomSeconds156
Temperature, pressure, and flow volume of cooling staveSeconds216
Table 2. Prediction results of different wavelet transformation layers.
ModelMAEMSER2TimeAccuracy (±0.025/%)
Wavelet-TCN (a = 1)0.01320.010040.8364121 s84.62
Wavelet-TCN (a = 2)0.01240.009610.8562154 s86.98
Wavelet-TCN (a = 3)0.01230.009630.8578193 s88.17
Wavelet-TCN (a = 4)0.01160.008860.8643241 s89.05
Wavelet-TCN (a = 5)0.01110.008100.8847295 s90.53
Wavelet-TCN (a = 6)0.01090.008030.8871371 s90.83
Wavelet-TCN (a = 7)0.01090.008040.8884598 s91.12
Table 3. Comparison of different prediction models of vanadium content.
ModelMAEMSER2Accuracy (±0.02/%)
Wavelet-TCN (a = 5)0.01110.008100.884790.53
TCN0.01480.010300.793582.54
LSTM with attention0.01500.010450.788881.66
LSTM0.01600.012690.758778.11
Disclaimer/Publisher’s Note: The statements, opinions and data contained in all publications are solely those of the individual author(s) and contributor(s) and not of MDPI and/or the editor(s). MDPI and/or the editor(s) disclaim responsibility for any injury to people or property resulting from any ideas, methods, instructions or products referred to in the content.