
Real-Time Authentication of Camellia Oil by Rapid Evaporative Ionization Mass Spectrometry

1
Chemistry and Chemical Engineering, Central South University, Changsha 410083, China
2
Hunan Provincial Institute of Product and Goods Quality Inspection, Changsha 410007, China
*
Author to whom correspondence should be addressed.
Separations 2024, 11(3), 68; https://doi.org/10.3390/separations11030068
Submission received: 18 January 2024
/
Revised: 18 February 2024
/
Accepted: 19 February 2024
/
Published: 24 February 2024
(This article belongs to the Special Issue Advances in Chromatographic Analysis of Bioactive Compounds)
Abstract
:Camellia oil is a high-value product with rich nutrients. Recently, the adulteration of camellia oil has become an increasingly concerning issue related to human health. In this study, electric soldering iron coupled with rapid evaporative ionization mass spectrometry (REIMS) was employed for the identification and analysis of camellia oil without any sample preparation. REIMS technology coupled with chemometrics was applied to develop an analysis model for the authentication of camellia oil adulterated with soybean oil, peanut oil, rapeseed oil, sunflower oil, and corn oil (5–40%, v/v). The results showed that different types of vegetable oils could be classified using principal component analysis-linear discriminant analysis (PCA-LDA) with a correct classification of 93.8% in leave-20%-out cross-validation and 100% correctly identified in real-time recognition. The established prediction models were found to be particularly sensitive when the camellia oil samples were adulterated with 5–40% of other oils, indicating that REIMS could be a powerful tool for the authentication and adulteration analysis of camellia oil, particularly for cases where the adulteration levels are relatively high. In conclusion, the results provide valuable insights into the potential of REIMS for the rapid, accurate, and real-time authentication and adulteration analysis of camellia oil.
1. Introduction
Camellia oil, a versatile vegetable oil, is an edible product derived from the mature seeds of the Camellia oleifera, a plant that is widely cultivated in southern China, specifically in regions such as Guangxi, Yunnan, and Fujian provinces, where the climate is conducive for the growth of the plant [1]. Camellia oil boasts a high content of unsaturated fatty acids and natural tea polyphenols. Camellia oil’s fatty acid composition closely resembles that of olive oil, which is commonly considered an optimal oil for human consumption [2]. Due to its health-promoting characteristics, camellia oil has been referred to as “oriental olive oil”, as it is rich in antioxidants and phytochemicals derived from its plant. In addition to its nutritional benefits, camellia oil has been reported to possess numerous health-promoting properties, including antioxidant, cardiovascular, and anti-tumor properties, and it is commonly used in the healthcare field to treat liver blood deficiency, expel parasites, benefit the intestines and stomach, and improve eyesight [3,4]. As a result of these benefits, camellia oil has been supported and endorsed by the Chinese government and the International Food and Agriculture Organization as a pure, natural edible vegetable oil [5]. As a result of increasing demand and change in consumer attitudes, the demand for camellia oil is also on the rise, which has led to a subsequent increase in the market price of camellia oil. However, compared to other commonly used edible oils such as rapeseed oil, soybean oil, and peanut oil, camellia oil is generally more expensive. This higher price point is largely due to the high cost of cultivation and production of camellia seeds. This has led some illegal traders to adulterate camellia oil with cheaper oils in order to maximize profits [6]. The addition of low-quality oils to camellia oil can lead to a significant reduction in its nutritional value and overall quality. The adulterated camellia oil can subsequently pose a significant risk to public health due to the unforeseen and potentially harmful effects of consuming these products. Thus, it is crucial to develop reliable and accurate methods for the identification and detection of adulteration in camellia seed oil, in order to protect the interests of legitimate producers and consumers alike, ensuring that the oil consumers are obtaining is of the highest quality possible.
Over these past few decades, numerous techniques have been developed and utilized for the authentication of edible oils, including Fourier Transform Infrared Spectroscopy (FT-IR) [5], infrared spectroscopy [7,8], Raman spectroscopy [9], fluorescence spectroscopy [10], gas chromatography-mass spectrometry [11], ultra-performance liquid chromatography quadrupole time-of-flight mass spectrometry [12], nuclear magnetic resonance [13], electronic nose [14], and electronic tongue [15], which are all highly sensitive and specific methods for the authentication of edible oils. Furthermore, many of these techniques were also utilized in the analysis and authentication of camellia oil. As reported by Dou and coworkers, the liquid chromatography coupled with tandem mass spectrometry was applied in the evaluation of the amounts of several key compounds, which include isoflavones, sinapic acid, and resveratrol [6]. Their results revealed that soybean oil contained four isoflavones concurrently, whereas peanut oil had only resveratrol, and rapeseed oil had significantly more sinapic acid than others. This method enables the detection of these compounds as chemical markers for the adulteration of camellia oil. In Wang’s research, fatty acid, phytosterols, and squalene were analyzed by GC and GC-MS fingerprints in conjunction with chemometrics that were employed to identify the adulteration of camellia oil with multiple vegetable oils [11]. As a result, in PCA, Camellia oil stood out with its elevated levels of triterpene alcohols, enabling it to be distinguished from other vegetable oils. By utilizing partial least squares-discriminant analysis, adulterated camellia oil, particularly when the adulterated ratio exceeded 30%, could be accurately classified with a discrimination accuracy exceeding 92.31% of the total. On the other hand, the use of electronic noses and electronic tongues, which consist of chemical sensors with distinct selectivity for data acquisition, coupled with appropriate algorithms for signal processing, also played an important role in authentication analysis [16]. In a study conducted by Wang, they used an e-nose combined with chemometrics (PCA, LDA, ANN) for the discrimination of camellia oil adulterated with maize oil [14]. The results demonstrated that the LDA model performed better than the PCA model in distinguishing the adulterated oil. However, the quantification model still requires improvement as the ANN model showed limitations in accurately determining the percentage of maize oil in camellia oil. Further research is needed to enhance the quantification capabilities of these models. In Shan’s study, four pattern recognition methods were assessed to authenticate pure camellia oil using near infrared spectroscopy [17]. The NIR spectral data was initially analyzed using unsupervised methods such as PCA and HCA. Two supervised classification techniques, DA and RBFNN, were employed to develop calibration models and predict unknown samples. The solutions achieved a correct classification rate of 98.3%. However, if the established methods require large and expensive devices or complex preprocessing, the entire detection process is time-consuming, complex, and costly, making them difficult to apply in actual situations.
Rapid evaporative ionization mass spectrometry (REIMS) is a recent form of ambient mass spectrometry, that allows in situ, real-time analysis of tissue samples [18]. Combined with mass spectrometry and a surgical diathermy device called the intelligent knife (iKnife) [19], it could achieve handheld sampling and direct analysis of the sample without preparation, generating information-rich aerosols that are then transferred via an ion transfer pathway into the mass spectrometer for accurate molecular mass analysis in a matter of seconds [20,21]. Based on REIMS, the analysis of samples does not require any sample pretreatment or liquid chromatography separation and typically takes only a few seconds to complete data collection and analysis with a high accuracy rate [22]. Meanwhile, many kinds of molecular species could be detected with the combined mass spectrometry detector.
Currently, REIMS has been successfully applied in clinical tissue resection, tumor diagnosis, microbial identification, food authentication, and other fields, providing a novel research method and approach for lipidomics research [23,24,25,26]. In terms of the identification of the species of origin or quality for food products, it is of utmost importance to have the right tools and equipment to ensure accurate and reliable results, thus providing consumers with reliable information on what they are consuming. In this respect, REIMS was used for the identification and discrimination of shrimp, animal species, Pelodiscus sinensis, beer, and fresh meat, etc. [25,27,28,29,30]. As a valid direct sampling analysis technique, REIMS provides numerous advantages when utilized as an instrument for authenticity testing. One notable benefit is its ability to drastically reduce analysis time, with results being obtained within seconds or minutes [31]. When coupled with high-resolution mass spectrometry, REIMS becomes even more powerful, enabling the generation of untargeted mass spectral profiles through in situ sampling [32]. Moreover, Black’s research showed that REIMS could be utilized to detect different fish species [33]. However, the lipid compositions of those fish samples had little difference and the following analysis was less effective, which showed that the analyzation of data was also important. These spectral profiles of authentic samples could then be submitted to exercise and validate chemometric models, employing multivariate statistical analysis algorithms. By comparing the spectral profiles of unknown samples with the validated model through similarity scoring, real-time classification can be achieved. This approach allows for the identification of unknown samples based on their similarity to the established profiles [28].
The primary focus of this research was to explore the potential of REIMS in combination with contact heating using a soldering iron. This combination was specifically aimed at authenticating camellia oil, distinguishing it from other vegetable oils, and detecting adulteration composition and content. The goal was to utilize the capabilities of REIMS to provide reliable and efficient methods for ensuring the authenticity and quality of camellia oil. Orthogonal partial least squares discriminant analysis was performed to develop qualitative and quantitative models for the identification of camellia oil adulterated with other edible oils. This technique affords a basis for establishing the requirement of real-time and high-throughput recognition of camellia oil and expanding the application fields of REIMS.
2. Materials and Methods
2.1. Reagents and Materials
Methanol in mass spectrometry grade, isopropanol, and sodium formate in chromatography grade were bought from Merck (Darmstadt, Germany). Leucine-enkephalin was purchased from Waters (Waters Corporation, Wilmslow, UK). Six types of pure plant oils, including pressed camellia oil, soybean oil, rapeseed oil, sunflower seed oil, peanut oil, and corn oil were collected from markets. Through the communication of the manufacturer and the test by the quality supervision department, these samples were all qualified pure oil products. To simulate binary mixtures for discrimination, different proportions (2%, 5%, 10%, 20%, 30%, and 40%, w/w) of soybean oil, rapeseed oil, sunflower seed oil, peanut oil, and corn oil were mixed into camellia seed oil as adulterants. The water was obtained by a Milli-Q Reference ultra-pure water generator (Millipore, Milwaukee, WI, USA).
2.2. Sample Preparation
Approximately 20 g of oil samples were poured into a sample cup. The electric soldering iron probe (ESII probe WSD151, Weller, Berlin, Germany) was used in this study, which has a similar function to the iknife [34,35]. It was heated to 500 °C and touched the sample for 0.5 s. The generated gaseous aerosols were directly collected, passed through a high-efficiency particulate air (HEPA) filter, and subjected to the mass spectrometer for data acquisition [36,37]. Each sample was repeatedly tested 5 times, and the instruments were cleaned after 10–15 times of detection by clean solvent to avoid contamination.
2.3. Analytical Conditions
The resulting aerosol was driven by a Venturi pump with nitrogen gas (2 bar) and introduced into the Xevo G2-XS Q-ToF mass spectrometer (Waters Corporation, Wilmslow, UK) through a PTFE tube. A mixture of isopropanol and leucine-enkephalin was used as an auxiliary solvent and injected into the sample chamber via a syringe pump at a flow rate of 0.1 mL/min, which was used for cleaning impurities, enhancing signal intensity, and the mass calibration. The parameters were set as follows: the scan frequency of the mass spectrometer was 1 s, the scanning range was 50–1200 m/z, the cone voltage was 10 V, the heating voltage was 30 V, the collision energy was 20–80 eV, and all data were collected in the negative ionization mode.
2.4. Optimization of REIMS Parameters
For better data collection, the heating temperatures of the electric soldering iron probe were set from 150 °C to 650 °C. Eventually, 500 °C was chosen as the optimal heating temperature [28]. The data was collected in negative ion mode, and it was found that the signal in negative ion mode was superior to that in positive ion mode. Therefore, the negative ion mode was adopted.
2.5. Data Processing
The raw data was obtained using the instrument control software package MassLynx version 4.1 (Waters Corporation, Wilmslow, UK). The construction, real-time identification, and validation of the chemical stoichiometric models of the samples were performed using the multivariate statistical software package Live IDTM (version 1.2.1172.811, Waters Corporation, Wilmslow, UK). The Live ID software was used to select the total ion current (TIC) threshold value, normalize the data results, perform grouping analysis, and establish the principal component analysis (PCA) and linear discriminant analysis (LDA) models based on those samples.
3. Results and Discussion
3.1. Mass Spectra Identification and Comparison
In order to study the chemical compositions and characteristics of different oil types, the experiments collected six representative oil samples including camellia oil, sunflower seed oil, rapeseed oil, peanut oil, corn oil, and soybean oil for further investigation. The REIMS mass spectra of six different types of oil samples were successfully generated in this study. To ensure accurate and stable data, the ion peak at m/z 554.2615 generated from the internal standard leucine-enkephalin was utilized for lock-mass correction [26]. The scanning requirements in this study set a threshold of the TIC to be no less than 1 × 10⁷, guaranteeing sufficient data for analysis.
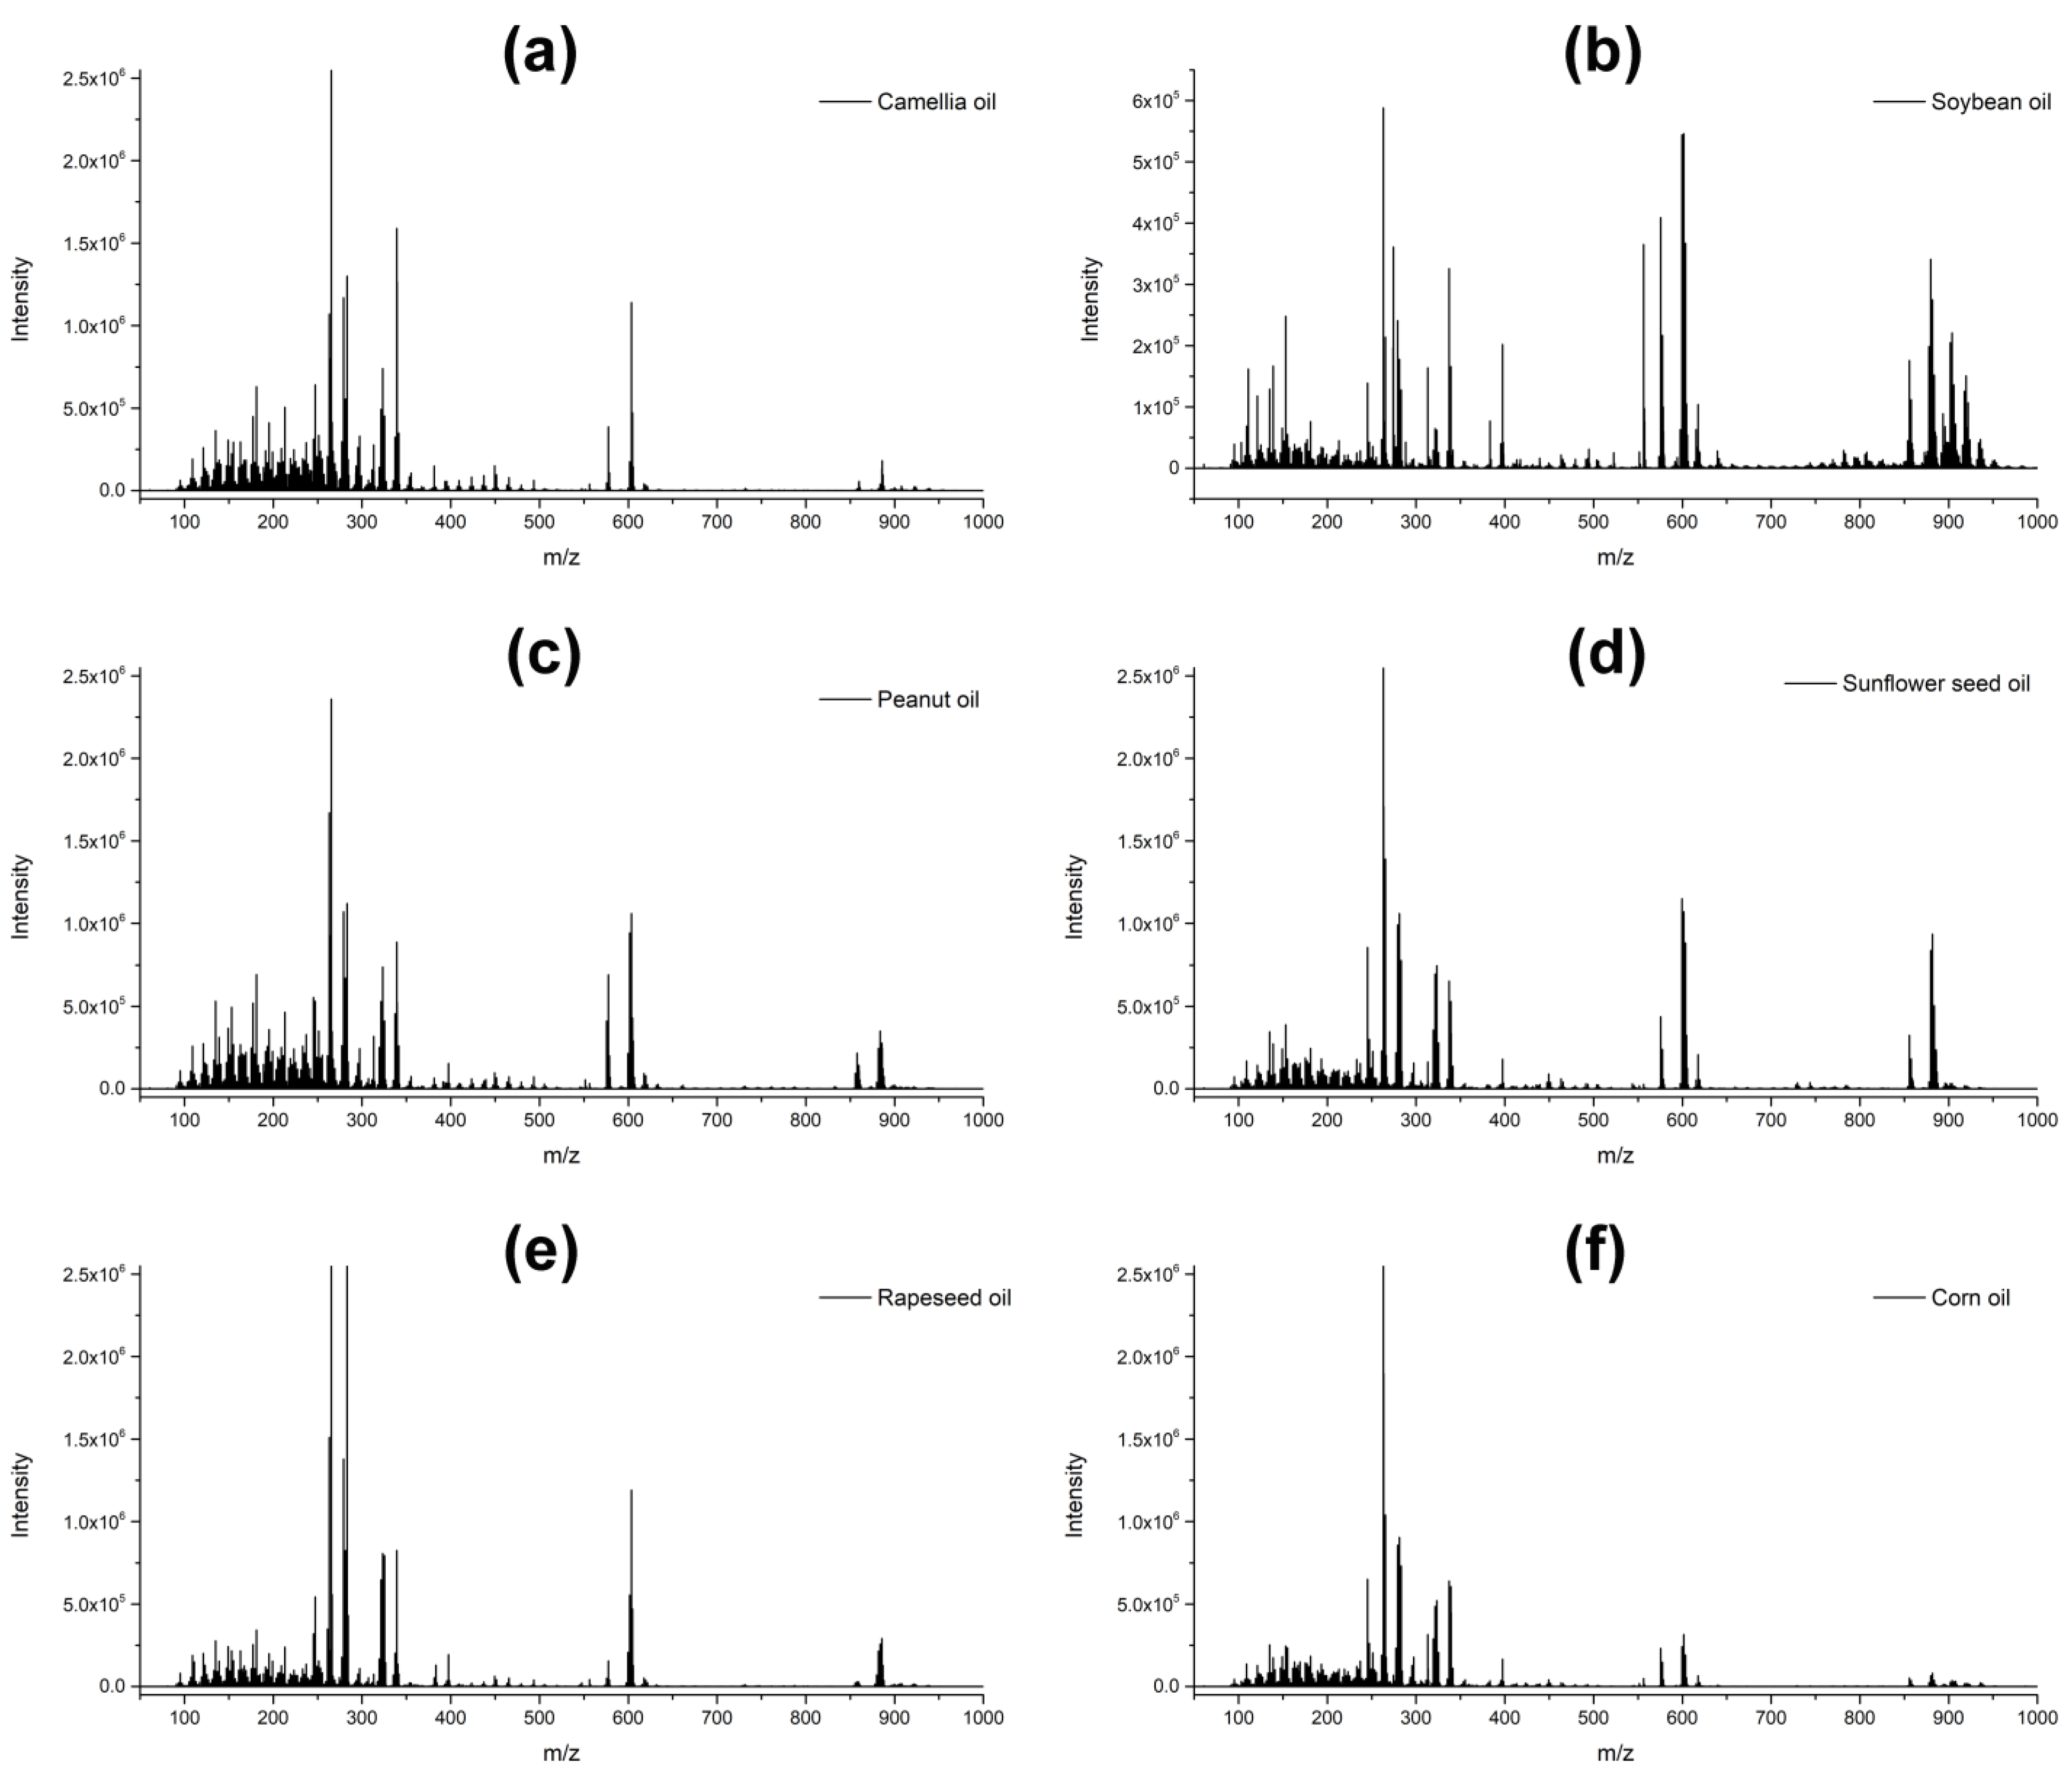
Figure 1 illustrates the TIC chromatograms and mass spectra of the six representative oil samples. The scan range was set from 50 m/z to 1200 m/z, which is sufficient to excite and detect various compounds present in the oil samples, including phenolic acids, amino acids, fatty acids, triglycerides, phospholipids, and other components. To ensure the accuracy and reliability of the test results, we adjusted the instrument parameters and ran multiple tests to ensure the repeatability of the results. The TIC chromatograms indicated distinct signal patterns for each oil category. Among them, camellia oil and sunflower seed oil exhibit relatively high signals, followed by rapeseed oil and peanut oil, while corn oil and soybean oil display comparatively weaker signals. Importantly, all signals exceed 2 × 10⁷, indicating that the electric soldering iron as our ionization method was able to produce satisfactory signal acquisition. In the comprehensive mass spectrum analysis using the REIMS technique, many small molecules could be detected. These included free fatty acids, monoglycerides, diglycerides, triacylglycerides, and others [34]. The former detected masses were between m/z 50 and 1200. However, for the purposes of building a superior statistical model, the mass range was reduced from 50–1200 m/z to 50–1000 m/z, since most ions are distributed within the mass range of 50–950 m/z. The reduction was performed to ensure that the most relevant signals for each class of molecule were captured and analyzed, which would result in a more accurate statistical model. During the ionization process, fatty acids in the m/z 100–500 range and glycerophospholipids in the m/z 600–900 range were found to be dominant [38,39]. This observation can be attributed to the high abundance and low desolvation enthalpy of fatty acids and phospholipids in the oil samples. To identify potential biomarkers, the main fragment ions were selected and identified by the software. As compiled in Table 1, these fragment ions serve as candidate biomarkers for further analysis and characterization of the oil samples.
3.2. Model Building and Validation
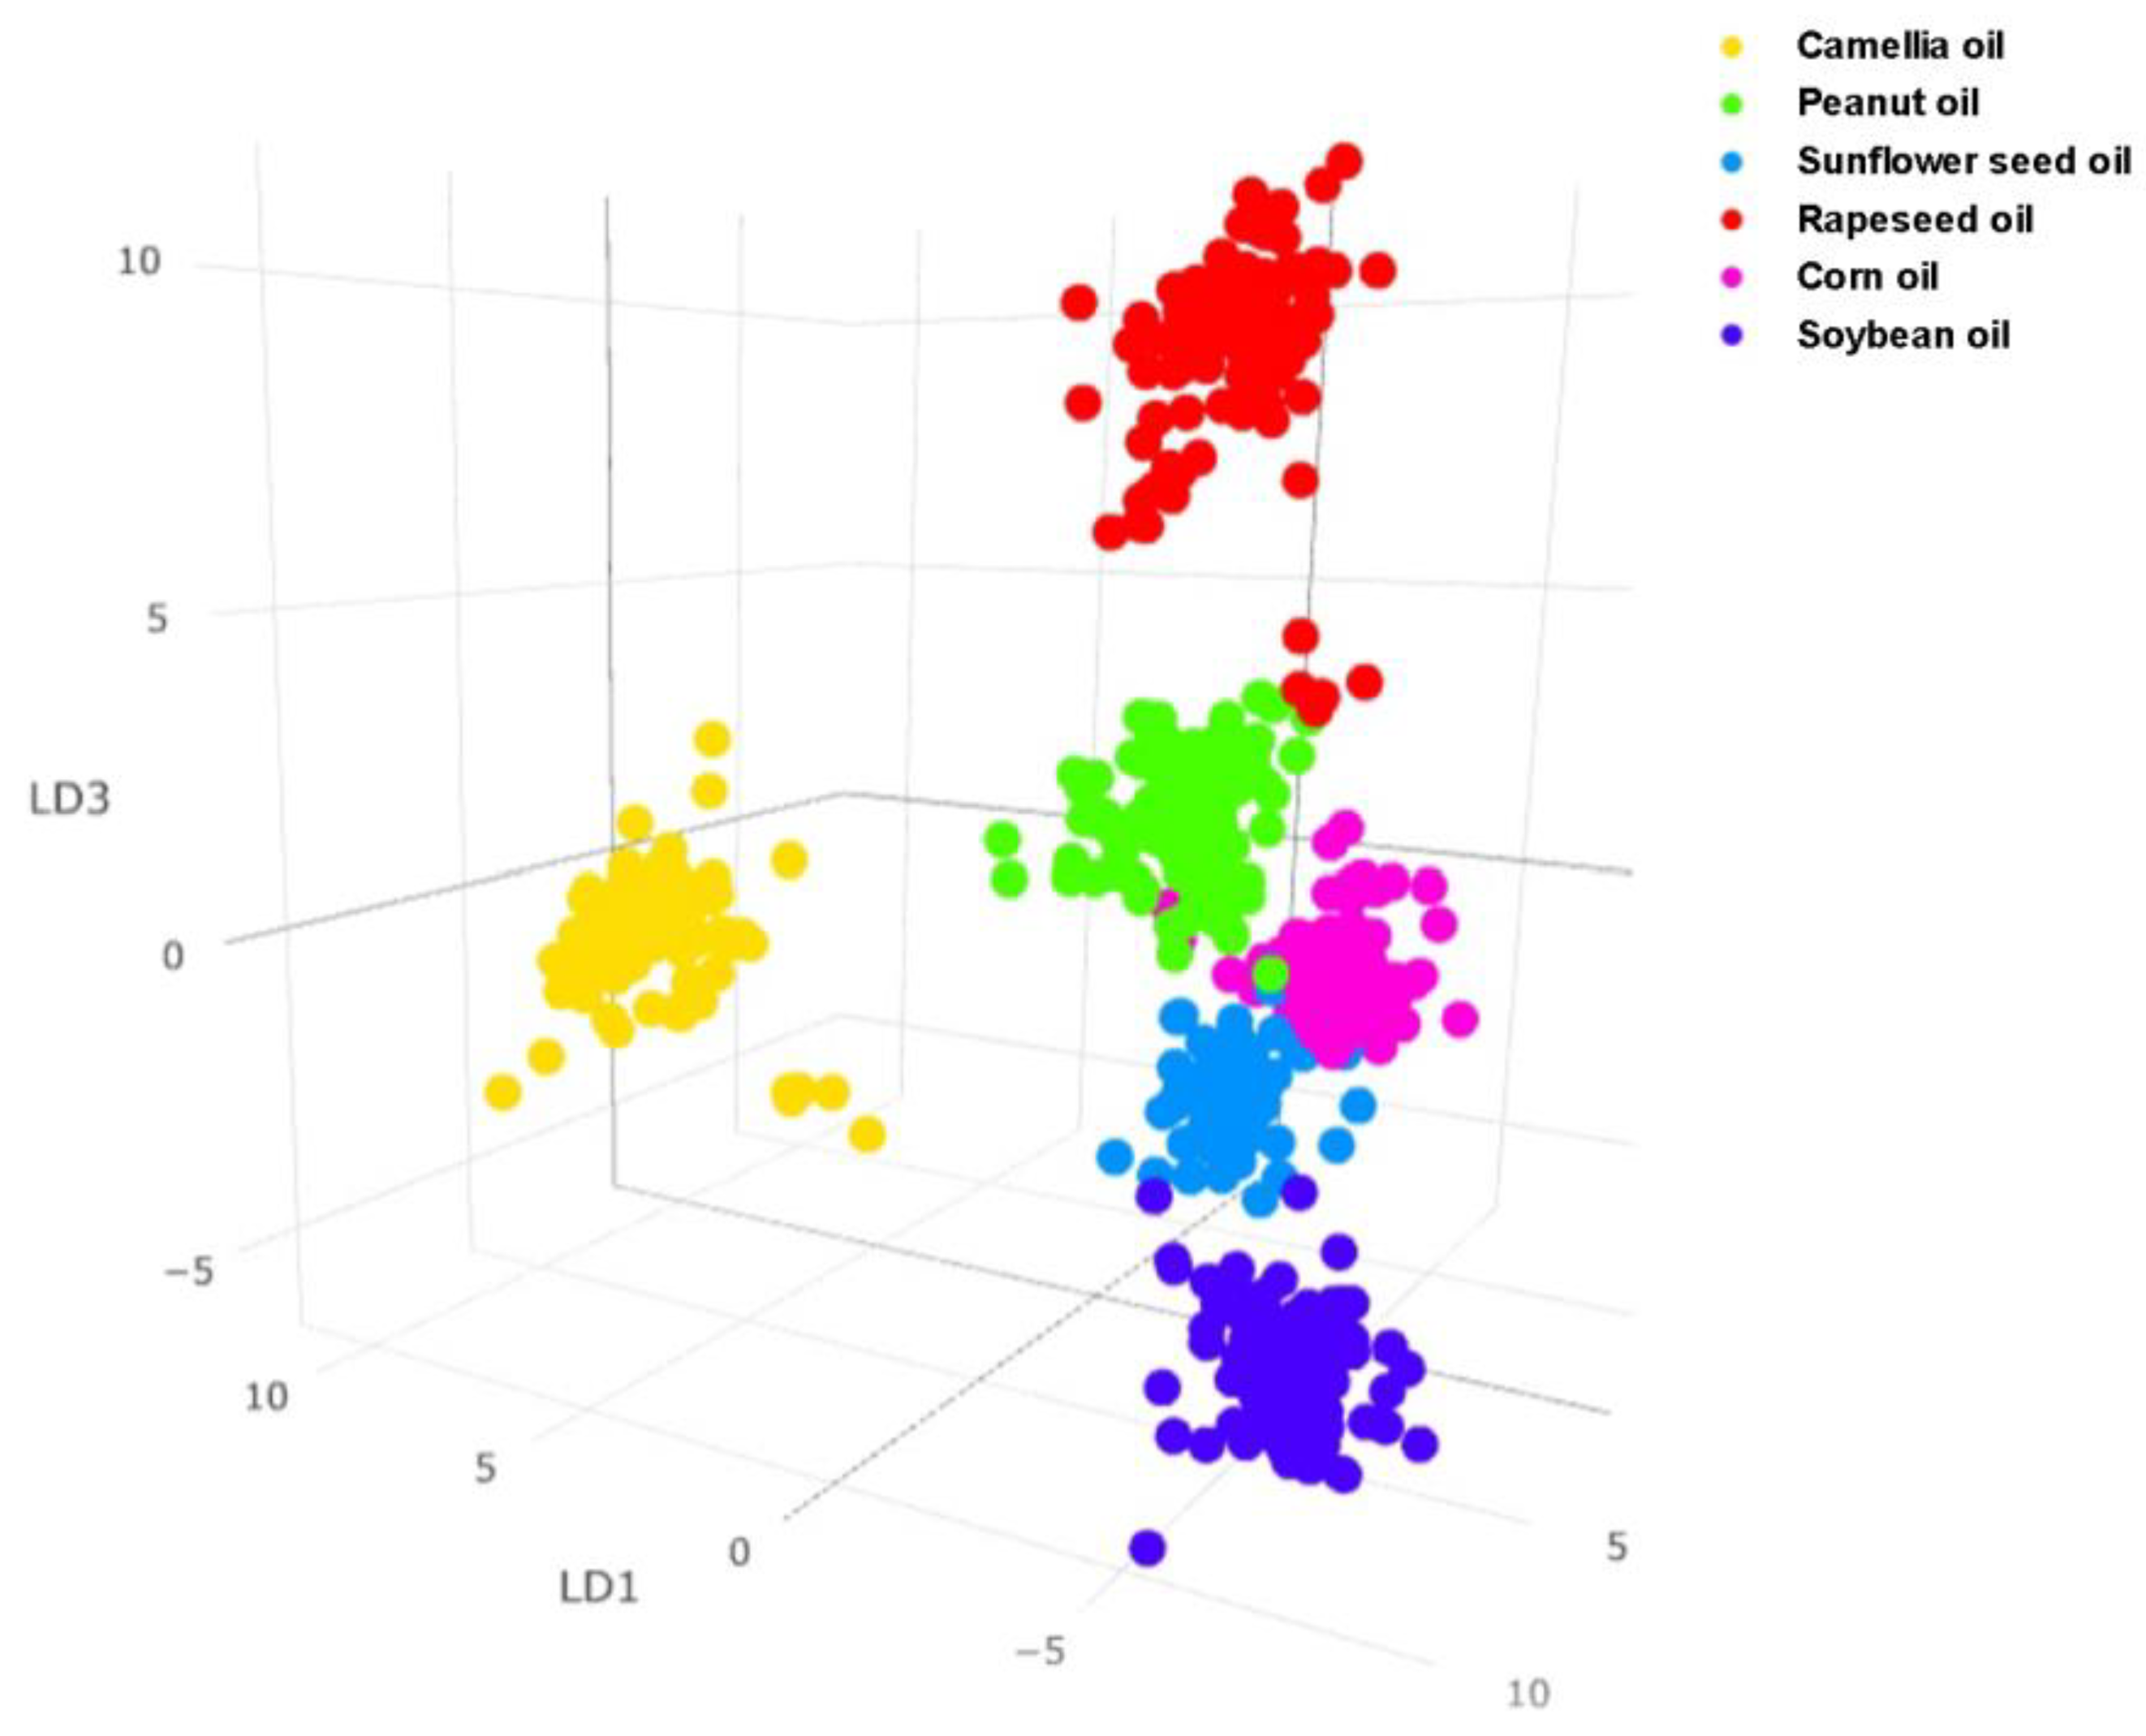
To accurately develop the chemometric model, the raw spectrometric data were meticulously acquired from authenticated samples of six different types of oil, including camellia oil (the batch number of samples, n = 28, four samples per batch), soybean oil (n = 19, five samples per batch), rapeseed oil (n = 21, four samples per batch), sunflower seed oil (n = 13, five samples per batch), peanut oil (n = 23, four samples per batch), and corn oil (n = 26, four samples per batch) for a total of 552 pieces of data. These comprehensive analyses include comprehensive data dimensionality reduction and precise pre-grouping of all data points, followed by advanced cluster analysis [40], aimed at revealing subtle spectral variations and underlying structures. PCA-LDA analysis was strategically utilized to provide a detailed representation of the classification of the different types of oils. The insightful PCA-LDA analysis facilitated clear discrimination and clustering between the different oil types, with samples of the same type grouping closely together, as displayed in Figure 2, providing a visual representation of the classification results [41]. Some parameters of the PCA-LDA model were set as follows: PCA components: 25, linear discriminants: 4, outlier setting: by standard deviation, and mass range: 50–1000 m/z. After meticulous model construction, its accuracy was critically evaluated using a robust and trusted leave-20%-out cross-validation approach, resulting in an impressive 93.8% correct classification rate, as demonstrated in Table 2, reinforcing the accuracy and reliability of the developed chemometric model [42]. Compared to other common methods of discriminating between various types of oil samples, the REIMS method possesses distinct advantages as it does not require any prior sample preparation, providing an efficient solution for the investigation of oil samples. Unlike other analytical techniques, such as GC-MS and LC-MS, REIMS is a direct analysis technique that requires only a small sample volume, making it ideal for complex and trace analysis. The method does not require the tedious and time-consuming process of pretreatment that is often necessary with other analytical techniques. The acquisition and analysis of data can be completed within a matter of seconds, allowing for a rapid and straightforward data analysis, thereby eliminating the lengthy analysis time of traditional liquid chromatography mass spectrometry technology. In addition, REIMS is capable of generating comprehensive molecular-scale information, enabling the identification and quantification of various differential compounds or metabolite ions. The ability to analyze the distribution of these ions within the oil sample can aid in the differentiation of oil types and provide valuable insights into the biological or chemical composition of the sample [25].
In this study, by using the “live-recognition” function, real-time identification of oil types for each sampling was acquired almost instantly. The LiveID™ software compared the spectral data to the database and calculated a similarity score, allowing for the real-time classification of “unknown” samples [43]. In addition, some samples were analyzed live using the prototype recognition software, which had not been previously used for generating chemometric models. As a result, all of the 24 samples were correctly classified. To provide a visual representation, Figure S1 (in Supplementary File) illustrates the software interface of LiveID, with the left list recording historic results and the right circle indicating the sample identity [29]. These results demonstrate that the established experimental method and model can effectively differentiate various plant oils and provide real-time identification. The transferability of the oil detection model demonstrated here represents a significant and powerful starting point for the potential establishment of the novel technique in the food application field. In the context of the food industry, the ability to build a model in a dedicated analytical laboratory, and then utilize this model in another laboratory for authenticity evaluation and protection of pure oil products, represents a significant advance in the effort to combat food fraud and counterfeiting. This approach could provide increased protection to consumers against counterfeit or adulterated products. By developing models that can discriminate between authentic and fraudulent products, it becomes possible to provide a more reliable means of authentication and to better safeguard the reputation of these products [43].
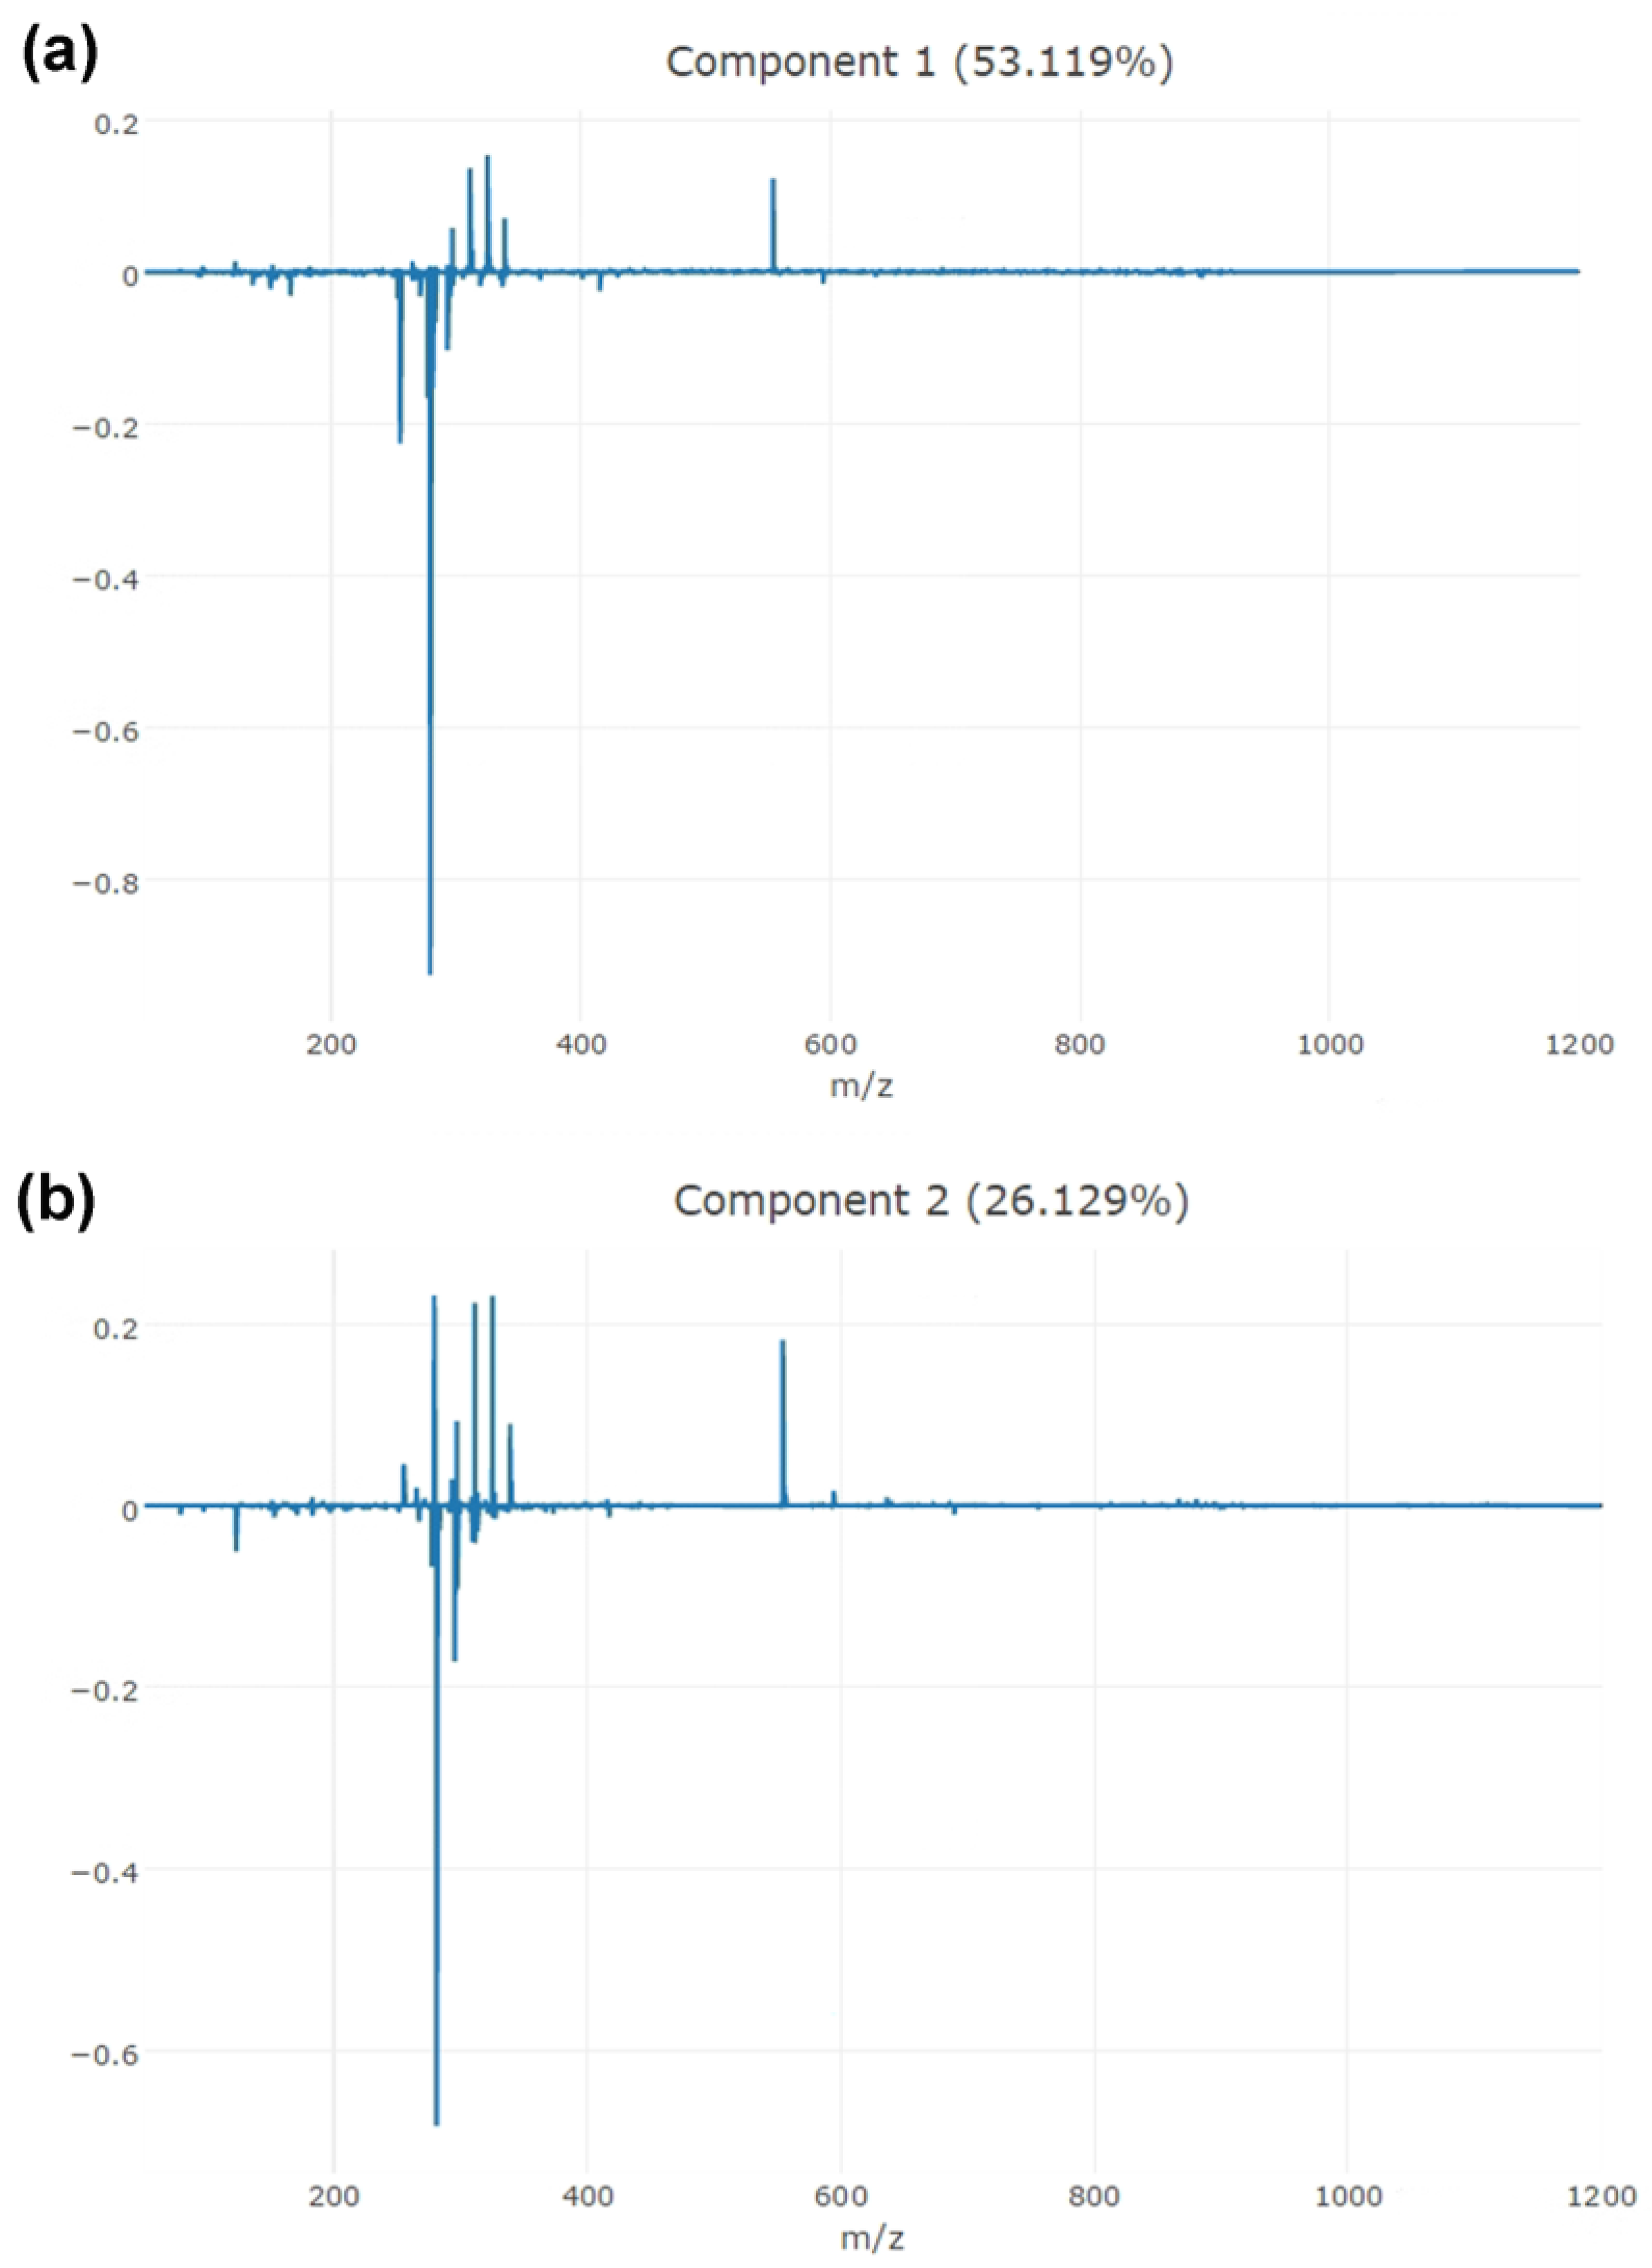
Following the construction of the chemometric models, the corresponding loading plots for the principal components were meticulously examined to identify the significant ions responsible for sample differentiation. In particular, Figure 3 depicts the loading plots for the first three components, contributing to 53%, 26%, and 7% of the discrimination, respectively. These plots offer a valuable insight into the key ions that play a crucial role in distinguishing the samples. In both cases, the base peaks were predominantly composed of fatty acid species, such as linoleic acid (m/z 279.23) in the negative direction [44]. The loading plots provide valuable information for further characterization and differentiation of oil samples.
3.3. Discrimination of Pure and Doped Camellia Oil
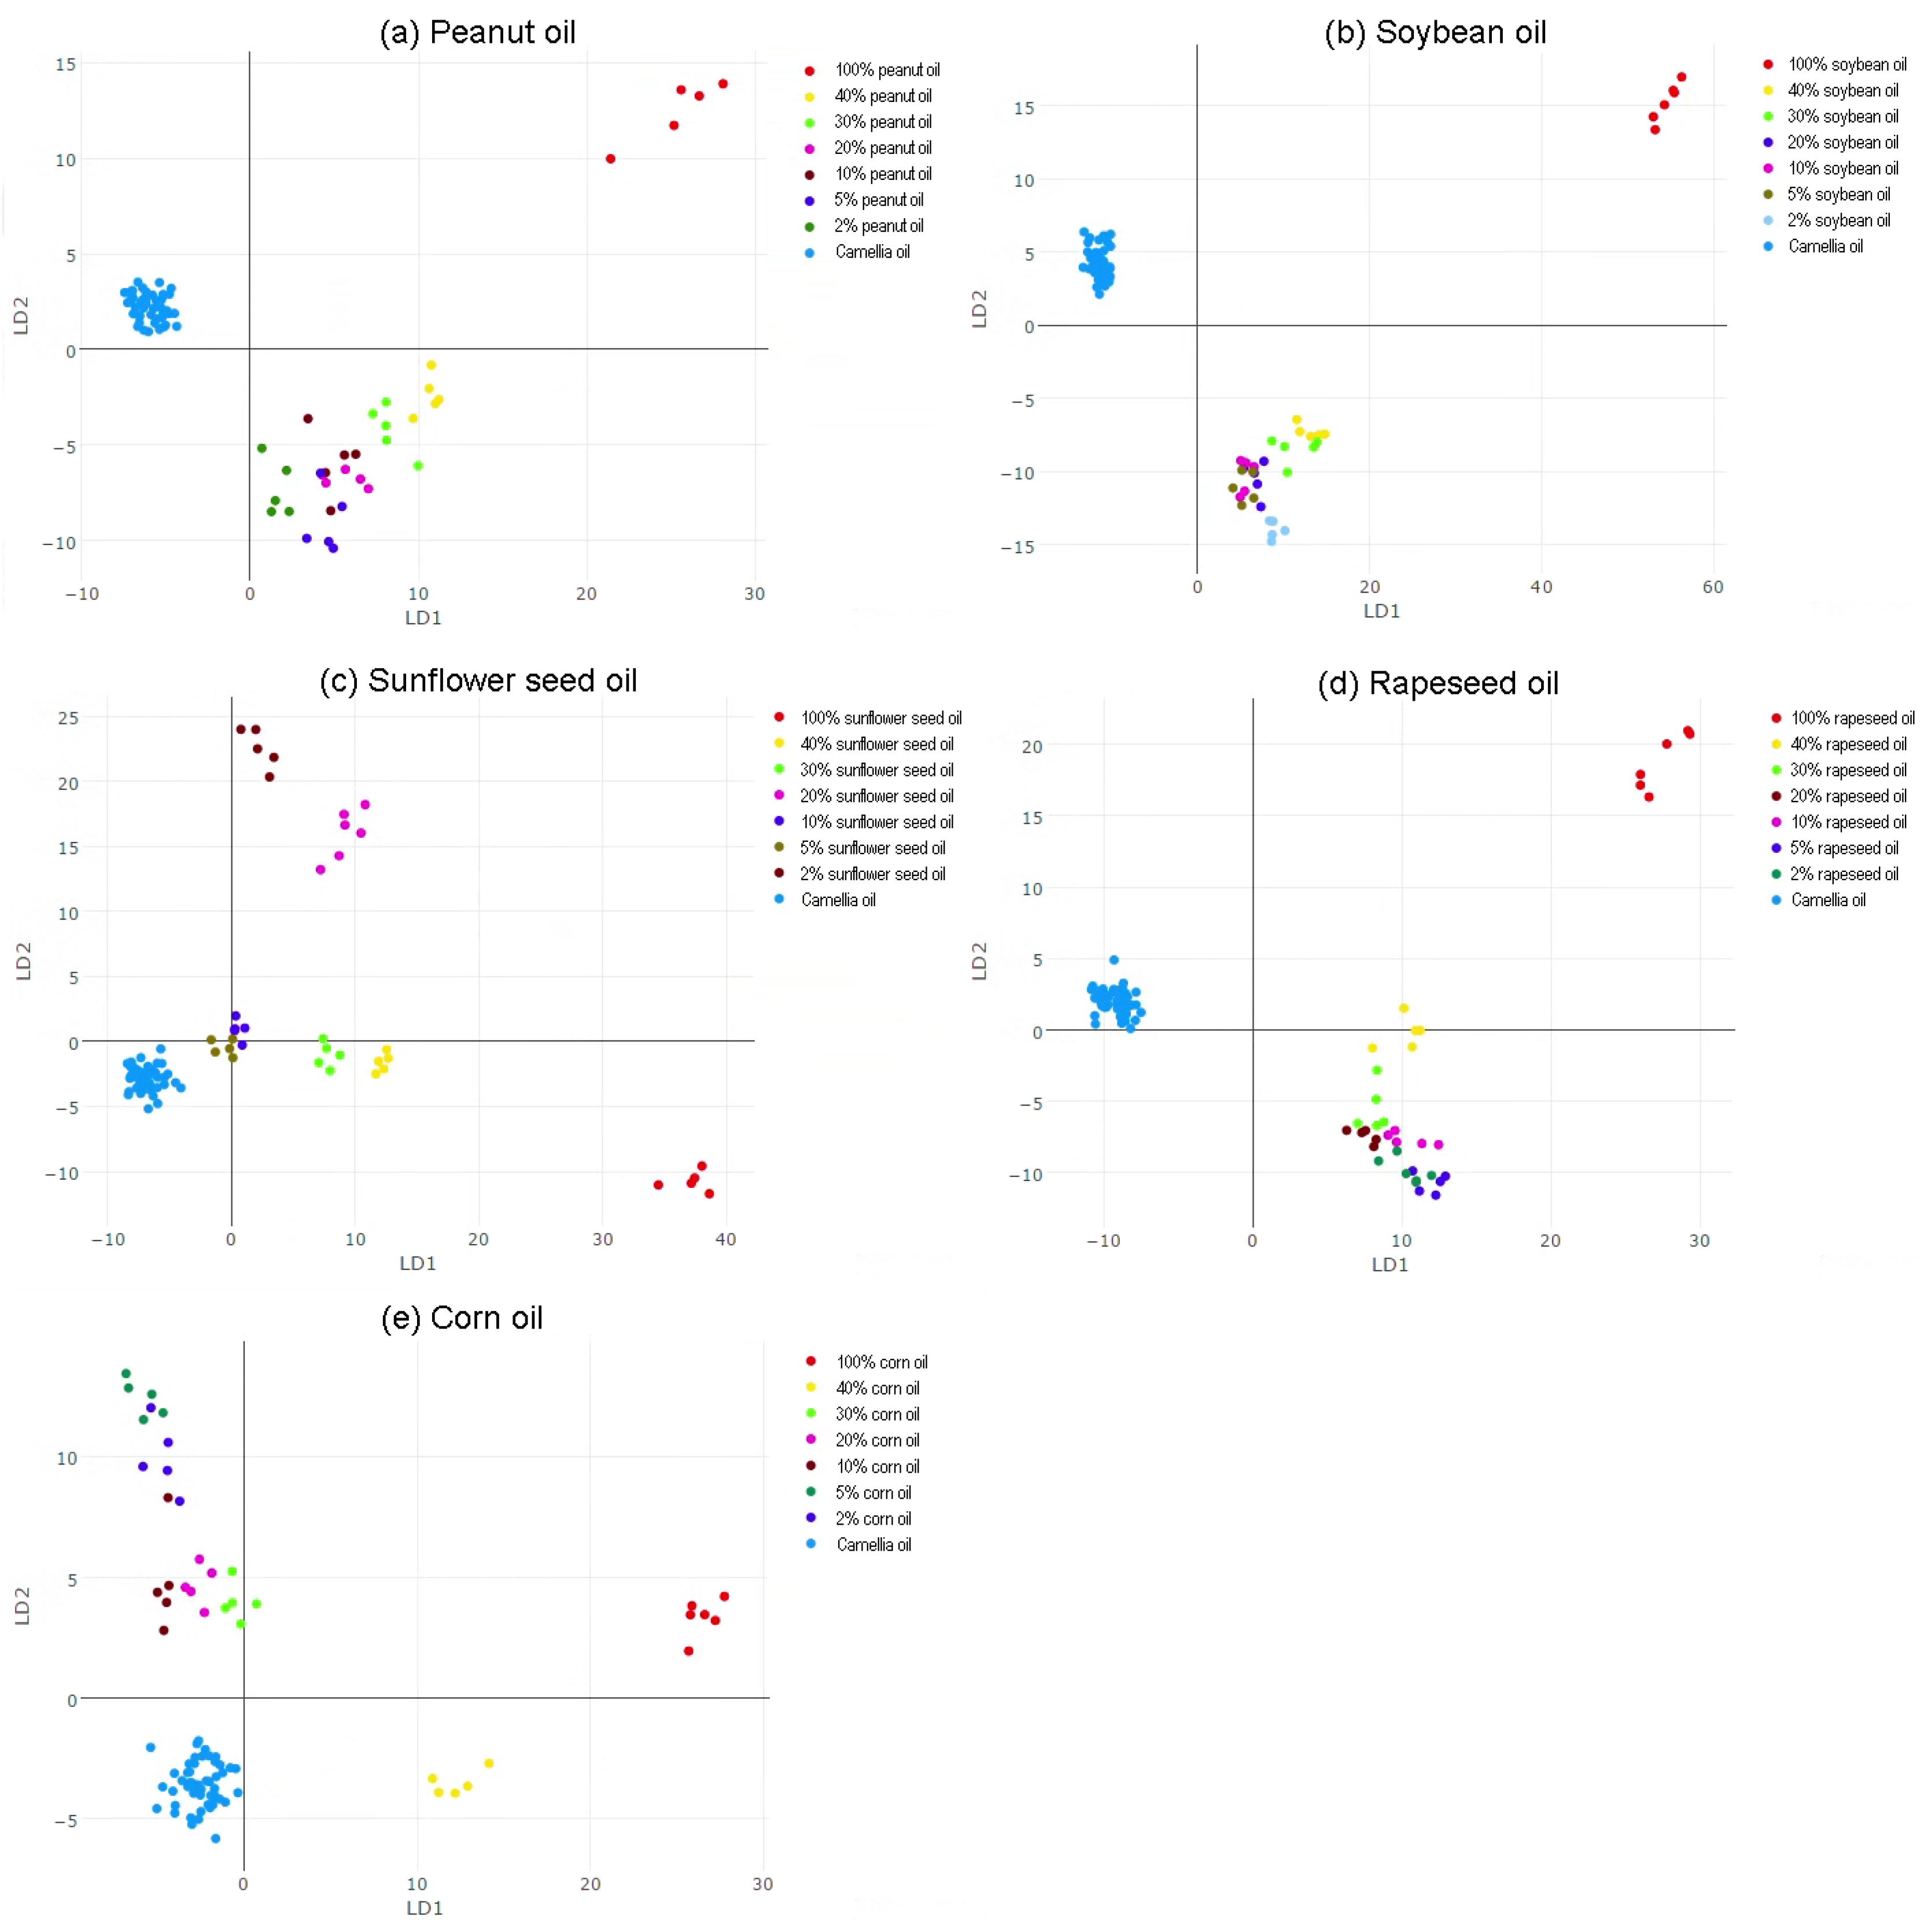
Discrimination between pure camellia oil and doped camellia oil is challenging due to the inherent similarities in their chemical makeups. The complex and intricate blend of components that make up plant oils makes it difficult to accurately differentiate between pure and doped camellia oil. Compared to the search of the individual and separated marker compounds, the chemometric approach based on a fingerprint presents greater promise and advance. In the present study, the capability of the established model was investigated with pure camellia oil together with adulterated camellia oil with soybean oil, rapeseed oil, sunflower seed oil, peanut oil, and corn oil with different levels (2%, 5%, 10%, 20%, 30%, 40%).
Figure 4 illustrates the 2D PCA-LDA analysis of the pure camellia oil and adulterated camellia oil samples. Within the five types of adulteration, the pure camellia oil samples plotted as blue points consistently appeared in the left part of the LD1 plot (the negative region). This phenomenon was consistent with the position of acacia honey in Cao’s study [31]. In contrast, the adulterated camellia oil samples were positioned in the right part of the LD1 plot (the positive region). And the position of adulterated samples was apparently far apart from that of pure camellia oil. However, the camellia oil added with corn oil was an exception. Several addition levels (lower than 30%) were still in the left part of LD1 [31]. As the proportion of adulteration increased gradually, the sample locations shifted from negative to positive along the LD1 axis. Although the trends were less apparent for samples with lower proportions of adulteration (<10%), for example, the addition of sunflower seed oil from 2% to 20% appeared less regularly than others, the changes were more distinct in samples with higher proportions of adulteration (10%, 20%, and 40%), displaying nearly linear trends towards the 100% adulterated samples. Additionally, the direction of movement is quite different from the pure camellia oil, which could be easily distinguished by operators. Nonetheless, the adulterated camellia oil with corn oils were not moved in a linear way to corn oil. It was more like an arc type movement, which was found in other research in the assessment of fruit juice adulteration (published in Chinese). Consequently, it is evident that adulterated camellia oil can be distinguished from pure camellia oil. Even at an adulteration level as low as 2% with peanut oil, soybean oil, or rapeseed oil, the adulterated camellia oil samples were discernible from the pure samples. On the other hand, differentiating between adulteration with sunflower seed oil or corn oil was more challenging due to the presence of unclear and non-linear trends. Nonetheless, when the adulteration level exceeded 20%, these oils could still be easily distinguished. These findings demonstrate the potential of combining REIMS with chemometric analysis in investigating camellia oil adulteration.
4. Conclusions
In this research, these detailed investigations proved that the application of REIMS, in combination with contact heating by using a soldering iron, provided an effective means for the thorough analysis of vegetable oil samples. Not only did it successfully authenticate the authenticity of camellia oil, but it also differentiated it from other vegetable oils and identified if it was adulterated with low-cost oils. The identification of these adulterations was accomplished in a rapid and accurate manner. The correct classification rate evaluated by the leave-20%-out cross-validation approach was 93.8%, and all of the 24 samples were correctly classified with the “live-recognition” function. The key to achieving this was the successful development and implementation of a PCA-LDA model. This model enabled the differentiation of camellia oil, which was adulterated with peanut oil, soybean oil, or rapeseed oil, from the pure sample. However, the adulteration trends of sunflower seed oil and corn oil were found to be more complex and required further detailed exploration using MS data mining techniques. In the following work, a comparison of the REIMS results with other analytical techniques would be beneficial. More types of vegetable oils including olive oil, flaxseed oil, and sesame oil could be added to the sample bank to make the model better. With the aid of new accessories, REIMS has the potential to become a powerful tool in the fields of food, medicine, and cosmetics, contributing significantly to these areas with its ability to provide accurate and timely results.
Supplementary Materials
The following supporting information can be downloaded at: https://www.mdpi.com/article/10.3390/separations11030068/s1, Figure S1: Real-time recognition of (a) camellia oil, (b) peanut oil, (c) sunflower seed oil, (d) rapeseed oil, (e) corn oil, and (f) soybean oil using the prototype recognition software.
Author Contributions
Conceptualization, Q.L.; data curation, H.J.; formal analysis, J.X.; methodology, Q.L.; project administration, X.C.; writing—original draft, J.X. and H.J.; writing—review and editing, X.C. All authors have read and agreed to the published version of the manuscript.
Funding
This work was supported by the Science and Technology Project of Hunan Market Supervision Administration (2023KJJH16).
Data Availability Statement
The data is unavailable due to privacy restrictions.
Conflicts of Interest
The authors declare no conflicts of interest.
References
- Cheng, X.; Yang, T.; Wang, Y.; Zhou, B.; Yan, L.; Teng, L.; Wang, F.; Chen, L.; He, Y.; Guo, K.; et al. New Method for Effective Identification of Adulterated Camellia Oil Basing on Camellia Oleifera-Specific DNA. Arab. J. Chem. 2018, 11, 815–826. [Google Scholar] [CrossRef]
- Su, M.H.; Shih, M.C.; Lin, K.-H. Chemical Composition of Seed Oils in Native Taiwanese Camellia Species. Food Chem. 2014, 156, 369–373. [Google Scholar] [CrossRef] [PubMed]
- Gao, L.; Jin, L.; Liu, Q.; Zhao, K.; Lin, L.; Zheng, J.; Li, C.; Chen, B.; Shen, Y. Recent Advances in the Extraction, Composition Analysis and Bioactivity of Camellia (Camellia Oleifera Abel.) Oil. Trends Food Sci. Technol. 2024, 143, 104211. [Google Scholar] [CrossRef]
- Yu, J.; Yan, H.; Wu, Y.; Wang, Y.; Xia, P. Quality Evaluation of the Oil of Camellia Spp. Foods 2022, 11, 2221. [Google Scholar] [CrossRef]
- He, W.; Lei, T. Identification of Camellia Oil Using FT-IR Spectroscopy and Chemometrics Based on Both Isolated Unsaponifiables and Vegetable Oils. Spectrochim. Acta A. Mol. Biomol. Spectrosc. 2020, 228, 117839. [Google Scholar] [CrossRef]
- Dou, X.; Mao, J.; Zhang, L.; Xie, H.; Chen, L.; Yu, L.; Ma, F.; Wang, X.; Zhang, Q.; Li, P. Multispecies Adulteration Detection of Camellia Oil by Chemical Markers. Molecules 2018, 23, 241. [Google Scholar] [CrossRef]
- Yuan, J.; Wang, C.; Chen, H.; Ye, J.; Zhou, H. Identification and Detection of Adulterated Camellia Oleifera Abel. Oils by Near Infrared Transmittance Spectroscopy. Int. J. Food Prop. 2016, 19, 300–313. [Google Scholar] [CrossRef]
- Du, Q.; Zhu, M.; Shi, T.; Luo, X.; Gan, B.; Tang, L.; Chen, Y. Adulteration Detection of Corn Oil, Rapeseed Oil and Sunflower Oil in Camellia Oil by in Situ Diffuse Reflectance near-Infrared Spectroscopy and Chemometrics. Food Control 2021, 121, 107577. [Google Scholar] [CrossRef]
- Li, Y.; Fang, T.; Zhu, S.; Huang, F.; Chen, Z.; Wang, Y. Detection of Olive Oil Adulteration with Waste Cooking Oil via Raman Spectroscopy Combined with iPLS and SiPLS. Spectrochim. Acta A Mol. Biomol. Spectrosc. 2018, 189, 37–43. [Google Scholar] [CrossRef]
- Wang, T.; Wu, H.-L.; Long, W.-J.; Hu, Y.; Cheng, L.; Chen, A.-Q.; Yu, R.-Q. Rapid Identification and Quantification of Cheaper Vegetable Oil Adulteration in Camellia Oil by Using Excitation-Emission Matrix Fluorescence Spectroscopy Combined with Chemometrics. Food Chem. 2019, 293, 348–357. [Google Scholar] [CrossRef]
- Shi, T.; Wu, G.; Jin, Q.; Wang, X. Detection of Camellia Oil Adulteration Using Chemometrics Based on Fatty Acids GC Fingerprints and Phytosterols GC–MS Fingerprints. Food Chem. 2021, 352, 129422. [Google Scholar] [CrossRef]
- Hu, Q.; Zhang, J.; Xing, R.; Yu, N.; Chen, Y. Integration of Lipidomics and Metabolomics for the Authentication of Camellia Oil by Ultra-Performance Liquid Chromatography Quadrupole Time-of-Flight Mass Spectrometry Coupled with Chemometrics. Food Chem. 2022, 373, 131534. [Google Scholar] [CrossRef]
- Zhu, M.; Shi, T.; Chen, Y.; Luo, S.; Leng, T.; Wang, Y.; Guo, C.; Xie, M. Prediction of Fatty Acid Composition in Camellia Oil by 1H NMR Combined with PLS Regression. Food Chem. 2019, 279, 339–346. [Google Scholar] [CrossRef]
- Hai, Z.; Wang, J. Detection of Adulteration in Camellia Seed Oil and Sesame Oil Using an Electronic Nose. Eur. J. Lipid Sci. Technol. 2006, 108, 116–124. [Google Scholar] [CrossRef]
- Duan, D.; Huang, Y.; Zou, Y.; He, B.; Tang, R.; Yang, L.; Zhang, Z.; Su, S.; Wang, G.; Zhang, D.; et al. Discrimination of Camellia Seed Oils Extracted by Supercritical CO2 Using Electronic Tongue Technology. Food Sci. Biotechnol. 2021, 30, 1303–1312. [Google Scholar] [CrossRef]
- Majchrzak, T.; Wojnowski, W.; Dymerski, T.; Gębicki, J.; Namieśnik, J. Electronic Noses in Classification and Quality Control of Edible Oils: A Review. Food Chem. 2018, 246, 192–201. [Google Scholar] [CrossRef]
- Li, S.; Zhu, X.; Zhang, J.; Li, G.; Su, D.; Shan, Y. Authentication of Pure Camellia Oil by Using Near Infrared Spectroscopy and Pattern Recognition Techniques. J. Food Sci. 2012, 77, C374–C380. [Google Scholar] [CrossRef] [PubMed]
- Guitton, Y.; Dervilly-Pinel, G.; Jandova, R.; Stead, S.; Takats, Z.; Le Bizec, B. Rapid Evaporative Ionisation Mass Spectrometry and Chemometrics for High-Throughput Screening of Growth Promoters in Meat Producing Animals. Food Addit. Contam. Part A 2018, 35, 900–910. [Google Scholar] [CrossRef] [PubMed]
- Tzafetas, M.; Mitra, A.; Paraskevaidi, M.; Bodai, Z.; Kalliala, I.; Bowden, S.; Lathouras, K.; Rosini, F.; Szasz, M.; Savage, A.; et al. The Intelligent Knife (iKnife) and Its Intraoperative Diagnostic Advantage for the Treatment of Cervical Disease. Proc. Natl. Acad. Sci. USA 2020, 117, 7338–7346. [Google Scholar] [CrossRef] [PubMed]
- Song, G.; Chen, K.; Wang, H.; Zhang, M.; Yu, X.; Wang, J.; Shen, Q. In Situ and Real-Time Authentication of Thunnus Species by iKnife Rapid Evaporative Ionization Mass Spectrometry Based Lipidomics without Sample Pretreatment. Food Chem. 2020, 318, 126504. [Google Scholar] [CrossRef]
- Jones, E.A.; Simon, D.; Karancsi, T.; Balog, J.; Pringle, S.D.; Takats, Z. Matrix Assisted Rapid Evaporative Ionization Mass Spectrometry. Anal. Chem. 2019, 91, 9784–9791. [Google Scholar] [CrossRef] [PubMed]
- Barlow, R.S.; Fitzgerald, A.G.; Hughes, J.M.; McMillan, K.E.; Moore, S.C.; Sikes, A.L.; Tobin, A.B.; Watkins, P.J. Rapid Evaporative Ionization Mass Spectrometry: A Review on Its Application to the Red Meat Industry with an Australian Context. Metabolites 2021, 11, 171. [Google Scholar] [CrossRef] [PubMed]
- Ross, A.; Brunius, C.; Chevallier, O.; Dervilly, G.; Elliott, C.; Guitton, Y.; Prenni, J.; Savolainen, O.; Hemeryck, L.; Vidkjær, N.; et al. Making Complex Measurements of Meat Composition Fast: Application of Rapid Evaporative Ionisation Mass Spectrometry to Measuring Meat Quality and Fraud. Meat Sci. 2021, 181, 108333. [Google Scholar] [CrossRef] [PubMed]
- Strittmatter, N.; Jones, E.; Veselkov, K.; Rebec, M.; Bundy, J.; Takats, Z. Analysis of Intact Bacteria Using Rapid Evaporative Ionisation Mass Spectrometry. Chem. Commun. 2013, 49, 6188–6190. [Google Scholar] [CrossRef]
- He, Q.; Yang, M.; Chen, X.; Yan, X.; Li, Y.; He, M.; Liu, T.; Chen, F.; Zhang, F. Differentiation between Fresh and Frozen-Thawed Meat Using Rapid Evaporative Ionization Mass Spectrometry: The Case of Beef Muscle. J. Agric. Food Chem. 2021, 69, 5709–5724. [Google Scholar] [CrossRef]
- Shen, Q.; Song, G.; Zhao, Q.; Wang, P.; Yang, H.; Xue, J.; Wang, H.; Cui, Y.; Wang, H. Detection of Lipidomics Characterization of Tuna Meat during Different Wet-Aging Stages Using iKnife Rapid Evaporative Ionization Mass Spectrometry. Food Res. Int. 2022, 156, 111307. [Google Scholar] [CrossRef]
- Lu, W.; Wang, P.; Ge, L.; Chen, X.; Guo, S.; Zhao, Q.; Zhu, X.; Cui, Y.; Zhang, M.; Chen, K.; et al. Real-Time Authentication of Minced Shrimp by Rapid Evaporative Ionization Mass Spectrometry. Food Chem. 2022, 383, 132432. [Google Scholar] [CrossRef]
- Gao, H.; Lin, J.; Jia, X.; Zhao, Y.; Wang, S.; Bai, H.; Ma, Q. Real-Time Authentication of Animal Species Origin of Leather Products Using Rapid Evaporative Ionization Mass Spectrometry and Chemometric Analysis. Talanta 2021, 225, 122069. [Google Scholar] [CrossRef]
- Shen, Q.; Wang, J.; Li, S.; Rao, W.; Wang, Y.; Wang, H. In Situ Rapid Evaporative Ionization Mass Spectrometry Method for Real-Time Discrimination of Pelodiscus Sinensis in Different Culturing Modes without Sample Preparation. Food Anal. Methods 2019, 12, 2699–2708. [Google Scholar] [CrossRef]
- Cardoso, V.; Sabin, G.; Hantao, L. Rapid Evaporative Ionization Mass Spectrometry (REIMS) Combined with Chemometrics for Real-Time Beer Analysis. Anal. Methods 2022, 14, 1540–1546. [Google Scholar] [CrossRef] [PubMed]
- Wang, H.; Cao, X.; Han, T.; Pei, H.; Ren, H.; Stead, S. A Novel Methodology for Real-Time Identification of the Botanical Origins and Adulteration of Honey by Rapid Evaporative Ionization Mass Spectrometry. Food Control 2019, 106, 106753. [Google Scholar] [CrossRef]
- Robson, K.; Birse, N.; Chevallier, O.; Elliott, C. Metabolomic Profiling to Detect Different Forms of Beef Fraud Using Rapid Evaporative Ionisation Mass Spectrometry (REIMS). NPJ Sci. Food 2022, 6, 9. [Google Scholar] [CrossRef] [PubMed]
- Black, C.; Chevallier, O.P.; Haughey, S.A.; Balog, J.; Stead, S.; Pringle, S.D.; Riina, M.V.; Martucci, F.; Acutis, P.L.; Morris, M.; et al. A Real Time Metabolomic Profiling Approach to Detecting Fish Fraud Using Rapid Evaporative Ionisation Mass Spectrometry. Metabolomics 2017, 13, 153. [Google Scholar] [CrossRef]
- Song, G.; Li, L.; Wang, H.; Zhang, M.; Yu, X.; Wang, J.; Shen, Q. Electric Soldering Iron Ionization Mass Spectrometry Based Lipidomics for in Situ Monitoring Fish Oil Oxidation Characteristics during Storage. J. Agric. Food Chem. 2020, 68, 2240–2248. [Google Scholar] [CrossRef] [PubMed]
- Song, G.; Wang, H.; Zhang, M.; Zhang, Y.; Wang, H.; Yu, X.; Wang, J.; Shen, Q. Real-Time Monitoring of the Oxidation Characteristics of Antarctic Krill Oil (Euphausia superba) during Storage by Electric Soldering Iron Ionization Mass Spectrometry-Based Lipidomics. J. Agric. Food Chem. 2020, 68, 1457–1467. [Google Scholar] [CrossRef]
- Strittmatter, N.; Lovrics, A.; Sessler, J.; McKenzie, J.S.; Bodai, Z.; Doria, M.L.; Kucsma, N.; Szakacs, G.; Takats, Z. Shotgun Lipidomic Profiling of the NCI60 Cell Line Panel Using Rapid Evaporative Ionization Mass Spectrometry. Anal. Chem. 2016, 88, 7507–7514. [Google Scholar] [CrossRef] [PubMed]
- LaFranchi, B.W.; Petrucci, G.A. A Comprehensive Characterization of Photoelectron Resonance Capture Ionization Aerosol Mass Spectrometry for the Quantitative and Qualitative Analysis of Organic Particulate Matter. Int. J. Mass Spectrom. 2006, 258, 120–133. [Google Scholar] [CrossRef]
- Liu, T.; Wang, W.; He, M.; Chen, F.; Liu, J.; Yang, M.; Guo, W.; Zhang, F. Real-Time Traceability of Sorghum Origin by Soldering Iron-Based Rapid Evaporative Ionization Mass Spectrometry and Chemometrics. Electrophoresis 2022, 43, 1841–1849. [Google Scholar] [CrossRef]
- Balog, J.; Kumar, S.; Alexander, J.; Golf, O.; Huang, J.; Wiggins, T.; Abbassi-Ghadi, N.; Enyedi, A.; Kacska, S.; Kinross, J.; et al. In Vivo Endoscopic Tissue Identification by Rapid Evaporative Ionization Mass Spectrometry (REIMS). Angew. Chem. Int. Ed. 2015, 54, 11059–11062. [Google Scholar] [CrossRef]
- Lin, Y.; Wang, H.; Rao, W.; Cui, Y.; Yu, X.; Dai, Z.; Shen, Q. Rapid Evaporative Ionization Mass Spectrometry-Based Lipidomics Tracking of Grass Carp (Ctenopharyngodon idellus) during In Vitro Multiple-Stage Digestion. J. Agric. Food Chem. 2018, 66, 6246–6253. [Google Scholar] [CrossRef]
- Song, G.; Zhang, M.; Zhang, Y.; Wang, H.; Li, S.; Dai, Z.; Shen, Q. In Situ Method for Real-Time Discriminating Salmon and Rainbow Trout without Sample Preparation Using iKnife and Rapid Evaporative Ionization Mass Spectrometry-Based Lipidomics. J. Agric. Food Chem. 2019, 67, 4679–4688. [Google Scholar] [CrossRef] [PubMed]
- Wen, W.; Zhao, X.; Wang, H.; Cao, X. A Real-Time Metabolomic Profiling Approach to Identify Virgin Olive Oil Adulteration by Rapid Evaporative Ionization Mass Spectrometry. Food Anal. Methods 2023, 16, 985–996. [Google Scholar] [CrossRef]
- Rigano, F.; Stead, S.; Mangraviti, D.; Jandova, R.; Petit, D.; Marino, N.; Mondello, L. Use of an “Intelligent Knife” (Iknife), Based on the Rapid Evaporative Ionization Mass Spectrometry Technology, for Authenticity Assessment of Pistachio Samples. Food Anal. Methods 2019, 12, 558–568. [Google Scholar] [CrossRef]
- Cui, Y.; Wang, H.; Zhao, Q.; Zhu, X.; Wang, P.; Xue, J.; Chen, K.; Shen, Q. Real-Time Detection of Authenticity and Adulteration of Krill Phospholipids with Soybean Phospholipids Using Rapid Evaporative Ionization Mass Spectrometry: Application on Commercial Samples. Food Control 2021, 121, 107680. [Google Scholar] [CrossRef]
Figure 1.
The mass spectrums of (a) camellia oil, (b) soybean oil, (c) peanut oil, (d) sunflower seed oil, (e) rapeseed oil, and (f) corn oil.
Figure 1.
The mass spectrums of (a) camellia oil, (b) soybean oil, (c) peanut oil, (d) sunflower seed oil, (e) rapeseed oil, and (f) corn oil.

Figure 2.
Three-dimensional visualization of the principal component analysis (PCA)/linear discriminant analysis (LDA) model.
Figure 2.
Three-dimensional visualization of the principal component analysis (PCA)/linear discriminant analysis (LDA) model.

Figure 3.
Loadings plot PCA/LDA model showing the m/z features responsible for the discrimination in the (a) first component, (b) second component, and (c) third component in the region between 500–1200 m/z.
Figure 3.
Loadings plot PCA/LDA model showing the m/z features responsible for the discrimination in the (a) first component, (b) second component, and (c) third component in the region between 500–1200 m/z.

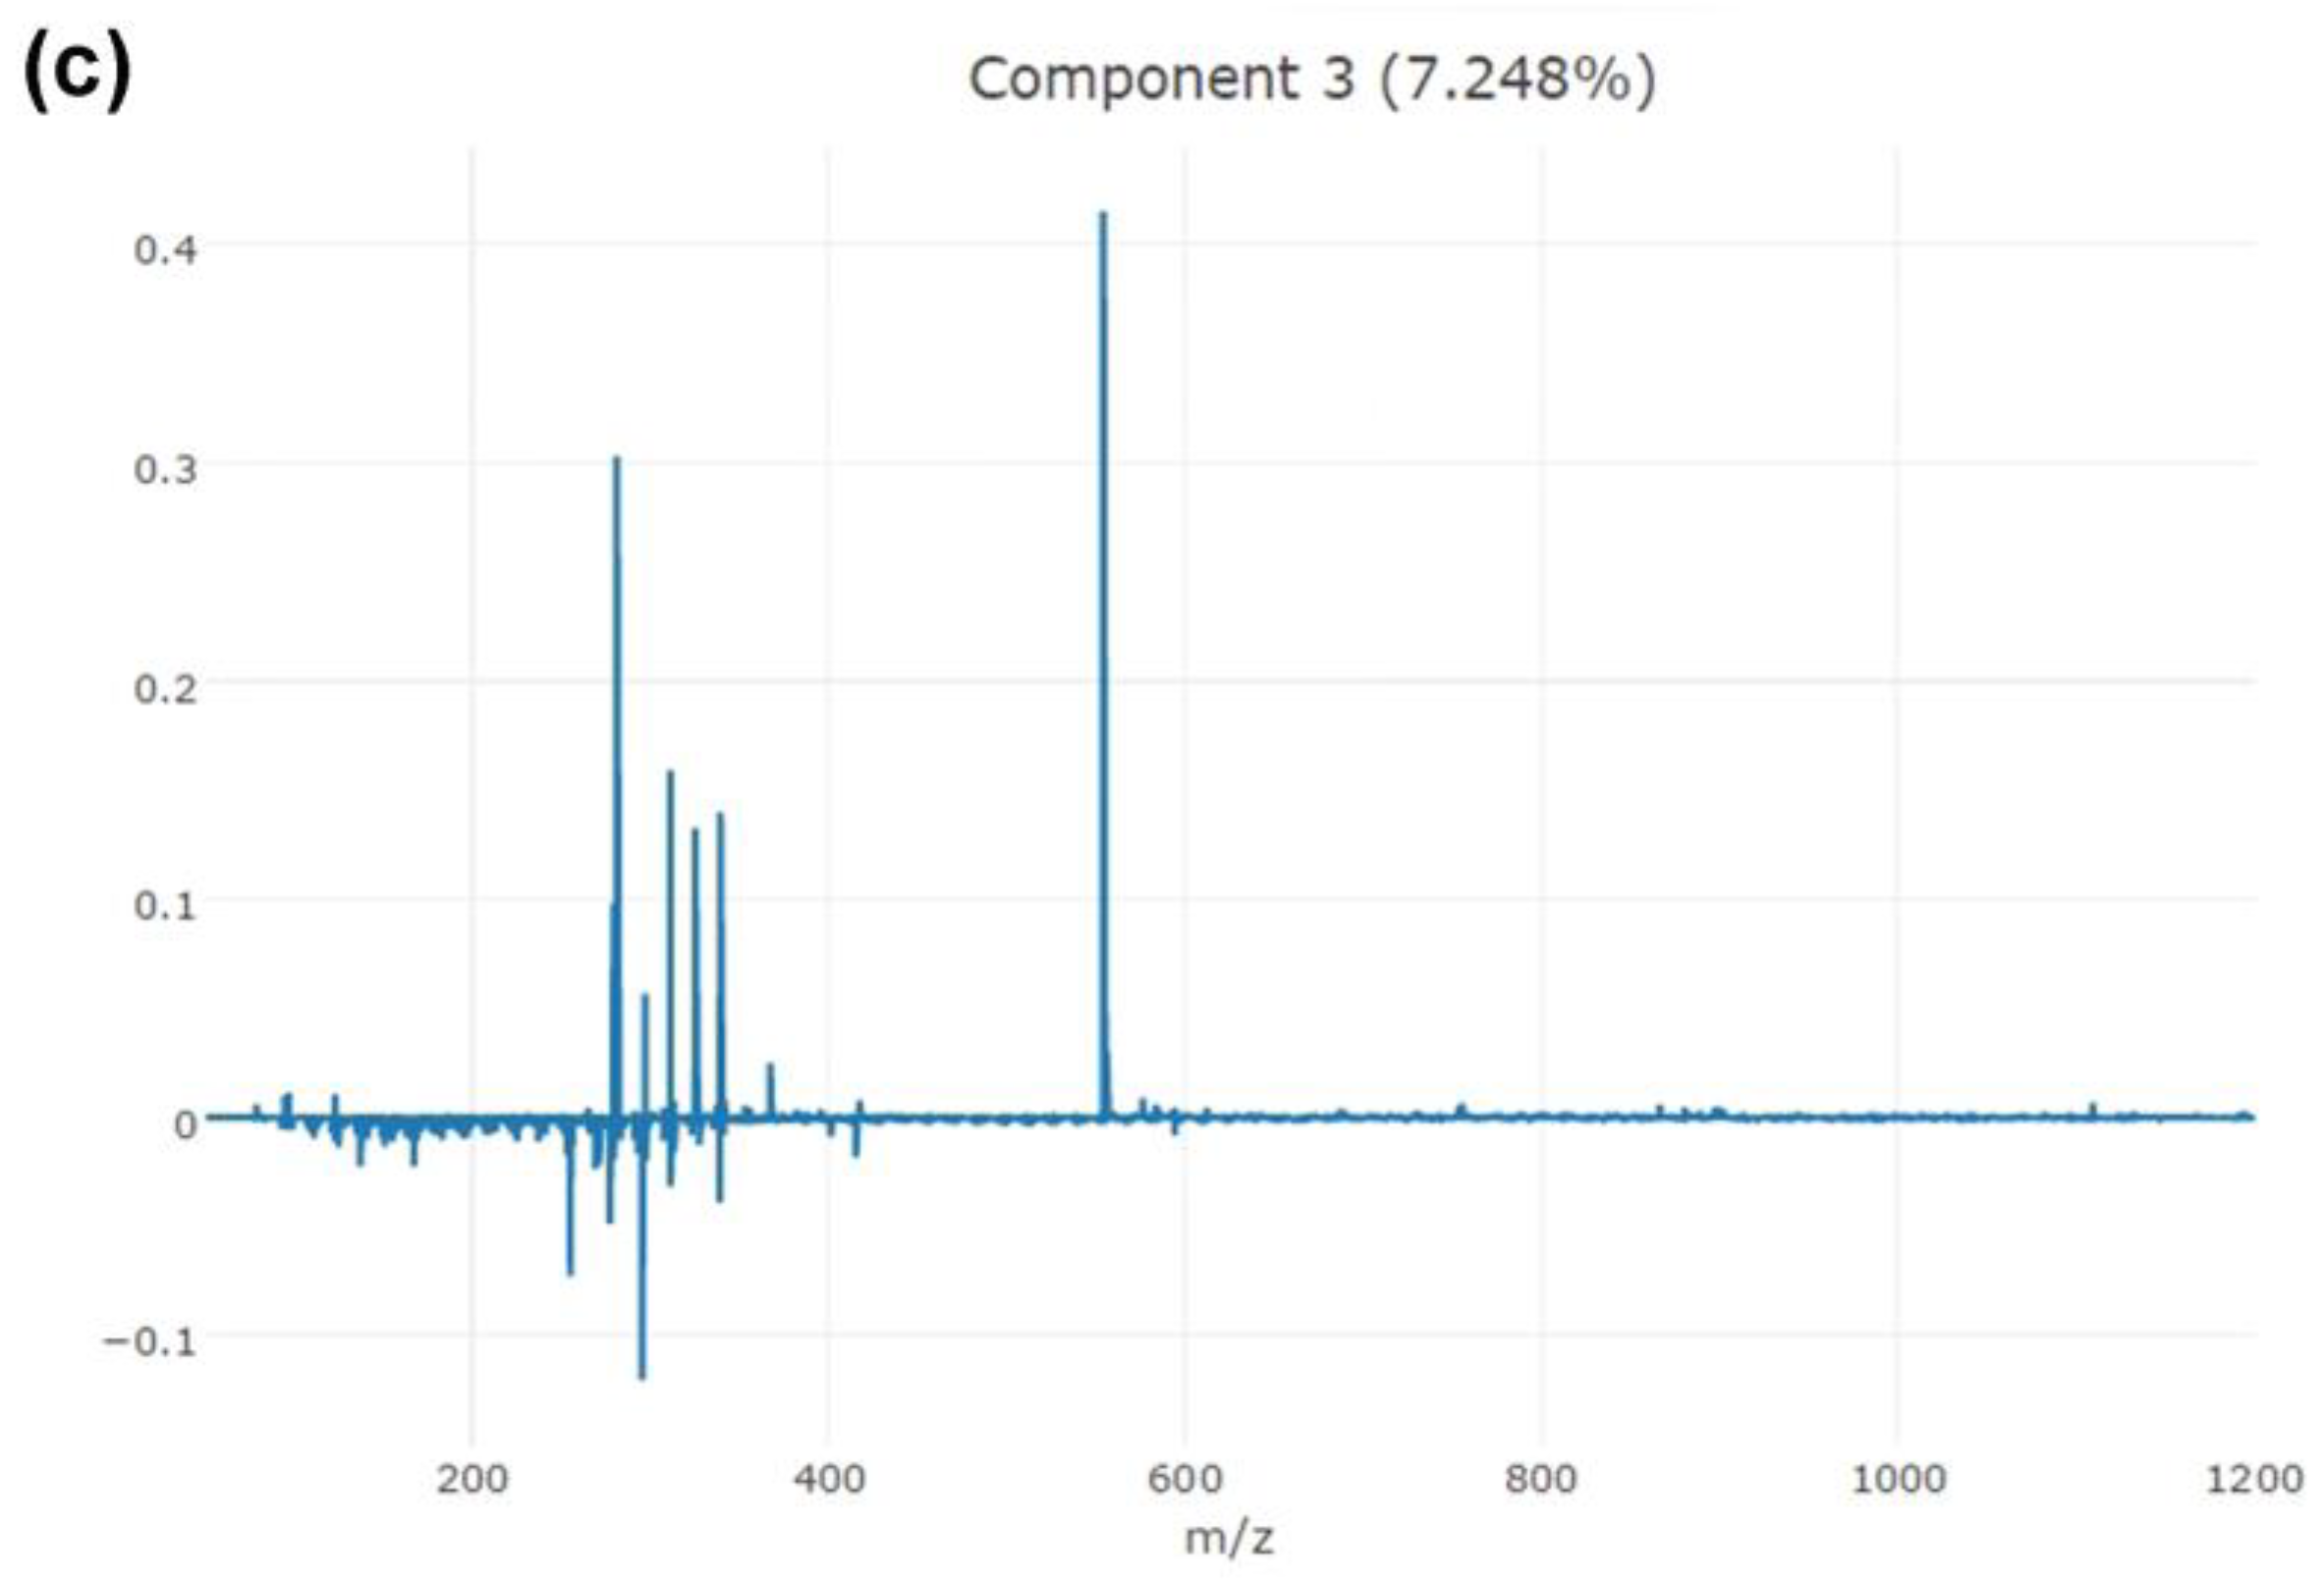
Figure 4.
Two-dimension PCA-LDA analysis of camellia oil adulterated with (a) peanut oil, (b) soybean oil, (c) sunflower seed oil, (d) rapeseed oil, and (e) corn oil at different levels.
Figure 4.
Two-dimension PCA-LDA analysis of camellia oil adulterated with (a) peanut oil, (b) soybean oil, (c) sunflower seed oil, (d) rapeseed oil, and (e) corn oil at different levels.


Table 1.
Putative attribution of the corresponding spectrometric peak ranged from m/z 250 to 900 in samples.
Table 1.
Putative attribution of the corresponding spectrometric peak ranged from m/z 250 to 900 in samples.
| Significant Ion (m/z) | Tentative Assignment | Main Class | Formula |
|---|---|---|---|
| 271.2259 | Juniperic acid | Fatty acids and conjugates | C16H32O3 |
| 275.1991 | Parinaric acid | Fatty acids and conjugates | C18H28O2 |
| 277.2156 | Pinolenic acid | Fatty acids and conjugates | C18H30O2 |
| 305.2462 | Sciadonic acid | Fatty acids and conjugates | C20H34O2 |
| 307.2616 | 20:2 (7Z,14Z) | Fatty acids and conjugates | C20H36O2 |
| 321.2767 | 21:2 (5Z,14Z) | Fatty acids and conjugates | C21H38O2 |
| 337.309 | 22:1 (7Z) | Fatty acids and conjugates | C22H42O2 |
| 339.3248 | Behenic acid | Fatty acids and conjugates | C22H44O2 |
| 367.3553 | Lignoceric acid | Fatty acids and conjugates | C24H48O2 |
| 395.3858 | Cerotic acid | Fatty acids and conjugates | C26H52O2 |
| 727.4859 | PG (P-16:0/18:3) | Phosphatidylglycerols | C40H73O9P |
| 729.5021 | PG (O-16:0/18:3) | Phosphatidylglycerols | C40H75O9P |
| 753.501 | PG (P-18:0/18:4) | Phosphatidylglycerols | C42H75O9P |
| 755.5164 | PG (O-18:0/18:4) | Phosphatidylglycerols | C42H77O9P |
| 853.7217 | TG (15:0/18:4/19:0) | Triacylglycerols | C55H98O6 |
| 881.752 | TG (18:1/18:1/18:2) | Triacylglycerols | C57H102O6 |
| 883.7704 | TG (18:1/18:1/18:1) | Triacylglycerols | C57H=O6 |
| 887.7182 | TG (15:1/18:4/22:3) | Triacylglycerols | C58H96O6 |
| 889.7326 | TG (18:3/18:3/19:1) | Triacylglycerols | C58H98O6 |
Table 2.
Results of the leave-20%-out.
| Camellia Oil | Peanut Oil | Sunflower Seed Oil | Rapeseed Oil | Corn Oil | Soybean Oil | Outlier | Total | |
|---|---|---|---|---|---|---|---|---|
| Camellia oil | 137 | 0 | 0 | 0 | 0 | 0 | 4 | 141 |
| Peanut oil | 0 | 110 | 0 | 0 | 0 | 0 | 5 | 115 |
| Sunflower seed oil | 0 | 0 | 57 | 0 | 0 | 0 | 8 | 65 |
| Rapeseed oil | 0 | 0 | 0 | 92 | 0 | 0 | 8 | 100 |
| Corn oil | 0 | 0 | 0 | 0 | 124 | 0 | 6 | 130 |
| Soybean oil | 0 | 0 | 0 | 0 | 0 | 86 | 9 | 95 |
Disclaimer/Publisher’s Note: The statements, opinions and data contained in all publications are solely those of the individual author(s) and contributor(s) and not of MDPI and/or the editor(s). MDPI and/or the editor(s) disclaim responsibility for any injury to people or property resulting from any ideas, methods, instructions or products referred to in the content. |
© 2024 by the authors. Licensee MDPI, Basel, Switzerland. This article is an open access article distributed under the terms and conditions of the Creative Commons Attribution (CC BY) license (https://creativecommons.org/licenses/by/4.0/).
Share and Cite
MDPI and ACS Style
Xiang, J.; Liu, Q.; Jing, H.; Chen, X. Real-Time Authentication of Camellia Oil by Rapid Evaporative Ionization Mass Spectrometry. Separations 2024, 11, 68. https://doi.org/10.3390/separations11030068
AMA Style
Xiang J, Liu Q, Jing H, Chen X. Real-Time Authentication of Camellia Oil by Rapid Evaporative Ionization Mass Spectrometry. Separations. 2024; 11(3):68. https://doi.org/10.3390/separations11030068
Chicago/Turabian StyleXiang, Jun, Qi Liu, Huihua Jing, and Xiaoqing Chen. 2024. "Real-Time Authentication of Camellia Oil by Rapid Evaporative Ionization Mass Spectrometry" Separations 11, no. 3: 68. https://doi.org/10.3390/separations11030068
Note that from the first issue of 2016, this journal uses article numbers instead of page numbers. See further details here.