Article

Cymbopogon citratus Water Extract and Methyl Jasmonate Improve Polyunsaturated Fatty Acid Metabolism in Taiwanofungus camphoratus Mycelia

1
National Juncao Technology Research Center, College of Life Sciences, Fujian Agriculture and Forestry University, Fuzhou 350002, China
2
College of Juncao and Ecology, Fujian Agriculture and Forestry University, Fuzhou 350002, China
3
College of Life Sciences, Longyan University, Longyan 364400, China
*
Author to whom correspondence should be addressed.
Separations 2024, 11(4), 127; https://doi.org/10.3390/separations11040127
Submission received: 15 March 2024 / Revised: 12 April 2024 / Accepted: 15 April 2024 / Published: 19 April 2024
(This article belongs to the Special Issue Research Progress for Isolation of Plant Active Compounds)

Abstract

:
A rare medicinal fungus called Taiwanofungus camphoratus gives people resistance to illness. In order to effectively obtain high−quality T. camphoratus mycelia, we added Cymbopogon citratus (lemongrass) water extract (LWE), which was prepared using hot water and dry lemongrass leaves and methyl jasmonate (MJ) as an additive, in order to cultivate T. camphoratus mycelia. The components of LWE were identified by gas chromatography–mass spectrometry as glucose (61.66%) and galactose (17.10%). Compare to the basal medium, 0.5–2.5 g·L−1 LWE and 5–25 μmol·L−1 MJ can enhance the proliferation of mycelia and the metabolism of polyunsaturated fatty acids (PUFAs). Among them, the T. camphoratus mycelia growth rate increased to 1.292 ± 0.01 cm·d−1 and 1.285 ± 0.05 cm·d−1, improving by 2.5 g·L−1 LWE and 25 μmol·L−1 MJ, respectively. PUFAs are mainly composed of linoleic acid (LA) and oleic acid (OA). The contents of LA and OA were 0.28 ± 0.02 mg·g−1 and 0.23 ± 0.05 mg·g−1 after MJ treatment, while the contents of LA and OA were 0.08 ± 0.03 mg·g−1 and 0.05 ± 0.05 mg·g−1 after LWE treatment. Transcriptome analyses revealed that 367 and 232 genes within MJ and LWE treatment were significantly different from the basal medium. Out of 13 unigenes, FAD22, SCD, and FAD21 had the highest expression levels according to the quantitative RT−PCR result. The bioinformatics analysis showed that three genes are closely related to the M8 chromosome of T. camphoratus, and they are hydrophobic transmembrane proteins. The identification and investigation of fatty acid genes in T. camphoratus mycelia will be improved by our findings.

1. Introduction

Taiwanofungus camphoratus (also known as Antrodia camphorate and Antrodia cinnamomea) is a well−known, valuable, medicinal mushroom found in Taiwan province, China. It belongs to the phylum Basidiomycetes, the family Polyporaceae, and the genus Taiwanofungus. Its fruiting bodies contain triterpenoids [1,2], polysaccharides [3], adenosine [4], proteins [5], and many active ingredients, giving it significant anticancer [6,7], antihepatoma [8], antitumor [9], anti−inflammatory [10], antifatigue [11], and liver−protecting [12] properties. However, despite their well−known medicinal properties, the fruiting bodies and mycelia of T. camphoratus grow slowly and have obvious host specificity, taking up to 3–5 years to reach maturity. Therefore, it is difficult to supply T. camphoratus products in large quantities and to meet market demand [13]. Previous research has shown that talc increases the permeability and fluidity of the T. camphoratus cell membrane, deregulates its key genes, and improves its biosynthesis process, enhancing the yield of Antrodin C from the submerged fermentation of T. camphoratus [14]. In addition, the cultivation of T. camphoratus by various sulfates has confirmed that CuSO4 and ZnSO4 increase the mycelia content by 25% and 20%, respectively [15]. Furthermore, squalene as an additive plays a vital role in regulating the assembly of T. camphoratus polysaccharides and their biological activity [16]. Moreover, the content of fatty acids in the mycelia is probably related to the growth of edible and medicinal fungi [17], and the addition of products that promote metabolism and mycelia growth could enhance the growth of T. camphoratus.
Cymbopogon citratus (Lemongrass) is an herbaceous plant with a lemony aroma. It is not only used as a seasoning, but also has antibacterial [18], analgesic [19], and anti-inflammatory functions [20] and has been widely used in the food and pharmaceutical industries [21]. Lemongrass water extract (LWE), which is a solid brown power extracted by using hot water on dry lemongrass, is rich in antioxidants [22] and is used in skincare products [23] and antibacterial compounds [24]. LWE was found to significantly reduce the total cholesterol and low-density lipoprotein contents, as well as the arteriosclerosis index in rats. Furthermore, hot−water−soluble polysaccharide extracted from Cymbopogon can be used in cancer therapies [25]. Methyl jasmonate (MJ), an endogenous hormone that is widely distributed in plants, regulates multiple metabolic pathways and can induce the expression of defense genes to enhance resistance to diseases, insects, or cold [26]. It can also increase the activity of antioxidant-related enzymes [27]. MJ was found to reduce oxidative stress by increasing the activity of antioxidant enzymes [28] and the accumulation of arsenic by regulating arsenic transporters [29], thus increasing the yields of two rice varieties under conditions of arsenic toxicity [30]. MJ is also an effective plant growth regulator that enhances carotenoid accumulation in maize sprouts by upregulating the expression of key genes involved in the carotenoid biosynthetic pathway [31]. MJ can induce the biosynthesis of ganoderic acid, which is the main active component in Ganoderma lucidum [32]. MJ regulates the post−harvest quality of mushrooms, which may be related to the level of free 1,4-butanediamine [33,34].
In previous research, the growth of some mushrooms have been linked to the content of polyunsaturated fatty acids (PUFAs). PUFAs are long−chain fatty acids with two or more carbon–carbon double bonds with 18–22 carbons. They are essential fatty acids for humans and animals and can only be consumed in vitro. PUFAs maintain membrane fluidity, inhibit inflammatory processes, reduce monocyte–macrophage proinflammatory cytokine secretion, reduce susceptibility to ventricular rhythm disturbances, and improve endothelial function [35]. The great variety of edible mushrooms found worldwide and their consistent production of fatty acids, regardless of the geographic source, make them an important source of essential fatty acids within a healthy human diet. Their lipid profiles include essential fatty acids such as the linoleic acids (LAs), oleic acids (OAs), and linolenic acids, which act against cardiovascular diseases [36]. LA is a PUFA that has anti-tumor activity against cytotoxic T lymphocytes (CD8+T) cells in vitro and in vivo and can be considered an enhancer of adoptive T cell therapy in cancer therapy [37]. LA also can improve insulin sensitivity, peripheral glucose uptake, insulin secretion, and pancreatic β−cell function; moreover, it can reduce inflammation and the risk of cardiometabolic disease [38,39]. As an essential fatty acid, OA has beneficial effects on the cardiovascular system by inhibiting calcium-activated chloride channel transmembrane protein 16A (TMEM16A) through an allosteric mechanism [40]. Regarding the effects of PUFAs on mushroom growth, OA has been shown to trigger betulinic acid biosynthesis and mycelia growth in the medicinal mushroom Inonotus obliquus [41]. The percentage of these fatty acids (in 100 g of total fatty acids) in mushrooms varies greatly: for example, linoleic acid ranges from 0.0–81.1%, OA between 1.0 and 60.3%, and LA from 0.0–28.8% [42].
In order to study the effects of LWE and MJ on metabolism and mycelia growth in T. camphoratus, we added them to the mycelia that we were cultivating for our study to alleviate the market scarcity of this product and deal with T. camphoratus fruiting bodies’ slow growth. The genes linked to the pathway of unsaturated fatty acid synthesis were identified, and the role of LWE and MJ in the synthesis of unsaturated fatty acids in T. camphoratus mycelia was clarified. This information was combined with the content of unsaturated fatty acids in the mycelia of T. camphoratus and transcriptome technology. The triterpene content of T. camphoratus and related synthetic genes have been the subject of previous research. Our findings may be utilized to ascertain whether future applications of fruiting bodies may be boosted by promoting mycelial growth and a higher effective PUFA content.

2. Materials and Methods

2.1. LWE Preparation and Monosaccharide Composition Analysis

LWE was prepared according to the method of Koh et al. with some modifications [43]. For this process, 50 g of dry lemongrass leaves (moisture below 14%) was placed in 650 mL of distilled water and soaked overnight at room temperature. Then, the mixture was steamed at 64 °C for 2 h, the leaching solution was collected, and 350 mL of distilled water was added to steam for another 2 h. The two concentrated leachables were mixed together to obtain a volume of 85 mL, and 4 times the volume of 95% ethanol was added overnight. We centrifuged the precipitate at 4000 r·min−1 and 4 °C for 10 min. The precipitate was dissolved with pure water, and one-third Sevag reagent (n−butanol–chloroform = 1:4) was added for 20 min. The solution was transferred into a centrifuge tube and centrifuged at 4000 r·min−1 and 4 °C for 10 min. The upper polysaccharide solution without organic solvent was collected and dried at 65 °C. The LWE was kept at 4 °C for further study.
Then, 1 g of LWE was combined with 1 mL of 2 mol·L−1 trifluoroacetic acid (TFA) solution and heated with nitrogen at 121 °C for 2 h. The mixture was dissolved with anhydrous methanol in a chromatographic bottle and dried again with nitrogen, and this step was repeated 3 times. Each sample (5 μL) was dissolved in sterile water in a blow-dry chromatographic bottle and detected by a Thermo ICS 5000 ion chromatography system (Thermo, Waltham, MA, USA) to analyze the monosaccharide components electrochemically. The liquid chromatograph column was a Dionex™ CarboPac™ PA20 (150 × 3.0 mm, 10 μm) [44]. The monosaccharide content was characterized using an absolute quantitative method [45]. Ten monosaccharide standards (Solarbio, Peking, China) were used to prepare a standard mother liquor solution. When used, different concentrations of standards PMP were formulated for derivatization and injection. The peak area (y) was used to perform linear regression on the injection amount x (μg) of the standard, and the correlation coefficient and regression equation of the monosaccharide derivative were obtained.

2.2. Growth of T. camphoratus Mycelia

T. camphoratus mycelia were cultured in basal medium (CK) as a control (2.5 g·L−1 glucose, 0.5 g·L−1 peptone, 0.3 g·L−1 maltose, 0.3 g·L−1 yeast, 0.1 g·L−1 KH2PO4, 0.1 g·L−1 MgSO4·7H2O, 0.1 g·L−1 VB1, 2 g·L−1 agar, sterilized at 121 °C for 25 min). The mycelia were cultured in separate batches with 0.5, 1, 1.5, 2.0, and 2.5 g·L−1 LWE in basal medium. MJ was added to the medium in separate batches at concentrations of 5, 10, 15, 20, and 25 μmol·L−1. For each treatment, 3 replicates were placed in the incubator and kept at 28 °C in the dark for 28 days [46]. The growth rate of T. camphoratus mycelia was observed, photographed, and recorded every 7 days, and the average growth rate was calculated using the cross intersect method.

2.3. LA and OA Contents

For the analysis of the LA and OA contents, 2 g of fresh mycelia was dried at 60 °C in the oven (Jiangnan, Jiangsu, China), milled to a powder, packed into a Soxhlet extractor, and soaked in petroleum ether at room temperature for 36 h. After cold soaking at 4 °C for 4 h, the crude oil was extracted by heating and refluxing for 6 h and then evaporated. Then, 5 mg of crude oil was mixed with 2 mL of 0.4 mol·L−1 NaOH–methanol solution, and 10 mL of saturated NaCl was added at room temperature for 5–10 min. The upper liquid was taken out and analyzed by gas chromatography–mass spectrometry (GC−MS; Agilent, Santa Clara, CA, USA) [47]. The HP-5MS column (Agilent, Santa Clara, CA, USA) was 0.25 mm × 30 cm × 0.25 mm in size and had a pressure of 30 kPa. The flow rate of 99.99% helium was 1 mL·min−1 with a 5:1 split ratio, and the conditions were 280 °C and 30 kPa at the inlet. The temperature rise began from an initial column temperature of 150 °C (maintained for 3 min). It then increased to 200 °C by 10 °C·min−1, 220 °C by 5 °C·min−1, and 280 °C by 10 °C·min−1, with a solvent delay of 2 min [48]. The mass spectrum conditions were followed by an EI ion source temperature of 280 °C, an electron energy of 70 eV, and a mass scanning range of 20–600 atomic mass units. The mass spectra of the extracted fatty acids were analyzed by GC−MS, and the reference standard spectra were automatically retrieved from the National Institute of Standards and Technology Library (NIST05). The fatty acid content in the mycelia of T. camphoratus was characterized using an external standard method. LA and OA standards were purchased from Chengdu Must Biotechnology Co., Ltd. (Must, Chengdu, China). The content of the substance calculated using the following external standard method:
LA and OA content = (peak area of target compound of sample/peak area of external standard compound) × concentration of external standard compound × (sample volume/volume of external standard solution) [49].

2.4. Transcriptome Analysis of T. camphoratus Mycelia

The appropriate concentrations of LWE, MJ, and CK (basal medium as a control) without any exogenous substances were selected. The total RNA of T. camphoratus mycelia was extracted separately from each sample using a TRIzol Kit (TianGen, Peking, China) in accordance with the manufacturer’s instructions. RNA degradation and contamination were assessed on agarose gels (Solarbio, China). The RNA concentration and OD260/280 and OD260/230 ratios were measured on a NanoDrop device (Thermo, Waltham, MA, USA). An RNA sequencing library was then generated using an Illumina TruSeqTM RNA sample preparation kit [50]. Next-generation sequencing of these libraries was performed on the Illumina NovaSeq 6000 platform (Illumina, San Diego, CA, USA) at Shanghai Personal Biotechnology Co., Ltd. (Shanghai, China). Standard bioinformatics analysis was performed using the Personal gene cloud platform (www.genescloud.cn/home) (1 December 2022). Filtered reads were aligned to the reference genome using TopHat2′s updated HISAT2 (version 0.1.6-beta release) (www.ccb.jhu.edu/software/HISAT2/index.shtml) (accessed on 23 July 2023). We used the gene coverage uniformity and a saturation analysis to evaluate the quality of sequencing and the adequacy of the sequencing data. We used HTSeq statistics to match the read count values of each gene as the original expression of the gene. In order to make the gene expression levels of different genes and samples comparable, we used fragments per kilobase of transcript per million mapped reads (FPKM) to standardize the expression level (normalization). For paired−end sequencing, each fragment has two reads, and the FPKM only counts the number of fragments that the two reads can match to the same transcript. Genes are generally considered to be expressed when the transcriptome parameters are greater than 1 [51,52].
All unigenes were from annotated databases: NCBI non-redundant protein (2021.10) (www.ncbi.nlm.nih.gov/) (accessed on 23 July 2023), Swiss-Prot protein categories (2021.06) (www.ngdc.cncb.ac.cn/databasecommons/database/id/5614) (accessed on 23 July 2023), Kyoto Encyclopedia of Genes and Genomes (KEGG) (2021.09) (www.kegg.jp/kegg/pathway.html) (accessed on 23 July 2023), Gene Ontology (GO) (2021.0918) (www.geneontology.org/) (accessed on 23 July 2023), and Evolutionary Genealogy of Genes Non-supervised Orthologous Groups (eggNOG) (2020.06) (www.github.com/jhcepas/eggnog-mapper/wiki) (accessed on 23 July 2023). We used DESeq to analyze differences in gene expression and screened the differentially expressed genes under the following conditions: multiple |log2foldchange| > 1, significance p ≤ 0.05. We used topGO for the GO enrichment analysis, with the gene list and number of genes per term calculated using the GO annotations of differential genes. Then, we calculated p−values with the hypergeometric distribution method (p ≤ 0.05) and found the GO terms with significant enrichment of different genes compared with the whole genome to determine the main biological functions performed by the differential genes. We used clusterprofiler for the KEGG enrichment analysis and the KEGG pathway of annotated differential genes to calculate the gene list and gene number for each pathway. We used the main biological functions performed by the differential genes to identify the KEGG pathways with significant enrichment of differential genes compared with the whole genome (p ≤ 0.05) [53].
We used R language for bidirectional clustering analysis of the union and samples of differential genes of all treatments [54]. Clustering was performed based on the expression levels of a given gene in different samples and the expression patterns of different genes in the same sample, distance was calculated by the Euclidean method, and clustering was performed by the hierarchical clustering maximum distance method (complete linkage) [55].

2.5. Quantitative RT-PCR Analysis of Differential Genes

Thirteen unigenes were selected to validate the accuracy of the transcriptome results by quantitative real−time PCR (qRT-PCR). cDNA synthesis was performed following the instructions of the PrimeScript RT Reagent Kit with gDNA Eraser (Biomed, Peking, China) using 200 ng of RNA. RNA was extracted using an RNA Extraction Kit (TianGen, China). qRT−PCR was carried out on a Bio-Rad CFX96 Touch Real−Time System (Bio−Rad, San Diego, CA, USA) using SYBR Premix Ex TaqTM (Biomed, China). Primers were designed using primer3 and Primer design (https://www.sangon.com/) (accessed on 26 May 2023) (Table 1). Actin was used as a reference gene to normalize expression levels between samples [56]. The relative expression level was calculated by the 2−ΔΔCt method, and the Ct value corresponded to the threshold cycle [57].

2.6. Bioinformatics Analysis of Full−Length Genes

The genome was extracted using a total DNA extraction kit (Melissa, Fuzhou, China). The primers were designed by using the coding sequence of the gene and amplified by PCR. The volume of the amplification system was 50 μL, including 25 μL of SanTaq Plus PCR Mix (Sangon, Shanghai, China), 1 μL of DNA template, 2 μL of each primer, and 20 μL of ddH2O. The PCR procedure involved denaturation at 95 °C for 2 min, denaturation at 95 °C for 15 s, and annealing or extension at 60 °C for 30 s, for a total of 40 cycles. Agarose gel electrophoresis was used to detect PCR products. The correct electrophoresis results were collected using a PCR product purification kit (Sangon, Shanghai, China) and sequenced by Shanghai Sangon Company (China).
Differential genes were analyzed using BLAST in NCBI, multi-sequence alignment was conducted by the neighbor−joining (NJ) method using MEGA11 (version 11.0, Mega Limited, Auckland, New Zealand), and a phylogenetic tree was constructed to detect the confidence of each branch with 1000 bootstraps [58,59]. The open reading frame (ORF) of the three genes was analyzed with the ORF finder (www.ncbi.nlm.nih.gov/orffinder/) (accessed on 23 December 2023). The amino acid sequences of the three proteins were analyzed with ProtParam (www.web.expasy.org/protparam/) (accessed on 23 December 2023). The hydrophilicity of the proteins was predicted with online ProtScale (www.web.expasy.org/protscale/) (accessed on 23 December 2023). The proteins were predicted by SignalP-5.0 (www.services.healthtech.dtu.dk/services/SignalP-5.0/) (accessed on 23 December 2023) [60]. The secondary structures of the proteins were predicted according to SOPMA (www.npsa-prabi.ibcp.fr/cgi-bin/npsa_automat.pl?page=npsa%20_sopma.html) (accessed on 23 December 2023) [61]. By analyzing the amino acid sequences of the proteins with PSORTII (www.genscript.com/psort.html) (accessed on 23 December 2023), the possible positions of the proteins in the subcellular structure were predicted. The translated sequences of the gene nucleic acid sequences were analyzed with the Expasy database (www.ngdc.cncb.ac.cn/databasecommons/database/id/4640) (accessed on 23 December 2023) for molecular weight predictions and to determine the isoelectric point and hydrophobicity. The TMHMM2.0 server (www.cbs.dtu.dk/services/TMHMM-2.0/) (accessed on 23 December 2023) was used for protein transmembrane predictions.

2.7. Data Analysis

We used 3 replicates to test the reliability of all the experiments. SPSS 19 (IBM, New York, NY, USA) was used to analyze significance. Significance was tested by one-way analysis of variance (ANOVA) using Tukey’s test. Differences were considered statistically significant and extra-significant at p ≤ 0.05 (*) and p ≤ 0.01 (**). All graphs were drawn using Adobe Photoshop 2019 (Adobe, San Jose, CA, USA) and GraphPad Prism 8 software (GraphPad, San Diego, CA, USA).

3. Results

3.1. Monosaccharide Composition Analysis of LWE

An extraction efficiency up to 21% was obtained for aqueous extracts. The ion chromatogram results show that the top 10 peaks appeared at retention times of 4.634, 9.892, 10.217, 12.292, 14.459, 17.150, 18.542, 22.359, 35.134, and 37.850 min. Compared with the standard curve, the peaks correspond to fucose (Fuc), arabinose (Ara), rhamnose (Rha), galactose (Gal), glucose (Glc), xylose (Xyl), mannose (Man), ribose (Rib), galacturonic acid (GAL−UA), and glucuronic acid (GLC−UA), with contents of 0.61%, 6.31%, 2.50%, 17.10%, 61.66%, 2.96%, 6.45%, 0.45%, 1.04%, and 0.91%, respectively. The content of Glc in LWE was the highest, followed by Gal (Figure S1).

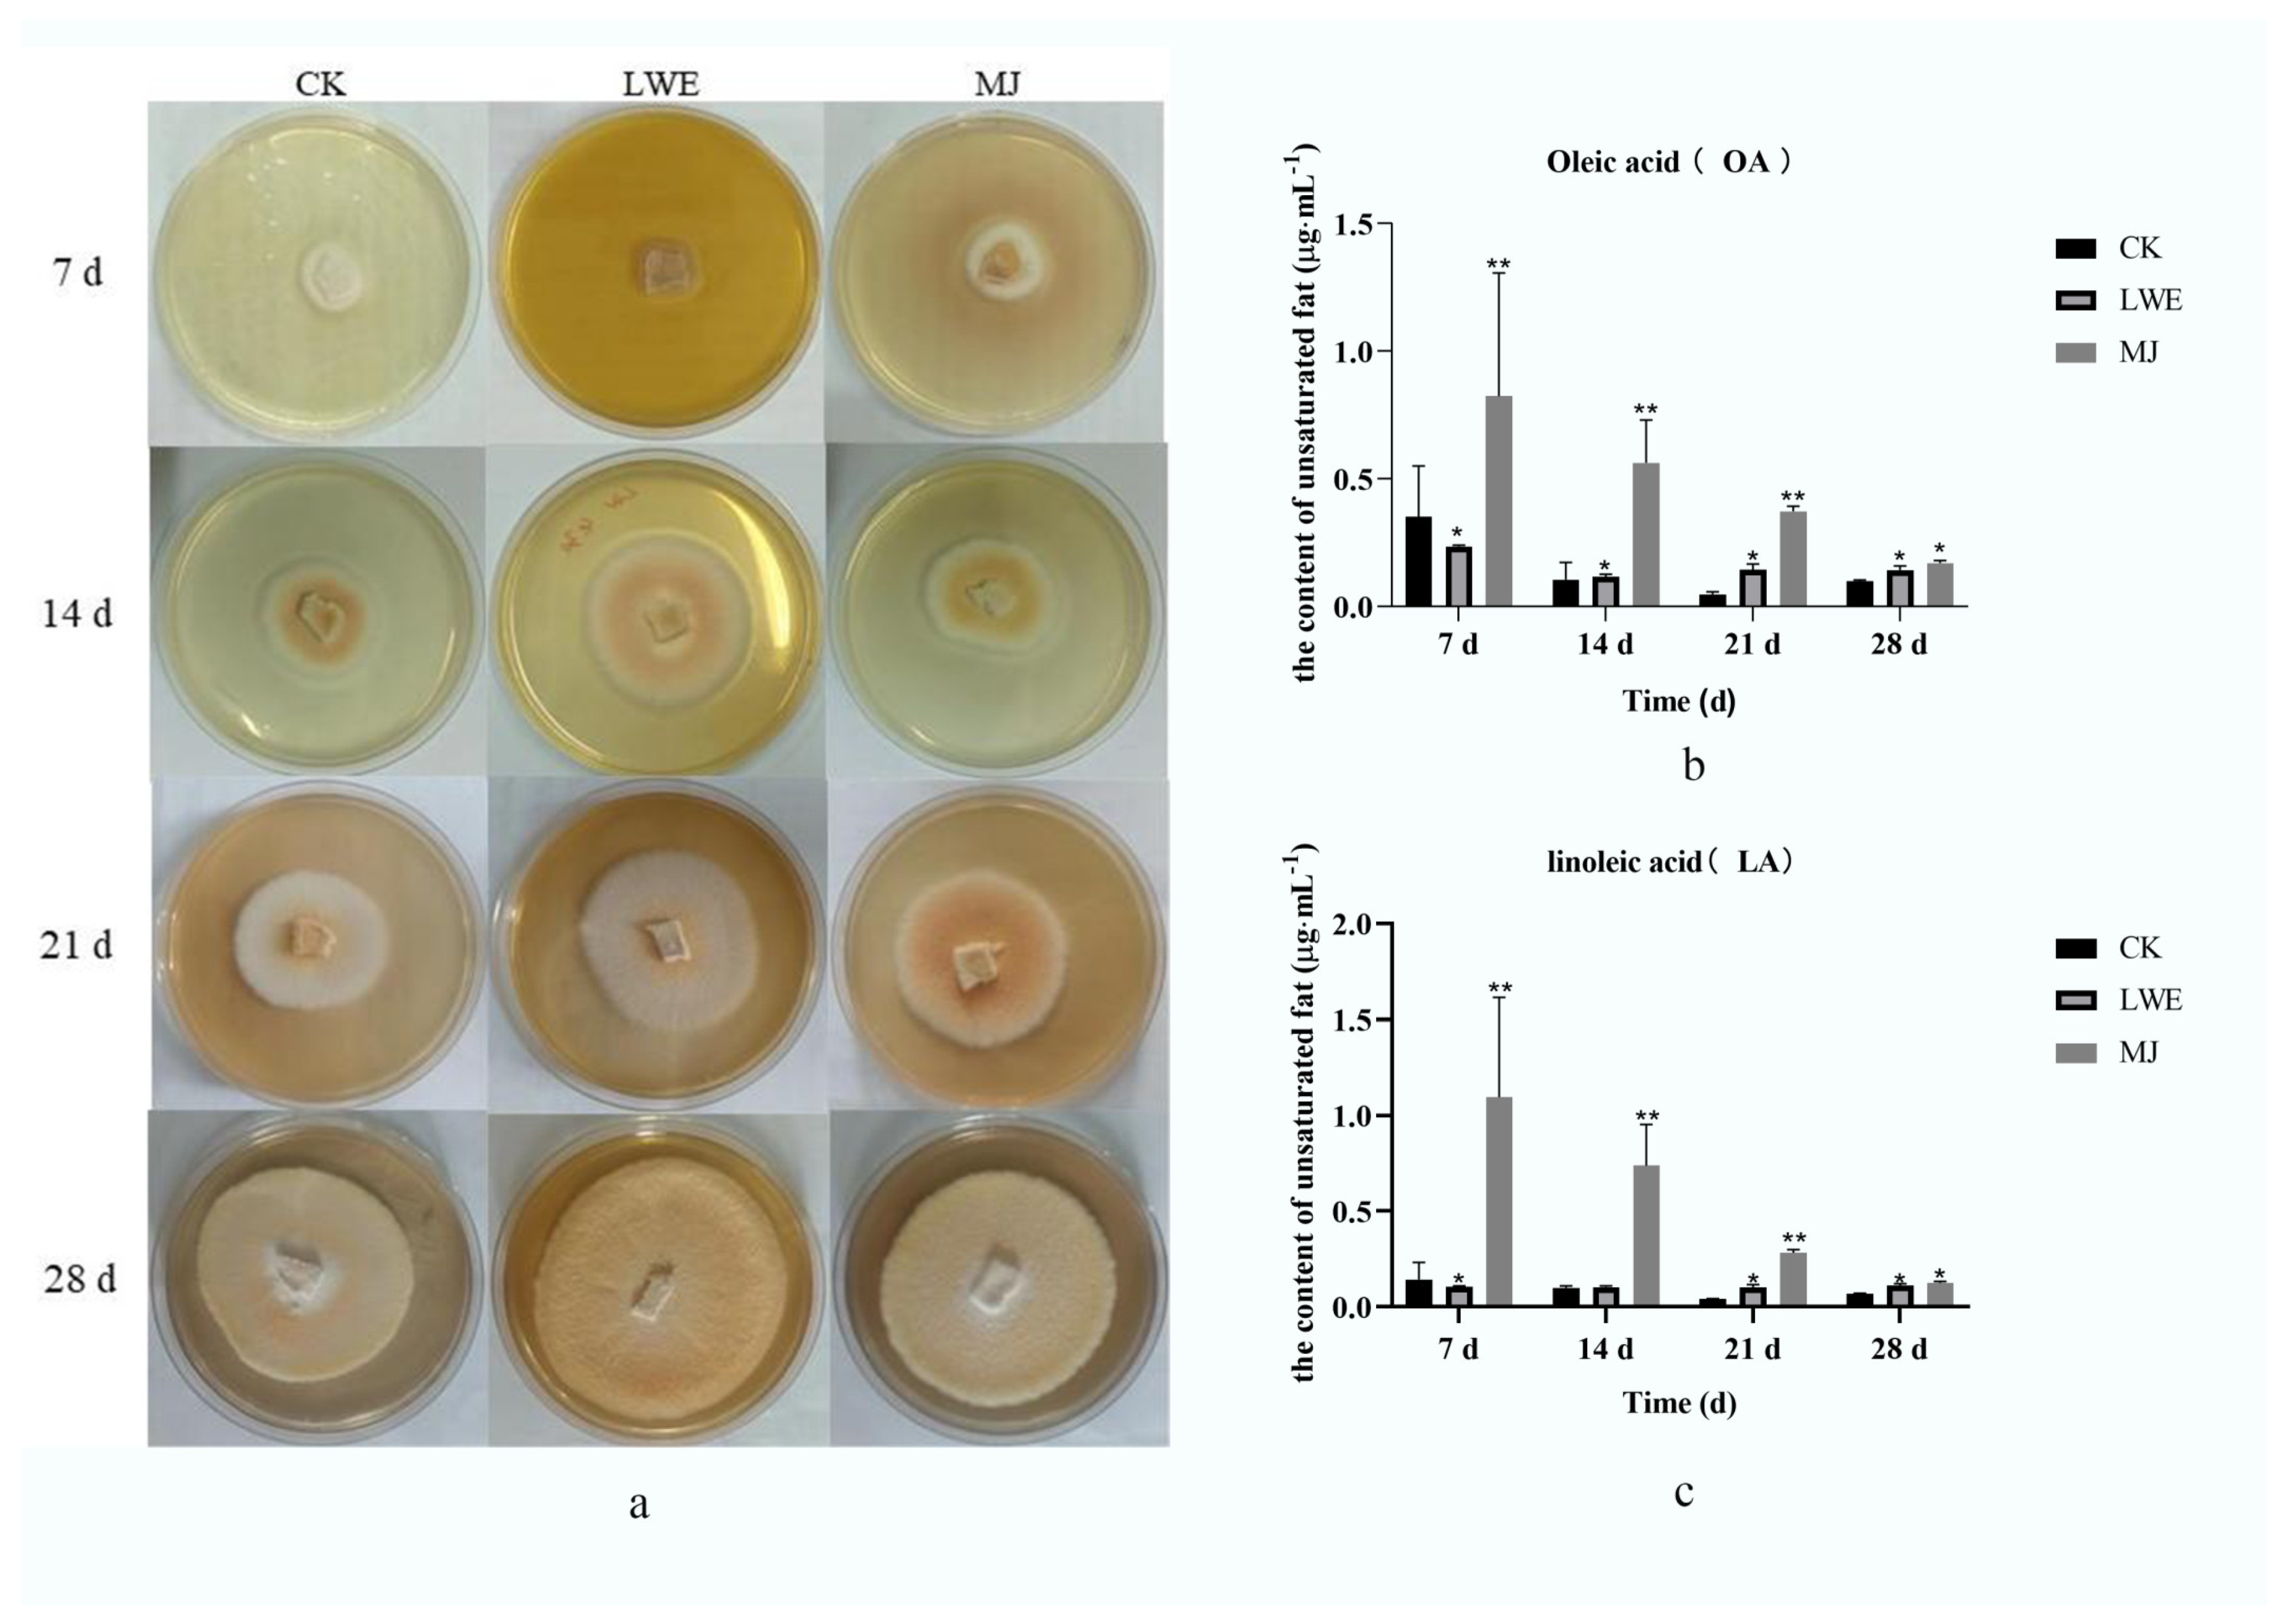
3.2. T. camphoratus Mycelia Growth

Compared to average hyphal growth rate of 0.768 cm·d−1 for CK, the growth rate of mycelia with 2.5 g·L−1 LWE was 1.292 ± 0.01 cm·d−1. The growth rate was 1.285 ± 0.05 cm·d−1 when 25 µmol·L−1 MJ was added. The addition of LWE and MJ can promote the growth of T. camphoratus mycelia. In different concentrations of LWE, the growth rate of mycelium increased with the increasing concentration, and the total growth rate of T. camphoratus mycelia was 2.5 g·L−1 LWE, 2.0 g·L−1 LWE (1.029 ± 0.130 cm·d−1), 1.5 g·L−1 LWE (0.875 ± 0.217 cm·d−1), 1.0 g·L−1 LWE (0.850 ± 0.186 cm·d−1), 0.5 g·L−1 LWE (0.834 ± 0.150 cm·d−1). In different concentrations of MJ, the growth rate of mycelia increased with the increasing concentration, and the total growth rate of T. camphoratus mycelia was 25 μmol·L−1 MJ, 20 μmol·L−1 MJ (1.25 ± 0.04 cm·d−1), 15 μmol·L−1 MJ (1.21 ± 0.05 cm·d−1), 10 μmol·L−1 MJ (1.19 ± 0.02 cm·d−1), and 5 μmol·L−1 MJ (0.97 ± 0.06 cm·d−1). The concentration of 2.5 g·L−1 LWE and 25 μmol·L−1 MJ were found to be more suitable for culturing T. camphoratus mycelia than other concentrations (Figure 1a, Figures S2 and S3).

3.3. Oleic and Linoleic Acid Determination

With OA and LA contents of 0.07 mg·g−1 in CK, the average oleic acid content in LWE was 0.08 ± 0.03 mg·g−1, and in MJ, it was 0.23 ± 0.05 mg·g−1 (p ≤ 0.05). The average LA content in MJ (0.28 ± 0.02 mg·g−1) was significantly higher than that in CK (0.04 ± 0.03 mg·g−1) and LWE (0.05 ± 0.05 mg·g−1). In Figure 1b, during the growth of T. camphoratus mycelia, the fatty acid content decreased and then increased when CK and LWE were present. At 14 days, the OA and LA contents in LWE showed an increasing trend and remained stable in the later stage. However, in CK, the content increased at 21 days, and at 28 days, the content was lower than with LWE. The OA and LA contents in the MJ group decreased continuously and were significantly higher than with LWE and CK (Figure 1b,c).

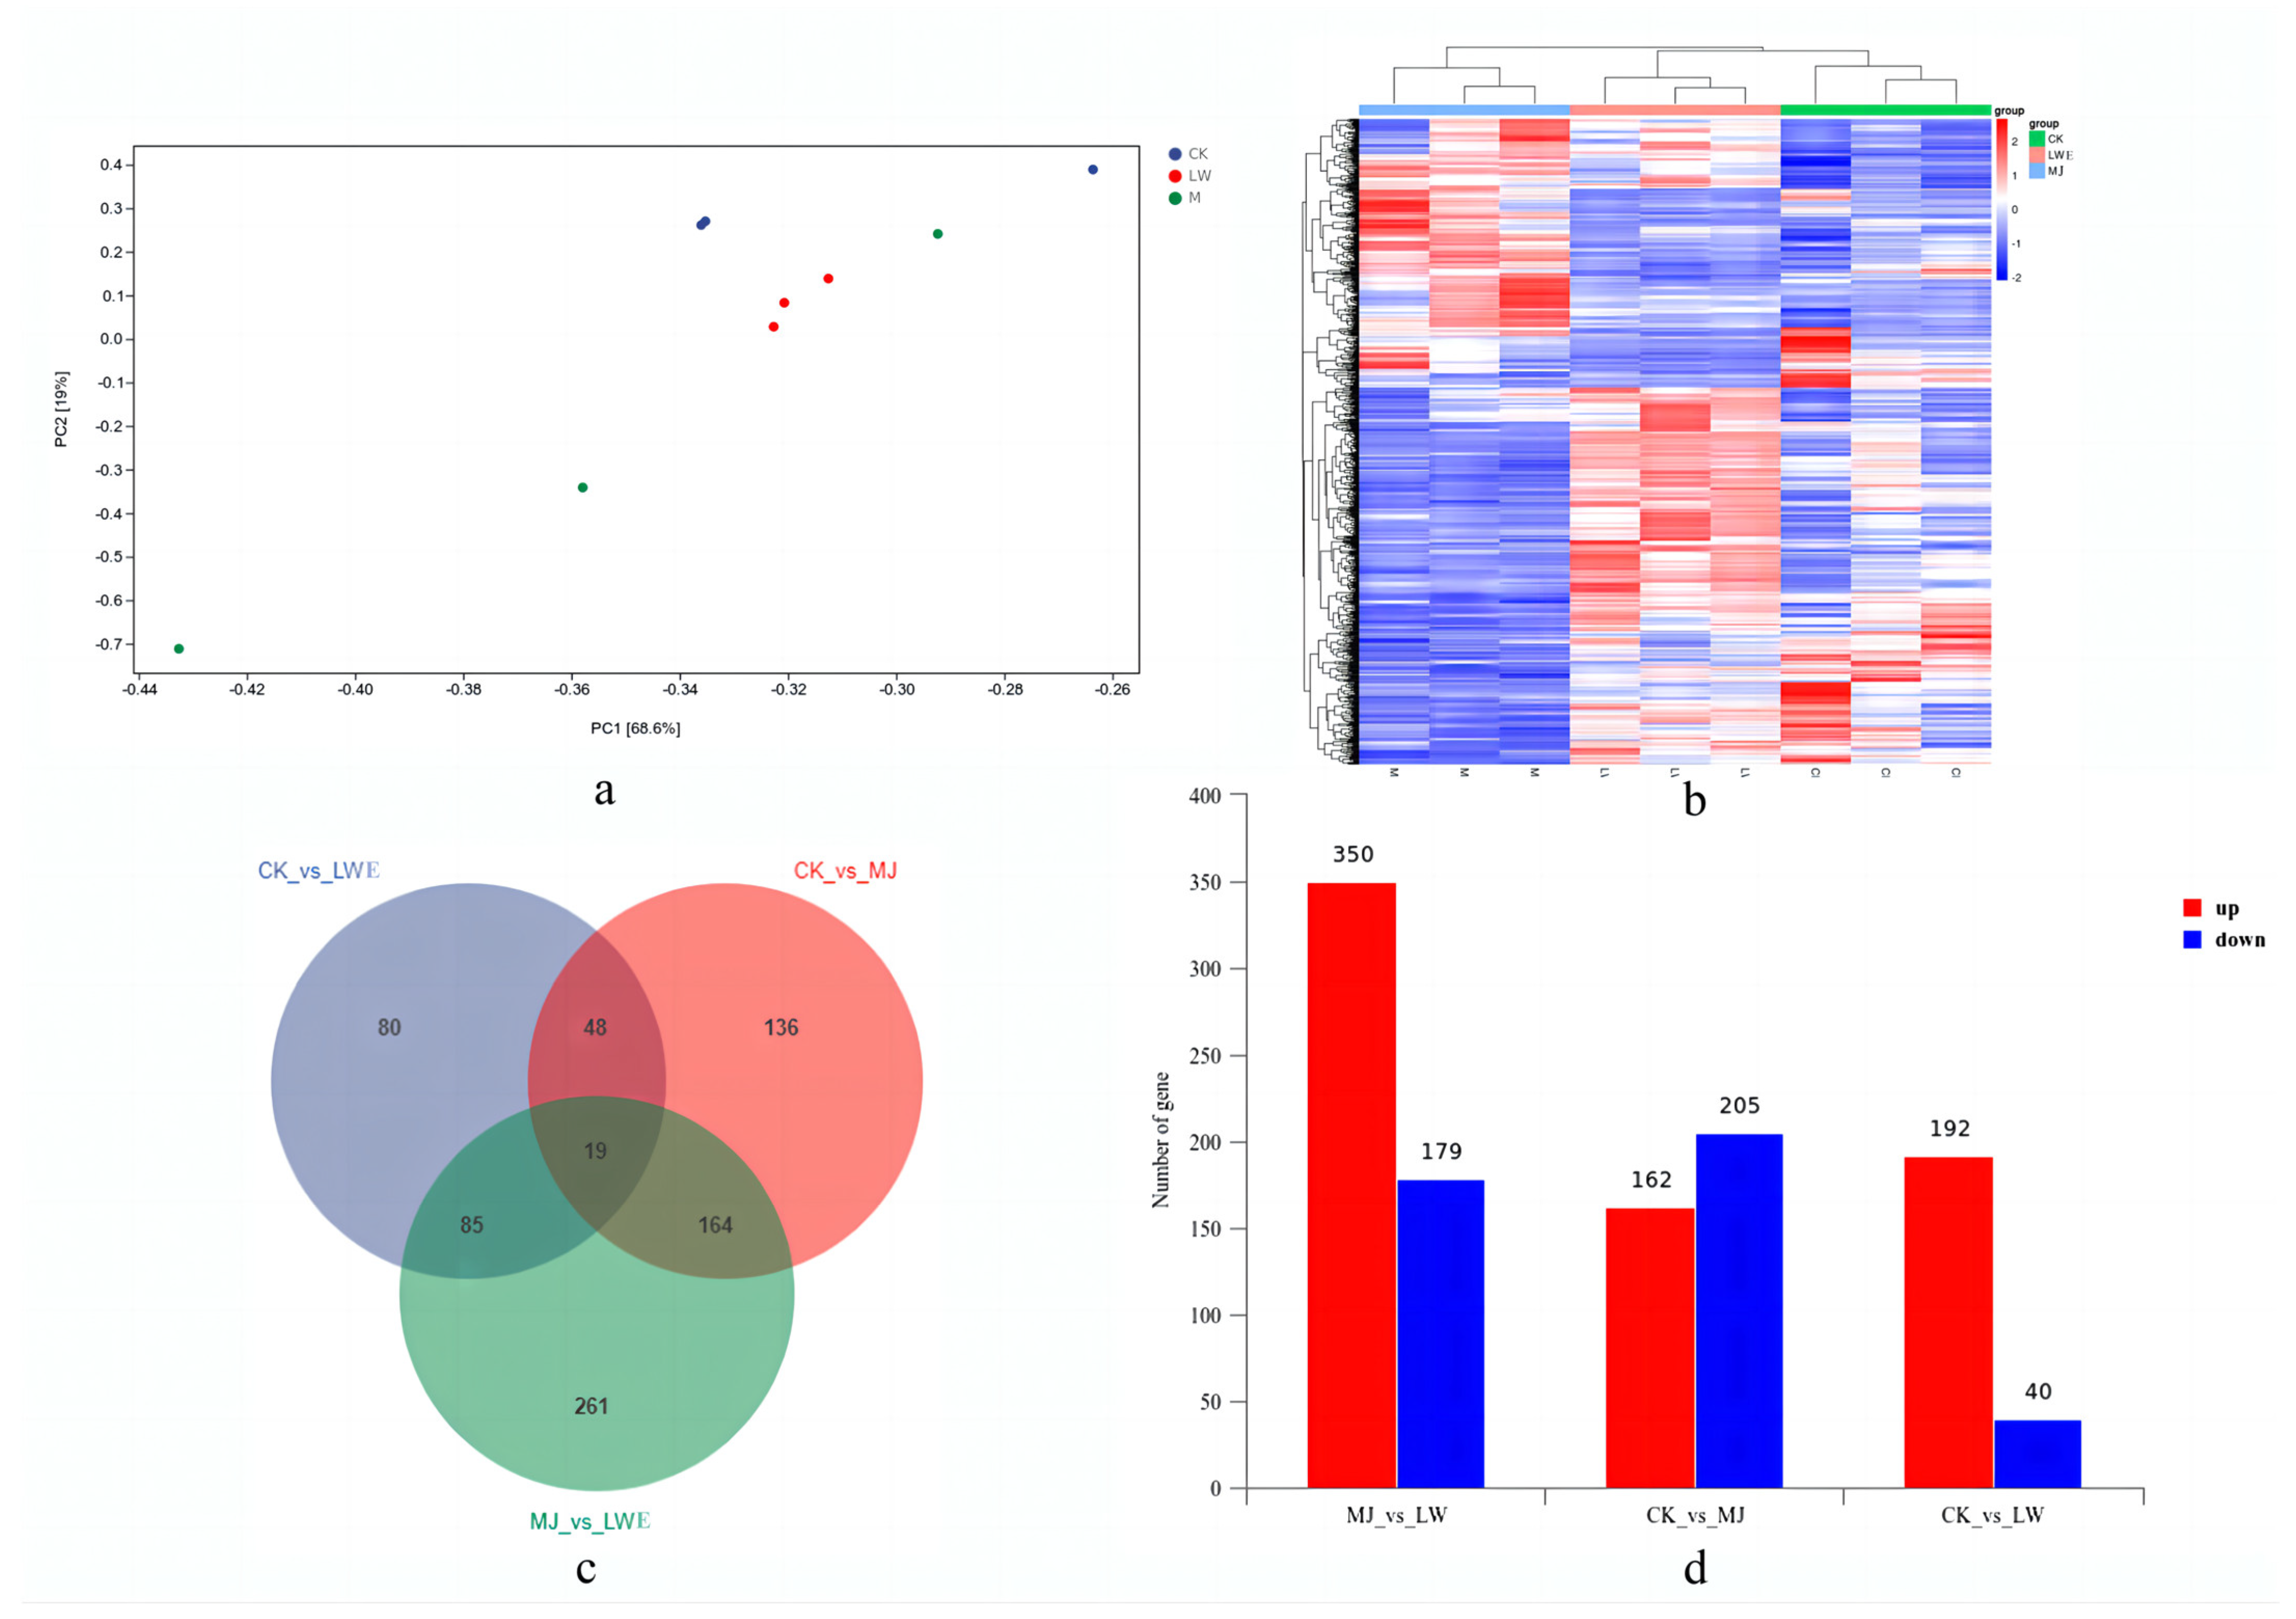
3.4. T. camphoratus Mycelia Transcriptome Sequencing and Analysis

The samples were sequenced, and the raw data generated were 43.15 GB (CK), 42.26 GB (LWE) and 44.05 GB (MJ). We filtered and de−noised the raw data to obtain 40.72 GB (CK), 39.94 GB (LWE), and 41.63 GB (MJ) of clean data. The preliminary statistical results of the sequencing data of the three groups are shown in Table 2, and the overall Q30 was > 90%. Sequencing quality control showed that the sampling depth of each library met the analysis requirements, and a follow-up analysis was conducted (Table 3).
Compared with the reference genome (SAMN19229739), the read count for each gene reflected the original expression level of the gene. The read count is positively correlated with the true expression level of a gene, as well as its length and sequencing depth. The correct results were aligned to the reference genome using HISAT2, resulting in mapping > 70% for the sequence and a valid alignment result (Table 4). These non-repetitive unigenes were eventually annotated based on the five databases. The libraries generated around 1.89 × 10⁴, 7.2 × 10³, 7.6 × 10³, 1.77 × 10⁴, and 1.26 × 10⁴ clean reads from the samples. The results of the annotation are shown in Table S1. We used gene coverage uniformity and a saturation analysis to evaluate the quality of the sequencing and the adequacy of the sequencing data. Under ideal conditions, the distribution of reads on all expressed genes should be uniform (Figure S4a). The saturation showed a large deviation between the gene expression level and the actual expression when fewer data were present. When the number of data reached the saturation threshold, the gene expression was almost unchanged when the number of data increased again; subsequently, gene expression was no longer affected by the number of data.
The transcriptome expression analysis included the gene, transcriptome, and exon expression levels. The majority of the genes were moderately expressed, while small portions had low and high expression levels. Genes with FPKM > 1 were expressed and could also reflect the expression level of genes. Before the differential expression analysis, we examined the correlations of gene expression levels between samples (Figure S4b). The closer the correlation coefficient was to 1, the higher the similarity of expression between samples. The correlation analysis and PCA showed strong between-group correlations (Figure 2a).

3.5. Functional Annotation of T. camphoratus Mycelia

Genes with highly correlated expression between samples are classified into one group. Usually, these genes are involved in biological processes, or there may be an actual link to a metabolic or signaling pathway. Therefore, we can find the unknown biological relationship between genes through expression-level clustering (Figure 2b). The Venn diagram shows the gene distribution, gene expression fold difference, and significance results (Figure 2c). Compared with CK, 232 differential genes were characterized in LWE, including 192 upregulated genes and 40 downregulated genes, and 367 differential genes were shown in MJ, with 162 upregulated genes and 205 downregulated genes. There were 529 different genes, 350 upregulated genes, and 179 downregulated genes between MJ and LWE. The results show that both LWE and MJ can regulate the genes of T. camphoratus mycelia, with LWE mainly upregulating and MJ mainly downregulating the genes (Figure 2d).

3.6. Functional Enrichment Annotation of Differentially Expressed Genes

The pathways with correct p ≤ 0.05 were set to be significantly enriched in differentially expressed genes. As shown in Figure S5a, 937 differential genes between CK and LWE were enriched in 31 pathways, including 20 significantly enriched pathways such as pentose and glucuronate interconversion, galactose metabolism, starch and sucrose metabolism, Hippo signaling pathway—multiple species, arginine and proline metabolism, and the biosynthesis of unsaturated fatty acids. There were 1266 differentially expressed genes between CK and MJ in 51 pathways, among which 20 pathways were significantly enriched, including tryptophan metabolism, mitogen-activated protein kinase (MAPK) signaling pathway—yeast, pentose and glucuronate interconversion, phenylalanine metabolism, starch and sucrose metabolism, and the biosynthesis of unsaturated fatty acids (Figure S5b). There were 1247 differentially expressed genes between LWE and MJ in 39 pathways, among which 20 pathways were significantly enriched, including MAPK signaling pathway–yeast, glyoxylate and dicarboxylate metabolism, tryptophan metabolism, Hippo signaling pathway—multiple species, and the biosynthesis of unsaturated fatty acids (Figure S5c).
KEGG−enriched signaling pathways were mapped to unsaturated fat metabolism, and 17 genes were found to be significantly different from those of unsaturated fat metabolic pathways. One upregulated gene, stearoyl−CoA desaturase (SCD), was significantly enriched in LWE treatment. Several upregulated genes—SCD, stearoyl-CoA desaturase-1, and 2 (FAD2-1, FAD2-2) and δ−12 desaturase—were significantly enriched in MJ treatment. Further analysis of the three genes involved in unsaturated fat metabolism showed that SCD was mainly used for the synthesis of OA, while FAD2-1 and FAD2-2 were used for the synthesis of LA (Figure 3a).

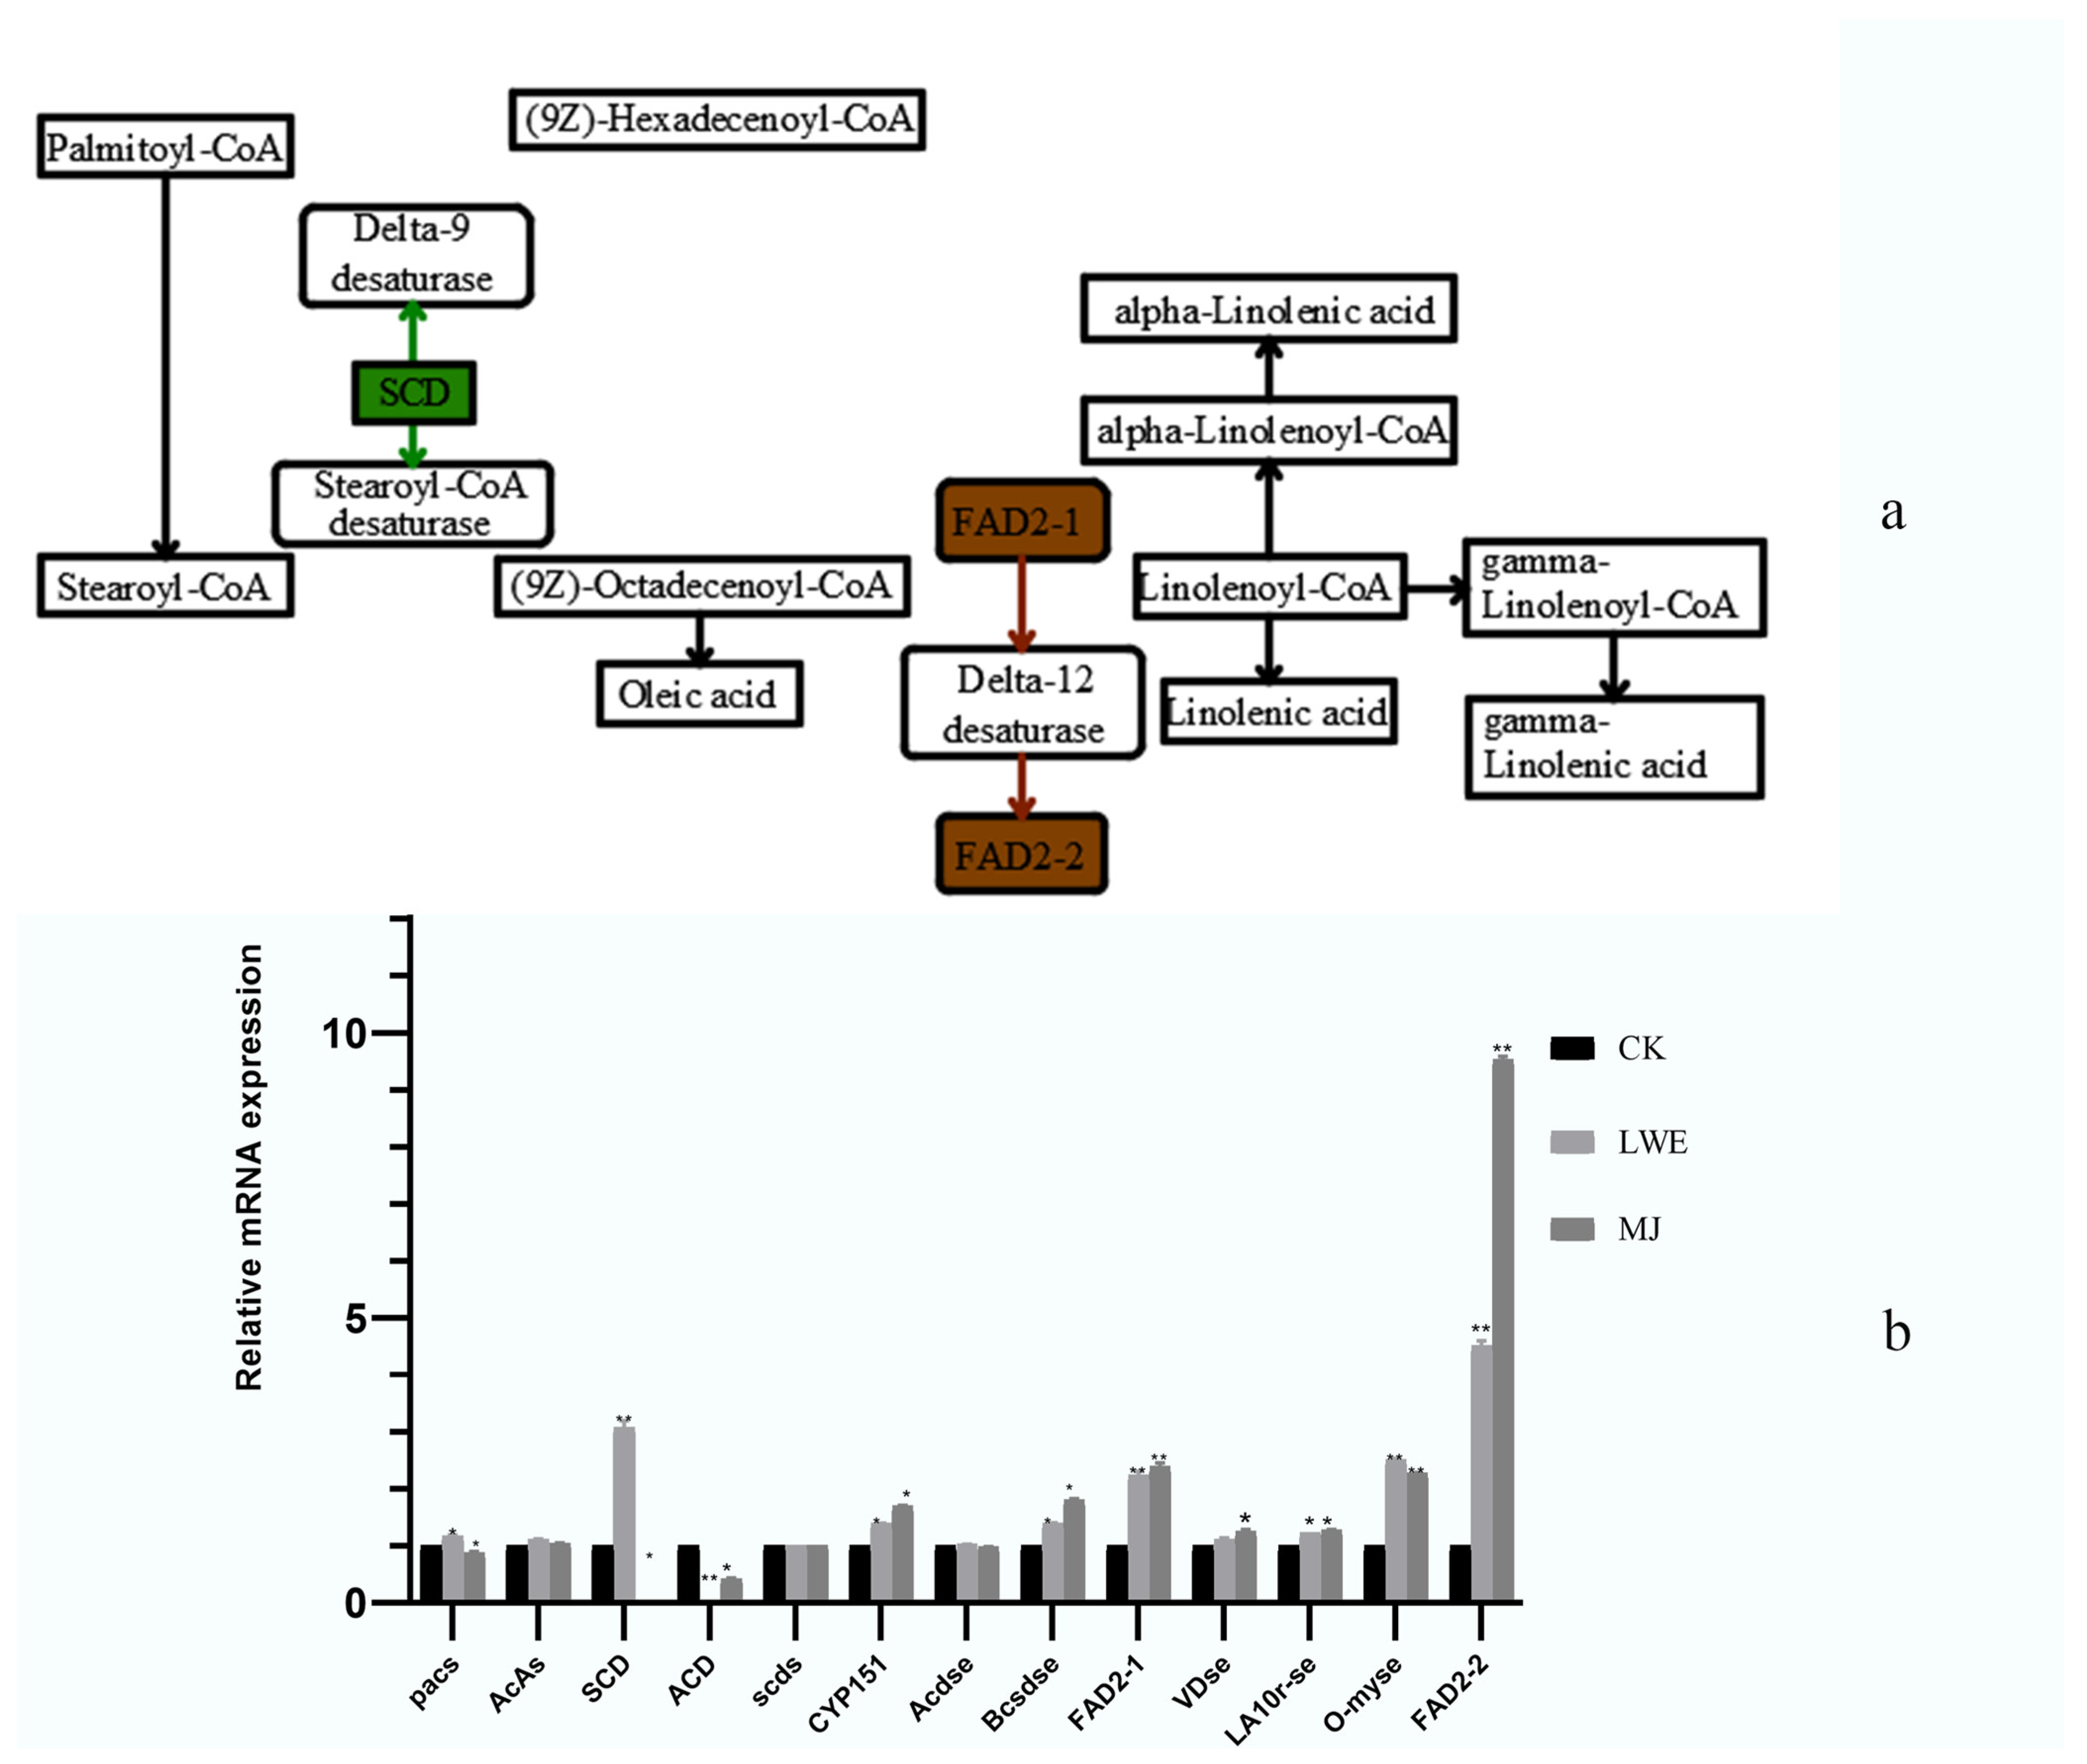
3.7. Quantitative Genetic Analysis

To verify the accuracy of transcriptome sequencing result, 13 differential unigenes were chosen for quantitative qRT−PCR. As shown in Figure 3b, the expression levels of FAD21, SCD, and FAD22 were the highest among the 13 unigenes. In LWE, FAD21(1.3 times more than reference gene), SCD (1 times more than reference gene), and FAD2-2 (1.4 times more than reference gene) were significantly upregulated. In MJ, FAD21 (1.2 times more than reference gene) and FAD22 (1.4 times more than reference gene) were significantly upregulated. SCD in MJ was not expressed. The transcriptome data were consistent with the quantitative qRT−PCR results. The difference between qRT−PCR and RNA−Seq data could be explained by the different sensitivity to gene expression in these two methods.

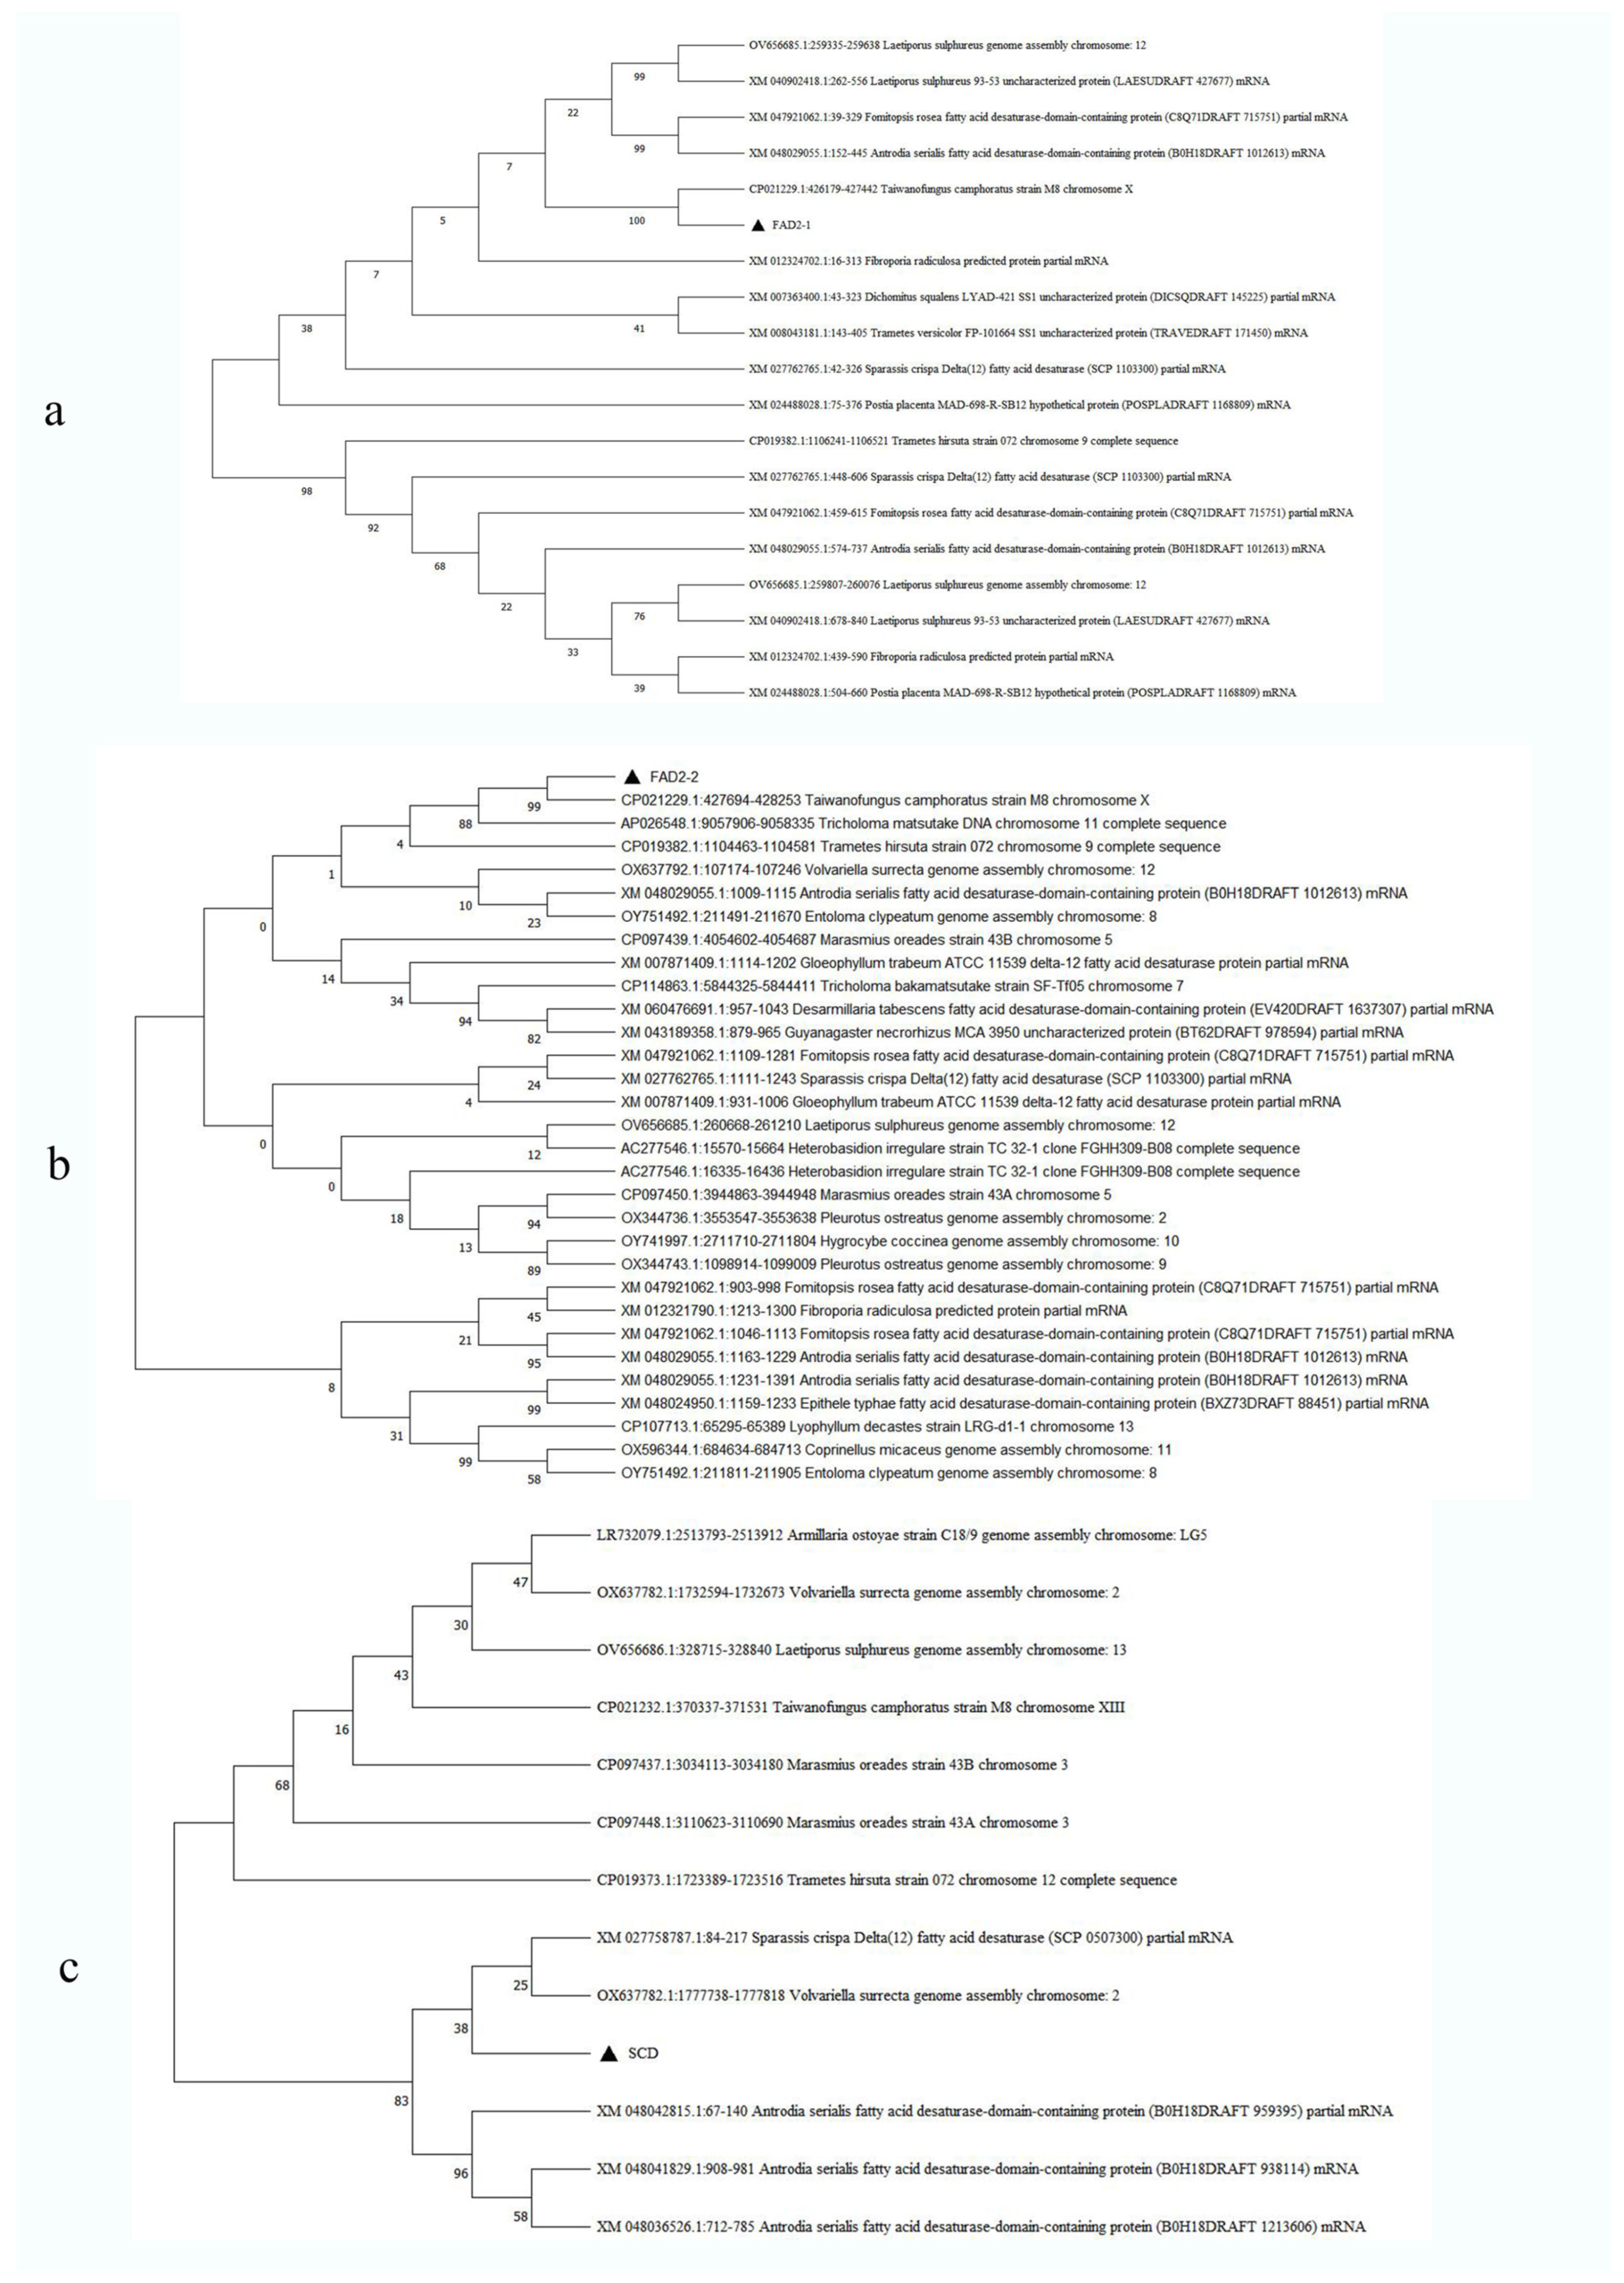
3.8. Bioinformatics Analysis of Three Genes

The full length of the three genes was amplified by PCR and sequenced. The agarose gel electrophoresis results show that the full lengths of FAD21, FAD22, and SCD were 1230, 576, and 2065 bp, and the cDNA length was 873, 438, and 1419 bp, respectively (Figure S6). The results show that the FAD21 gene has 14 open reading frames (ORF1–ORF14), with ORF1 being the longest, with a length of 366 bp, encoding a total of 121 amino acids (Figure S7a). The FAD22 gene has 15 open reading frames (ORF1–ORF15). Among them, ORF3 is the longest, with a length of 291 bp, encoding a total of 96 amino acids (Figure S7b). The SCD gene has 24 open reading frames (ORF1–ORF24). ORF10 is the largest, with a length of 390 bp, encoding a total of 129 amino acids (Figure S7c). The ORF10 of FAD21 was found to overlap with other omega-3 desaturase amino acid sequences by up to 43%. The ORF1 FAD22 had no similar sequence according to the protein BLAST alignment. The ORF10 of SCD overlapped the amino acid sequences of δ−12 fatty acid desaturase by up to 37%.
Conserved domain predictions revealed that FAD21 and FAD22 belong to the membrane-like FADS superfamily (Figure S7d). The membrane fatty acid desaturase includes membrane FADS, alkane hydroxylase, β−carotene ketolase (CrtW−like), hydroxylase (CrtR−like), and other related proteins. The predominant amino acid in FAD2−1 is threonine (29.1%), followed by L−cysteine (25.3%). The molecular weight is about 35.0 kDa and the predicted theoretical isoelectric point (pI) is 4.99. The formula is C3983H6674N1294O1672S328 and the total number of atoms is 13,951. The instability coefficient of the protein is 53.67, indicating that it is an unstable protein. The fat coefficient is 24.19. The total average water-soluble protein content is 0.78, making it a pI hydrophobic protein. The predominant amino acid in the FAD2−2 protein is threonine, accounting for 26.4% of all amino acids, followed by L−cysteine, accounting for 26.2%. The molecular weight is about 17.2 kDa, and the predicted theoretical pI is 5.15. The formula is C1750H2926N576O729S151, and the total number of atoms is 6132. The instability coefficient of the protein is 56.67, which makes it an unstable protein. The total average water-soluble protein content is 0.827, making it hydrophobic. The predominant amino acid in the SCD protein is threonine, accounting for 27.4% of all amino acids, followed by L−cysteine, accounting for 26.5%. The molecular weight of the protein is about 39.2 kDa, and the predicted theoretical pI is 4.99. The formula is C3854H6445N1265O1613S335, and the total number of atoms is 13,512. The instability coefficient of the protein is 53.76, making it an unstable protein. The fat coefficient is 23.32. The total average water-soluble protein content is 0.799, making it hydrophobic. At the same time, the ProtScale analysis showed that the hydrophobic region of FAD21 is larger than the hydrophilic region, which is consistent with the ProtParam prediction and makes it a hydrophobic protein (Figure 4a). The hydrophobic region of the FAD22 protein is larger than the hydrophilic region, which is in accordance with the ProtParam prediction (Figure 4b). As predicted, the SCD protein was also shown to be hydrophobic (Figure 4c).
The results show that FAD21 is an integrated membrane protein that is probably located between the mitochondria and cytoplasm. The probable distribution of the FAD22 protein is 90% in the cytoplasm and 10% in the nucleus. It is suggested that the FAD22 protein is most likely located in the cytoplasm. The probability of the SCD protein distribution in subcells is 56% in the cytoplasm, 52% in the plasma membrane, and 40% in the mitochondria. This indicates that the SCD protein is located in the inner mitochondrial membrane matrix and on the cytoplasmic side, and it is a transmembrane protein (Figure 4d). It can be seen that the FAD21 protein domain has five transmembrane regions, which match the positions of the substructure of the protein, and it is a transmembrane protein. FAD22 protein domains 1−145 are outside the membrane, and the probability of there being a transmembrane region is very low. The SCD protein domain has four transmembrane domains, which match the substructure of the SCD protein, and it is a transmembrane protein (Figure 4e).
As shown in Figure 4f, 85 (29.31%) α−helices (blue), 53 (18.28%) extended chains (red), and 152 (52.41%) randomly coiled structures (purple) were identified in FAD2. Among them, α−helices and random coiled structures were the most abundant, and the extended chains were dispersed throughout the whole protein. The FAD22 protein comprises 40 (27.59%) α−helices, 32 (22.07%) extended chains, and 73 (50.34%) randomly coiled structures (Figure 4g). The SCD protein comprises 98 (20.76%) α−helices, 142 (30.08%) extended chains, and 232 (49.15%) randomly coiled structures (Figure 4h).
The results show that among the 19 organisms that show high homology with the FAD21 protein gene, FAD21 has a 100% genetic relationship with the M8 chromosome of T. camphoratus. This result confirms that the FAD21 gene was screened from T. camphoratus (Figure 5a). Among the 30 organisms that show high homology with the FAD22 protein gene, FAD22 is 99% related to T. camphoratus M8 chromosome X and 88% related to Tricholoma matsutake chromosome gene (Figure 5b). The relationship between SCD and the T. camphoratus M8 chromosome XIII is distant, and the homology between SCD and the Volvariella surrecta genome assembly chromosome 2 is 38% (Figure 5c). The results show that the probability of there being a signal peptide is only 0.0017, indicating that there is no signal peptide.
The structures of the proteins were modeled on SWISS−MODEL based on their homology, and the three-dimensional structural model of the FAD21 protein was constructed based on the fatty acid desaturase domain, with a template coverage of 0.96. Based on the fatty acid desaturase domain-containing proteins (Wolfiporia cocos MD−104), a three-dimensional structural model of the FAD22 protein was constructed with a sequence similarity of 0.94. After homology modeling, the quality of the model was tested by a Laplace diagram. The results show that 94.41% of the favorable support region contained residues. The distribution of dihedral angles (ψ, φ) in the enzyme residues in the diagram shows the effective stereochemical accuracy. Based on the model of A0A5C3P7S4 (Polyporus arcularius HHB13444) in the AlphaFold Protein Structure Database (https://alphafold.com), a three−dimensional structural model of SCD protein was constructed, with a sequence similarity of 0.71. After homology modeling, the quality of the model was tested by a Laplace diagram. The results show that there was 93.32% residue in the favorable support region. We also predicted that it has a transmembrane structure. The distribution of dihedral angles (ψ, φ) in the enzyme residues in the diagram shows the effective stereochemical accuracy (Figure 6).

4. Discussion

Anticancer, anti−inflammatory, and anti−tumor effects are the main functions of T. camphoratus [62,63,64]. For this reason, it is very important to improve the culture efficiency of T. camphoratus mycelia instead of focusing on its fruit bodies and mycelia [65]. The use of exogenous additives to promote the growth and biological activity of various edible and medicinal mushrooms has become popular in research in recent years [66,67]. In this study, LWE and MJ treatments enhanced the growth of T. camphoratus mycelia by significantly upregulating the expression of genes associated with fatty acid metabolism and synthesis. They may be a potential biological resource for the culturing of T. camphoratus mycelia. According to the analysis of the content of polyunsaturated fatty acids in the mycelia and the transcriptome results of T. camphoratus, it was found that the two exogenous additives had a certain effect on the synthesis of polyunsaturated fatty acids. Among them, LWE and MJ had obvious effects on the genes in the synthesis pathway of OA and LA. In the synthesis pathway, OA and LA as substrates can promote the production of other polyunsaturated fatty acids. This discovery is important for the cultivation of T. camphoratus mycelia. The findings of this study are based on the exposure of three relevant genes. According to the bioinformatics method, the characteristics of the three genes were analyzed, and the genes were preliminarily determined. The results showed that they were FAD2 family genes and stearoyl−CoA desaturase. These genes exhibited excellent performance in the metabolism of whole polyunsaturated fatty acids, and they are also characteristic of the mycelia of T. camphoratus, enriching the species diversity of these genes.

4.1. Exogenous Additives in the Artificial Cultivation of T. camphoratus

In this study, LWE and MJ were used as effective exogenous additives to mycelia. They were both shown to promote the growth of T. camphoratus mycelia and act on the PUFAs in the mycelia, providing an alternative biological resource for the production of T. camphoratus mycelia. In previous research, corn oil has been shown to increase the mycelia biomass and triterpene content in T. camphoratus [68]. Different concentrations of exogenous additives have different effects on the mycelia of T. camphoratus. In this experiment, the concentration of 2.5 g·L−1 LWE and 25 μmol·L−1 MJ had a significant effect on mycelia. An optimal concentration of 0.05 mL·L−1 of α-terpineol was added to the medium as a stimulant to increase the production of mycelia-produced T. camphoratus triterpenoids in solid culture [69]. LWE and MJ treatment also significantly increased the variety and abundance of secondary metabolites in mycelia. In particular, the contents of unsaturated fatty acids LA and OA were increased. This means that LWE and MJ can enhance the medicinal value of T. camphoratus mycelia. Various monosaccharides play an important role in the mycelial growth of T. camphoratus. Both LWE and MJ are universally available resources, and they contribute to the rapid production of T. camphoratus mycelia. LWE and MJ promote improved LA and OA contents in mycelia. LWE stabilizes LA and OA contents during the later stages of mycelia growth, while MJ results in a direct increase. Based on our results, MJ treatment is more suitable for improving T. camphoratus mycelia polyunsaturated fatty acids than LWE treatment.

4.2. PUFAs in Edible Fungi

LA and OA are two of the basal acids comprising polyunsaturated fatty acid metabolism, and they play an important role in the metabolism of the n−3 and n−6 fatty acid families. They act as two substrates and simultaneously affect the synthesis of other polyunsaturated fatty acids, such as docosahexaenoic acid (DHA) and eicosapentaenoic acid (EPA). LA is a hydroxy fatty acid fatty acid ester (FAHFA), a class of anti-inflammatory and anti−diabetic lipids commonly found in human food. This means that the anti-inflammatory and anti−diabetic effects of T. camphoratus mycelia may be related to the high concentration of LA in T. camphoratus. Previous studies have found that a FAHFA with LA is more abundant in some species [70]. LA isolated from Morchella esculenta exhibits potent α−glucosidase inhibition, which is beneficial for the treatment of diabetes and related diseases [71]. PUFAs are important for human health and were found to be dominant among the mushroom species studied. LA and OA make up more than 50% of the total fatty acid composition. The addition of LWE and MJ increased both the LA and OA contents while also increasing the biological activity of T. camphoratus mycelia, which was also found in other fungi [72]. In recent years, there has been a greater focus on dietary health. The polyunsaturated fatty acids in edible and medicinal mushrooms are gaining popularity because they can provide rich nutritional value to humans without causing gastrointestinal burden [73]. The addition of LWE and MJ further improved the beneficial nutrients in T. camphoratus mycelia, providing a theoretical basis for the professional cultivation of T. camphoratus mycelia.

4.3. Profiles of Genes Associated with Polyunsaturated Fatty Acids

FAD2, a key enzyme in the biosynthesis of PUFAs in plants, introduces double bonds into OA to form LA. Transcriptome sequencing showed that FAD2 and SCD may regulate increases in OA (C18:1) and LA (C18:2) in the cell membranes of camphor S−29 cells, resulting in increased cell membrane permeability [74]. Substrate−fed experiments using Saccharomyces cerevisiae confirmed that the Leucas cephalotes (LcFAD2) enzyme catalyzes the desaturation of palmitoleic acid and OA to form palmitoleic acid and LA [75]. The evolutionary history of the FAD2 gene family suggests that most FAD2 genes form monophyletic clades, except in plants. In some dicots, the FAD2 gene differentiates into plants with constitutive and seed-specific expression [76]. FAD2 converts OA into LA from the fatty acyl group of phospholipids synthesized by the endoplasmic reticulum (ER). FAD2−mediated membrane lipid polyunsaturation has been shown to be involved in ER stress tolerance in Arabidopsis thaliana. The FAD2 family members are important desaturases for the synthesis of PUFAs, which have been discovered and cloned in species [77].
Stearoyl−CoA desaturase (SCD) produces monounsaturated fatty acids (MUFAs), which aid in cell growth, survival, differentiation, metabolic regulation, and signal transduction [78]. SCD gene−edited stearoyl−CoA thioesterase is a key enzyme in the synthesis of OA, and its substrate is octadecyl−CoA [79]. The overexpression of SCD has been associated with metabolic diseases such as diabetes and nonalcoholic fatty liver disease. SCD appears to be an important player in the development of malignant diseases and may be a promising target for cancer therapies [80].

4.4. Study Limitations and Future Research Possibilities

T. camphoratus mycelia growth is linked to various pathways, not only those of unsaturated fatty acids. This study only partially describes one of the pathways in LWE and MJ. In subsequent experiments, we can further use heterologous gene expression to determine whether the proteins edited by the three genes are key proteins, and we can reveal their related mechanisms.

5. Conclusions

The medicinal properties of T. camphoratus are well known worldwide. However, its slow growth limits its industrial application. In the current study, the addition of 2.5 g·L−1 of LWE and 25 μmol·L−1 of MJ promoted the growth of T. camphoratus mycelia and led to increases in the contents of PUFAs (LA and OA). Transcriptome studies and qRT−PCR results showed that 19 genes were enriched in the PUFA metabolism pathway. A bioinformatics analysis of three genes (FAD21, FAD22, SCD) revealed that they are important desaturases in unsaturated fat metabolic pathways. The FAD21 and FAD22 enzymes synthesize LA and hydrophobic transmembrane proteins from the FAD2 family. SCD is a hydrophobic transmembrane enzyme that plays an important role in the metabolism of PUFAs and is a catalytic enzyme for the synthesis of OA. The results of this study indicate the benefit of increasing the PUFA content in the mycelia of T. camphoratus and also provide new insights into the importance of the rapid and high−quality cultivation of T. camphoratus mycelia.

Supplementary Materials

The following supporting information can be downloaded at: https://www.mdpi.com/article/10.3390/separations11040127/s1, Figure S1: Ionic chromatogram of lemongrass water extract (LWE). Figure S2: 0.5, 1, 1.5, 2.0, and 2.5 g·L−1 lemongrass water extract (LWE) in basal medium culture T. camphoratus mycelia separately. Figure S3: 5, 10, 15, 20, and 25 μmol·L−1 methyl jasmonate (MJ) in basal medium culture T. camphoratus mycelia separately. Figure S4: (a)Analysis of gene coverage uniformity of CK (control), 2.5 g·L−1 LWE (lemongrass water extract) and 25 µmol·L−1 MJ (methyl jasmonate) samples; (b) FPKM violin di of CK (control), 2.5 g·L−1 LWE (lemongrass water extract) and 25 µmol·L−1 MJ (methyl jasmonate) in T. camphoratus mycelia. Figure S5: KEGG enrichment analysis of different groups. Figure S6: The agarose gel electrophoresis of three genes in T. camphoratus mycelia. Figure S7: Open reading frame of FAD21 (a), FAD22 (b), and SCD (c) in T. camphoratus mycelia; Conserved domain prediction of FAD21 gene and FAD22 gene in T. camphoratus mycelia (d). Table S1: annotation of five databases.

Author Contributions

J.L. conceived and designed the experiments; Y.W., J.L., Z.L. (Zixuan Lin) and G.C. performed the experiments, analyzed the data, prepared the figures, and wrote and revised the draft. J.L., D.L., B.L. and Z.L. (Zhanxi Lin) revised and edited the manuscript. All authors edited, reviewed, and approved the final draft. All authors have read and agreed to the published version of the manuscript.

Funding

This study was supported by the Fujian Provincial Natural Science Foundation General Project, “Regulatory Mechanism of Cytochrome P450 Gene in Lemongrass Oil−induced Triterpene Synthesis of Taiwanofungus camphoratus” (2021J0113) and a special project for the protection and utilization of agricultural resources of the Department of Agriculture and Rural Affairs of Fujian Province, “Research and application of key technologies for innovation and industrialized utilization of Juncao and Juncao mushroom” (22001XA).

Data Availability Statement

Data will be made available upon request.

Acknowledgments

We thank Yamei Lu and Dai Zhang from the College of Life Sciences at Fujian Agriculture and Forestry University for their help during the treatment of the experimental samples from 2022–2023.

Conflicts of Interest

The authors declare no conflict of interest.

References

  1. Liu, Y.; Chen, R.; Li, L.; Dong, R.; Yin, H.; Wang, Y. The triterpenoids-enriched extracts from Antrodia cinnamomea mycelia attenuate alcohol-induced chronic liver injury via suppression lipid accumulation in c57bl/6 mice. Food Sci. Hum. Wellness 2021, 10, 497–507. [Google Scholar] [CrossRef]
  2. Qiao, X.; Wang, Q.; Ji, S. Metabolites identification and multi−component pharmacokinetics of ergostane and lanostane triterpenoids in the anticancer mushroom Antrodia cinnamomea. J. Pharm. Biomed. Anal. 2015, 111, 266–276. [Google Scholar] [CrossRef] [PubMed]
  3. Lin, Z.H.; Lu, M.K.; Lo, H.C.; Chang, C.C.; Tseng, A.J.; Chao, C.H.; Lin, T.Y. ZnF3, a sulfated polysaccharide from Antrodia cinnamomea, inhibits lung cancer cells via induction of apoptosis and activation of M1-like macrophage−induced cell death. Int. J. Biol. Macromol. 2023, 238, 124–144. [Google Scholar] [CrossRef] [PubMed]
  4. Lu, M.K.; Cheng, J.J.; Lai, W.L.; Lin, Y.R.; Huang, N.K. Adenosine as an active component of Antrodia cinnamomea that prevents rat PC12 cells from serum deprivation−induced apoptosis through the activation of adenosine A2A receptors. Life Sci. 2006, 3, 252–258. [Google Scholar] [CrossRef] [PubMed]
  5. Fan, J.H.; Lai, K.S.; Huang, Y.Y.; Chen, H.Y.; Xiong, L.Q.; Guo, H.K.; Yang, Q.Q.; Zhang, B.B. Efficient production of Antrodin C by microparticle−enhanced cultivation of medicinal mushroom Antrodia cinnamomea. J. Biosci. Bioeng. 2023, 3, 232–237. [Google Scholar] [CrossRef]
  6. Lu, M.K.; Chao, C.H.; Chang, T.Y. A branched 2-O sulfated 1,3-/1,4-galactoglucan from Antrodia cinnamomea exhibits moderate antiproliferative and anti−inflammatory activities. Int. J. Biol. Macromol. 2023, 241, 124559. [Google Scholar] [CrossRef]
  7. Dakpa, G.; Kumar, K.J.S.; Nelen, J. Antcin-B, a phytosterol−like compound from Taiwanofungus camphoratus inhibits SARS-CoV-2 3-chymotrypsin−like protease (3CLPro) activity in silico and in vitro. Sci. Rep. 2023, 13, 17106. [Google Scholar] [CrossRef] [PubMed]
  8. Zhang, Y.; Lv, P.; Ma, J.; Chen, N.; Guo, H.; Chen, Y.; Gan, X.; Wang, R.; Liu, X.; Fan, S.; et al. Antrodia cinnamomea exerts an anti-hepatoma effect by targeting PI3K/AKT−mediated cell cycle progression in vitro and in vivo. Acta Pharm. Sin. B 2022, 12, 890–906. [Google Scholar] [CrossRef]
  9. Chang, C.C.; Lu, Y.C.; Wang, C.C.; Ko, T.L.; Chen, J.R.; Wang, W.; Chen, Y.L.; Wang, Y.W.; Chang, T.H.; Hsu, H.F.; et al. . Antrodia cinnamomea extraction waste supplementation promotes thermal stress tolerance and tissue regeneration ability of zebrafish. Molecules 2020, 25, 4213. [Google Scholar] [CrossRef]
  10. Cheng, J.J.; Chao, C.H.; Lu, M.K. Large-scale preparation of sulfated polysaccharides with anti−angionenic and anti-inflammatory properties from Antrodia cinnamomia. Int. J. Biol. Macromol. 2018, 113, 1198–1205. [Google Scholar] [CrossRef]
  11. Lu, M.K.; Chao, C.H.; Hsu, Y.C.; Chang, C.C. Structural sequencing and anti−inflammatory, anti-lung cancer activities of 1,4-α/β−sulfomalonoglucan in Antrodia cinnamomea. Int. J. Biol. Macromol. 2021, 170, 307–316. [Google Scholar] [CrossRef] [PubMed]
  12. Liao, Y.T.; Huang, K.W.; Chen, W.J.; Lai, T.H. A Botanical Drug Extracted from Antrodia cinnamomea: A first−in−human phase i study in healthy volunteers. J. Am. Coll. Nutr. 2023, 42, 274–284. [Google Scholar] [CrossRef] [PubMed]
  13. Liu, X.; Yu, S.; Zhang, Y.; Zhang, W.; Zhong, H.; Lu, X.; Guan, R. A review on the protective effect of active components in Antrodia camphorata against alcoholic liver injury. J. Ethnopharmacol. 2023, 300, 115740. [Google Scholar] [CrossRef] [PubMed]
  14. Jia, W.; Gai, S.P.; Li, X.H.; Zhang, J.S.; Wang, W.H. Transcriptional analysis of Antrodin C synthesis in Taiwanofungus camphoratus (Syn. Antrodia camphorate, Antrodia cinnamomea) to understand its biosynthetic mechanism. Fermentation 2024, 10, 28. [Google Scholar] [CrossRef]
  15. Lin, T.Y.; Tseng, A.J.; Chao, C.H.; Lu, M.K. Microelements induce changes in characterization of sulfated polysaccharides from Antrodia cinnamomea. Int. J. Biol. Macromol. 2018, 120, 952–958. [Google Scholar] [CrossRef] [PubMed]
  16. Lin, T.Y.; Lu, M.K.; Tseng, A.J.; Chao, C.H. Effects of sterol−type elicitors on biochemical characterization of polysaccharides from Antrodia cinnamomea. Int. J. Biol. Macromol. 2020, 162, 1476–1483. [Google Scholar] [CrossRef]
  17. Schisler, L.C. Stimulation of yield in the cultivated mushroom by vegetable oils. Appl. Microbiol. Biotechnol. 1967, 15, 844–850. [Google Scholar] [CrossRef] [PubMed]
  18. Schweitzer, B.; Balázs, V.L.; Molnár, S.; Szögi−Tatár, B.; Böszörményi, A.; Palkovics, T.; Horváth, G.; Schneider, G. Antibacterial effect of lemongrass (Cymbopogon citratus) against the aetiological agents of pitted keratolyis. Molecules 2022, 27, 1423. [Google Scholar] [CrossRef] [PubMed]
  19. Lorenzetti, B.B.; Souza, G.E.; Sarti, S.J.; Santos, F.D.; Ferreira, S.H. Myrcene mimics the peripheral analgesic activity of lemongrass tea. J. Ethnopharmacol. 1991, 34, 43–48. [Google Scholar] [CrossRef]
  20. Sforcin, J.M.; Amaral, J.T.; Fernandes, A.J.; Sousa, J.P.; Bastos, J.K. Lemongrass effects on IL−1beta and IL−6 production by macrophages. Nat. Prod. Res. 2009, 23, 1151–1159. [Google Scholar] [CrossRef]
  21. Cuomo, F.; Cofelice, M.; Lopez, F. Rheological characterization of hydrogels from alginate−based nanodispersion. Polymers 2019, 11, 259. [Google Scholar] [CrossRef] [PubMed]
  22. Somparn, N.; Saenthaweeuk, S.; Naowaboot, J.; Thaeomor, A.; Kukongviriyapan, V. Effect of lemongrass water extract supplementation on atherogenic index and antioxidant status in rats. Acta Pharm. Sin. 2018, 68, 185–197. [Google Scholar] [CrossRef] [PubMed]
  23. Kim, C.; Park, J.; Lee, H.; Hwang, D.Y.; Park, S.H. Evaluation of the EtOAc extract of lemongrass (Cymbopogon citratus) as a potential skincare cosmetic material for acne vulgaris. J. Biotechnol. 2022, 32, 594–601. [Google Scholar] [CrossRef] [PubMed]
  24. Gilling, D.H.; Ravishankar, S.; Bright, K.R. Antimicrobial efficacy of plant essential oils and extracts against Escherichia Coli. J. Environ. Sci. Health 2019, 54, 608–616. [Google Scholar] [CrossRef]
  25. Ramar, T.; Veeraperumal, S.; Kannan, S. Optimized extraction of polysaccharides from Cymbopogon citratus and its biological activities. Int. J. Biol. Macromol. 2014, 65, 415–423. [Google Scholar]
  26. Baek, M.W.; Choi, H.R.; Solomon, T.; Jeong, C.S.; Lee, O.-H.; Tilahun, S. Preharvest, methyl jasmonate treatment increased the antioxidant activity and glucosinolate contents of hydroponically grown Pak Choi. Antioxidants 2021, 10, 131. [Google Scholar] [CrossRef]
  27. Zhao, Y.; Yang, B.; Xu, H.; Wu, J.; Xu, Z.; Wang, Y. The phytophthora effector Avh94 manipulates host jasmonic acid signaling to promote infection. J. Integr. Plant Biol. 2022, 64, 2199–2210. [Google Scholar] [CrossRef] [PubMed]
  28. Tian, S.; Zhang, Z.; Siddiqui, M.; Ayala Zavala, J.; Hwang, C.A. Postharvest management approaches for maintaining quality of fresh produce. Springer Int. Publ. Switz. 2016, 1226, 97–111. [Google Scholar]
  29. Gomez, H.A.; Niederauer, G.F.; Minatel, I.O.; Antunes, E.R.M.; Carneiro, M.J.; Frankland Sawaya, A.C.H.; Zanus, M.C.; Ritschel, P.S.; Quecini, V.; Pereira Lima, G.P.; et al. Metabolite profiling reveals the influence of grapevine genetic distance on the chemical signature of juices. J. Sci. Food Agric. 2023, 1002, 13124. [Google Scholar] [CrossRef]
  30. Reyes-Díaz, M.; Lobos, T.; Cardemil, L.; Nunes-Nesi, A.; Retamales, J.; Jaakola, L.; Alberdi, M.; Ribera−Fonseca, A. Methyl Jasmonate: An alternative for improving the quality and health properties of fresh fruits. Molecules 2016, 21, 567. [Google Scholar] [CrossRef]
  31. Mousavi, S.R.; Niknejad, Y.; Fallah, H.; Tari, D.B. Methyl jasmonate alleviates arsenic toxicity in rice. Plant Cell Rep. 2020, 39, 1041–1060. [Google Scholar] [CrossRef] [PubMed]
  32. He, W.W.; Luo, H.; Xu, H.; Zhou, Z.Y.; Li, D.J.; Bao, Y.H.; Fu, Q.; Song, J.F.; Jiao, Y.; Zhang, Z.Y. Effect of exogenous methyl jasmonate on physiological and carotenoid composition of yellow maize sprouts under NaCl stress. Food Chem. 2021, 361, 130177. [Google Scholar] [CrossRef] [PubMed]
  33. Jiang, A.L.; Liu, Y.N.; Liu, R.; Ren, A.; Ma, H.Y.; Shu, L.B.; Shi, L.; Zhu, J.; Zhao, M.W. Integrated proteomics and metabolomics analysis provides insights into ganoderic acid biosynthesis in response to Methyl Jasmonate in Ganoderma lucidum. Int. J. Mol. Med. 2019, 20, 6116. [Google Scholar] [CrossRef] [PubMed]
  34. Meng, D.M.; Wang, H.D.; Zhang, Y.X.; Xi, Z.A.; Yang, R.; Sheng, J.P.; Zhang, X.H.; Ding, Y.; Wang, J.P.; Fan, Z.C. Ornithine decarboxylase is involved in methyl jasmonate−regulated postharvest quality retention in button mushrooms (Agaricus bisporus). J. Sci. Food Agric. 2019, 99, 790–796. [Google Scholar] [CrossRef] [PubMed]
  35. Wiktorowska-Owczarek, A.; Berezińska, M.; Nowak, J.Z. PUFAs: Structures, Metabolism and Functions. Adv. Clin. Exp. Med. 2015, 24, 931–941. [Google Scholar] [CrossRef] [PubMed]
  36. Bartella, L.; Mazzotti, F.; Talarico, I.R.; Santoro, I.; Di Donna, L. Paper spray tandem mass spectrometry for assessing oleic, linoleic and linolenic acid content in edible vegetable oils. Separations 2023, 10, 26. [Google Scholar] [CrossRef]
  37. Nava Lauson, C.B.; Tiberti, S.; Corsetto, P.A.; Conte, F.; Tyagi, P.; Machwirth, M.; Ebert, S.; Loffreda, A.; Scheller, L.; Sheta, D.; et al. Linoleic acid potentiates cytotoxic T lymphocytes (CD8+ T cell) metabolic fitness and antitumor immunity. Cell Metab. 2023, 35, 633–650. [Google Scholar] [CrossRef] [PubMed]
  38. Hamilton, J.S.; Klett, E.L. Linoleic acid and the regulation of glucose homeostasis: A review of the evidence. Prostaglandins Leukot Essent Fat. Acids 2021, 175, 102366. [Google Scholar] [CrossRef] [PubMed]
  39. Belury, M.A. Linoleic acid, an omega−6 fatty acid that reduces risk for cardiometabolic diseases: Premise, promise and practical implications. Curr. Opin. Clin. Nutr. Metab. Care 2023, 26, 288–292. [Google Scholar] [CrossRef]
  40. Leon−Aparicio, D.; Sánchez-Solano, A.; Arreola, J.; Perez−Cornejo, P. Oleic acid blocks the calcium-activated chloride channel TMEM16A/ANO. Biophys. Acta 2022, 1867, 159134. [Google Scholar]
  41. Lou, H.; Li, H.; Wei, T.; Chen, Q. Stimulatory Effects of Oleci Acid and Fungal Elicitor on Betulinic Acid Production by Submerged Cultivation of Medicinal Mushroom Inonotus obliquus. J. Fungi 2021, 7, 266. [Google Scholar] [CrossRef] [PubMed]
  42. Sande, D.; Oliveira, G.P.; Moura, M.A.F.E.; Martins, B.A.; Lima, M.T.N.S.; Takahashi, J.A. Edible mushrooms as a ubiquitous source of essential fatty acids. Food Res. Int. 2019, 125, 108524. [Google Scholar] [CrossRef] [PubMed]
  43. Koh, G.Y.; Chou, G.; Liu, Z. Purification of a water extract of Chinese sweet tea plant (Rubus suavissimus S. Lee) by alcohol precipitation. J. Agric. Food Chem. 2009, 57, 5000–5006. [Google Scholar] [CrossRef] [PubMed]
  44. Weitzhandler, M.; Barreto, V.; Pohl, C.; Jandik, P.; Cheng, J.; Avdalovic, N. CarboPac PA20: A new monosaccharide separator column with electrochemical detection with disposable gold electrodes. J. Biochem. Biophys. Methods 2004, 60, 309–317. [Google Scholar] [CrossRef] [PubMed]
  45. Kamran, S.H.; Ahmad, M.; Ishtiaq, S.; Ajaib, M.; Razashah, S.H.; Shahwar, D.E. Metabolite profiling and biochemical investigation of the antidiabetic potential of Loranthus pulverulentus wall n-butanol fraction in diabetic animal models. J. Ethnopharmacol. 2024, 318, 116963. [Google Scholar] [CrossRef] [PubMed]
  46. Ebadi, F.A.; Tajik, H.; Jafari, K.; Hoseinzadeh, E.; Mirahmadi, S.S.; Conti, G.O.; Miri, M. Evaluation of dioxin-like polychlorinated biphenyls in fish of the Caspian Sea. MethodsX 2020, 7, 100803. [Google Scholar]
  47. Wang, L.; Liu, Q.; Wang, N.; Li, S.; Bian, W.; Sun, Z.; Wang, L.; Wang, L.; Liu, C.; Song, C.; et al. Oleic Acid Dissolves cGAS-DNA Phase Separation to Inhibit Immune Surveillance. Adv. Sci. 2023, 10, e2206820. [Google Scholar] [CrossRef]
  48. Chini, V.; Foka, A.; Dimitracopoulos, G.; Spiliopoulou, I. Absolute and relative real-time PCR in the quantification of tst gene expression among methicillin−resistant Staphylococcus aureus: Evaluation by two mathematical models. Lett. Appl. Microbiol. 2007, 45, 479–484. [Google Scholar] [CrossRef] [PubMed]
  49. Fayed, B.; Kohder, G.; Soliman, S.S.M. Gas Chromatography−Mass Spectrometry (GC−MS) Analysis of Candida auris Metabolites. Methods Mol. Biol. 2022, 2517, 165–172. [Google Scholar]
  50. Wang, F. Semi-Quantitative RT-PCR: An Effective Method to Explore the Regulation of Gene Transcription Level Affected by Environmental Pollutants. Methods Mol. Biol. 2021, 2326, 95–103. [Google Scholar]
  51. Chuang, L.Y.; Cheng, Y.H.; Yang, C.H. Specific primer design for the polymerase chain reaction. Biotechnol. Lett. 2013, 35, 1541–1549. [Google Scholar] [CrossRef] [PubMed]
  52. Yang, Q.; Guo, B.; Sun, H.; Zhang, J.; Liu, S.; Hexige, S.; Yu, X.; Wang, X. Identification of the key genes implicated in the transformation of OLP to OSCC using RNA−sequencing. Oncol. Rep. 2017, 37, 2355–2365. [Google Scholar] [CrossRef] [PubMed]
  53. Patuel, S.J.; English, C.; Lopez-Scarim, V.; Konig, I.; Ivantsova, E.; Martyniuk, C.J. Dataset for diseases associated with exposure to broflanilide, a novel pesticide, in larval zebrafish (Danio rerio). Data Brief 2023, 50, 109534. [Google Scholar] [CrossRef] [PubMed]
  54. Gao, X.; Guo, Z.; Wang, P.; Liu, Z.; Wang, Z. Transcriptomic analysis reveals the potential crosstalk genes and immune relationship between IgA nephropathy and periodontitis. Front. Immunol. 2023, 30, 1062590. [Google Scholar] [CrossRef] [PubMed]
  55. Fernández, A.; Segura-Alabart, N.; Serratosa, F. The multi-furcating Neighbor−Joining algorithm for reconstructing polytomic phylogenetic trees. J. Mol. Evol. 2023, 91, 773–779. [Google Scholar] [CrossRef] [PubMed]
  56. Tamura, K.; Stecher, G.; Kumar, S. MEGA 11: Molecular Evolutionary Genetics Analysis Version 11. Mol. Biol. Evol. 2021, 10, 1093. [Google Scholar]
  57. Rosa, S.B.A.; Csordas, B.G.; do Valle Leone de Oliveira, S.M.; Ribeiro dos Santos, A.; Paniago, A.M.M.; Venturini, J. Prediction of conserved peptides of paracoccidioides for interferon−γ release assay: The first step in the development of a lab-based approach for immunological assessment during antifungal therapy. J. Fungi 2020, 6, 379. [Google Scholar] [CrossRef] [PubMed]
  58. Zhou, P.; Zhou, Z.; Huayu, M. A multi-epitope vaccine GILE against echinococcus multilocularis infection in mice. Front. Immunol. 2023, 13, 1091004. [Google Scholar] [CrossRef]
  59. Meng, L.; Luo, B.; Yang, Y.; Faruque, M.O.; Zhang, J.; Li, X.; Hu, X. Addition of vegetable oil to improve triterpenoids production in liquid fermentation of medicinal fungus Antrodia cinnamomea. J. Fungi 2021, 7, 926. [Google Scholar] [CrossRef]
  60. Cao, C.; Zhong, H.; Chen, Z.; Song, Z.; Hu, B.; Wang, X. Triterpene acid fromnalysis Version 11. Mol. Biol. Evol. 2023, 91, 773–777. [Google Scholar]
  61. Kuang, Y.; Li, B.; Wang, Z.; Qiao, X.; Ye, M. Terpenoids from the medicinal mushroom Antrodia camphorata: Chemistry and medicinal potential. Nat. Prod. Rep. 2021, 38, 83–102. [Google Scholar] [CrossRef] [PubMed]
  62. Menon, M.P.; Chien, Y.H.; Thomas, J.; Yu, Y.H.; Chang, C.T.; Hua, K.F. Nano Modification of Antrodia cinnamomea Exhibits Anti-Inflammatory Action and Improves the Migratory Potential of Myogenic Progenitors. Cells 2022, 11, 2512. [Google Scholar] [CrossRef] [PubMed]
  63. Liu, D.D.; Zhu, L.P.; Guo, Y.T.; Zhao, Y.M.; Betchem, G.B.; Yolandani, Y.; Ma, H.L. Enhancing submerged fermentation of Antrodia camphorata by low−frequency alternating magnetic field. Innov. Food Sci. Emerg. Technol. 2023, 86, 103382. [Google Scholar] [CrossRef]
  64. Suzuki, D.; Sato, Y.; Kamasaka, H.; Kuriki, T. Effects of phosphoryl oligosaccharides of calcium (POs−Ca) on mycelial growth and fruiting body development of the edible mushroom, Pleurotus ostreatus. J. Appl. Glycosci. 2020, 67, 67–72. [Google Scholar] [CrossRef] [PubMed]
  65. Chen, C.C.; Nargotra, P.; Kuo, C.H.; Liu, Y.C. High−molecular−weight exopolysaccharides production from Tuber borchii cultivated by submerged fermentation. Int. J. Mol. Sci. 2023, 24, 4875. [Google Scholar] [CrossRef] [PubMed]
  66. Zhang, Y.T.; Li, D.Y.; Wang, Z.; Zang, W.T.; Rao, P.; Liang, Y.X.; Mei, Y.X. Alpha-terpineol affects synthesis and antitumor activity of triterpenoids from Antrodia cinnamomea mycelia in solid-state culture. Food Funct. 2018, 12, 6517–6525. [Google Scholar] [CrossRef] [PubMed]
  67. Xia, Q.; Xu, Y.H.; Xiong, B.; Lin, D.; Huang, S.J.; Dong, T.T.; Sun, G.C.; Liao, L.; Deng, Q.X.; Wang, X.; et al. Effects of exogenous methyl jasmonate on the synthesis of endogenous jasmonates and the regulation of photosynthesis in citrus. Photobiol. Photosynth. 2020, 20, 15. [Google Scholar]
  68. Felipe, M.R.; Martin, R.; Tomas, C.; Ondrej, K. Analysis of fatty acid esters of hydroxy fatty acids in edible mushrooms. Food Sci. Technol. 2023, 173, 114311. [Google Scholar]
  69. Turk, A.; Lee, S.; Lee, H.H.; Yeon, S.W.; Ryu, S.H.; Seo, G.H.; Chang, H.Y.; Hwang, B.Y.; Lee, M.K. α−Glucosidase inhibitory fatty acids from Morchella fluvialis mushroom. Acta Pharm. 2023, 17, 369–379. [Google Scholar] [CrossRef]
  70. Dimitrijevic, M.V.; Mitic, V.D.; Nikolic, J.S. First report about mineral content, fatty acids composition and biological activities of four wild edible mushrooms. Chem. Biodivers. 2019, 16, e1800492. [Google Scholar] [CrossRef]
  71. Zhou, T.T.; Hu, W.K.; Yang, Z.B.; Li, J.M.; Zeng, X.F. Study on nutrients, non-volatile compounds, volatile compounds and antioxidant capacity of oyster mushroom cultivated with corn distillers’ grains. Food Sci. Technol. 2023, 183, 114967. [Google Scholar] [CrossRef]
  72. Cao, S.; Zhang, J.; Cheng, H. Identification and evolutionary analysis of FAD2 gene family in green plants. Trop. Plant Biol. 2021, 14, 239–250. [Google Scholar] [CrossRef]
  73. Liu, X.F.; Xia, Y.J.; Lai, P.F.H. An increase in cell membrane permeability in the in situ extractive fermentation improves the production of antroquinonol from Antrodia camphorata S−29. J. Ind. Microbiol. Biotechnol. 2020, 47, 197–207. [Google Scholar] [CrossRef] [PubMed]
  74. Zhao, M.; Wang, W.; Wei, L.; Chen, P.; Peng, L.; Qin, Z.; Yuan, F.; Wang, Z.; Ying, X. The evolution and biocatalysis of FAD2 indicate its correlation to the content of seed oil in plants. Int. J. Mol. Sci. 2019, 20, 849. [Google Scholar] [CrossRef] [PubMed]
  75. Nguyen, V.C.; Nakamura, Y.; Kanehara, K. Membrane lipid polyunsaturation mediated by fatty acid desaturase 2 (FAD2) is involved in endoplasmic reticulum stress tolerance in Arabidopsis thaliana. Plant J. 2019, 99, 478–493. [Google Scholar] [CrossRef] [PubMed]
  76. Zhou, C.; Pan, W.S.; Peng, Q.; Chen, Y.C.; Zhou, T.; Wu, C.; Hartley, H.; Li, J.; Xu, M.H.; Liu, C.W. Characteristics of Metabolites by Seed−Specific Inhibition of FAD2 in Brassica napus L. Journal of Agricultural and Food Chemistry. 2021, 69, 5452–5462. [Google Scholar] [CrossRef] [PubMed]
  77. Choudhary, A.K.; Mishra, G. Functional characterization and expression profile of microsomal FAD2 and FAD3 genes involved in linoleic and α−linolenic acid production in Leucas cephalotes. Physiol. Mol. Biol. Plants 2021, 27, 1233–1244. [Google Scholar] [CrossRef] [PubMed]
  78. Mauvoisin, D.; Mounier, C. Hormonal and nutritional regulation of SCD1 gene expression. Biochimie 2011, 93, 78–86. [Google Scholar] [CrossRef] [PubMed]
  79. Kikuchi, K.; Tsukamoto, H. Stearoyl−CoA desaturase and tumorigenesis. Chem. -Biol. Interact. 2020, 316, 108917. [Google Scholar] [CrossRef]
  80. Tracz-Gaszewska, Z.; Dobrzyn, P. Stearoyl−CoA Desaturase 1 as a therapeutic target for the treatment of cancer. Cancers 2019, 11, 948. [Google Scholar] [CrossRef]
Figure 1. (a) The growth of T. camphoratus mycelia in CK (control), 2.5 g·L−1 LWE (lemongrass water extract) and 25 µmol·L−1 MJ (methyl jasmonate); (b) the content of OA in T. camphoratus mycelia in CK (control), 2.5 g·L−1 LWE (lemongrass water extract), and 25 µmol·L−1 MJ (methyl jasmonate); (c) the content of LA in T. camphoratus mycelia CK (control), 2.5 g·L−1 LWE (lemongrass water extract), and 25 µmol·L−1 MJ (methyl jasmonate). Note: Differences were considered statistically significant and extra-significant at p ≤ 0.05 (*) and p ≤ 0.01 (**).
Separations 11 00127 g001
Figure 2. (a) PCA analysis of CK (control), 2.5 g·L−1 LWE (lemongrass water extract), and 25 µmol·L−1 MJ (methyl jasmonate) treatments; (b) cluster analysis among CK (control), 2.5 g·L−1 LWE (lemongrass water extract), and 25 µmol·L−1 MJ (methyl jasmonate) treatments; (c) gene Venn diagram of three treatments; (d) differential gene expression map of CK (control), 2.5 g·L−1 LWE (lemongrass water extract), and 25 µmol·L−1 MJ (methyl jasmonate) treatments.
Separations 11 00127 g002
Figure 3. (a) SCD, FAD21, and FAD22 act on the unsaturated fat pathway; (b) the qRT-PCR expression of 13 unigenes. These genes are related to fatty acid metabolism, including FAD21, FAD22, and SCD. Note: Differences were considered statistically significant and extra-significant at p ≤ 0.05 (*) and p ≤ 0.01 (**).
Separations 11 00127 g003
Figure 4. Hydrophilicity and hydrophobicity of FAD2−1 (a), FAD2−2 (b), and SCD (c); transmembrane region prediction for FAD2−1 (d) and SCD (e); prediction of secondary structure in FAD2−1 (f), FAD2−2 (g), and SCD (h). The blue line is the α−spiral; the red line is the extended chain; and the purple line is the irregular curl.
Separations 11 00127 g004
Figure 5. Phylogenetic tree of FAD21 (a), FAD22 (b), and SCD (c) in T. camphoratus mycelia, constructed using the NJ method by MEGA 11.
Separations 11 00127 g005
Figure 6. Prediction of tertiary structure model in FAD21 (a), FAD22 (b), and SCD (c); validation model of the predicted tertiary structure of FAD21 (d), FAD22 (e), and SCD (f).
Separations 11 00127 g006
Table 1. The internal reference genes and their primer sequences in T. camphoratus mycelia.
Primers Sequences (5′-3′)
SCD FCTTGATTGGCGTTTGGATCT
SCD RATGCCAGAAGAAGCGACCTA
Cytochrome P450 monooxygenase (CYP 151) FGGATGTCGTTGCGCAGATTC
Cytochrome P450 monooxygenase (CYP 151) RCGACCACCACTGCGATCATA
Putative aryl−alcohol dehydrogenase (pacs) FATCAGTTCGTCGGCCATTAC
Putative aryl−alcohol dehydrogenase (pacs) RTGCAGTGAGTGTGACGTTGA
FAD21 FACAATGCGCACCATAAAACA
FAD21 RCCCATCGCGTTAGTCGTTAT
O-methyltransferase gedA (O−myse) FAGTGCCTCCCTAGTGCAGAA
O-methyltransferase gedA (O−myse) RATCAGGCTGCTCAATTTGCT
Acyl-coenzyme A thioesterase (AcAs) FGAAACTGTGGGACCAGGAGA
Acyl-coenzyme A thioesterase (AcAs) RCGTGTATTGTCTGCCCATTG
Acyl-CoA dehydrogenase (ACD) FGGGCATTCAAATCGCTAAAA
Acyl-CoA dehydrogenase (ACD) RGATACGCCCTTCATTCAGGA
Short acyl−CoA dehydrogenase scds FAAGGTGATGTGCTTGCACTG
Short acyl−CoA dehydrogenase (scds) RCTTGCCATATTTGAGCAGCA
Acyl-coenzyme A thioesterase (Acdse) FGCCAAGGAACTGCAGAAGAC
Acyl-coenzyme A thioesterase (Acdse) RGATCTCGTGTAAGCGCATGA
Linoleate 10R−lipoxygenase (LA10r−se) FAGCAGCTGCACAAGACTTCA
Linoleate 10R−lipoxygenase (LA10r−se) RCTCCCGCATAACCTTGACAT
Vanillin dehydrogenase (VDse) FTCAGCAACTTCAACCACGAG
Vanillin dehydrogenase (VDse) RCACTTCAGGCTCTCCTCCAC
Branched chain-specific acyl−CoA dehydrogenase (Bcsdse) FTAGCCTTTGTGCTGTCATCG
Branched chain-specific acyl−CoA dehydrogenase (Bcsdse) RCCTCTTCTTCGCACGACTTC
FAD22 FTGCTGACTTATCTCCATCATTCC
FAD22 RCTTGGACCCCATTGTCTTG
Actin FATTCTCGTCTCATGGCCTTTC
Actin RGTCGCAGCTGGAGTTGATTA
Table 2. Raw data information of CK (control), 2.5 g·L−1 LWE (lemongrass water extract), and 25 µmol·L−1 MJ (methyl jasmonate) treatments.
SampleRaw Read Number (bp)Raw Bases (bp)Raw Q30 Number (bp)Raw NrateRaw Q20 Rate (%)Raw Q30 Rate (%)
CK143,988,4366,598,265,4006,005,976,3010.00058696.8291.02
CK242,045,3706,306,805,5005,705,731,1060.00057796.5790.46
CK342,579,8746,386,981,1005,799,211,7760.00055496.7990.79
LWE141,970,3766,295,556,4005,680,465,6850.0006496.4590.22
LWE242,804,3486,420,652,2005,779,971,5060.00063896.3490.02
LWE342,313,1426,346,971,3005,780,384,7370.00061796.891.07
MJ145,274,4506,791,167,5006,160,571,2360.00056796.7390.71
MJ241,820,1566,273,023,4005,706,592,4620.0005696.8390.97
MJ343,813,8666,572,079,9005,991,770,0580.00061896.8691.17
Table 3. Evaluation sequencing data in CK (control), 2.5 g·L−1 LWE (lemongrass water extract), and 25 µmol·L−1 MJ (methyl jasmonate) treatments.
SampleTrimmed Read Number (bp)Trimmed Bases (bp)Useful Read (%)Useful Bases (%)
CK141,367,0306,205,054,50094.0494.04
CK239,768,2165,965,232,40094.5894.58
CK340,409,1586,061,373,70094.994.9
LWE139,689,7805,953,467,00094.5694.56
LWE240,401,3926,060,208,80094.3894.38
LWE339,986,3705,997,955,50094.594.5
MJ142,780,5646,417,084,60094.4994.49
MJ239,540,2165,931,032,40094.5494.54
MJ341,449,6926,217,453,80094.694.6
Table 4. HISAT2 comparison results of the correct sequencing data in CK (control), 2.5 g·L−1 LWE (lemongrass water extract), and 25 µmol·L−1 MJ (methyl jasmonate) treatments.
SampleTotal MappedUniquely MappedMap EventsMapped to GeneMapped to Exon
CK139,170,219 (94.69%)38,449,806 (98.16%)38,449,80636,413,793 (94.70%)36,302,523 (99.69%)
CK237,451,028 (94.17%)36,756,202 (98.14%)36,756,20234,864,214 (94.85%)34,773,751 (99.74%)
CK337,713,189 (93.33%)37,083,669 (98.33%)37,083,66935,015,905 (94.42%)34,881,302 (99.62%)
LWE137,624,754 (94.80%)36,909,466 (98.10%)36,909,46634,927,870 (94.63%)34,836,929 (99.74%)
LWE238,302,378 (94.80%)37,531,270 (97.99%)37,531,27035,399,289 (94.32%)35,288,391 (99.69%)
LWE337,636,026 (94.12%)36,900,546 (98.05%)36,900,54634,847,007 (94.43%)34,745,804 (99.71%)
MJ140,113,869 (93.77%)39,269,479 (97.90%)39,269,47937,244,117 (94.84%)37,144,889 (99.73%)
MJ237,641,204 (95.20%)36,754,340 (97.64%)36,754,34034,869,880 (94.87%)34,782,747 (99.75%)
MJ338,788,515 (93.58%)38,066,007 (98.14%)38,066,00736,089,745 (94.81%)35,984,942 (99.71%)
Disclaimer/Publisher’s Note: The statements, opinions and data contained in all publications are solely those of the individual author(s) and contributor(s) and not of MDPI and/or the editor(s). MDPI and/or the editor(s) disclaim responsibility for any injury to people or property resulting from any ideas, methods, instructions or products referred to in the content.

