
Graph Theory Approach to COVID-19 Transmission by Municipalities and Age Groups

1
Center for Research and Development in Mathematics and Applications (CIDMA), Department of Mathematics, University of Aveiro, 3810-193 Aveiro, Portugal
2
Public Health Unit, Baixo Vouga Health Centers Cluster, 3810-164 Aveiro, Portugal
*
Author to whom correspondence should be addressed.
Math. Comput. Appl. 2022, 27(5), 86; https://doi.org/10.3390/mca27050086
Submission received: 6 July 2022
/
Revised: 27 September 2022
/
Accepted: 5 October 2022
/
Published: 13 October 2022
(This article belongs to the Collection Mathematical Modelling of COVID-19)
Abstract
:The COVID-19 pandemic remains a global problem that affects the health of millions of people and the world economy. Identifying how the movement of people between regions of the world, countries, and municipalities and how the close contact between individuals of different age groups promotes the spread of infectious diseases is a pressing concern for society, during epidemic outbreaks and pandemics, such as COVID-19. Networks and Graph Theory provide adequate and powerful tools to study the spread of communicable diseases. In this work, we use Graph Theory to analyze COVID-19 transmission dynamics between municipalities of Aveiro district, in Portugal, and between different age groups, considering data from 2020 and 2021, in order to better understand the spread of this disease, as well as preparing actions for possible future pandemics. We used a digraph structure that models the transmission of SARS-CoV-2 virus between Aveiro’s municipalities and between age groups. To understand how a node fits over the contact digraphs, we studied centrality measures, namely eigencentrality, closeness, degree, and betweenness. Transmission ratios were also considered to determine whether there were certain age groups or municipals that were more responsible for the virus’s spread. According to the results of this research, transmissions mostly occur within the same social groupings, that is, within the same municipalities and age groups. However, the study of centrality measures, eliminating loops, reveals that municipalities such as Aveiro, Estarreja and Ovar are relevant nodes in the transmission network of municipalities as well as the age group of 40–49 in the transmission network of age groups. Furthermore, we conclude that vaccination is effective in reducing the virus.
1. Introduction
The pandemic caused by the SARS-CoV-2 virus, known as COVID-19, remains a major problem on a global scale. The virus not only affected the health of millions of people, but it also hindered the growth of economies around the world. Overpopulation, globalization, and hyper-connectivity have been identified as important factors that have accelerated the transmission of this infectious disease, turning the epidemic into a pandemic [1].
Concerning the SARS-CoV-2 virus, the main transmission mode was recognized as the dissemination of aerosol droplets by normal breathing and speech [2]. In this sense, aerosol exposure related to SARS-CoV-2 and the risk of infection have led to further studies [3]. However, the spread of infectious diseases is mainly caused by two factors: the virus’s physical and chemical properties, and the way people interact with each other through their social networks [4]. Humans are not passive hosts for viruses; they actively interact with one another and, as a consequence, transfer diseases to socially predictable subjects and locations [4]. The way people build social networks influences the overall status and pattern of a virus spread. In fact, one common research question is to identify which network characteristics predict the importance of a node regarding the disease spreading [5,6,7]. More precisely, structural network measures, such as centrality measures, are sought that classify nodes in the same order of some quantity describing their importance in relation to the spread of the disease [8,9]. Some studies aim to investigate the predictive power of such centrality measures [10,11].
In Portugal, several restrictive measures were taken between 2020–2021. With the aim of preventing the virus transmission, on 18 March 2020, with the declaration of the first state of emergency, extraordinary and urgent restrictive measures were applied in terms of movement rights and economic freedoms. This state of emergency ended on 2 May, and was followed by a decrease in the epidemic crisis. During the summer of 2020 until the next state of emergency on 6 November 2020, the Portuguese government changed contingency states or alert states depending on the countryside or regional epidemic situation. In September 2020, an increase marking the beginning of a second wave peaked in November with over 6000 daily new cases despite the reintroduction of some restrictive measures in late October and early November 2020 [12].
This paper focuses on the social networks, particularly on concepts of centrality measures in a graph identifying important nodes. We consider centrality measures from graph theory, to better interpret the COVID-19 transmission network in Aveiro, Portugal, considering their municipalities as well as the role of the different age groups in the spread of the virus.
Graph theory is a powerful tool for measuring and describing social interactions, being commonly used to describe social networks. Graphs are mathematical models that represents relationships between entities that are the vertices of the graph and the relationships between them represented by links or edges of the graph. They can be used to model anything from chemical structures [13] to city drainage systems [14] or to human brain networks [15]. If the edges are directed from one vertex to other, the graph is called a directed graph or digraph. In this case the edges are called arcs and the vertices are called nodes. We use a digraph to represent the transmission of SARS-CoV-2 virus between Aveiro’s municipalities and between age groups and we study some centrality measures to explain it. In [16] the centrality measures as a way to control the spread of the virus through vaccination were studied.
SARS-CoV-2 transmission was previously interpreted using these methods in countries like Italy [17], India [1], and Turkey [18] with different levels of results. Several research studies on the spread of diseases are based on graph models and show how their use can significantly help in controlling dissemination [16,19,20,21].
2. Materials and Methods
In this study, all COVID-19 related test results in Baixo Vouga Primary Care Cluster (ACES BV) reported to the Public Health Unit (PHU) between 8 March 2020, and 14 January 2022 (N = 17,568) were considered. However, due to missing numbers and/or insufficient information in the data for 2022, only the first two years of data were considered. Since the study’s focus was on the dynamics between municipalities and age groups, the database was filtered to contain just the relevant data for this purpose. The dataset was also filtered to eliminate missing and repetitive items.
The resulting dataset was then used to generate contact matrices for age groups and municipalities for 2020 and 2021, as well as January-June, July-September, and October-December time intervals for 2021 (in this latter period the data are more complete), allowing a comparative study between the two complete years as well as considering the children’s school year. First, to realize the global dynamics of COVID-19 disease in the period 2020–2021, we studied the contact matrices considering the data from this period referring to age groups and municipalities. Then, to detect the importance/influence of a node in the transmission of the virus, we studied some centrality measures. For this, the contact matrices were used to generate digraphs where the nodes represent the municipalities or age groups and there is a weighted arc linking two nodes if there is transmission between them. The weight of an arc quantifies the level of transmission. In this case, loops, which are arcs that start and end at the same node, were taken out because the centrality measures were meant to focus on the relationships between nodes, and thus only the arcs that represented transmissions between nodes were kept. A path in a digraph is a sequence of nodes in which there is an arc pointing from each node in the sequence to its successor in the sequence, with no repeated arcs. The length of a path is the sum of the weights of its arcs. If the digraph is unweighted, then we assume that the weight is one. The shortest path in a digraph is a path such that the sum of the weights of its constituent arcs is minimum [22].
The following centrality measures were applied: closeness centrality, betweenness centrality, eigencentrality, degree centrality. The closeness centrality of a node represents its proximity to all other nodes in the network. It is calculated as the average of the shortest path lengths from one node to all other nodes in the network, and so represents the transmission strength. The closeness centrality of a node , , is defined by
where is the distance (length of the shortest path) between nodes and .
The betweenness centrality evaluates a node’s impact on the information flow in the network, and thus it represents the power of a node as a bridge between nodes [15]. The betweenness centrality of a node , , is defined by
where is the total number of shortest paths from to and the number of those paths that pass through .
The eigencentrality is another way to figure out how important a node is in a network, and looks at how strong/relevant each node’s neighbors are in the proximity network [23]. In this way, a node with a few relevant neighbors has a larger eigenvector centrality than a node with various neighbors of limited relevance. This measure is computed by assuming that the centrality of node is proportional to the sum of centrality of node ’s neighbors.
The degree centrality is the number of arcs incident on a node [24] and refers to the sum of the indegree and outdegree centrality measures.
Closeness and betweenness centrality measures are based on the shortest paths that can be taken from one node to every other node in the network. Since in our case the arc’s weights are the number of transmission cases between two nodes, that is, the greater the number of transmissions, the higher the arc’s weight, and consequently the closer the nodes involved should be, we consider the inverse of the arc’s weights as entries of the contact matrices to perform the calculations for the centrality measures.
All the digraphs and the calculation of the centrality measures were made using the igraph R package [25].
Matrices were also used to make transmission ratios by figuring out the ratio between the number of people infected by each group and the number of people infected in each group. This allowed to find out which groups spread the most per person. Furthermore, ratio values greater than one indicate that this group increased the prevalence of COVID-19 by stating that, on average, each individual in the target group infected more than one person and therefore disseminated the virus.
3. Results
3.1. Contact Matrices and Digraphs Relating to the Whole-Time Span for Both Municipality Data as Well as Age Group Data
Table 1 and Table 2 show the contact matrices according to the overall time span of the data (2020 to 2021), both for data relating to municipalities and for data relating to distinct age groups. In the following tables the color coding helps to discern the level of transmission, where a darker color corresponds to a higher value.
The municipalities data matrix displays a pattern, that is, the higher number is always given in the principal diagonal which means that the highest number of infections was within the municipality itself. However, in the age group matrix, this is not so evident, occurring in some groups but always at a much lower level than the other matrix, being the transmission more dispersed on the lines. This trend implies that, for both municipalities and age groups, transmissions preferentially occur with the same group. Furthermore, in Table 1 the transmission numbers have a two-decade gap, which may be justified by the existence of a relationship between parents and children. In Table 2, excluding the principal diagonal, the higher values coincide with geographically close municipalities.
3.2. Centrality Measures and Transmission Ratios
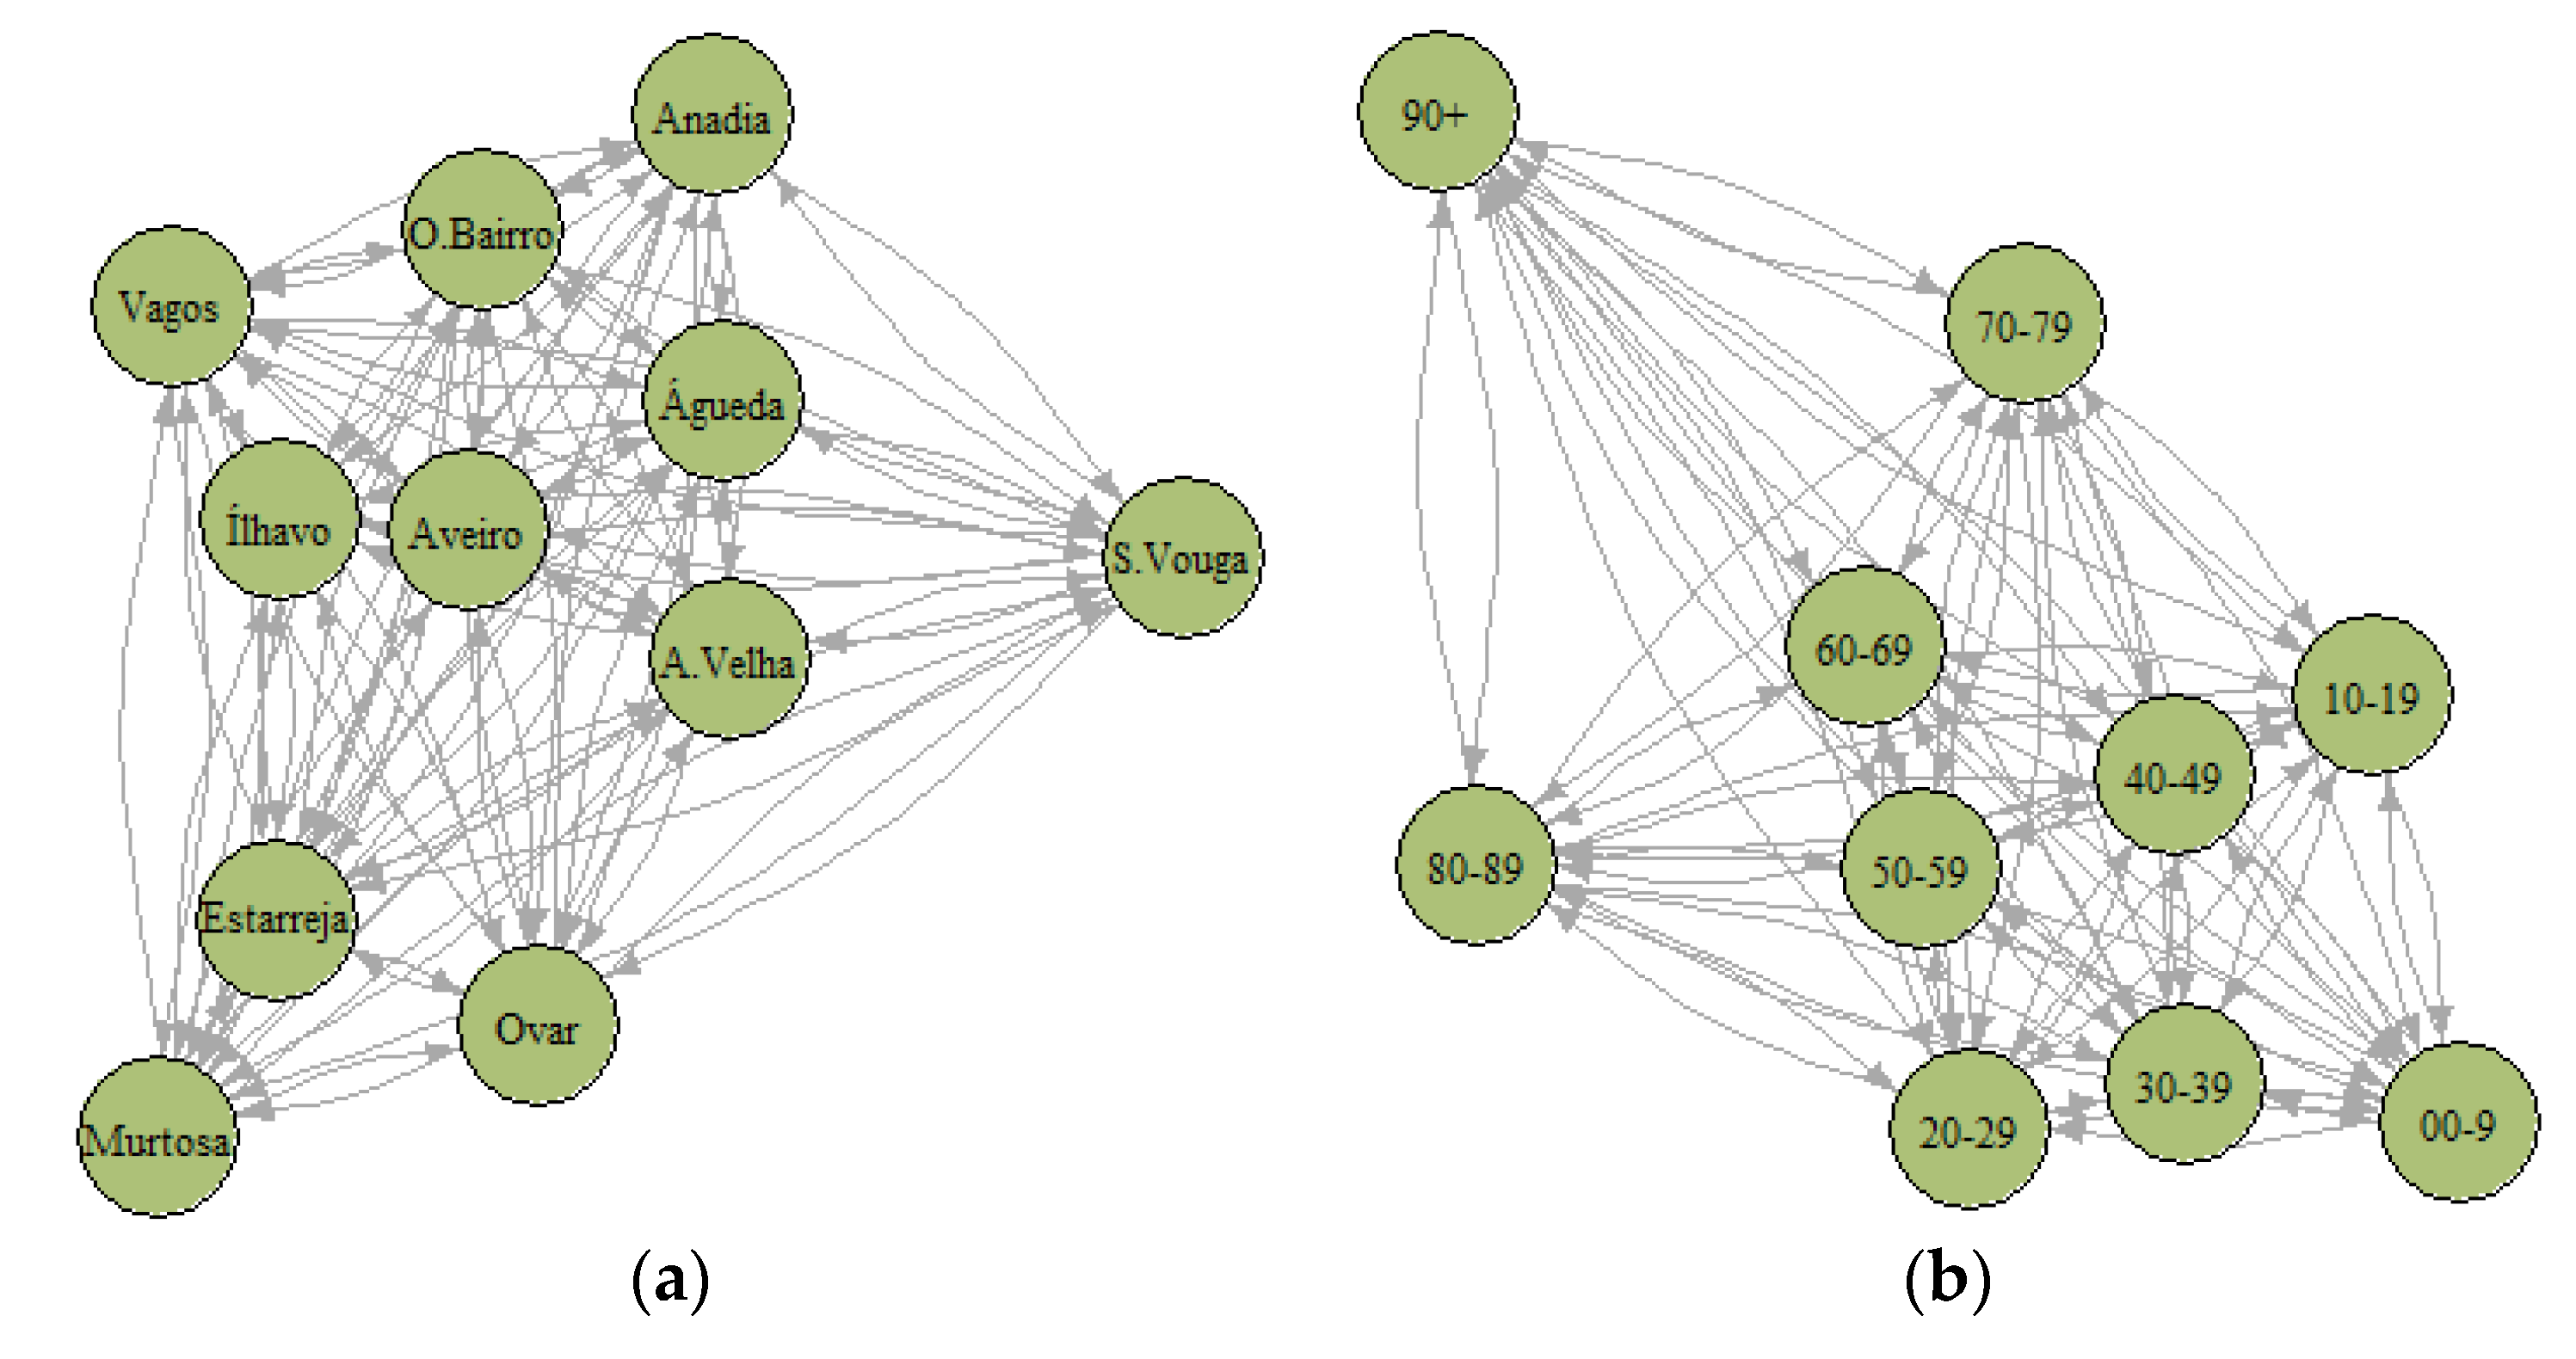
Since, in the study of centrality measures, the main goal is to study the level of transmission between different classes, the loops were eliminated from the digraphs; that is, the entries of principal diagonal of the contact matrices have been rewritten with zeros. The digraphs corresponding to contact matrices for municipalities and age groups are presented in Figure 1. The network structure conforms to the distances between the nodes (see Section 2 distance definition) in both municipalities and ages digraphs. For example, in the left digraph can be visualize an isolation of the S. Vouga municipality and in the right digraph is the 90+ age group that is isolated.
To facilitate the results interpretation, using the same scale, we normalize the values for closeness and eigencentrality according to the min-max scaling:
where is the calculated value and min and max are, respectively the minimum and maximum of the calculated value concerning all municipalities or age groups.
3.2.1. Municipalities Analysis for 2020 and 2021
Table 3 presents centrality measures by municipalities and by year (2020 and 2021). Aveiro, district capital, has the highest values for closeness centrality, degree centrality, and betweenness centrality for both years which means that Aveiro is the municipality with the highest transmission speed, like a transmission bridge between municipalities with the most connections. In terms of closeness centrality, we can also highlight Ílhavo and Águeda that have highest mean values. In terms of eigencentrality, Ílhavo and Vagos are the municipalities that present the highest mean value, which means that the population of Ílhavo and Vagos becomes easily infected because they are connected to a node whose population is easily infected. Therefore, we may conclude that their neighbors are, in general, responsible for the higher transmission. Geographically Ílhavo borders Aveiro and Vagos and Vagos borders Aveiro, Ílhavo and O. Bairro.
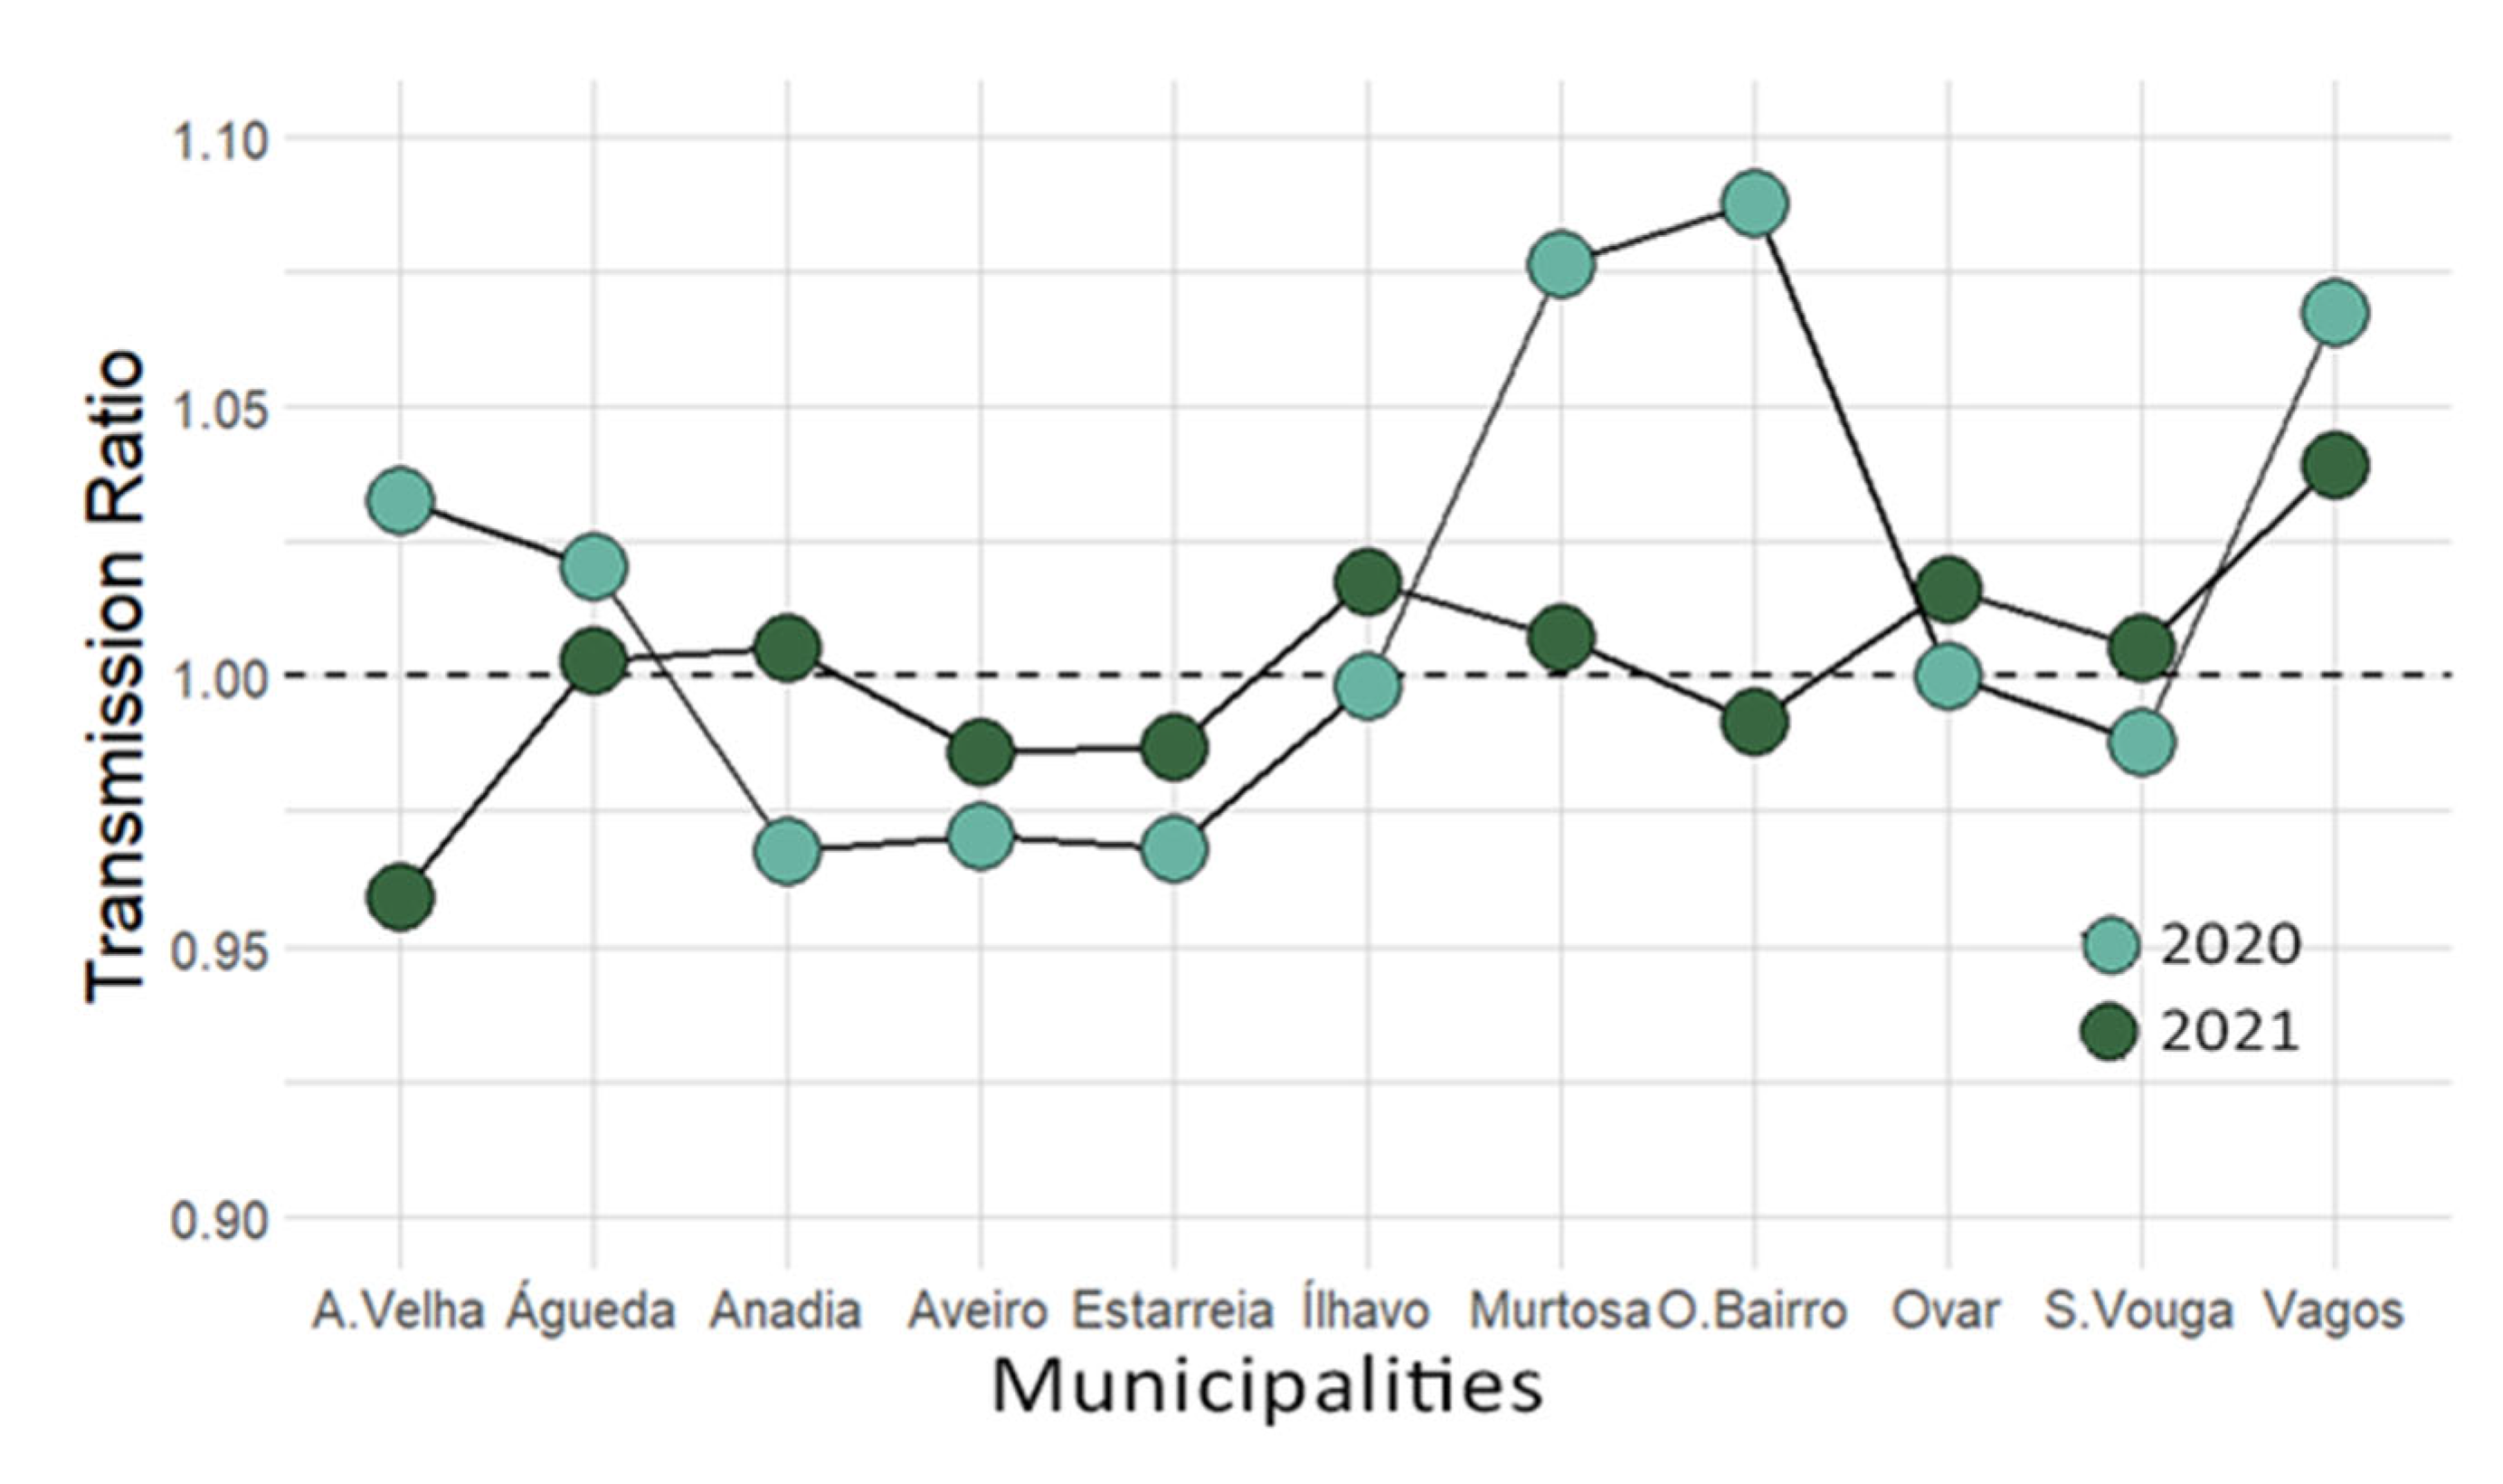
The transmission ratios for both years are shown in Figure 2, and no municipality seems to contrast with the others, being all practically similar in both years. However, A. Velha and O. Bairro, present transmission ratios with opposite signs in 2020 and 2021. It is also observed that Murtosa, O. Bairro, and Vagos are above the other municipalities in 2020.
3.2.2. Municipalities Analysis in 2021
When subdividing the 2021 data (Jan–Jun, Jul–Sept and Oct–Dec), it is possible to better understand the dynamics of the disease throughout the year. The division of 2021 attempted to illustrate the changes that particularly occur in the summer (second interval, Jul–Sept).
Thus, regarding the closeness centrality (Table 4), Estarreja and Ovar were the municipalities that presented the highest transmission speed in the first interval, suggesting that these municipalities are able to disseminate the virus efficiently, taking a central position in the network, that is, they require few intermediates for contacting others. In the second interval (summer and vacations period), most municipalities report numbers that warrant higher transmission. In the third interval, we can highlight Aveiro and Ílhavo since they are the municipalities with highest transmission speed and S. Vouga with the smallest one, which is a municipality with an ageing population and is geographically isolated.
The betweenness centrality reveals that Aveiro was the most relevant municipality since it was shown to have the highest value in all the intervals, in agreement with what was already presented in the analysis of the full year. Aveiro is the municipality that most serves as a link between municipalities when it comes to the transmission of COVID-19 throughout the year, regardless of the seasons. This is also applicable to the degree centrality, since Aveiro is the municipality with the highest values for this measure throughout the time intervals. This would be expected since Aveiro is the district capital and therefore it has connectivity with almost other municipalities throughout the year.
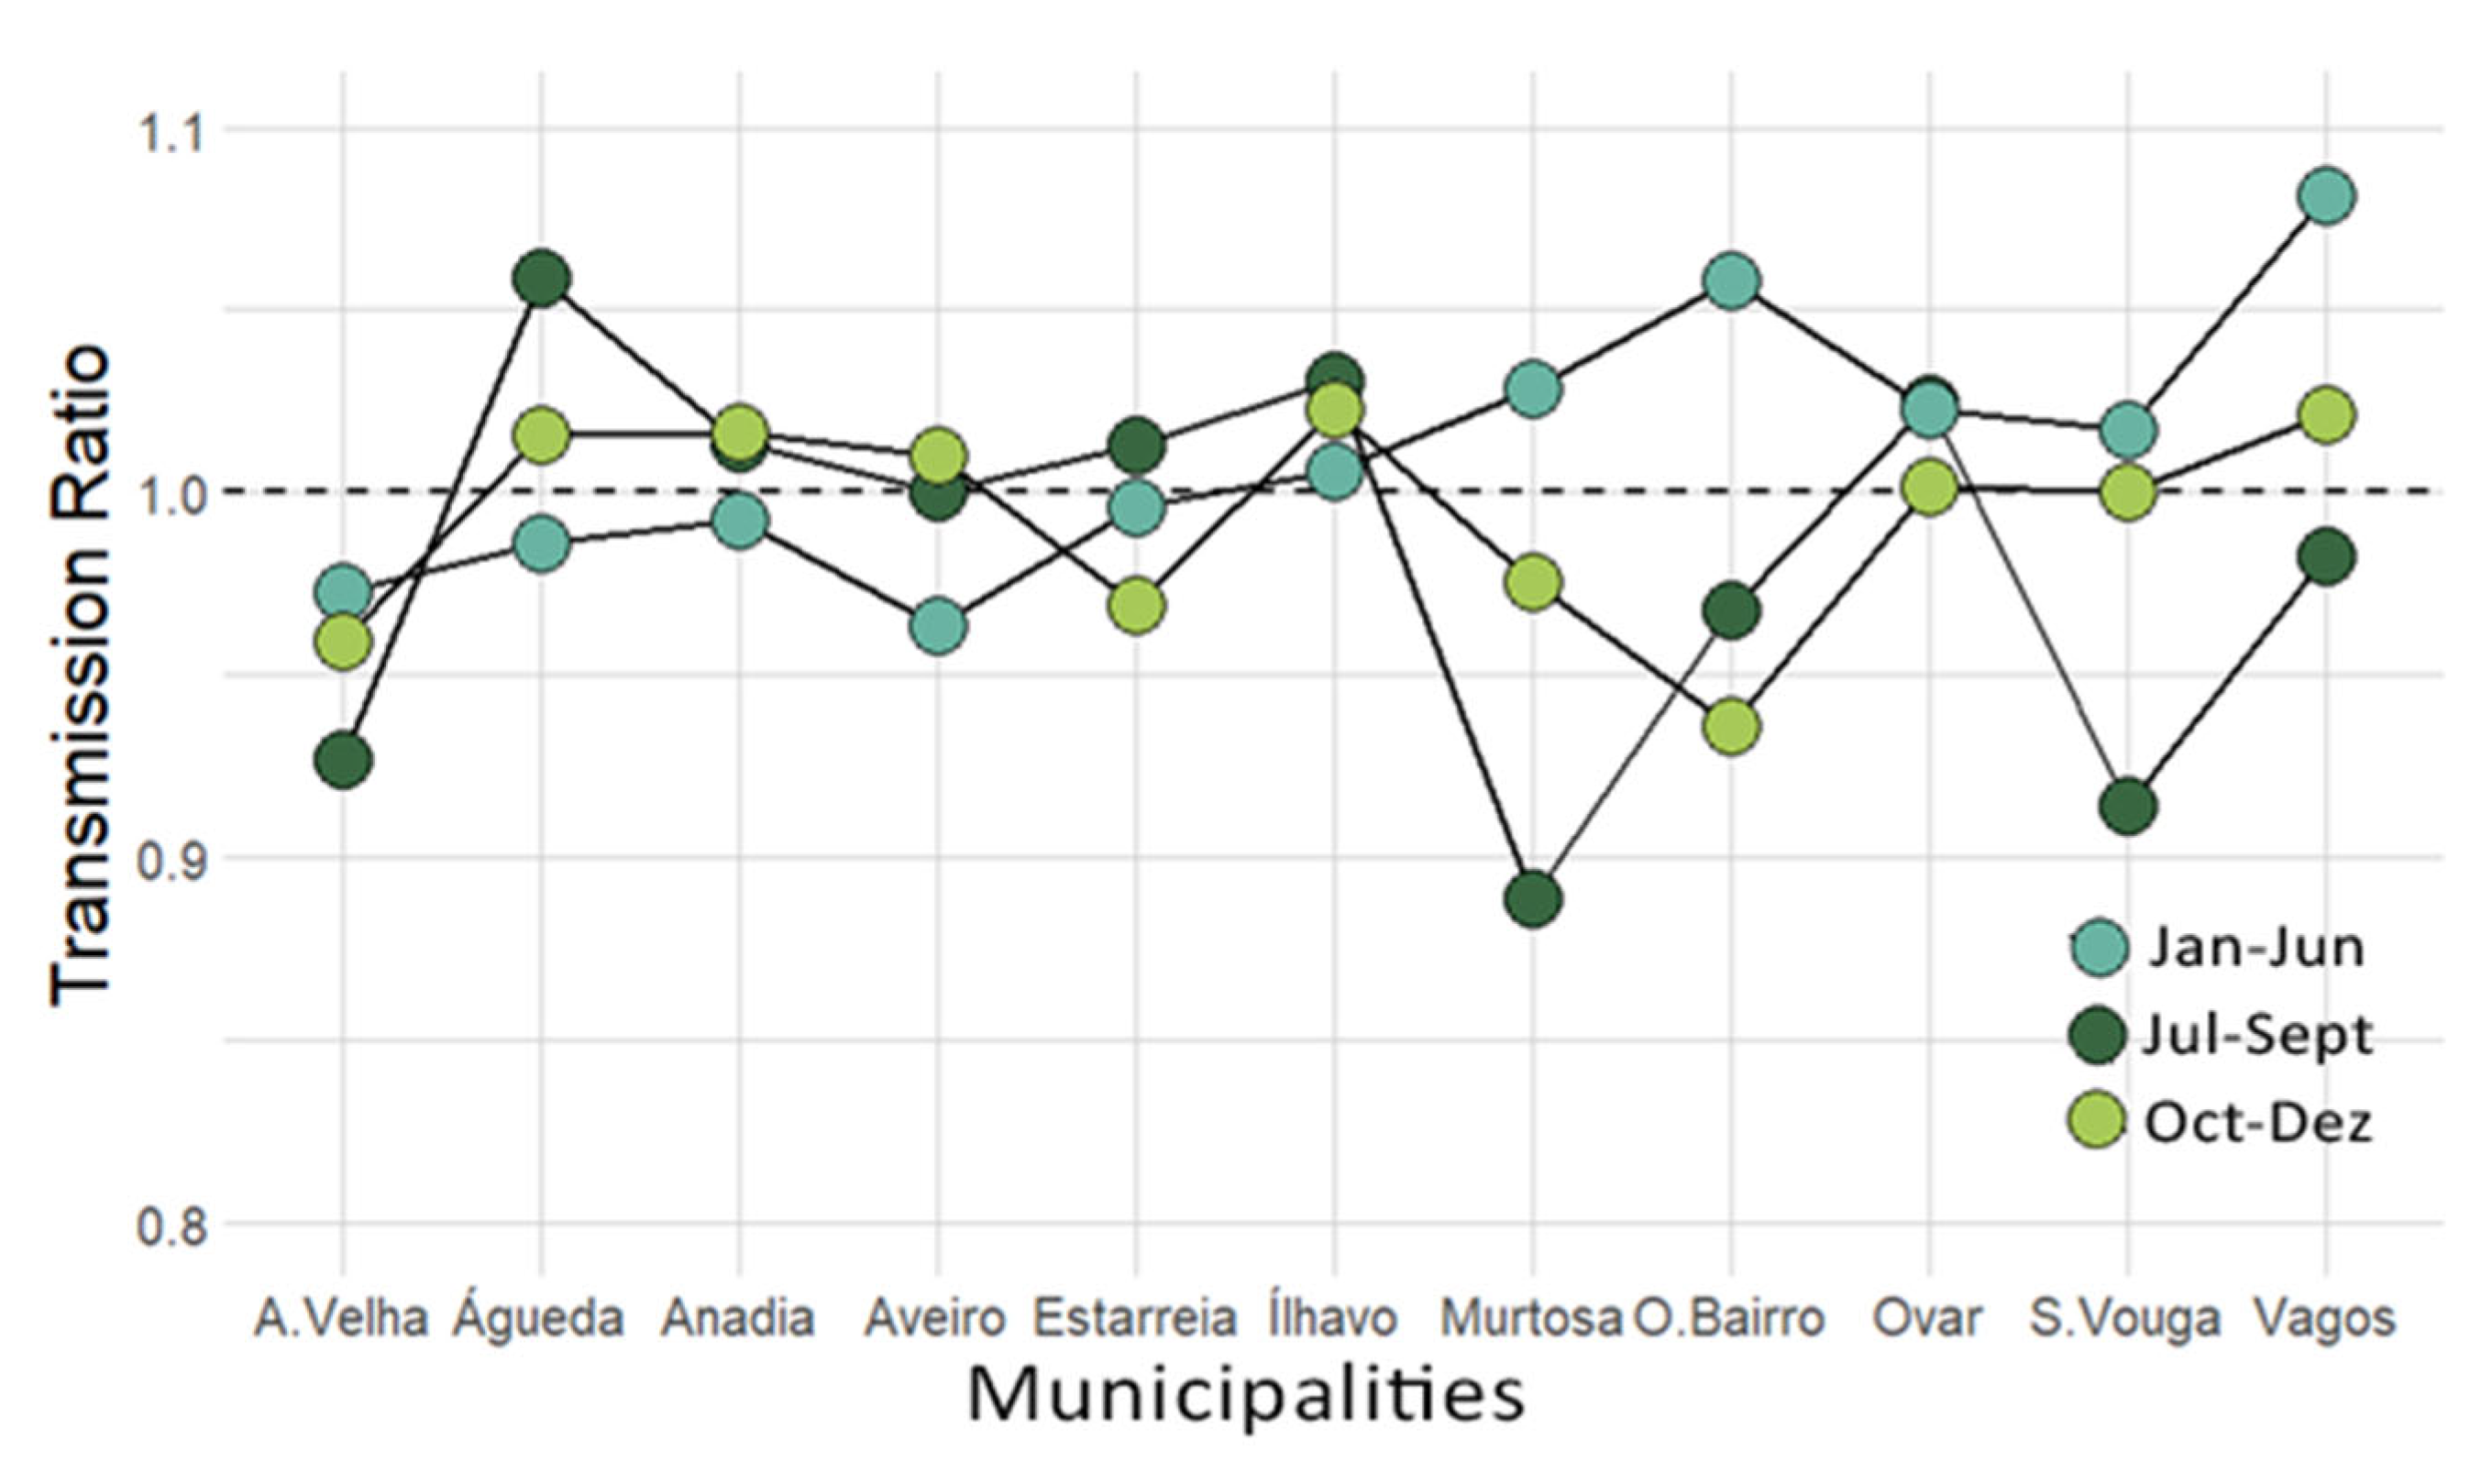
Analogously to the previous study, the transmission ratio regarding the municipality data for Jan–Jun, Jul–Sept and Oct–Dec time intervals (Figure 3), we observe low level of transmission ratios, ranging between 0.88 and 1.08. In this case, Murtosa, O. Bairro stand out from the other ones, regarding Jan–Jun vs. Jul–Sept.
3.2.3. Age Groups Analysis in 2020–2021
Table 5 shows that the centrality measures for the age group data for 2020 and 2021. Globally, the behavior, along the age groups, of the centrality measures is similar. The age group 40–49 is highlighted since it presents the highest values of closeness and betweenness centrality measures. The highest value on closeness means the effectiveness of virus transmission by this age group and the highest value of betweenness means that the node 40–49 lies on the shortest path between other nodes, showing that this age group is a ‘bridge’ between nodes on the network.
Considering the degree centrality measure, the values are identical, given that all age groups interact with each other.
In the eigencentrality measure, the ages between 00–09 and above 90+ were the ones that showed the highest values. Although they are not super spreader age groups, they have contact with age groups that are more responsible for the disease transmission, such as those presented in the closeness centrality measure. We may associate this fact with the extra need for attention and care required by children and elderly people.
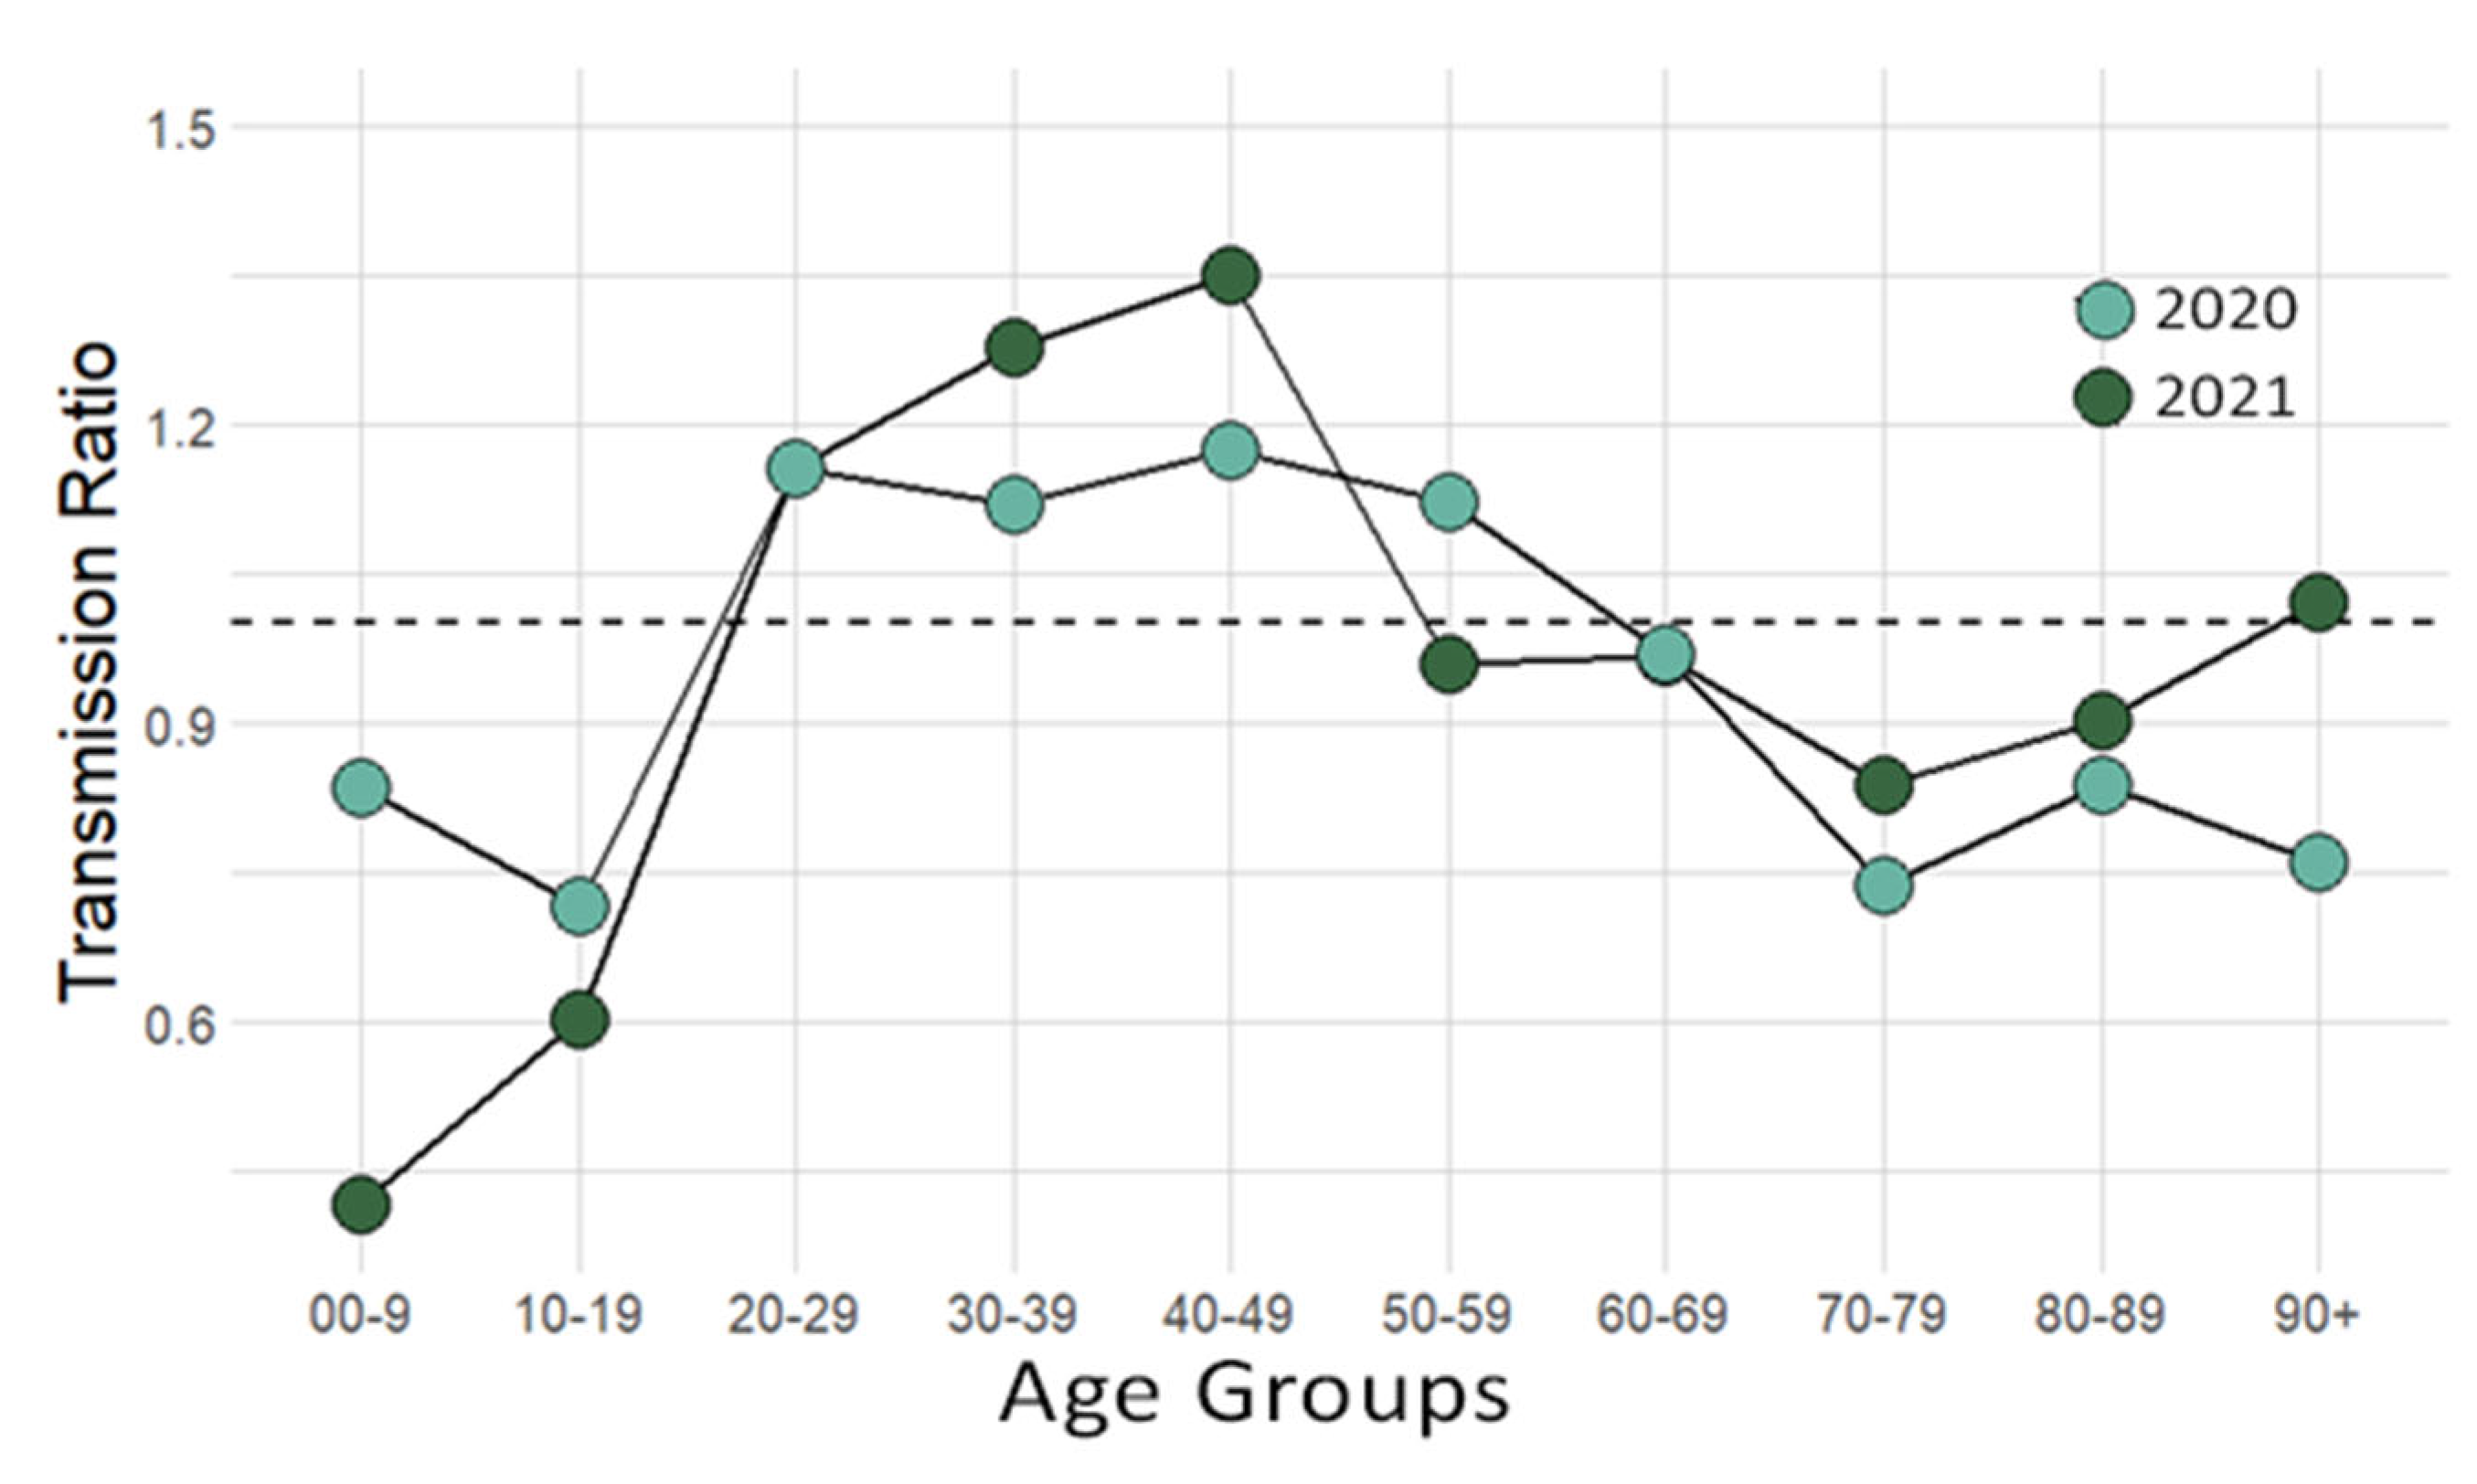
The transmission ratios for both years are depicted in Figure 4. In the first year, the age groups with values greater than 1 are those between 20 and 59 years old, showing that each infected person in this group, on average, infected more than one person, and thus these ages are the most responsible for the spread of the disease. However, in the second year, the age range with the highest values reduces to 20 to 49 years old.
3.2.4. Age Group Analysis in 2021
Table 6 presents the centrality measures for age group in 2021. In terms of closeness centrality, the Jan–Jun and Oct–Dec presents consistent values against the Jul–Sept period. Note that in the Jul–Sept period the 20–29 age group has the highest value in opposition to 40–59 in the other two periods. In terms of the betweenness centrality measure, the age groups with higher values are the same for the first and third time intervals, but different for the second interval, which corresponds to the summer months. This shows that during the summer, the age group most likely to spread this disease from one age group to another changed from 40–59 to 20–29. Regarding eigencentrality, the same can be said as with the full-year assignment: older ages have high values in all intervals.
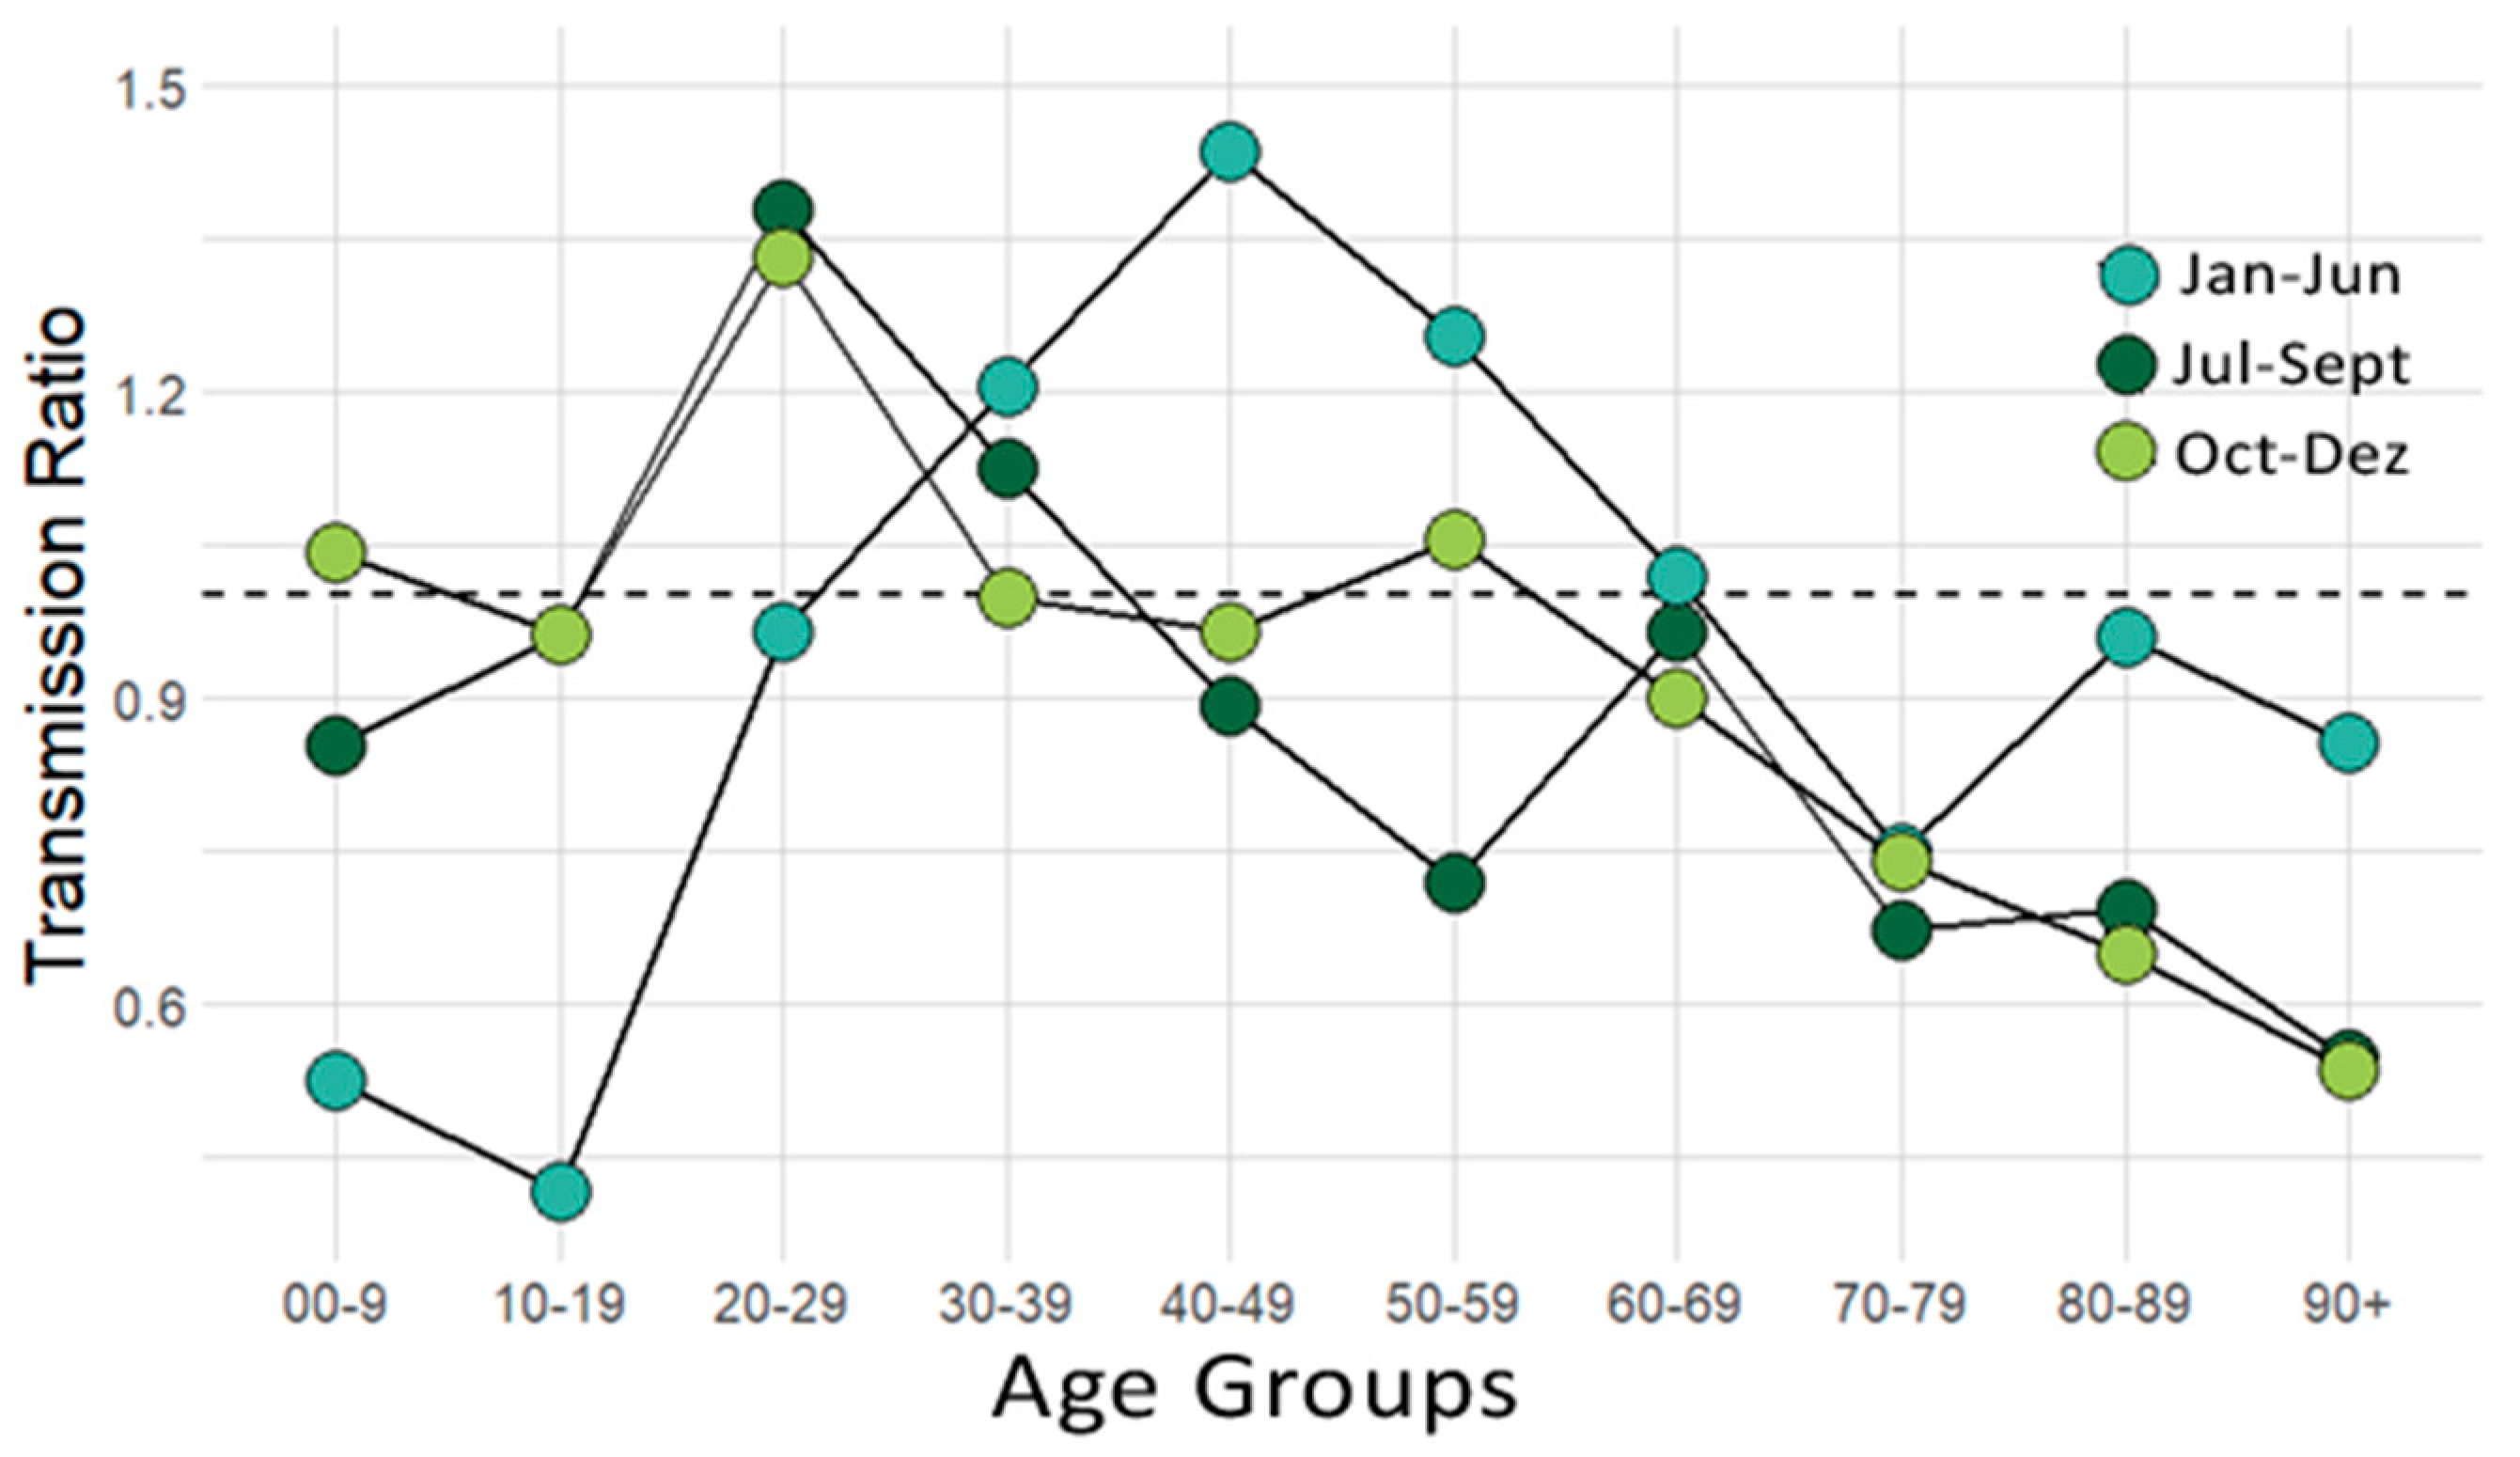
In Figure 5, we observe peaks on the transmission ratios and there is a translation of the ages that transmit the most per person and a funneling of the age range with a ratio greater than 1. The age class with the highest transmission ratio was 40–49 between Jan-Jun and between Jul–Dec was 20–29. Furthermore, the transmission ratio associated with the 70+ age classes is lower than one for the all-time periods.
4. Discussion
Considering the results, we can first say that, based on the contact matrices, transmissions tend to happen most often within the most similar social groups, whether those groups are based on where they live or on their age.
In relation to the ratios, the results of these showed the effectiveness of the vaccination since, referring now to the municipalities, the values of the ratio are lower in 2021 than in 2020. However, this conclusion is more direct in the transmission ratio relative to the year 2021 subdivided of the age groups since, in addition to a translation of the age groups that are most transmitted to the left (younger ages), a funneling of the age group intervals that were most dangerous is achieved. This is in line with the 2021 vaccination, which started with older people at the beginning of the year and then moved on to younger people.
Regarding the measures of centrality, the results of the municipalities showed that the municipality of Aveiro, as expected for being the capital of the city, is the municipality that, in addition to presenting more connections, presents itself with the highest transmission speed as well as the one that serves as a transmission bridge between municipalities. Looking at the results of the subdivided year, it is proved that in the summer practically all municipalities increase their transmission speed, possibly due to the holidays. In addition, the results related to the data of the municipalities also showed possible reasons for Ovar’s 2020 prophylactic isolation, seeing that Ovar is a municipality with a high transmission speed and it is connected to municipalities who themselves have high transmission speeds.
As for the centrality measure results concerning the data related to the age groups, with the subdivision of the year and with the arrival of summer, there was a worsening of the metrics for the 20–29 age group. In fact, we observed a change in the values of the betweenness and closeness centrality measures in this age group.
Author Contributions
Conceptualization, P.M., S.J.P., V.A. and C.J.S.; methodology, P.M., S.J.P., V.A. and C.J.S.; validation, P.M., S.J.P., V.A. and C.J.S.; formal analysis, P.M., S.J.P., V.A. and C.J.S.; investigation, P.M., S.J.P., V.A. and C.J.S.; data curation, R.L.; writing—original draft preparation, P.M., S.J.P., V.A. and C.J.S.; writing—review and editing, P.M., S.J.P., V.A. and C.J.S. All authors have read and agreed to the published version of the manuscript.
Funding
This research was partially funded by Portuguese funds through CIDMA, The Center for Research and Development in Mathematics and Applications of University of Aveiro, and the Portuguese Foundation for Science and Technology (FCT–Fundação para a Ciência e a Tecnologia), within projects UIDB/04106/2020 and UIDP/04106/2020. P.M. was supported by the Thematic Line BioMath from CIDMA. C.J.S. was also supported by the FCT Researcher Program CEEC Individual 2018 with reference CEECIND/00564/2018.
Conflicts of Interest
The authors declare no conflict of interest. The funders had no role in the design of the study; in the collection, analyses, or interpretation of data; in the writing of the manuscript, or in the decision to publish the results.
References
- Saraswathi, S.; Mukhopadhyay, A.; Shah, H.; Ranganath, T.S. Social Network Analysis of COVID-19 Transmission in Karnataka, India. Epidemiol. Infect. 2020, 148, e230. [Google Scholar] [CrossRef] [PubMed]
- Yesudhas, D.; Srivastava, A.; Gromiha, M.M. COVID-19 outbreak: History, mechanism, transmission, structural studies and therapeutics. Infection 2021, 49, 199–213. [Google Scholar] [CrossRef]
- Li, C.; Tang, H. Since January 2020 Elsevier Has Created a COVID-19 Resource Centre with Free Information in English and Mandarin on the Novel Coronavirus COVID-19. The COVID-19 Resource Centre Is Hosted on Elsevier Connect, the Company’s Public News and Information Website. Available online: https://cdn.who.int/media/docs/default-source/whhd-2021/scientific-publications/2.jhi_5may2021.pdf?sfvrsn=6526a2a5_5 (accessed on 6 July 2022).
- Jo, W.; Chang, D.; You, M.; Ghim, G.H. A social network analysis of the spread of COVID-19 in South Korea and policy implications. Sci. Rep. 2021, 11, 8581. [Google Scholar] [CrossRef] [PubMed]
- Pastor-Satorras, R.; Castellano, C.; van Mieghem, P.; Vespignani, A. Epidemic processes in complex networks. Rev. Mod. Phys. 2015, 87, 925. [Google Scholar] [CrossRef] [Green Version]
- Wang, Z.; Bauch, C.T.; Bhattacharyya, S.; d’Onofrio, A.; Manfredi, P.; Perc, M.; Perra, N.; Salathé, M.; Zhao, D. Statistical physics of vaccination. Phys. Rep. 2016, 664, 1–113. [Google Scholar] [CrossRef]
- Lü, L.; Chen, D.; Ren, X.L.; Zhang, Q.M.; Zhang, Y.C.; Zhou, T. Vital nodes identification in complex networks. Phys. Rep. 2016, 650, 1–63. [Google Scholar] [CrossRef] [Green Version]
- Holme, P. Efficient local strategies for vaccination and network attack. Europhys. Lett. 2004, 68, 6. [Google Scholar] [CrossRef] [Green Version]
- Bauer, F.; Lizier, J.T. Identifying influential spreaders and efficiently estimating infection numbers in epidemic models: A walk counting approach. EPL 2012, 99, 6. [Google Scholar] [CrossRef] [Green Version]
- De Arruda, G.F.; Barbieri, A.L.; Rodríguez, P.M.; Rodrigues, F.A.; Moreno, Y.; Costa, L.D.F. Role of centrality for the identification of influential spreaders in complex networks. Phys. Rev. E Stat. Nonlinear Soft Matter Phys. 2014, 90, 032812. [Google Scholar] [CrossRef] [PubMed] [Green Version]
- Ames, G.M.; George, D.B.; Hampson, C.P.; Kanarek, A.R.; McBee, C.D.; Lockwood, D.R.; Achter, J.D.; Webb, C.T. Using network properties to predict disease dynamics on human contact networks. Proc. R. Soc. B Biol. Sci. 2011, 278, 3544–3550. [Google Scholar] [CrossRef] [PubMed]
- Freitas, A.; Escudeiro, S.; Reis, J.; Silva, C.J. COVID-19’s pandemic: A new way of thinking through linear combinations of proportions. In Mathematical Analysis of Infectious Diseases; Academic Press: Cambridge, MA, USA, 2022; pp. 41–59. [Google Scholar] [CrossRef]
- Balaban, A.T. Applications of Graph Theory in Chemistry. J. Chem. Inf. Comput. Sci. 1985, 25, 334–343. [Google Scholar] [CrossRef]
- Hesarkazzazi, S.; Hajibabaei, M.; Bakhshipour, A.E.; Dittmer, U.; Haghighi, A.; Sitzenfrei, R. Generation of optimal (de)centralized layouts for urban drainage systems: A graph-theory-based combinatorial multi-objective optimization framework. Sustain. Cities Soc. 2021, 81, 103827. [Google Scholar] [CrossRef]
- Farahani, F.V.; Karwowski, W.; Lighthall, N.R. Application of graph theory for identifying connectivity patterns in human brain networks: A systematic review. Front. Neurosci. 2019, 13, 585. [Google Scholar] [CrossRef]
- Hiram Guzzi, P.; Petrizzelli, F.; Mazza, T. Disease spreading modeling and analysis: A survey. Brief. Bioinform. 2022, 23, bbac230. [Google Scholar] [CrossRef] [PubMed]
- Giammetti, R.; Papi, L.; Teobaldelli, D.; Ticchi, D. The Italian value chain in the pandemic: The input–output impact of Covid-19 lockdown. J. Ind. Bus. Econ. 2020, 47, 483–497. [Google Scholar] [CrossRef]
- Durmaz, N.; Hengirmen, E. The dramatic increase in anti-vaccine discourses during the COVID-19 pandemic: A social network analysis of Twitter. Hum. Vaccines Immunother. 2022, 18, 2025008. [Google Scholar] [CrossRef] [PubMed]
- Sultana, F.; Gulistan, M. A study of plithogenic graphs: Applications in spreading coronavirus disease (COVID-19) globally. J. Ambient Intell. Humaniz. Comput. 2022, 6, 1–21. [Google Scholar] [CrossRef] [PubMed]
- Aletti, G.; Benfenati, A.; Naldi, G. Graph, spectra, control and epidemics: An example with a SEIR model. Mathematics 2021, 9, 2987. [Google Scholar] [CrossRef]
- Nowzari, C.; Preciado, V.M.; Pappas, G.J. Analysis and Control of Epidemics: A Survey of Spreading Processes on Complex Networks. IEEE Control Syst. Mag. 2016, 36, 26–46. [Google Scholar] [CrossRef]
- Cardoso, D.M.; Szymanski, J.; Rostami, M. Matemática Discreta: Combinatória, Teoria dos Grafos e Algoritmos; Escolar Editora: Lisboa, Portugal, 2009. [Google Scholar]
- Hansen, D.L.; Shneiderman, B.; Smith, M.A.; Himelboim, I. Calculating and visualizing network metrics. In Analyzing Social Media Networks with NodeXL; Elsevier: Amsterdam, The Netherlands, 2020; pp. 79–94. [Google Scholar] [CrossRef]
- Golbeck, J. Analyzing networks. In Introduction to Social Media Investigation; Elsevier: Amsterdam, The Netherlands, 2015; pp. 221–235. [Google Scholar] [CrossRef]
- Csardi, G.; Nepusz, T. The Igraph Software Package for Complex Network Research. Available online: https://igraph.org (accessed on 5 July 2022).
Figure 1.
(a) Digraph of municipalities data regarding 2020 and 2021; and (b) digraph of age group data regarding 2020 and 2021.
Figure 1.
(a) Digraph of municipalities data regarding 2020 and 2021; and (b) digraph of age group data regarding 2020 and 2021.

Figure 2.
Transmission ratio regarding the municipality data for 2020 and 2021.

Figure 3.
Transmission ratio regarding the municipality data for Jan–Jun, Jul–Sept and Oct–Dec time intervals.
Figure 3.
Transmission ratio regarding the municipality data for Jan–Jun, Jul–Sept and Oct–Dec time intervals.

Figure 4.
Transmission ratio for the age group in 2020–2021.

Figure 5.
Transmission ratio regarding the municipality data for Jan–Jun, Jul–Sept and Oct–Dec time intervals.
Figure 5.
Transmission ratio regarding the municipality data for Jan–Jun, Jul–Sept and Oct–Dec time intervals.


Table 1.
Contact matrix regarding the data of the different age groups between 2020 and 2021.
| 00–9 | 10–19 | 20–29 | 30–39 | 40–49 | 50–59 | 60–69 | 70–79 | 80–89 | 90+ | |
|---|---|---|---|---|---|---|---|---|---|---|
| 00–9 | 296 | 124 | 70 | 220 | 270 | 45 | 53 | 28 | 11 | 2 |
| 10–19 | 123 | 468 | 110 | 133 | 429 | 185 | 68 | 40 | 11 | 7 |
| 20–29 | 121 | 233 | 911 | 317 | 292 | 606 | 184 | 74 | 36 | 12 |
| 30–39 | 404 | 287 | 250 | 757 | 261 | 271 | 287 | 82 | 32 | 22 |
| 40–49 | 357 | 724 | 327 | 265 | 828 | 257 | 259 | 240 | 77 | 24 |
| 50–59 | 97 | 291 | 493 | 257 | 267 | 689 | 199 | 149 | 162 | 45 |
| 60–69 | 86 | 95 | 169 | 235 | 172 | 199 | 553 | 121 | 92 | 55 |
| 70–79 | 14 | 55 | 45 | 57 | 150 | 81 | 117 | 256 | 51 | 17 |
| 80–89 | 10 | 13 | 27 | 23 | 51 | 110 | 71 | 84 | 114 | 21 |
| 90+ | 1 | 7 | 9 | 9 | 25 | 35 | 44 | 24 | 22 | 24 |
Table 2.
Contact matrix regarding the data of the different municipalities between 2020 and 2021.
| A. Velha | Águeda | Anadia | Aveiro | Estarreja | Ílhavo | Murtosa | O. Bairro | Ovar | S. Vouga | Vagos | |
|---|---|---|---|---|---|---|---|---|---|---|---|
| A. Velha | 1132 | 20 | 0 | 31 | 4 | 7 | 0 | 0 | 2 | 4 | 1 |
| Águeda | 38 | 1739 | 27 | 38 | 2 | 3 | 0 | 21 | 1 | 4 | 2 |
| Anadia | 1 | 20 | 1333 | 15 | 0 | 3 | 0 | 29 | 0 | 1 | 0 |
| Aveiro | 37 | 24 | 20 | 3492 | 19 | 127 | 2 | 38 | 7 | 6 | 18 |
| Estarreja | 8 | 5 | 1 | 20 | 1250 | 1 | 47 | 0 | 18 | 0 | 1 |
| Ílhavo | 6 | 8 | 2 | 150 | 2 | 1785 | 2 | 12 | 1 | 1 | 18 |
| Murtosa | 0 | 0 | 0 | 8 | 68 | 2 | 638 | 0 | 7 | 1 | 0 |
| O. Bairro | 6 | 28 | 21 | 40 | 2 | 8 | 0 | 624 | 1 | 0 | 4 |
| Ovar | 2 | 4 | 0 | 18 | 30 | 1 | 10 | 0 | 2863 | 1 | 2 |
| S. Vouga | 0 | 7 | 3 | 2 | 0 | 3 | 1 | 0 | 1 | 509 | 2 |
| Vagos | 1 | 5 | 6 | 47 | 1 | 23 | 0 | 5 | 0 | 1 | 838 |
Table 3.
Centrality Measures of the digraph related to the municipality data in 2020 and 2021.
| Closeness | Betweenness | Degree | Eigen | |||||
|---|---|---|---|---|---|---|---|---|
| 2020 | 2021 | 2020 | 2021 | 2020 | 2021 | 2020 | 2021 | |
| A. Velha | 62 | 62 | 0 | 0 | 8 | 14 | 73 | 54 |
| Águeda | 97 | 76 | 11 | 18 | 14 | 16 | 69 | 23 |
| Anadia | 28 | 51 | 6 | 0 | 8 | 12 | 0 | 51 |
| Aveiro | 100 | 100 | 70 | 69 | 18 | 20 | 25 | 28 |
| Estarreja | 48 | 63 | 18 | 34 | 12 | 11 | 60 | 16 |
| Ílhavo | 85 | 91 | 7 | 9 | 12 | 17 | 100 | 50 |
| Murtosa | 42 | 29 | 0 | 0 | 8 | 8 | 22 | 13 |
| O. Bairro | 37 | 79 | 0 | 6 | 11 | 11 | 56 | 0 |
| Ovar | 58 | 46 | 0 | 0 | 10 | 12 | 55 | 78 |
| S. Vouga | 0 | 0 | 0 | 0 | 6 | 12 | 44 | 100 |
| Vagos | 62 | 74 | 0 | 0 | 11 | 13 | 83 | 64 |
Table 4.
Centrality Measures of the digraph related to the municipality data of Jan–Jun, Jul–Sept and Oct–Dec time intervals of 2021.
Table 4.
Centrality Measures of the digraph related to the municipality data of Jan–Jun, Jul–Sept and Oct–Dec time intervals of 2021.
| Closeness | Betweenness | Degree | Eigen | |||||||||
|---|---|---|---|---|---|---|---|---|---|---|---|---|
| Jan–Jun | Jul–Sept | Oct–Dec | Jan–Jun | Jul–Sept | Oct–Dec | Jan–Jun | Jul–Sept | Oct–Dec | Jan–Jun | Jul–Sept | Oct–Dec | |
| A. Velha | 54 | 82 | 51 | 4 | 14 | 8 | 12 | 7 | 10 | 60 | 30 | 38 |
| Águeda | 53 | 78 | 78 | 17 | 1 | 2 | 16 | 12 | 12 | 62 | 100 | 89 |
| Anadia | 33 | 73 | 49 | 4 | 0 | 0 | 9 | 7 | 9 | 16 | 35 | 71 |
| Aveiro | 59 | 100 | 100 | 54 | 64 | 68 | 19 | 16 | 17 | 67 | 75 | 22 |
| Estarreja | 100 | 53 | 34 | 25 | 24 | 24 | 11 | 7 | 9 | 54 | 63 | 23 |
| Ílhavo | 51 | 94 | 96 | 9 | 0 | 29 | 15 | 7 | 14 | 100 | 36 | 100 |
| Murtosa | 61 | 25 | 21 | 0 | 0 | 0 | 6 | 2 | 6 | 0 | 2 | 0 |
| O. Bairro | 58 | 89 | 63 | 7 | 0 | 5 | 11 | 7 | 10 | 31 | 42 | 62 |
| Ovar | 77 | 97 | 14 | 0 | 0 | 0 | 11 | 4 | 7 | 72 | 30 | 16 |
| S. Vouga | 0 | 0 | 0 | 0 | 0 | 0 | 10 | 2 | 4 | 80 | 0 | 47 |
| Vagos | 62 | 75 | 74 | 0 | 0 | 8 | 10 | 7 | 0 | 91 | 61 | 80 |
Table 5.
Centrality measures of the digraph related to the age groups data for 2020–2021.
| Closeness | Betweenness | Degree | Eigen | |||||
|---|---|---|---|---|---|---|---|---|
| 2020 | 2021 | 2020 | 2021 | 2020 | 2021 | 2020 | 2021 | |
| 00–9 | 69 | 13 | 0 | 0 | 17 | 18 | 77 | 89 |
| 10–19 | 73 | 53 | 0 | 0 | 18 | 18 | 32 | 56 |
| 20–29 | 85 | 79 | 0 | 0 | 18 | 18 | 33 | 12 |
| 30–39 | 86 | 87 | 7 | 13 | 18 | 18 | 24 | 10 |
| 40–49 | 100 | 100 | 21 | 20 | 18 | 18 | 7 | 0 |
| 50–59 | 93 | 77 | 11 | 12 | 18 | 18 | 0 | 3 |
| 60–69 | 70 | 67 | 15 | 9 | 18 | 18 | 0 | 1 |
| 70–79 | 39 | 36 | 0 | 0 | 18 | 18 | 17 | 27 |
| 80–89 | 28 | 23 | 0 | 0 | 18 | 18 | 41 | 39 |
| 90+ | 0 | 0 | 0 | 0 | 17 | 18 | 100 | 100 |
Table 6.
Centrality Measures of the digraph related to the Age groups Jan–Jun, Jul–Sept and Oct–Dec time intervals of 2021.
Table 6.
Centrality Measures of the digraph related to the Age groups Jan–Jun, Jul–Sept and Oct–Dec time intervals of 2021.
| Closeness | Betweenness | Degree | Eigen | |||||||||
|---|---|---|---|---|---|---|---|---|---|---|---|---|
| Jan–Jun | Jul–Sept | Oct–Dec | Jan-Jun | Jul–Sept | Oct–Dec | Jan–Jun | Jul–Sept | Oct–Dec | Jan–Jun | Jul–Sept | Oct–Dec | |
| 00–9 | 25 | 67 | 85 | 0 | 0 | 3 | 16 | 15 | 17 | 65 | 16 | 45 |
| 10–19 | 44 | 73 | 88 | 0 | 0 | 0 | 18 | 17 | 16 | 70 | 32 | 40 |
| 20–29 | 74 | 100 | 93 | 0 | 25 | 0 | 18 | 17 | 15 | 40 | 39 | 0 |
| 30–39 | 80 | 86 | 87 | 9 | 9 | 2 | 18 | 17 | 18 | 45 | 10 | 54 |
| 40–49 | 98 | 79 | 94 | 19 | 11 | 18 | 18 | 18 | 18 | 9 | 58 | 44 |
| 50–59 | 100 | 71 | 100 | 22 | 10 | 23 | 18 | 16 | 18 | 0 | 0 | 14 |
| 60–69 | 65 | 62 | 79 | 7 | 9 | 15 | 18 | 18 | 18 | 7 | 35 | 10 |
| 70–79 | 33 | 31 | 54 | 0 | 0 | 1 | 18 | 16 | 18 | 44 | 43 | 20 |
| 80–89 | 29 | 21 | 26 | 0 | 8 | 0 | 18 | 17 | 16 | 100 | 65 | 73 |
| 90+ | 0 | 0 | 0 | 0 | 0 | 0 | 16 | 9 | 14 | 97 | 100 | 100 |
Publisher’s Note: MDPI stays neutral with regard to jurisdictional claims in published maps and institutional affiliations. |
© 2022 by the authors. Licensee MDPI, Basel, Switzerland. This article is an open access article distributed under the terms and conditions of the Creative Commons Attribution (CC BY) license (https://creativecommons.org/licenses/by/4.0/).
Share and Cite
MDPI and ACS Style
Machado, P.; Pinheiro, S.J.; Afreixo, V.; Silva, C.J.; Leitão, R. Graph Theory Approach to COVID-19 Transmission by Municipalities and Age Groups. Math. Comput. Appl. 2022, 27, 86. https://doi.org/10.3390/mca27050086
AMA Style
Machado P, Pinheiro SJ, Afreixo V, Silva CJ, Leitão R. Graph Theory Approach to COVID-19 Transmission by Municipalities and Age Groups. Mathematical and Computational Applications. 2022; 27(5):86. https://doi.org/10.3390/mca27050086
Chicago/Turabian StyleMachado, Pedro, Sofia J. Pinheiro, Vera Afreixo, Cristiana J. Silva, and Rui Leitão. 2022. "Graph Theory Approach to COVID-19 Transmission by Municipalities and Age Groups" Mathematical and Computational Applications 27, no. 5: 86. https://doi.org/10.3390/mca27050086