Linear Fiber Laser Configurations for Optical Concentration Sensing in Liquid Solutions
by
 , , and
Liliana Soares
1,2,* ,
,
Rosa Ana Perez-Herrera
3,4,
Susana Novais
1,
António Ferreira
5,6,
Susana Silva
1 and
Orlando Frazão
1 1
Institute for Systems and Computer Engineering, Technology and Science (INESC TEC), Rua do Campo Alegre, 687, 4150-179 Porto, Portugal
2
Department of Engineering Physics, Faculty of Engineering, University of Porto, Rua Dr. Roberto Frias s/n, 4200-465 Porto, Portugal
3
Department of Electrical, Electronic and Communication Engineering, Public University of Navarra, 31006 Pamplona, Spain
4
Institute of Smart Cities (ISC), Public University of Navarra, 31006 Pamplona, Spain
5
Laboratory for Process Engineering, Environment, Biotechnology and Energy (LEPABE), Department of Chemical Engineering, Faculty of Engineering, University of Porto, Rua Dr. Roberto Frias s/n, 4200-465 Porto, Portugal
6
Associate Laboratory in Chemical Engineering (ALiCE), Faculty of Engineering, University of Porto, Rua Dr. Roberto Frias, 4200-465 Porto, Portugal
*
Author to whom correspondence should be addressed.
Photonics 2024, 11(5), 393; https://doi.org/10.3390/photonics11050393
Submission received: 30 January 2024
/
Revised: 9 April 2024
/
Accepted: 22 April 2024
/
Published: 24 April 2024
(This article belongs to the Special Issue Single Frequency Fiber Lasers and Their Applications)
Abstract
:In this study, different configurations based on linear fiber lasers were proposed and experimentally demonstrated to measure the concentration of liquid solutions. Samples of paracetamol liquid solutions with different concentrations, in the range from 52.61 to 201.33 g/kg, were used as a case-study. The optical gain was provided by a commercial bidirectional Erbium-Doped Fiber Amplifier (EDFA) and the linear cavity was obtained using two commercial Fiber Bragg Gratings (FBGs). The main difference of each configuration was the coupling ratio of the optical coupler used to extract the system signal. The sensing head corresponded to a Single-Mode Fiber (SMF) tip that worked as an intensity sensor. The results reveal that, despite the optical coupler used (50:50, 60:40, 70:30 or 80:20), all the configurations reached the laser condition, however, the concentration sensing was only possible using a laser drive current near to the threshold value. The configurations using a 70:30 and an 80:20 optical coupler allowed paracetamol concentration measurements with a higher sensitivity of () pW/(g/kg) to be performed. In terms of resolution, the highest value obtained was 1.75 g/kg, when it was extracted at 20% of the output power to the linear cavity fiber laser configuration.
1. Introduction
Since the discovery of laser technology in 1960 by T. H. Maiman, optical fiber sensors were introduced and developed for detecting critical parameters in the processing industries, such as, temperature, refractive index, concentration and strain [1,2,3,4]. Moreover, in the last decades, fiber laser sensors with different configurations have been revealed as a versatile sensing tool for applications in different fields [5].
The development of Erbium-Doped Fiber Amplifiers (EDFA) marked a milestone in this type of sensing technology, as well as the discovery of a wide variety of gain medium elements [6,7], offering an operating wavelength range from the visible to the near-infrared. Studies revealed that fiber laser sensors also have great characteristics, such as high resolution and sensitivity and a good optical signal-to-noise ratio (OSNR) [1]. Together with the well-known characteristics of fiber optic sensors, namely, reduced dimensions, low weight, flexibility, low losses, no electromagnetic interference, multiplexing capacity, and remote monitoring at specific spatial points (as a probe) or even in large areas (through multiple detection regions along the optical fiber) [8], fiber laser sensors have been considered a technology with great potential for many optical sensing applications. However, the performance of this technology also depends on the type of optical cavity—linear or ring cavities. In linear cavities the light propagates back and forth between two end mirrors, generally Fiber Bragg Gratings (FBGs) or fiber loop mirrors. On the other hand, in ring cavities or ring resonators, the light can propagate in two different directions. It was found that linear cavity lasers, compared with ring configurations, easily reach the saturation state and also have a large tuning range, low threshold pump power and high slope efficiency [9].
In relation to operating mechanisms, there are different configurations of fiber laser sensors [1]. A common configuration of this type of fiber laser sensor uses an erbium-doped optical fiber and two FBGs, as reflectors. In this way, a 1550 nm laser system of this type is formed by the gain obtained by the erbium-doped fiber and the reflections of the mirrors, formed by the FBGs. The FBGs cause an oscillation of the cavity and laser action. This output is monitored in reflection or transmission mode [1,10,11].
In this study, different configurations of linear fiber laser sensors using an erbium-doped optical fiber as gain medium and two FBGs as reflectors, were proposed and experimentally demonstrated. Through these it was possible to implement a refractometric sensor, modulated in intensity, to perform concentration measurements of liquid solutions. The obtained results confirmed the potential of the technology proposed for optimizing production in processing industries. Though this, it is possible to measure the concentration of liquid reagents in situ and in a non-invasive and non-destructive way. Another advantage of the technology proposed is the possibility of multiplexing more than one sensor placed at different measurement sites without changing the interrogation system in a simple and low-cost way compared to other process technologies. To test the technology proposed, paracetamol liquid samples were used in a case-study.
2. Experimental Setup
2.1. Laser Gain
In the proposed configurations, the laser gain was provided by a commercial bi-directional EDFA. This device consists of two three-port optical circulators and two conventional EDFAs, as illustrated in Figure 1. Each one of these pumps is independently controlled and in this work an appropriate pump power level was chosen to ensure laser stability. Also, the bidirectional EDFA used was fixed in a stable position to minimize the effects of bending and polarization losses.
2.2. Sensing Head and Its Operation Mechanism
As previously stated, the sensing head of this experiment corresponded to a fiber tip, that worked as a refractometric sensor that was modulated in intensity. Figure 2 shows its structure.
The operating mechanisms of this sensor, as illustrated in Figure 2, relied on Fresnel reflection at the fiber-to-liquid solution interface. According to the Refractive Index (RI) of the liquid solution, the intensity of the light guided by the optical fiber and then reflected at the fiber-to-liquid interface changed linearly. These measurand-induced intensity variations were monitored to determine the optical concentration of liquid solutions.
It is possible calculate the ration between the light reflected at the fiber-to-liquid interface and the incident light (light guided by the fiber), i.e., Reflectance, , through Equation (1). This equation corresponds to the Fresnel equation for a reflection at a normal incidence, where, in this case is related to the RI of the liquid solution and is related to the fiber optic core RI ( = 1.468 RIU) [12]:
As the RI of the fiber optic core is higher than the RI of liquid solutions ( 1.360 RIU), less than 0.15% of the light guided by the fiber is reflected at the fiber-to-liquid interface monitored.
2.3. Experimental Configuration
The experimental setup used in this study is shown in Figure 3. The linear cavity included two 8 mm length commercial FBG reflectors (FBG1 and FBG2), with a reflectivity of 99% and centered at 1560 nm, located at both ends of the linear cavity. To ensure the Fresnel reflection and simultaneously create an increase in the Amplified Spontaneous Emission (ASE) [13], both optical fiber ends were cleaved as can be seen in Figure 3 (cleaved tip (1) and cleaved tip (2)). Located between these two reflectors was a 2 2 optical coupler and the bidirectional EDFA. Finally, at the same fiber end of the optical coupler where the FBG1 was connected, the optical sensing head based on a standard SMF (SMF 28e) tip was placed. This setup also presented a laser optical path length of 2.93 m.
Different optical couplers with different coupling ratios were employed to extract the part of the reflected optical signal to be measured. In the measurements performed, percentages of 50%, 40%, 30% or 20% of optical power were extracted and evaluated by using a power meter (model Agilent 8163B) and an Optical Spectrum Analyzer (OSA) (YOKOGAWA, model AQ6370D, Tokyo, Japan).
2.4. Optical Characterization of Liquid Solutions
The liquid solutions measured in this study corresponded to standard paracetamol liquid samples prepared in a controlled laboratory environment. Seeds of paracetamol (CAS number 103-90-02, min. 99% purity, supplied by Sigma-Aldrich, St. Louis, MI, USA) were dissolved in a solvent mixture of 40% (v/v) ethanol/water. This produced paracetamol liquid samples with a concentration range of 52.61 to 201.33 g paracetamol/kg solvent, which corresponded to a RI range of 1.3626 to 1.3846 RIU.
The characterization of the paracetamol liquid samples was performed using an Abbe refractometer (ATAGO, DR-A1, Tokyo, Japan).
It is possible to see in Figure 4, with the increase in paracetamol concentration, the samples become optically denser, causing a linear increase in the RI (correlation factor of 0.991).
3. Results and Discussion
3.1. Fiber Laser System Characterization
As has been previously pointed out, the fiber laser system characterization (recall Figure 3) was performed using both an optical power meter and an OSA.
In Figure 5a it is possible to see the output spectra of the fiber laser systems, obtained through OSA, when it was used a laser diode drive current of 250 mA. All the spectra had a spectral width of 125 pm.
The relation between the measured optical output power and laser drive current for each fiber laser system proposed, acquired using the power meter, is shown in Figure 5b,c.
Figure 5 allows the conclusion that all the configurations proposed reached the laser condition, with the presence of both laser effects—ASE and stimulated emission. A threshold current of 150 mA was obtained for all the fiber laser systems (Figure 5c), except for the fiber laser system using a 50:50 optical coupler (Figure 5b), which had a threshold current of 155 mA. This occurs because the 50:50 optical coupler generates higher internal losses, compared to the other optical couplers used (60:40, 70:30 and 80:20).
According to the output spectrum of all configurations (Figure 5a), a single emission line centered at 1560 nm with an output power level higher than 5 dBm and with an OSNR of about 60 dB was measured.
3.2. Fiber Laser Systems for Concentration Sensing
The sensitivity of the fiber laser systems proposed to the variation in concentration was performed by measuring each sample of paracetamol liquid solution. For this purpose, the sensing head was vertically immersed in each sample and the output power level was obtained using the power meter. The obtained values can be seen in Figure 6. It is important to note that, after each sample, the sensing head was cleaned with alcohol to avoid contamination.
In all these measurements, the experimentally obtained threshold current was used for each proposed configuration (recall Figure 5). Above the threshold current, all the fiber laser systems became insensitive to paracetamol concentration variations.
Figure 6 confirms that all the configurations proposed show a linear sensitivity to the variation in paracetamol concentration, with ranges from 52.61 to 219.25 g/kg. The fiber laser configurations using coupling ratios of 50:50 and 60:40 had similar sensitivities, with values of pW/(g/kg) and pW/(g/kg), respectively. The other two configurations, using coupling ratios of 70:30 and an 80:20, were revealed to have the same sensitivity of pW/(g/kg).
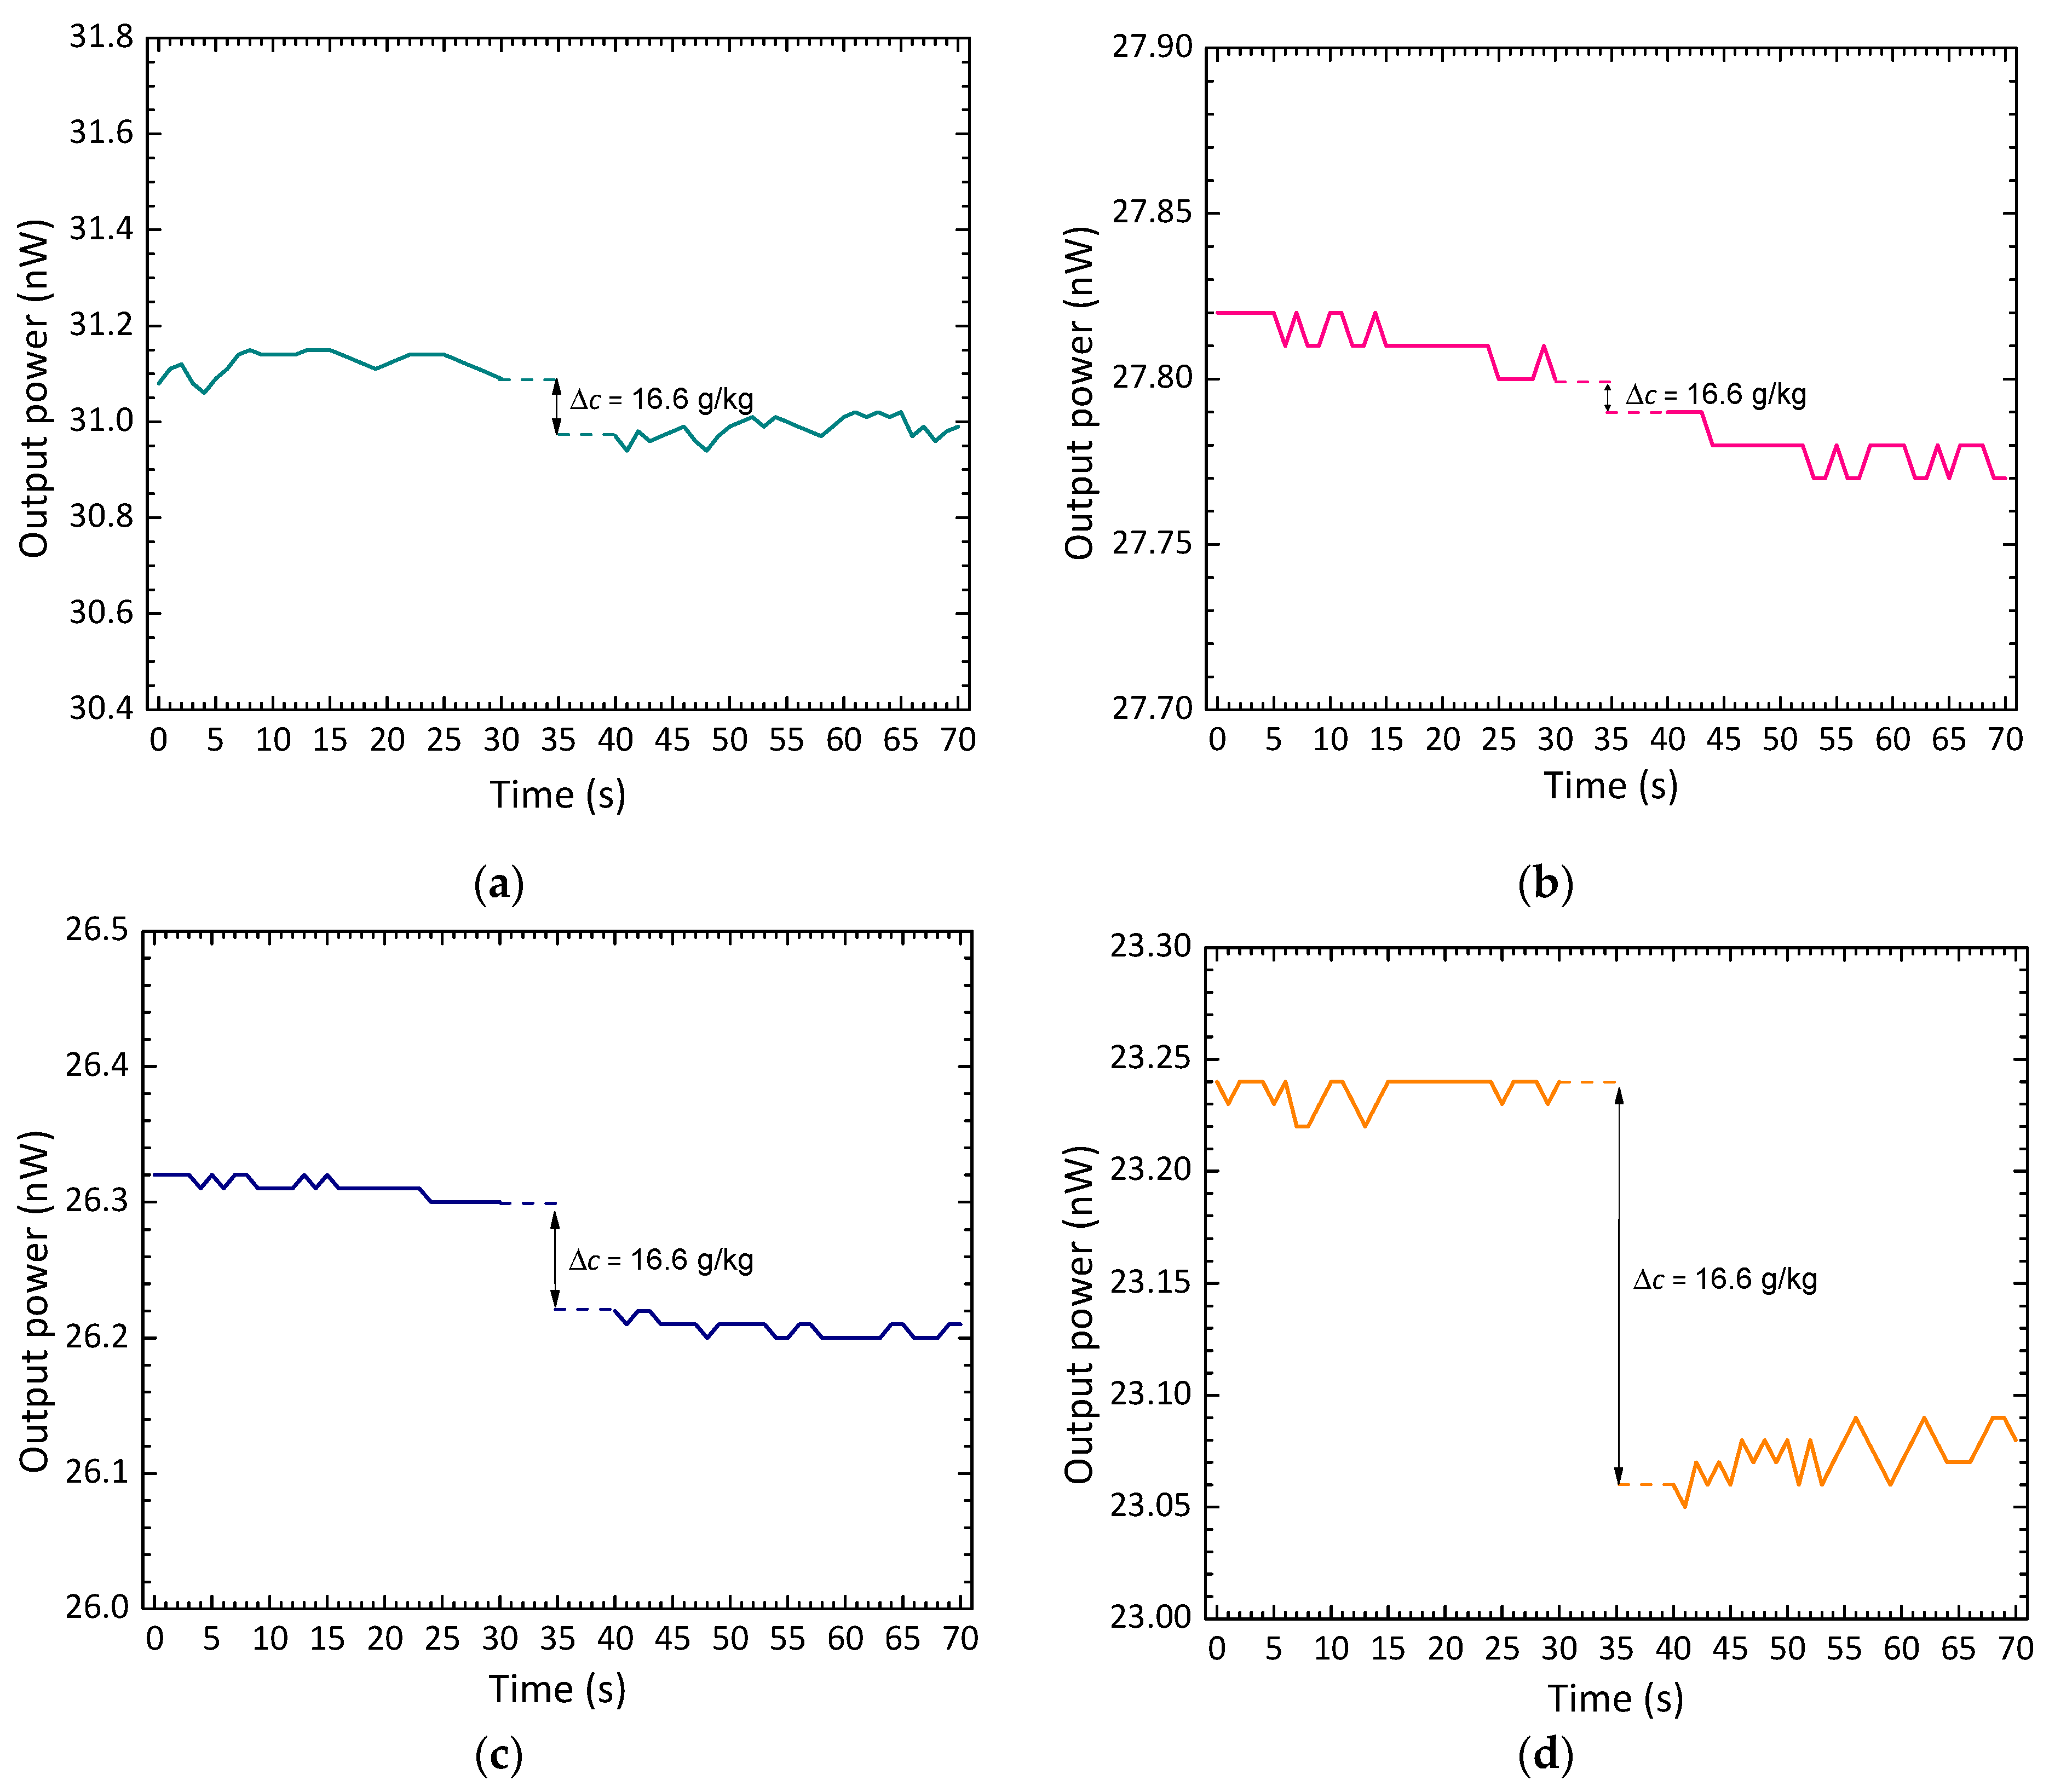
The resolution of the proposed systems were determined using the method of two consecutive measures [14]. For this, two samples of paracetamol with consecutives values of concentration, namely, 52.61 g/kg, and 69.21 g/kg, were measured by vertically immersing the sensing head in the chosen samples. The measurements were performed in a consecutive way and the sensor responses were obtained through the power meter. Figure 7 shows the results achieved, for each configuration proposed.
The resolution, i.e., minimum value of concentration () that the sensor could discriminate through the sensor response shown in Figure 7 for each fiber laser system proposed, was calculated using Equation (2) [14]:
is the maximum standard deviation of the output power for both values of concentration (52.61 g/kg and 69.21 g/kg), is the variation of concentration (16.6 g/kg) and is the mean displacement of output response between the two steps.
The variable values used in the calculation of the resolution for each system proposed and its result are presented in Table 1.
As it is possible to see in Table 1, the fiber laser systems proposed achieved different resolutions. The fiber laser systems using a 50:50 and a 60:40 optical coupler obtained close values of resolution, namely, 6.32 g/kg and 6.64 g/kg, in that order. The other fiber laser systems, using a 70:30 and an 80:20 optical coupler, obtained resolutions of 2.77 g/kg and 1.75 g/kg, respectively. It is important to note that these values were also influenced by the spectral resolution of the equipment used for data acquisition.
The characterization of the fiber laser systems proposed allowed the conclusion that all the systems achieved the laser conditions and were revealed to have sensitivity to the variations of paracetamol concentration, as long as a laser drive current near to the threshold current was used. Table 2 reviews the principal characteristics of the fiber laser systems proposed.
As is possible to see in Table 2, the configurations proposed have similar sensitivities to the variations in paracetamol concentration. However, as expected, this sensitivity value is higher when the coupling ratio used only extracts 20% or 30% of the optical power to be measured, i.e., when using 70:30 or 80:20 optical couplers.
On the other hand, working near to the threshold value results in a higher ASE effect, which influences the results.
In relation to resolution, the configuration using an optical coupler with a coupling ratio of 80:20, obtained the best resolution value, 1.75 g/kg, due to the fact that, in this case, the amount of light that propagates inside this laser cavity is the highest one causing an increase in ASE effect.
4. Conclusions
This work proposed several fiber laser systems based on linear cavities to perform measurements of paracetamol concentration in liquid solutions where the sensing head corresponded to a cleaved single-mode fiber tip, that worked as an intensity sensor.
The experimental results revealed that all the configurations reached the laser conditions, with a presence of both laser effects, amplified spontaneous emission and stimulated emission. Also, the optical power response of all systems proposed varied linearly with the concentration of paracetamol within the range of 52.61 to 201.33 g/kg, yielding a highest sensitivity and resolution of pW/(g/kg) and 1.75 g/kg, respectively.
The optical concentration sensor, implemented through the fiber laser configurations proposed, corresponds to a simple and robust technology, that can be used to performed in-line measurements in several processing industries to contribute to the quality control of the final products.
Author Contributions
Conceptualization, L.S., R.A.P.-H. and O.F.; methodology, L.S., R.A.P.-H., S.S. and O.F.; validation, L.S. and R.A.P.-H.; formal analysis, L.S., R.A.P.-H., S.S. and O.F.; investigation, L.S., R.A.P.-H., S.S. and O.F.; resources, S.N., A.F., S.S. and O.F.; data curation, L.S. and R.A.P.-H.; writing—original draft preparation, L.S.; writing—review and editing, L.S., R.A.P.-H., S.N., A.F., S.S. and O.F.; visualization, A.F., S.S. and O.F.; supervision, A.F., S.S. and O.F. All authors have read and agreed to the published version of the manuscript.
Funding
This work was supported by the National Funds through the Portuguese Funding Agency, FCT—Fundação Para a Ciência e a Tecnologia under Grant UIDB/50014/2020 and in part by the National Funds through FCT/MCTES (PIDDAC), under Grant LA/P/0045/2020 (ALiCE), Grant UIDB/00511/2020, and Grant UIDP/00511/2020 (LEPABE). Liliana Soares acknowledges the support of FCT, through the Grant 2020.05297.BD. DOI: 10.54499/2020.05297.BD. Rosa Ana Perez-Herrera acknowledges the support of projects PID2019-107270RB-C22 and PID2022-137269OB-C21 funded by MCIN/AEI/10.13039/501100011033 and FEDER “A way to make Europe”; projects PDC2021-121172-C21 and TED2021-130378B-C22 funded by MCIN/AEI/10.13039/501100011033 and European Union “Next generation EU”/PRTR, and Program “José Castillejo para estancias de movilidad en el extranjero de jóvenes doctores”, funded by the Ministerio de Universidades of Spain (reference CAS21/00351).
Institutional Review Board Statement
Not applicable.
Informed Consent Statement
Not applicable.
Data Availability Statement
Data underlying the results presented in this paper are not publicly available at this time but may be obtained from the authors upon reasonable request.
Conflicts of Interest
The authors declare no conflicts of interest.
References
- Maiman, T. Stimulated Optical Radiation in Ruby. Nature 1960, 187, 493–494. [Google Scholar] [CrossRef]
- Kissinger, C.D. Fiber Optic Proximity Probe. U.S. Patent 3327584A, 27 June 1967. [Google Scholar]
- Ahmad, H.; Zulkhairi, A.S.; Azzuhri, S.R. Temperature sensor and fiber laser based on optical microfiber knot resonator. Optik 2018, 154, 294–302. [Google Scholar] [CrossRef]
- Guo, K.; He, J.; Xu, G.; Wang, Y. Dual-polarization distributed feedback fiber laser sensor based on femtosecond laser-inscribed in-fiber stressors for simultaneous strain and temperature measurements. IEEE Access 2020, 8, 97823–97829. [Google Scholar] [CrossRef]
- Jauregui-Vazquez, D.; Alvarez-Chavez, J.A.; Lozano-Hernandez, T.; Estudillo-Ayala, J.M.; Sierra-Hernandez, J.M.; Offerhaus, H.L. Fiber Laser Sensor Configurations for Refractive Index, Temperature and Strain: A Review. Photonics 2023, 10, 495. [Google Scholar] [CrossRef]
- Desurvire, E.; Simpson, J.R.; Becker, P.C. High-gain erbium-doped traveling-wave fiber amplifier. Opt. Lett. 1987, 12, 888–890. [Google Scholar] [CrossRef] [PubMed]
- Dong, X.; Ngo, N.Q.; Shum, P.; Guan, B.-O.; Tam, H.-Y.; Dong, X. Concentration-induced nonuniform power in tunable erbium-doped fiber lasers. Opt. Lett. 2004, 29, 358. [Google Scholar] [CrossRef] [PubMed]
- Correia, R.; Sinha, R.; Norris, A.; Korposh, S.; Talbot, S.; Hernandez, F.U.; Morgan, S.P. Optical fiber sensing at the interface between tissue and medical device. In Proceedings of the International Conference on Biophotonics, Perth, Australia, 30 April–1 May 2017. [Google Scholar]
- Dong, X.; Ngo, N.Q.; Shum, P.; Tam, H.-Y.; Dong, X. Linear cavity erbium-doped fiber laser with over 100 nm tuning range. Opt. Express 2003, 11, 1689–1694. [Google Scholar] [CrossRef] [PubMed]
- Liu, Y.; Zhang, W.; Xu, T.; He, J.; Zhang, F.; Li, F. Fiber laser sensing system and its applications. Photonic Sens. 2011, 1, 43–53. [Google Scholar] [CrossRef]
- Hadeler, O.; Ibsen, M.; Zervas, M.N. Distributed-feedback fiber laser sensor for simultaneous strain and temperature measurements operating in the radio-frequency domain. Appl. Opt. 2001, 40, 3169. [Google Scholar] [CrossRef]
- Hecht, E. Optics, 5th ed.; Pearson: London, UK, 2015. [Google Scholar]
- Ryglowski, L.; Cyprych, K.; Mysliwiec, J. The differentiation procedure between amplified spontaneous emission and lasing phenomena. Opt. Commun. 2022, 510, 127939. [Google Scholar] [CrossRef]
- Soares, L.; Novais, S.; Ferreira, A.; Frazão, O.; Silva, O.S. Detection of the Crystallization Process of Paracetamol with a Multi-Mode Optical Fiber in a Reflective Configuration. Sensors 2019, 20, 87. [Google Scholar] [CrossRef] [PubMed]
Figure 1.
Schematic of the bidirectional erbium-doped fiber amplifier.

Figure 2.
Schematic of the sensing head.

Figure 3.
Experimental setup of the fiber laser systems proposed for concentration measurements of liquid solutions. (*) represents the optical coupler used in each fiber laser configuration.
Figure 3.
Experimental setup of the fiber laser systems proposed for concentration measurements of liquid solutions. (*) represents the optical coupler used in each fiber laser configuration.

Figure 4.
Characterization of paracetamol liquid samples. Concentration of paracetamol in solution as a function of RI.
Figure 4.
Characterization of paracetamol liquid samples. Concentration of paracetamol in solution as a function of RI.

Figure 5.
Fiber laser system characterization. (a) Output spectrum of each fiber laser system, using different optical couplers. Optical output power as a function of the laser diode drive current for the fiber laser system using the optical couplers: (b) 50:50; (c) 60:40, 70:30 and 80:20.
Figure 5.
Fiber laser system characterization. (a) Output spectrum of each fiber laser system, using different optical couplers. Optical output power as a function of the laser diode drive current for the fiber laser system using the optical couplers: (b) 50:50; (c) 60:40, 70:30 and 80:20.

Figure 6.
Optical output power as a function of paracetamol concentration for each fiber laser system, using different optical couplers: (a) 50:50; (b) 60:40; (c) 70:30; (d) 80:20.
Figure 6.
Optical output power as a function of paracetamol concentration for each fiber laser system, using different optical couplers: (a) 50:50; (b) 60:40; (c) 70:30; (d) 80:20.

Figure 7.
Resolution of fiber laser systems proposed, using different optical couplers: (a) 50:50; (b) 60:40; (c) 70:30; (d) 80:20.
Figure 7.
Resolution of fiber laser systems proposed, using different optical couplers: (a) 50:50; (b) 60:40; (c) 70:30; (d) 80:20.


Table 1.
Determination of the fiber laser system resolutions.
| Variable | Unit | 50:50 | 60:40 | 70:30 | 80:20 |
|---|---|---|---|---|---|
| nW | 0.04 | 0.01 | 0.01 | 0.01 | |
| g/kg | 16.6 | 16.6 | 16.6 | 16.6 | |
| nW | 0.21 | 0.05 | 0.12 | 0.19 | |
| Resolution | g/kg | 6.32 | 6.64 | 2.77 | 1.75 |
Table 2.
Characterization of the linear Fiber laser sensors proposed.
| Optical Coupler | 50:50 | 60:40 | 70:30 | 80:20 |
|---|---|---|---|---|
| Lasing | ✓ | ✓ | ✓ | ✓ |
| Sensitivity [pW/(g/kg)] | ||||
| Resolution (g/kg) | 6.32 | 6.64 | 2.77 | 1.75 |
Disclaimer/Publisher’s Note: The statements, opinions and data contained in all publications are solely those of the individual author(s) and contributor(s) and not of MDPI and/or the editor(s). MDPI and/or the editor(s) disclaim responsibility for any injury to people or property resulting from any ideas, methods, instructions or products referred to in the content. |
© 2024 by the authors. Licensee MDPI, Basel, Switzerland. This article is an open access article distributed under the terms and conditions of the Creative Commons Attribution (CC BY) license (https://creativecommons.org/licenses/by/4.0/).
Share and Cite
MDPI and ACS Style
Soares, L.; Perez-Herrera, R.A.; Novais, S.; Ferreira, A.; Silva, S.; Frazão, O. Linear Fiber Laser Configurations for Optical Concentration Sensing in Liquid Solutions. Photonics 2024, 11, 393. https://doi.org/10.3390/photonics11050393
AMA Style
Soares L, Perez-Herrera RA, Novais S, Ferreira A, Silva S, Frazão O. Linear Fiber Laser Configurations for Optical Concentration Sensing in Liquid Solutions. Photonics. 2024; 11(5):393. https://doi.org/10.3390/photonics11050393
Chicago/Turabian StyleSoares, Liliana, Rosa Ana Perez-Herrera, Susana Novais, António Ferreira, Susana Silva, and Orlando Frazão. 2024. "Linear Fiber Laser Configurations for Optical Concentration Sensing in Liquid Solutions" Photonics 11, no. 5: 393. https://doi.org/10.3390/photonics11050393
Note that from the first issue of 2016, this journal uses article numbers instead of page numbers. See further details here.