Uniform Lighting of High-Power LEDs at a Short Distance to Plants for Energy-Saving and High-Density Indoor Farming


Institute of Materials Research and Engineering, A*STAR (Agency for Science, Technology and Research), 2 Fusionopolis Way, #08-03, Innovis, Singapore 138634, Singapore
*
Author to whom correspondence should be addressed.
†
These authors contributed equally to this work.
Photonics 2024, 11(5), 394; https://doi.org/10.3390/photonics11050394
Submission received: 26 February 2024
/
Revised: 13 April 2024
/
Accepted: 22 April 2024
/
Published: 24 April 2024
(This article belongs to the Section Optoelectronics and Optical Materials)
Abstract
:A tunable LED panel with multiple types of LEDs on a panel can provide various spectra for optimal plant growth. However, it is difficult for a lighting panel with multiple types of high-power LEDs to achieve uniform lighting. We demonstrated that by using optical reflectors at the sides of an LED panel to trap photons of LED arrays or using both the above-mentioned reflectors and optical lenses on each LED, high lighting uniformity can be achieved at a short distance to plants. The ray tracing simulation results show that the LED panel equipped with reflectors and optical lenses can achieve a high uniformity of >0.80 when the LED-plant distance is at half of the LED array’s pitch. We further verified that an LED panel (at a size of 88 cm × 54 cm) installed with reflectors can achieve light uniformities around 0.90 at a 15 cm LED-plant distance for the 6 types of LEDs (4 color LEDs and 2 white LEDs) on the panel. Compared with a branded tunable LED panel, our LED panel saves >25 cm vertical distance for each tier of plants and has 92.5% higher photon efficacy for 660 nm LEDs that exist on both panels.
1. Introduction
LED has been regarded as a promising lighting source for agriculture due to its higher lighting efficiency than other types of lamps such as fluorescent or high-pressure sodium lamps [1,2,3]. It is reported that different LED wavelengths will affect growth speed, morphology, and taste of crops [4,5,6,7,8,9,10,11,12,13,14,15,16,17,18,19]. Furthermore, using a lighting recipe with optimal lighting conditions avoids over-supply of lighting, reduces LED generated heat, accelerates plant growth, and thus can save energy up to 40% through an on-demand lighting system that controls both lighting amount and lighting spectrum for indoor farming [20,21,22,23].
Smart tunable LED lighting systems are typically tuned using pulse-width modulation (PWM) via the control of LED driver with control software and algorithms [24,25,26,27]. In the market, there are some tunable LED products with four to nine different types of LEDs with different nominal wavelengths or different white LED color temperatures, such as DYNA from Heliospectra, PHYTOFY® RL from Osram, DRAGON ALPHA from Scynce LED, and LED Spectra SMART from AgroLED, etc. These LED products allow users to tune the optical spectrum with lighting recipes for plant growth. High-power LEDs (1 to 3 W per LED) are used in these panels for higher photon efficacy (i.e., the ratio of photons generated to electricity consumption) compared with mid-power LEDs (0.25 to 0.5 W per LED) or low-power LEDs (0.05 to 0.1 W per LED). High-power LEDs reduce the number of LEDs required in each panel for the same photon flux density (PFD), but impose difficulties in achieving uniform lighting on plants, especially for high-density urban indoor farming where space is precious and the optimal height in each tier of a vertical plant factory is just 40 cm [28]. Recently, Sheibani et al., demonstrated that energy efficiency for lettuce growth at a 15 cm LED-canopy distance is 2.1-fold that of at 45 cm LED-canopy distance [29]. The LED light source is desired to be located at a short distance to plants within 10 to 20 cm, with uniformity (i.e., the ratio of the minimum to the average PFD on the illuminated area) ≥0.7 [1].
Uniform lighting is a challenging issue in indoor farming. An example is shown in Figure S1 for Osram PHYTOFY® RL LED panel. Osram PHYTOFY® panel has six types of LEDs at 385 nm, 450 nm, 521 nm, 660 nm, 730 nm, and white 2700 K, with photon fluxes of 53, 252, 96, 245, 114, and 215 mol/s, respectively. We compare our study with Osram PHYTOFY® panel because it is a state-of-the-art tunable LED panel broadly used by different research entities for lighting recipe developments including Michigan State University, National Aeronautics and Space Administration (NASA), University of Arizona, University of Copenhagen, etc. [30,31,32,33]. Furthermore, we also purchased and characterized Osram PHYTOFY® panel in our laboratory. Ray tracing simulations indicate that a 48 cm × 48 cm sized LED panel with red LEDs arranged according to the Osram PHYTOFY® panel only has a light uniformity of 0.31 in a 48 cm × 48 cm illuminated area (in a plane representing the canopy of the plants) at 15 cm below the LEDs. At a distance of 40 cm from LEDs to plants, the light uniformity is increased to 0.53 (in Supplementary Materials Figure S1). To fulfill the required uniformity, a distance of >40 cm to plants is suggested in the datasheet of Osram PHYTOFY® panel. The datasheets for DYNA and DRAGON ALPHA also specified a minimum LED-plant distance of 50 cm and 60 cm, respectively. Because the uniformities of LED panels vary by the LED-plant distance, they are not specified in their datasheets.
High PFD can burn or kill the plants, low PFD will lead to plant growth retardation, cryptogam, or death of plants, while non-uniform lighting will result in different sizes, weights, and shapes of plants. Uniform lighting for LED luminaires has been an issue investigated by various research papers, it can be solved either by diffusers, array constructions of LEDs, reflectors, optical lenses, or a combination of reflectors and lenses. Villard et al., positioned multiple LEDs to illuminate the surface of a light diffuser, and the aggregated light from the diffuser will have uniform lighting [34]. Diffusers are effective in civil lighting for human comfort, but for grow lights, diffusers redirect photons in all directions and lose LED photons for plant growth. Array constructions of LEDs can improve the uniformity of lighting, but it is not able to achieve high uniformity and cannot avoid the side effect (the PFD at the sides is lower than other areas) of the LED array [35,36,37,38]. Reflectors are commonly used to redistribute photons for uniform lighting, such as a parabolic reflector on each LED [39], a reflector hood with a plurality of reflective flutes for an LED blub [40] or reflectors with a tilt angle along the sides of an LED lamp or LED panel [41]. However, References [39,40,41] are patents with no simulation or experimental results reported on the uniformity achieved. Using optical lenses for each LED is a feasible method for improving the uniform lighting for indoor farms, and the lenses can be molded on a single plastic plate as a cover of the LED panel or LED tube. Qin et al., used an LED array and a freeform lens on each LED to produce a large beam angle; however, this method only generates uniformity of 0.92 on an illuminated area much smaller than the size of the LED array [42]. Adams et al., used a lens array (with one lens on each LED) to increase uniformity of the illuminated area [43] and built a 44.5× 8 (113.03 cm × 20.32 cm) commercially available LED panel, which achieved a uniformity of 0.91 at 30 (76.2 cm) from the LED panel to plants in greenhouse, on an illuminated area of 5× 3.5 (152.4 cm × 106.68 cm). Nevertheless, the distance of 76.2 cm is too high for indoor farming. Auyeung et al., designed a more complicated three-part lens for uniform lighting [44], and Yorio et al., not only used lenses to expand the beam angle of the LEDs but also installed the LEDs on curved fixtures to further unify the light [45]. References [44,45] are also patents with no detailed results presented. Combinations of reflectors and lenses are commonly used for single LED lamps [46,47] but are not reported to an LED panel level for light uniformity in indoor farming yet.
In this study, we propose a method of uniform lighting for LED panels at a short distance (<15 cm) to plants, by first arranging different types of LEDs in array format and then using light reflectors to eliminate the side effects of LED lighting, or using both the aforementioned reflectors and optical lenses (one lens per LED) to widen the beam angle of each LED. Through ray tracing simulation, we found out that, for an illuminated area having the same size as an LED panel, when the distance from LEDs to plants is about half the pitch of the LED array, >0.80 uniformity can be achieved for an LED panel with multiple types of LEDs. In experiments, we built a PFD tunable LED panel (at a size of 88 cm × 54 cm) with six types of LEDs (LEDs at nominal wavelengths of 425, 490, 595, 660 nm and two white LEDs at 3000 K and 5700 K color temperatures) and characterized the panel with a home-built optical spectral-based photon characterization stage. We demonstrated that by using the optical reflectors alone, the light uniformities for all six types of LEDs can reach 0.9 for LEDs at 15 cm to plants, which highly match the uniformities in simulations. Furthermore, by power meter measurement and photon flux characterization, we demonstrated that our LED panel has 92.5% higher photon efficacy for 660 nm LEDs (commonly exist on our LED panel and Osram PHYTOFY® panel) at 15 cm to plants than that of Osram PHYTOFY® panel at 40.6 cm distance to plants, which means our LED panel saves 92.5% of energy on plant growth for 660 nm LEDs.
The novelty of our work lies in the fact that the method we proposed can be used to design high uniformity (at 0.9) and high photon efficacy LED panels for high density (i.e., the distances between each tier of plants are short) indoor farming, which contributes to the energy-saving and space-saving of indoor farming.
2. Methods and Designs
2.1. Our Solution for Uniform LED Lighting
Uniform lighting of a multiple wavelength LED panel is achieved, as presented in Figure 1:
- LEDs are arranged on an LED panel as an array of units, with each unit consisting of at least one LED or multiple LEDs at different wavelengths.
- Reflectors with 100% reflectance (i.e., mirrors) are placed vertically at half of the LED array pitch to the nearest LEDs. The reflectors eliminate the loss of photons escaping from the sides of the panel and avoid non-uniformity lighting.
- A dome lens is attached to each LED. The dome lens is formed by an outer hemisphere transparent material and an internal semi-ellipsoidal cavity. The dome lens widens the beam angle of each LED.
To investigate the feasibility of the method, we first simulated the uniform lighting of an LED panel with only reflectors, and then we designed a lens and simulated the uniformities achievable for different LED arrays with both reflectors and lenses, taking a 48 cm × 48 cm LED panel as an example. Based on the concept verification by simulations, we built a tunable LED panel including 6 types of LEDs in the size of 88 cm × 54 cm, characterized its lighting uniformity for each type of LED when the LED panel is installed with 15 cm mirrors, and compared the photon efficacy of our LED panel with that of the Osram PHYTOFY® panel.
We simulated a simple case of 4 Luminus deep red SST-10-DR LEDs (at a 120° beam angle) arranged on a 24 cm × 24 cm LED panel (Figure S2 in Supplementary Materials), to evaluate the effectiveness of uniformity improvement by reflectors. Ray tracing software FRED Optimum was used to trace 5 million rays in each LED based on its corresponding beam profile. For simulations, the grid of pixels is 481 × 481 across the full X and Y aperture of the analysis plane. Analysis surface at a size of 24 cm × 24 cm (i.e., the illuminated area) was placed 15 cm below the LED panel. The simulated irradiance (radiant flux received by a surface per unit area) was smoothed 3 times over the analysis surface, and then the average irradiance was extrapolated by averaging the irradiance of grid points on the analysis surface, and the uniformity was calculated as the ratio of the minimum irradiance to the average irradiance on the illuminated area. It was found that 15 cm high reflectors, with theoretically 100% reflectance property at the sides of the LED panel, can improve the uniformity within the illuminated area from 0.46 to 0.89 and triple the average irradiance.
The unit of the FRED simulation results is W/m due to the fact that the LEDs we simulated only provided the beam profile in the watt unit. The unit between W/m and PFD is interchangeable by , where is the PFD expressed in µmol/m/s, and are the lowest wavelength and highest wavelength of the LED spectrum, is the spectral irradiance measured in W/m/nm at wavelength , h is the Planck constant, c is the speed of light, and is the Avogadro constant [48]. For a specific type of LED, the related and have a fixed ratio. Therefore, the light uniformity is not affected by the expression of W/m or mol/m/s.
We designed a lens to widen the beam of each LED effectively. The lens was designed with FRED 21.42.0 by adjusting the curvatures and cavities of the dome lens, until a satisfactory beam angle was achieved. The lens sketched in Figure 2a has an outer hemisphere radius of 5 mm and an inner semi-ellipsoidal cavity at semi-axis lengths of 4 and 3 mm, respectively. The refractive index of the dome lens is 1.51, close to the property of transparent glass or plastic material. The dome lens can increase the SST-10-B LED’s beam angle from 120° to about 160°, according to the polar angle of the LED’s emission in ray tracing simulation. The LED beams spreading on a 24 cm × 24 cm illuminated area, 10 cm away from the LED, can be observed in Figure 2b,c for the LED without and with the lens, respectively. We also simulated and discovered that the same dome lens can effectively increase the beam angle of other types of LEDs from 120° to about 160°; thus, the dome lens applies to other types of LEDs with a 120° beam angle.
According to the preliminary simulations, we hypothesize that by either using the 100% reflectance reflectors alone or by combining the reflectors and dome lenses in a multi-wavelength LED panel, high lighting uniformity on plants can be achieved.
2.2. Design, Fabrication, and Characterization of the LED Panel for Uniformity Test
To verify the effect of uniform lighting based on our proposed solution, we designed and fabricated a PFD tunable LED panel at the size of 88 cm × 54 cm, for lighting an 88 cm × 54 cm area at a 15 cm distance below the LED panel. Six types of LEDs were designed on the panel as listed in Table 1. The PFDs required at different wavelength ranges vary by specific plants at their specific growth stages. The lighting recipes are developed to supply the enough photons required by the plants. Thus, the tunability of the LED panel is important. A total PFD of 350 mol/m/s would be enough for vegetable growth [18]. Since the tunable LED system can tune down the PFD of the photons, we designed each type of LED on the panel to have a maximum PFD between 350–450 mol/m/s to make sure that the PFD for each single wavelength is strong enough for plant growth. PFD for 595 nm yellow color LED is designed at around 190 mol/m/s because the yellow color LEDs have lower photon efficacy and yellow photons required for plants are only about 18 to 32% of total photons [19,49].
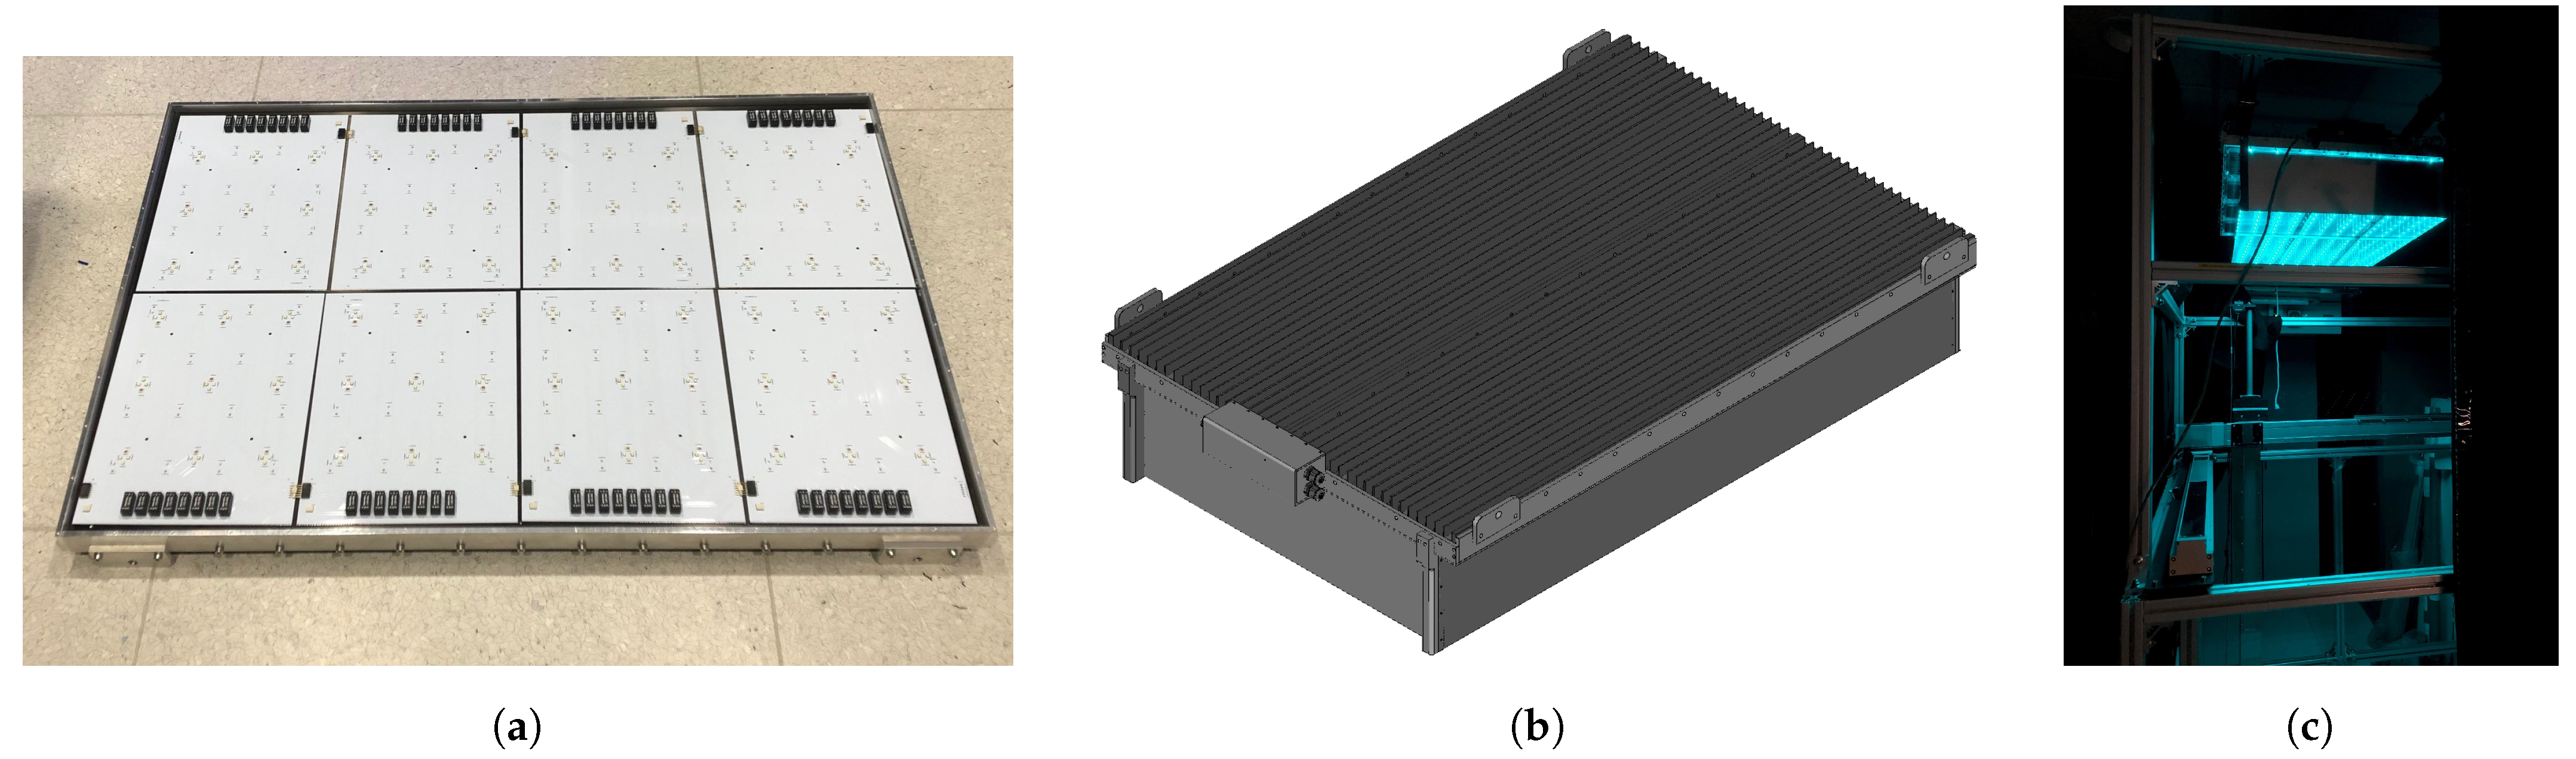
Eight PCBs at a size of 22 cm × 27 cm were combined to form an 88 cm × 54 cm panel, as presented in Figure 3a. LEDs on each PCB for different types were arranged as arrays of 3 × 3, 3 × 4 or 4 × 4 (Table 1), depending on the LED numbers required to generate the desired PFDs on the illuminated area. The LEDs were driven by Mean Well LDD-350L DC-DC LED drivers at a 350 mA constant current and the drivers were soldered on the PCBs. The DC-DC LED drivers were powered by AC-DC transformer HLG-240H-36 from Mean Well. The 3rd pin of the LDD-350L LED driver was for PWM input to tune the PFD of the LEDs. We used the PWM outputs of the ESP32 microcontroller to tune the light via C language.
Although our proposed solution is meant to use both reflectors and lenses to achieve uniform LED lighting, LED lenses are expensive to fabricate for small batches of experiments. Since reflectors with 100% reflectance can greatly improve the LED panel’s uniformity as shown in Figure S2, we only used four 15 cm high mirrors installed at the sides of the LED panel to realize the uniform lighting, as shown in Figure 3b.
The PFD for each type of LED on the LED panel was characterized with a home-built optical spectroscopy setup in Figure 3c, at a room temperature of 25 °C in the laboratory. During the characterization, the LED panel was fixed on the top of a rack. On the rack, a fiber probe connected with optical spectroscopy moved in XYZ directions controlled by Keyence PLCs. The method we used to characterize the LED panel was similar to the one described by Balázs et al. [48], except that our system wasautomated in XYZ directions for the movement of the fiber probe. The end of the fiber probe was capped with an 8 mm active area cosine corrector with diffusing material for UV/VIS/NIR to collect LED emission from a 180° field of view, and the optical spectroscopy used was AvaSpec-ULS2048CL-RS-EVO spectroradiometer purchased from and calibrated by Avantes. When only one type of LED was on, a fiber optical probe fixed on the XYZ stage collected the optical spectrum of the LEDs at the location of the fiber probe for the specific type of LEDs. As the fiber probe mapped the illuminated area, the PFD for the whole illuminated area was obtained. The mirrors for the LED panel were 15 cm in height, and the vertical distance from the fiber probe to the fabricated LED panel was also set as 15 cm (i.e., the illuminated area was 15 cm away from the LED panel), to make sure at most photons emitted downwards from the LED panel were collected by spectroradiometer’s fiber probe. In Reference [48], 10 × 10 grid points were used to characterize a 110 cm × 110 cm lighting area for plant growth at a pitch of 10 cm. In our LED panel characterization, the grid points in X and Y directions were 32 × 28, with pitches of 3 cm and 2 cm, respectively. It took about 3 s to complete the spectral collection and probe movement at each point. Thus, 45 min were required to characterize one type of LED on the panel, and 4.5 h were used to characterize the LED panel with 6 types of LEDs.
In an actual farming system, the light spectrum required by plants changes at different plant growth stages, and the actual LED light used in indoor farming is a spectral combination of different types of LEDs. However, in theory, the uniformity of lighting for each type of LED will not be affected by its PFD being tuned, nor will the uniformity of lighting be affected by the number of types of LEDs turned on. Thus, we characterized the PFD of each LED type at 100% power.
In this paper, we tried to achieve uniformity for each type of LED. This is because photons at different wavelengths have different photosynthesis effectiveness; thus, it is not suitable to compensate for the non-uniformity of photons at one wavelength by photons at another wavelength. Hence, the uniformity of LEDs should be simulated and measured by each LED type.
Since the PFD at the grow bed is simply an add-up of different combinations of different LED wavelengths, the overall LED light uniformity on the grow bed at any spectral combination can be calculated by adding the photons from all types of LEDs and finding the ratio of the minimum PFD to the average PFD on the grow bed. Because the minimum PFD point for each type of LED is different, when all types of LEDs are on, the uniformity will be better than the lowest uniformity among all types of LEDs on the lighting panel.
To study the energy-saving of our LED panel, the power consumption of the LED panel was measured by power meter MP001186 (Multicomp PRO).
3. Results and Discussion
3.1. Light Uniformity and PFD Simulated for a 4 × 4 LED Array
We simulated the lighting of a 48 cm × 48 cm LED panel with blue and red LEDs shown in Figure 4, to exemplify the achievable LED light uniformity by combining both the reflector and lens strategies. As presented in Figure 4, one Luminus SST-10-B blue LED and one Osram GH CSSRM4.24 red LED (both with a 120° beam angle) form one LED unit, and the 4 × 4 LED unit array at a pitch of 12 cm is arranged on the 48 cm × 48 cm LED panel. Reflectors with 100% reflectance are installed at the sides of the LED panel, and the lens designed in Figure 2 is attached to each LED. The blue LEDs are at the ideal positions for the optimal reflection of the reflectors (i.e., the distance from a reflector to its adjacent LED is half of the array pitch). The red LEDs have a 10 mm deviation from the adjacent blue LEDs. Figure 4 has the same layout as Figure 1, because in each unit, the blue LED is in the middle of the LED unit, and the red LED has a center-center distance of 10 mm from the blue LED on the right. The green, yellow, and purple LEDs in Figure 1 have the same simulation results as the red LEDs in Figure 1 and Figure 4 because the positions are symmetric, i.e., their center-center distance to the blue LED is also 10 mm.
Each Luminus SST-10-B high-power blue LED has a peak wavelength at 450 nm and a power of 1 W (equivalent to 3.76 mol/s photon flux) when driven by 600 mA current, and Osram GH CSSRM4.24 red LED has a peak wavelength at 646 to 666 nm and a power of 1 W (i.e., photon flux of 5.52 mol/s) when driven by 700 mA current. Under this condition, the arrangement of 16 SST-10-B and 16 GH CSSRM4.24 on a 48 cm × 48 cm LED panel is able to generate 60.27 mol/s blue photon flux and 88.3 mol/s red photon flux. With the PFD uniformly distributed and assuming all photons reaching the plants in an area of 48 cm × 48 cm, the average PFDs generated by blue and red LEDs are 261.1 mol/m/s and 383.2 mol/m/s, respectively.
Table 2a,b show the simulated irradiance distributions on the illuminated area at different LED-plant distances. Without using reflectors and dome lenses (i.e., without our solution), when the LED-plant distance is at 3 to 5 cm, irradiance on the illuminated area at the locations right below each LED is high, while the irradiance at remaining locations is low and even close to zero. This indicates that the light uniformity in the illuminated area is low. Accordingly, the plants right below the high-power LEDs might be burnt by the strong LED light. When the LEDs are at a further distance from the plants, the uniformity is higher because LED light beams are further dispersed and mixed in the illuminated area. However, the central illuminated area receives more photons contributed from all LEDs than the sides that only receive photons from nearby LEDs. Therefore, the light uniformity is still low. Distance increments between the LEDs and the plants also cause higher photon loss as more photons escape from the sides of the illuminated area.
The situation is different when reflectors with 100% reflectance are introduced. The height of the reflector should be able to cover the distance between the LED panel and the canopy of the plants, as illustrated in Figure 1. The reflectors reflect LED light at the sides of the panel, thus trapping photons from escaping, and the irradiance at the sides of the illuminated area will be the same as those in the middle of the illuminated area (Figure S2 in the Supplementary Materials). The dome lens (in Figure 2) further enlarges the beam angle of each LED. Table 2 shows that for blue and red LEDs with our solution by adding reflectors at the sides and designed dome lens on each LED, the light uniformity is ≥0.7 when the panel is ≥5 cm away from plants. Blue LEDs have higher uniformity that even at 4 cm distance from the LED panel, the uniformity is better than 0.7.
The colors of the LED lighting on the plants at different distances are analyzed in Table 3. Because the blue and red LEDs are arranged as units, the red and blue colors are mixed very well with or without the reflectors and lenses. Even at a distance of 5 cm from the LED panel, the color images seem to be uniform when our solution is used. Instead, without our solution, the light is concentrated under each individual LED.
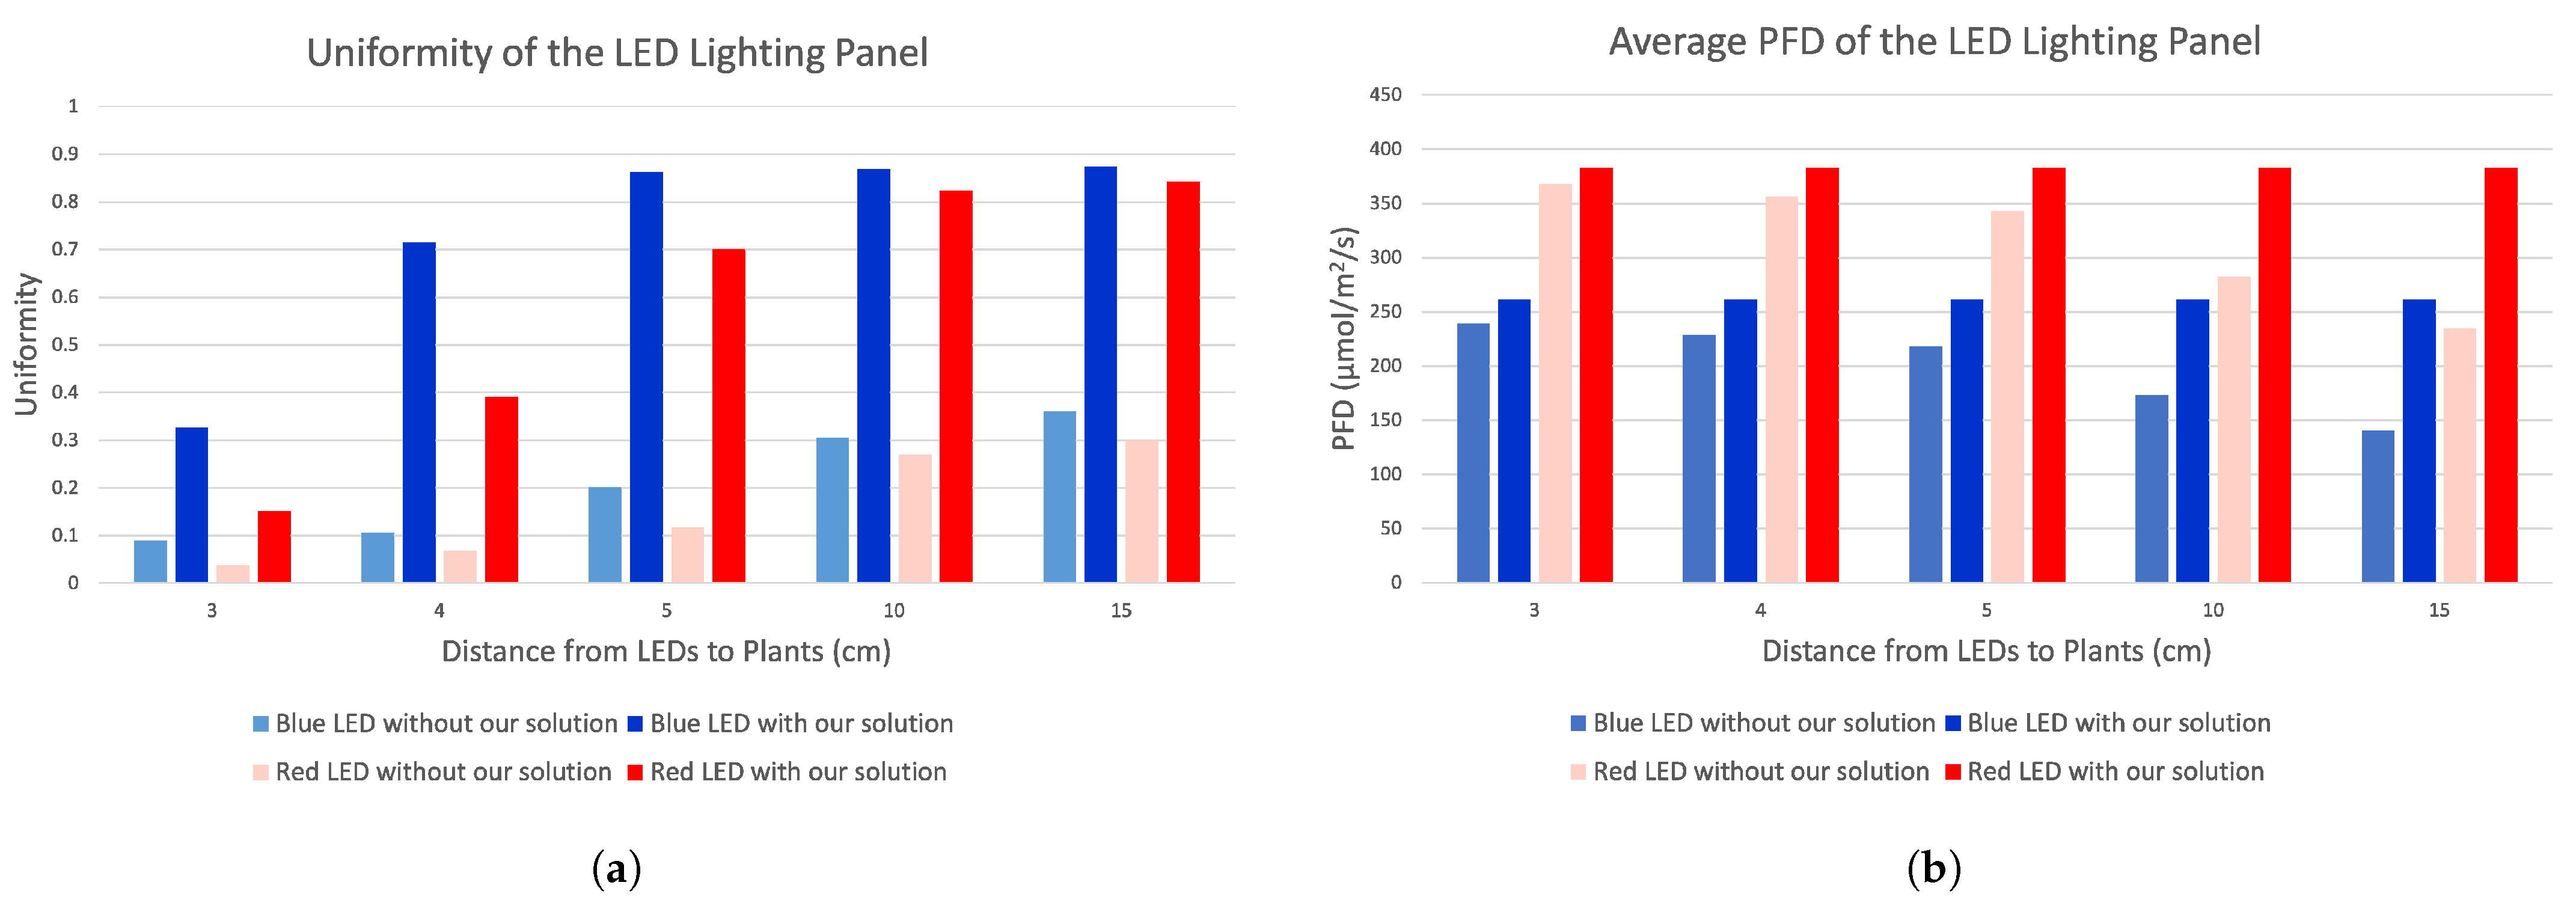
The light uniformities and irradiance distributions, without and with our solution are compared in Figure 5a,b, based on the simulations shown in Table 2. For blue light with LEDs at optimal positions for light reflection by the reflector, the uniformities obtained by our solution at 3, 4, 5, 10, and 15 cm distances from the LED panel are 3.65, 6.73, 4.26, 2.85, and 2.42 times those without using our solution. For the red LEDs, the light uniformities at 3, 4, 5, 10, and 15 cm distances are 4.02, 5.69, 6.01, 3.05, and 2.82 times those without using our solution, respectively. The red LEDs deviate 10 mm from the optimal positions for light reflection by reflectors, so the uniformities for red LEDs are lower than those of blue LEDs.
As indicated in Figure 5b, without using our solution, the PFD on plants decreases when the LED panel is further away from the plants as more photons escape from the sides. With our solution, intensities of the LED lighting on plants at 5, 10, and 15 cm distances are almost the same, so the plants can grow in an environment with uniform lighting not only in horizontal directions but also along the vertical direction for plant growth. As a result, the plant will have minimal stress to compete for photons and can avoid deforming its shape by leaning towards the space where the PFD is higher.
We further investigated the lighting of the LED panel at a distance beyond the height of the reflectors (with 100% reflectance). We simulated the lighting for both blue and red LEDs in the 4 × 4 LED panel shown in Figure 4, on an illuminated area at a distance of 20 cm below the LED panel when the reflectors are only 15 cm in height. The irradiance pattern without our solution is taken as a reference. Table 4 indicates that in this case some photons escape from the bottom of reflectors and the sides of the illuminated area are not able to receive reflected light. This makes the uniformities of the LED panel with our solution even lower than those of the reference (i.e., without our solution) in the whole 48 cm × 48 cm illuminated area. Only the area within the red line boxes in a size of 35 cm × 35 cm shown in Table 4 is not affected, whose uniformities are 0.79, for both the blue and red LEDs. The reference only has 0.64 and 0.63 uniformities in the red line boxes for blue and red LEDs, respectively. Furthermore, the average irradiance inside the 35 cm × 35 cm red line boxes is also 1.75 or 1.58 times that without our solution for blue or red LEDs.
This implies that the height of reflectors should be the same as the maximum LED-plant distance, as illustrated in Figure 1. For example, for an LED panel with 15 cm reflectors, plants can grow within 5 to 15 cm LED-plant distance for plants to receive uniform lighting. In case the plants grow between a distance of 5 to 20 cm from the LED panel, the height of the 4 × 4 LED panel reflectors should be increased to 20 cm.
3.2. LEDs with Different Pitch on the Same Sized Panel
In the LED panel design, the LED numbers are not limited to 16 (4 × 4 array) only. The irradiance distributions and light uniformities for 2 × 2, 3 × 3 and 5 × 5 LED arrays are simulated and shown in Tables S1–S3 of Supplementary Materials Section S3. The simulations are conducted for an LED panel size of 48 cm × 48 cm with Luminus SST-10-B blue LEDs and Osram GH CSSRM4.24 red LEDs, and both LEDs have a 120° beam angle. The pitches of the 2 × 2, 3 × 3, 4 × 4 and 5 × 5 LED arrays are 24, 16, 12 and 9.6 cm, respectively.
As can be observed in Figure 6, with more LEDs on the panel and further LED-plant distance, higher uniformity for LED panel lighting is achieved. However, without our solution, even at a 15 cm distance, light uniformity is less than 0.4 for all these LED arrays. With our solution, 4 × 4 and 5 × 5 LED arrays can be used at 5 cm LED-plant distance (with uniformity ≥0.7); for 2 × 2 and 3 × 3 LED arrays, the LED-plant distance must be 10 cm to achieve uniformity ≥0.7. In summary, when the LED-plant distance is at half of the pitch of the LED array, a high uniformity of >0.80 can be achieved for different wavelengths of LEDs.
3.3. Light Uniformity Measured by the Fabricated LED Panel
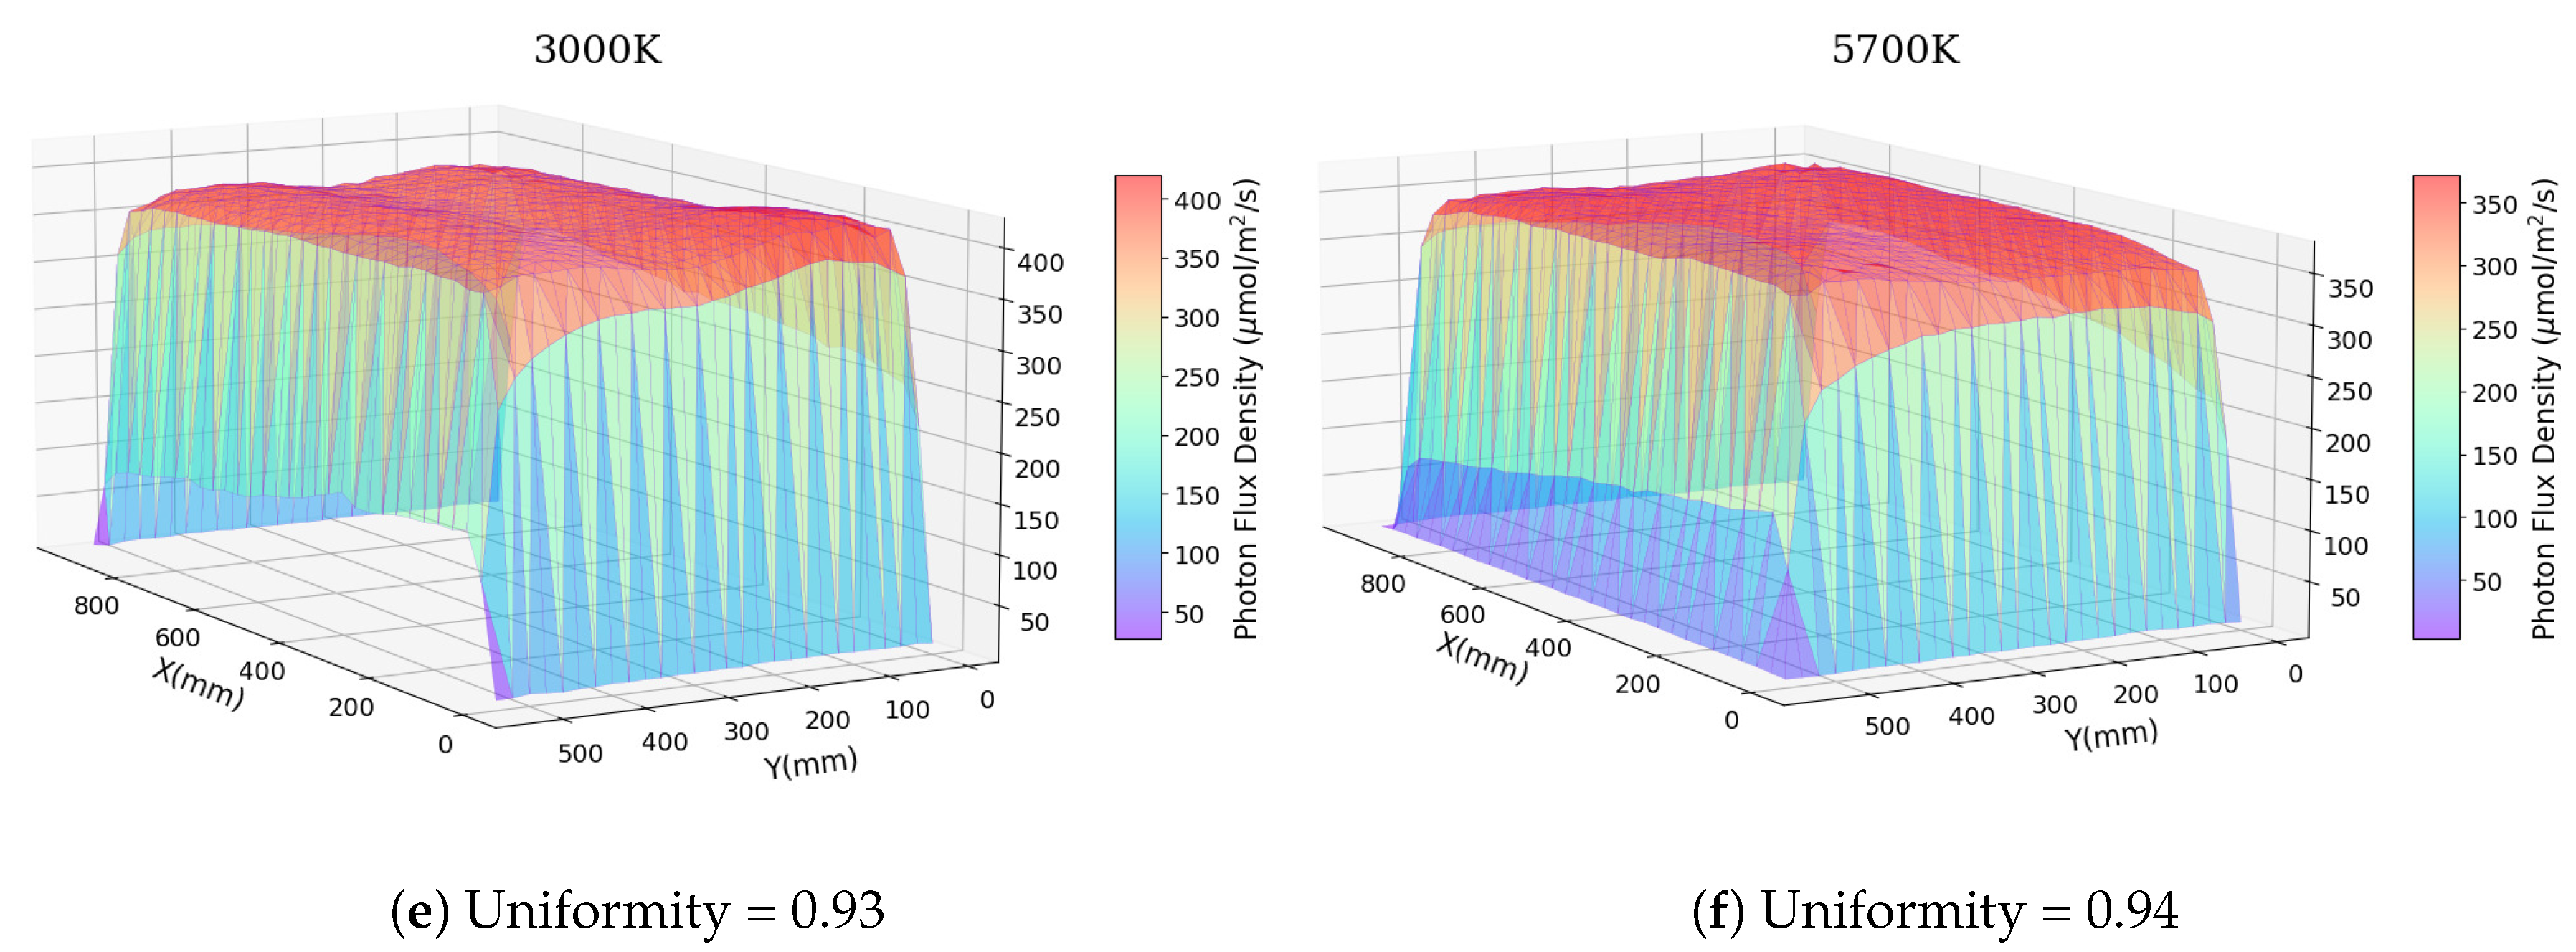
The PFD for type of LED on the panel fabricated is characterized and presented in Figure 7. The illuminated area is 88 cm × 54 cm at a distance of 15 cm from the LED panel. Figure 7 indicates that for all types of LEDs , the PFDs within the reflector-trapped area are highly uniform.
The PFD and light uniformity for each LED type on the panel are analyzed in an area of 88 cm × 54 cm as shown in Figure S3 (Supplementary Materials), based on the mapping results in Figure 7. We simulated the uniformity of each type of LED based on their corresponding locations on the panel with reflectors (at 100% reflectance) installed (without lens) in Figure S4 (Supplementary Materials). Figure S4 is simulated with the light beam profile of white LED SST-20-W30H-A120 at 3000 K color temperature (i.e., the 3000 K LEDs in Table 1, at a beam angle of 120°). Using a fixed type of LEDs to simulate the light uniformity has the drawback of not being able to fully match the experimental results, but can reveal more information about how different arrays of LEDs affect the light uniformity. The simulation results show that on the illuminated area of 88 cm × 54 cm at 15 cm LED-plant distance, different wavelengths on the LED panel will have high uniformities of 0.92 to 0.94 for 3 × 3, 3 × 4 and 4 × 4 LED arrays. In Table 5, the characterized light uniformities of the LED panels match our simulations very well, which proves that our proposed method can effectively improve the light uniformity for each type of LED.
In Table 5, the originally designed PFD for each type of LED should be higher than the characterized PFD because the panel design is based on LED’s photon flux at a P-N junction temperature of 25 °C. In actual operation, the junction temperature will increase by tens of degrees due to the accumulation of LEDs’ heat generation. By datasheets, the raised junction temperature will change the photon emission from the LEDs at 425 nm, 490 nm, 595 nm, 600 nm, 3000 K and 5700 K by −0.125%/°C, 0.0357%/°C, −1.2%/°C, −0.08%/°C, −0.125%/°C, −0.20%/°C, respectively. Accordingly, raising the LEDs’ P-N junction temperature from 25 °C to 40 °C will vary the PFDs for each type of LED from the original designs by −1.875%, 0.534%, −18%, −1.2%, −1.875% and −3%, respectively. This explains that 595 nm LEDs have the highest PFD drop of −19.97% in the measurements. Another reason for deviations between the design and measurement is that the LEDs purchased from retailers are not labeled with accurate brightness groups/bins, and this deviation could be two times. For example, 490 nm LEDs (GV QSSPA1.13-JZKZ-27-1), which have the second largest deviation in Table 5 are labeled as 62 to 112 lm with a typical value of 77 lm. Thus, no matter whether it is designed by 77 lm (which is used in our design) or by 87 lm (the median of 62 to 112 lm), the lumen of the purchased LEDs can vary up to 45% based on different manufacturing batches, designers can hardly retrieve accurate information based on corresponding LEDs’ datasheet. This implies that the PFD of LEDs on the panel must be characterized accurately and cannot solely rely on the LED labels.
Due to the inaccurate LED information used in the design of the LED panel, it is difficult to calculate the exact photon loss in the illuminated area. However, the deviations between the measured PFD and the PFD designed for the illuminated area shown in Table 5 are not very high, so we conclude that the photon loss caused by the side effect is trivial. In summary, our experiments prove reflectors installed on LED panels can help achieve highly uniform lighting. The uniformities match the simulations very well and the photon loss is negligible.
4. LED Lighting Panel’s Tunability and Energy-Saving
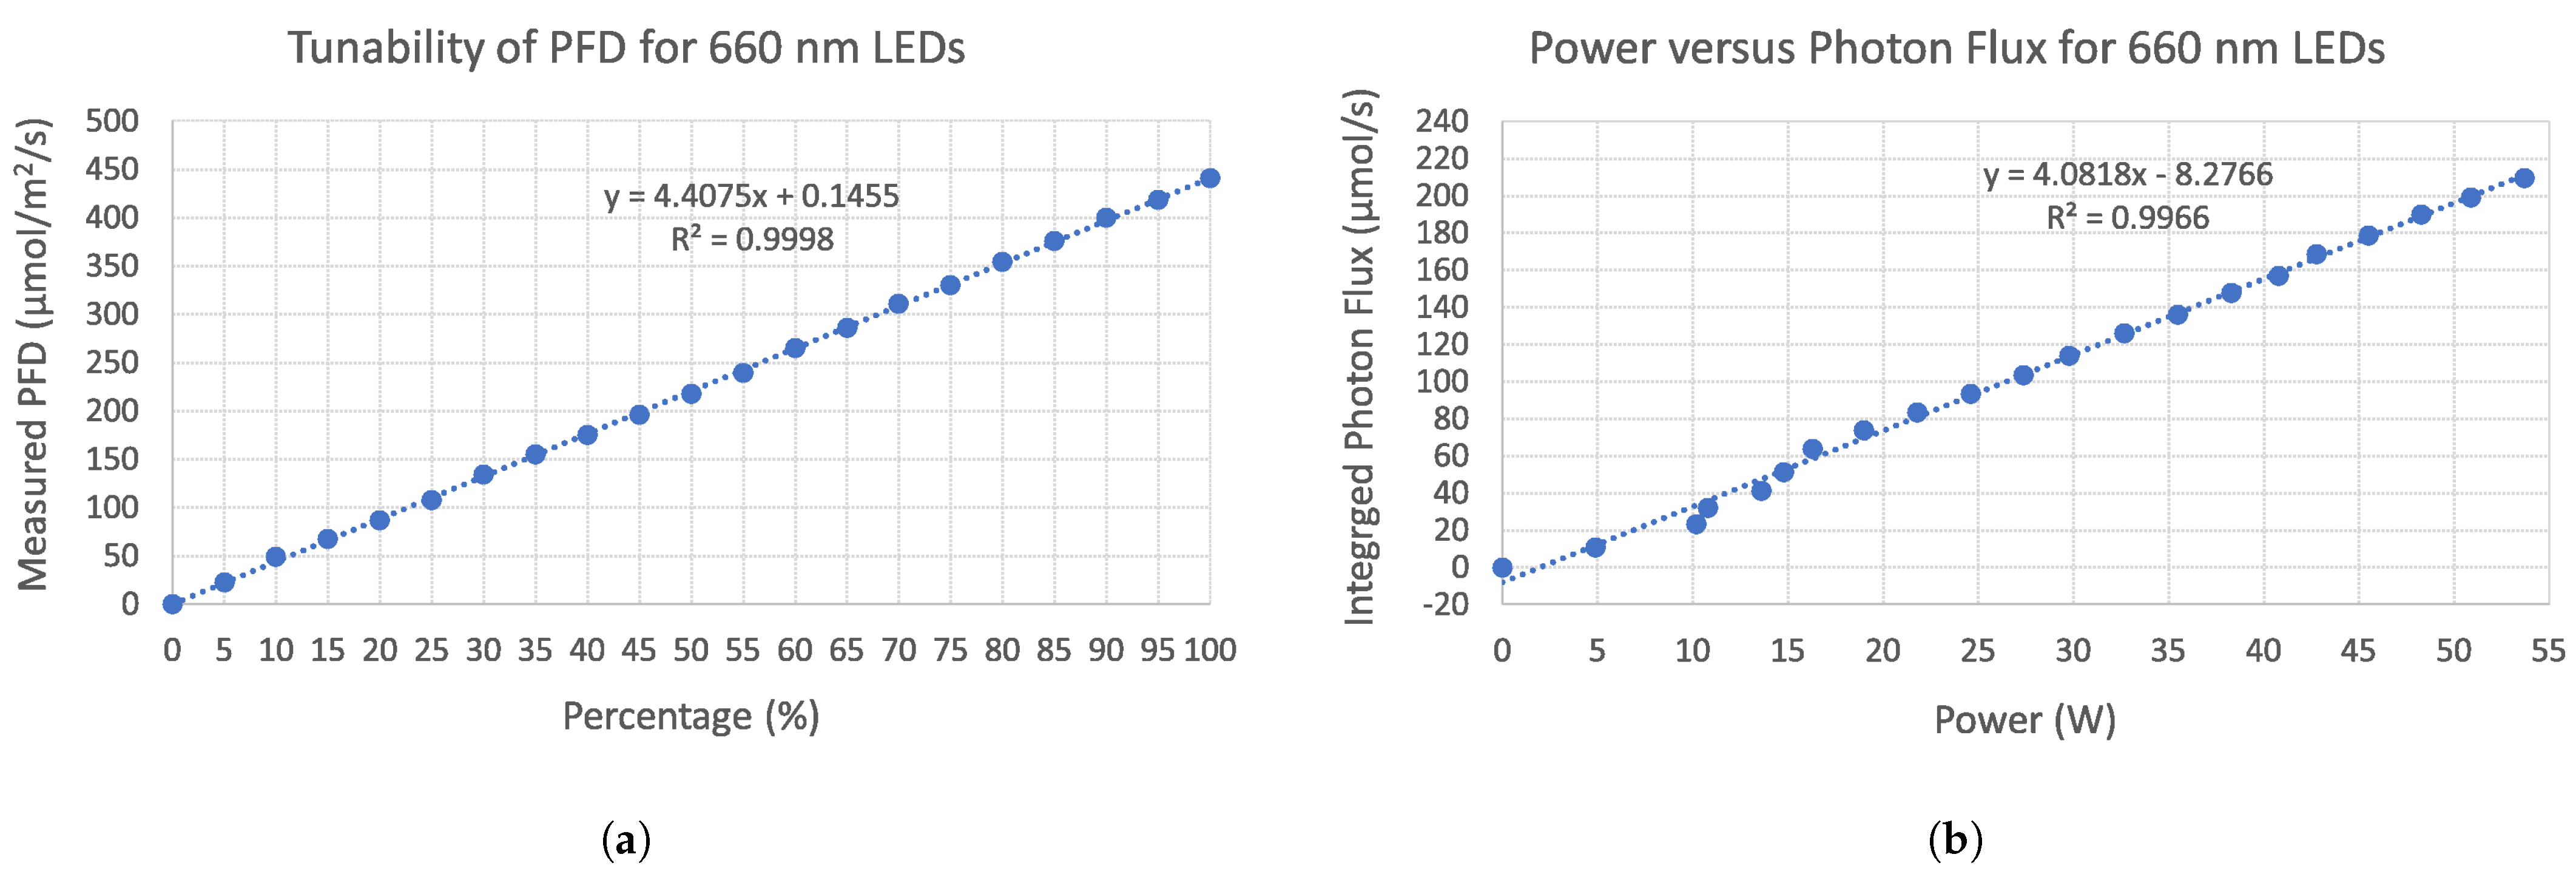
To compare the energy-saving of our LED panel with the Osram PHYTOFY® panel, we investigated the power consumption for the type of 660 nm LED which is on both LED panels. The PFD tunability of the 660 nm LEDs on our panel is presented in Figure 8a, where the PFD was measured at a distance of 15 cm with mirrors installed at the sides of the LED panel. The PFD of the 660 nm LED measured is linear (at an R-squared value of 0.9998) to the setting of the PFD percentage, indicating PWM as a linear and reliable PFD tuning method for LED luminaires in indoor farming.
The photon fluxes of the LED panel for 660 nm LEDs can be obtained by integration of the PFDs within the LED panel area. We calculated the photon fluxes at 5% increment of percentage setting and also measured the electric power of the LED panel when only 660 nm LEDs were on and set at the specific percentage. Accordingly, the relationship between the photon flux and electric power of the LED panel for 660 nm LEDs is plotted in Figure 8b. When the output percentage is >15%, the electric power taken by the 660 nm LED changes linearly with the photon flux of the LEDs. The linear coefficient in Figure 8b is the LED panel’s photon efficacy for 660 nm LEDs, which is 4.0818 mol/J.
The Osram PHYTOFY® LED panel is also tuned by PWM. In the datasheet of the Osram PHYTOFY® panel, it has indicated a total photon flux of 245 mol/s for the 660 nm LEDs when three PHYTOFY® panels are installed center to center at a spacing of 40.6 cm (16) and 40.6 cm (16) distance below these panels. We measured the electric power of an Osram PHYTOFY® panel when only its 660 nm LEDs are at the maximum PFD, which is 38.41 W. Thus, the photon efficacy of each Osram PHYTOFY® panel is 245 mol/s divided by 3 times of 38.41 W, i.e., 2.12 mol/J at a 40.6 cm distance to plants.
Compared with the Osram PHYTOFY® LED panel, our LED panel saves >25 cm distance required for each tier of LED plants and has 92.5% higher photon efficacy at 15 cm distance to plants than that of the Osram PHYTOFY® LED panel at 40.6 cm distance to plants. This energy-saving percentage matches the results reported by Sheibani et al., that energy efficiency for lettuce growth at a 15 cm LED-canopy distance is 2.1-fold that of at 45 cm LED-canopy distance [29].
The LED panel we developed has been tested at Temasek Life Sciences Laboratory of Singapore for lighting recipe developments for two years and achieved satisfactory results on plant growth. Due to the confidentiality of the collaboration, the plant growth details are not reported in this paper.
5. Conclusions
High-power LEDs are widely used for indoor farming because they have higher photon efficacy which benefits long-term energy-saving in indoor farming. When high-power LEDs are used, the quantity of LEDs used for each type is small (such as 4 to 25 LEDs on a 48 cm × 48 cm panel), achieving uniform lighting at a short LED-plant distance (10 to 30 cm) becomes an issue. Current high-power LED-formed lighting panels in the market require at least a 40 to 70 cm distance from the LED light source to plants, which wastes space and energy for indoor farming.
We proposed a tunable LED lighting panel including multi-types of LEDs, using either reflectors or a combination of reflectors and lenses to uniformize the LED lighting on plants. By ray tracing simulations on high-power LEDs, we demonstrated that our solution can achieve satisfactory light uniformity (>0.8) for plant growth at a short distance (with a ratio of LED-plant distance to pitch as low as 0.5) to plants. The effectiveness of our solution is verified by experiments with an 88 cm × 54 cm LED lighting panel with mirrors installed (with no lens for LEDs) at its sides. The characterization of the LED panel with 15 cm high mirrors indicates that the light uniformities can reach >0.90 at a distance of 15 cm to plants (on an illuminated area of 88 cm × 54 cm) for all 6 types of LEDs, highly matching the uniformities simulated by ray tracing method. For the LEDs at 660 nm that exist on both our LED panel and Osram PHYTOFY® panel, we found that our LED panel has a photon efficacy of 4.0818 mol/J at 15 cm distance to plants, which is 92.5% more efficient than Osram PHYTOFY® panel’s photon efficacy of 2.12 mol/J at a 40.6 cm distance to plants.
With our method, the LED-plant distance is shortened, and high-density indoor farming can be realized. Our solution also minimizes photon loss, increases the PFD on plants, and significantly increases the photon efficacy for plant growth.
Supplementary Materials
The following supporting information can be downloaded at: https://www.mdpi.com/article/10.3390/photonics11050394/s1, Figure S1: OSRAM PHYTOFY® RL LED panel and related simulations. Figure S2: Simulations to verify functions of reflectors. Figure S3: Simulations of light uniformities for 3000 k white LEDs at different locations of the fabricated LED panel. Figure S4: Analyses of light uniformities characterized for the fabricated LED panel. Table S1: Simulations of a 2×2 LED array on a 48 cm × 48 cm sized LED panel. Table S2: Simulations of a 3 × 3 LED array on a 48 cm × 48 cm sized LED panel. Table S3: Simulations of a 5 × 5 LED array on a 48 cm×48 cm sized LED panel.
Author Contributions
Conceptualization, T.I.W. and X.Z.; Methodology, T.I.W. and X.Z.; Software, T.I.W.; Validation, T.I.W. and X.Z.; Formal analysis, T.I.W. and X.Z.; Resources, X.Z.; Data curation, X.Z. and T.I.W.; Writing—original draft preparation, X.Z.; Writing—review and editing, T.I.W. and X.Z.; Visualization, X.Z. and T.I.W.; Project administration, X.Z.; Funding acquisition, X.Z. All authors have read and agreed to the published version of the manuscript.
Funding
This research was financially supported by the Institute of Materials Research and Engineering (IMRE), the Agency of Science, Technology and Research (A*STAR), and the Industry Alignment Fund—Pre-positioning Programme (IAF-PP) [grant number A19D9a0096] from A*STAR of Singapore.
Institutional Review Board Statement
Not applicable.
Informed Consent Statement
Not applicable.
Data Availability Statement
The datasets generated during and/or analyzed in this study are available from the corresponding author upon reasonable request.
Acknowledgments
The authors are grateful to the Institute of Materials Research and Engineering (IMRE) and the Agency of Science, Technology and Research (A*STAR) for support in conducting the research work.
Conflicts of Interest
The authors declare no conflicts of interest. The funders had no role in the design of the study; in the collection, analyses, or interpretation of data; in the writing of the manuscript; or in the decision to publish the results.
References
- Radetsky, L.C. LED and HID Horticultural Luminaire Testing Report; Technical Report; Lighting Research Center, Rensselaer Polytechnic Institute: Troy, NY, USA, 2018. [Google Scholar]
- Kozai, T.; Fujiwara, K.; Runkle, E.S. LED Lighting for Urban Agriculture; Springer: Singapore, 2016. [Google Scholar] [CrossRef]
- Bugbee, B. Economics of LED lighting. In Light Emitting Diodes for Agriculture: Smart Lighting; Dutta Gupta, S., Ed.; Springer: Singapore, 2017; pp. 81–99. [Google Scholar] [CrossRef]
- Mayhoub, M.S.; Carter, D.J. Towards hybrid lighting systems: A review. Light. Res. Technol. 2010, 42, 51–71. [Google Scholar] [CrossRef]
- Bugbee, B. Toward an optimal spectral quality for plant growth and development: The importance of radiation capture. Acta Hortic. 2016, 1134, 1–12. [Google Scholar] [CrossRef]
- Snowden, M.C.; Cope, K.R.; Bugbee, B. Sensitivity of Seven Diverse Species to Blue and Green Light: Interactions with Photon Flux. PLoS ONE 2016, 11, e0163121. [Google Scholar] [CrossRef] [PubMed]
- Pattison, P.M.; Tsao, J.Y.; Brainard, G.C.; Bugbee, B. LEDs for photons, physiology and food. Nature 2018, 563, 493–500. [Google Scholar] [CrossRef] [PubMed]
- Bantis, F.; Koukounaras, A. Impact of Light on Horticultural Crops. Agriculture 2023, 13, 828. [Google Scholar] [CrossRef]
- Al Murad, M.; Razi, K.; Jeong, B.R.; Samy, P.M.A.; Muneer, S. Light Emitting Diodes (LEDs) as Agricultural Lighting: Impact and Its Potential on Improving Physiology, Flowering, and Secondary Metabolites of Crops. Sustainability 2021, 13, 1985. [Google Scholar] [CrossRef]
- Hasan, M.M.; Bashir, T.; Ghosh, R.; Lee, S.K.; Bae, H. An Overview of LEDs’ Effects on the Production of Bioactive Compounds and Crop Quality. Molecules 2017, 22, 1420. [Google Scholar] [CrossRef]
- D’Souza, C.; Yuk, H.G.; Khoo, G.H.; Zhou, W. Application of Light-Emitting Diodes in Food Production, Postharvest Preservation, and Microbiological Food Safety. Compr. Rev. Food Sci. Food Saf. 2015, 14, 719–740. [Google Scholar] [CrossRef]
- Motogaito, A.; Hashimoto, N.; Hiramatsu, K.; Murakami, K. Study of Plant Cultivation Using a Light-Emitting Diode Illumination System to Control the Spectral Irradiance Distribution. Opt. Photonics J. 2017, 7, 101–108. [Google Scholar] [CrossRef]
- Li, Z.; Wakao, S.; Fischer, B.B.; Niyogi, K.K. Sensing and Responding to Excess Light. Annu. Rev. Plant Biol. 2009, 60, 239–260. [Google Scholar] [CrossRef]
- Massa, G.D.; Kim, H.H.; Wheeler, R.M.; Mitchell, C.A. Plant Productivity in Response to LED Lighting. Hortscience Horts 2008, 43, 1951–1956. [Google Scholar] [CrossRef]
- Sarropoulou, V.; Sperdouli, I.; Adamakis, I.D.; Grigoriadou, K. The use of different LEDs wavelength and light intensities for in vitro proliferation of cherry rootstock: Influence on photosynthesis and photomorphogenesis. Plant Cell Tissue Organ Cult. 2023, 152, 317–330. [Google Scholar] [CrossRef]
- Livadariu, O.; Maximilian, C.; Rahmanifar, B.; Cornea, C.P. LED Technology Applied to Plant Development for Promoting the Accumulation of Bioactive Compounds: A Review. Plants 2023, 12, 1075. [Google Scholar] [CrossRef] [PubMed]
- Rahman, M.M.; Field, D.L.; Ahmed, S.M.; Hasan, M.T.; Basher, M.K.; Alameh, K. LED Illumination for High-Quality High-Yield Crop Growth in Protected Cropping Environments. Plants 2021, 10, 2470. [Google Scholar] [CrossRef] [PubMed]
- Wong, C.E.; Teo, Z.W.N.; Shen, L.; Yu, H. Seeing the lights for leafy greens in indoor vertical farming. Trends Food Sci. Technol. 2020, 106, 48–63. [Google Scholar] [CrossRef]
- Wu, B.S.; MacPherson, S.; Lefsrud, M. Filtering Light-Emitting Diodes to Investigate Amber and Red Spectral Effects on Lettuce Growth. Plants 2021, 10, 1075. [Google Scholar] [CrossRef]
- Al-Kodmany, K. The Vertical Farm: A Review of Developments and Implications for the Vertical City. Buildings 2018, 8, 24. [Google Scholar] [CrossRef]
- Navigant Consulting, Inc.; Yamada, M.; Penning, J.; Schober, S.; Lee, K.; Elliott, C. Energy Savings Forecast of Solid-State Lighting in General Illumination Applications. Technical Report; U.S. Department of Energy: Washington, DC, USA, 2019. [Google Scholar]
- Schubert, E.F.; Kim, J.K. Solid-State Light Sources Getting Smart. Science 2005, 308, 1274–1278. [Google Scholar] [CrossRef]
- Tsao, J.Y.; Crawford, M.H.; Coltrin, M.E.; Fischer, A.J.; Koleske, D.D.; Subramania, G.S.; Wang, G.T.; Wierer, J.J.; Karlicek, R.F., Jr. Toward Smart and Ultra-efficient Solid-State Lighting. Adv. Opt. Mater. 2014, 2, 809–836. [Google Scholar] [CrossRef]
- Rajib, M.; Ray, K.; Mazumdar, S. A Low-Cost, Wide-Range, CCT-Tunable, Variable-Illuminance LED Lighting System. LEUKOS 2020, 16, 157–176. [Google Scholar] [CrossRef]
- Hrbac, R.; Kolar, V.; Novak, T.; Prokop, L.; Vanus, J. Low-cost solution of LED driving, designed for tunable white lighting systems. In Proceedings of the 15th IFAC Conference on Programmable Devices and Embedded Systems PDeS, IFAC-PapersOnLine. Ostrava, Czech Republic, 23–25 May 2018; Volume 51, pp. 396–401. [Google Scholar] [CrossRef]
- Murdoch, M.J. Dynamic color control in multiprimary tunable LED lighting systems. J. Soc. Inf. Disp. 2019, 27, 570–580. [Google Scholar] [CrossRef]
- Chew, I.; Kalavally, V.; Tan, C.P.; Parkkinen, J. A Spectrally Tunable Smart LED Lighting System With Closed-Loop Control. IEEE Sensors J. 2016, 16, 4452–4459. [Google Scholar] [CrossRef]
- Kozai, T.; Niu, G.; Takagaki, M. Plant Factory: An Indoor Vertical Farming System for Efficient Quality Food Production, 2nd ed.; Academic Press: Cambridge, MA, USA, 2020. [Google Scholar] [CrossRef]
- Sheibani, F.; Bourget, M.; Morrow, R.C.; Mitchell, C.A. Close-canopy lighting, an effective energy-saving strategy for overhead sole-source LED lighting in indoor farming. Front. Plant Sci. 2023, 14, 1215919. [Google Scholar] [CrossRef]
- Meng, Q.; Runkle, E.S. Blue Photons from Broad-Spectrum LEDs Control Growth, Morphology, and Coloration of Indoor Hydroponic Red-Leaf Lettuce. Plants 2023, 12, 1127. [Google Scholar] [CrossRef] [PubMed]
- Hooks, T.; Sun, L.; Kong, Y.; Masabni, J.; Niu, G. Adding UVA and Far-Red Light to White LED Affects Growth, Morphology, and Phytochemicals of Indoor-Grown Microgreens. Sustainability 2022, 14, 8552. [Google Scholar] [CrossRef]
- Cowden, R.J.; Markussen, B.; Ghaley, B.B.; Henriksen, C.B. The Effects of Light Spectrum and Intensity, Seeding Density, and Fertilization on Biomass, Morphology, and Resource Use Efficiency in Three Species of Brassicaceae Microgreens. Plants 2024, 13, 124. [Google Scholar] [CrossRef] [PubMed]
- Sgarbi, E.; Santunione, G.; Barbieri, F.; Montorsi, M.; Lancellotti, I.; Barbieri, L. Effects of LED Lights and New Long-Term-Release Fertilizers on Lettuce Growth: A Contribution for Sustainable Horticulture. Horticulturae 2023, 9, 404. [Google Scholar] [CrossRef]
- Villard, R.G. Uniform Intensity LED Lighting System. U.S. Patent 7976187B2, 12 July 2011. [Google Scholar]
- Moreno, I.; Muñoz, J.; Ivanov, R. Uniform illumination of distant targets using a spherical light-emitting diode array. Opt. Eng. 2007, 46, 033001. [Google Scholar] [CrossRef]
- Moreno, I.; Tzonchev, R.I. Effects on illumination uniformity due to dilution on arrays of LEDs. In Proceedings of the Nonimaging Optics and Efficient Illumination Systems, Denver, CO, USA, 2–4 August 2004; Winston, R., Koshel, R.J., Eds.; International Society for Optics and Photonics, SPIE: National Harbor, MD, USA, 2004; Volume 5529, pp. 268–275. [Google Scholar] [CrossRef]
- Yang, H.; Bergmans, J.W.M.; Schenk, T.C.W.; Linnartz, J.P.M.G.; Rietman, R. Uniform illumination rendering using an array of LEDs: A signal processing perspective. IEEE Trans. Signal Process. 2009, 57, 1044–1057. [Google Scholar] [CrossRef]
- Hao, H.G.; Zhang, D.D.; Tang, S. Analysis of the LED Lamp Arrangement for Uniformity of Illumination in Indoor VLC System. J. Opt. Soc. Korea 2014, 18, 663–671. [Google Scholar] [CrossRef]
- Klase, N.P.; Duong, D.T.; Radkov, E.; Winberg, P.N. Plant Growth Lighting Device and Method. WO2012154275A1, 21 June 2012. [Google Scholar]
- Stragnola, S.V. Horticulture Lighting System for Providing Uniform Illumination from an Elevated Height. U.S. Patent 6042250A, 28 March 2000. [Google Scholar]
- Pickard, P.K. Lighting Device with Low Glare and High Light Level Uniformity. WO/2011/037877, 17 February 2011. [Google Scholar]
- Qin, Z.; Wang, K.; Chen, F.; Luo, X.; Liu, S. Analysis of condition for uniform lighting generated by array of light emitting diodes with large view angle. Opt. Express 2010, 18, 17460–17476. [Google Scholar] [CrossRef] [PubMed]
- Adams, S.P.; Tidd, M.M.; Heiner, J.J.; Carpenter, D.M. Method and Apparatus for Horticultural Lighting and Associated Optic Systems. WO/2018/058054,, 1 March 2018. [Google Scholar]
- AuYeung, D.S. LED Light Assembly with Three-Part Lens. U.S. Patent 9212803B2, 15 December 2015. [Google Scholar]
- Yorio, N.; Thosteson, E.; Soler, R.; Sullivan, S.; Balestracci, E.; Sun, W.; LeClair, R. Grow Lighting and Agricultural Systems and Methods. U.S. Patent 20160360712A1, 15 December 2016. [Google Scholar]
- Jiang, J.; To, S.; Lee, W.; Cheung, B. Optical design of a freeform TIR lens for LED streetlight. Optik 2010, 121, 1761–1765. [Google Scholar] [CrossRef]
- Kuo, C.H.; Wu, W.H.; Hsiao, W.T.; Huang, K.C. The Multi-shadow Analysis of LED Secondary Optics. Phys. Procedia 2011, 19, 233–238. [Google Scholar] [CrossRef]
- Balázs, L.; Dombi, Z.; Csambalik, L.; Sipos, L. Characterizing the Spatial Uniformity of Light Intensity and Spectrum for Indoor Crop Production. Horticulturae 2022, 8, 644. [Google Scholar] [CrossRef]
- Dougher, T.A.O.; Bugbee, B. Evidence for yellow light suppression of lettuce growth. Photochem. Photobiol. 2001, 72, 208–212. [Google Scholar] [CrossRef]
Figure 1.
Schematic of the designed LED panel with reflectors and lenses.

Figure 2.
(a) A dome lens designed to widen the beams of LED. The lens’ refractive index is 1.51. (b,c) are single SST-10-B LED beams on a 24 cm × 24 cm illuminated area 10 cm away from the LED, when the LED is without (at a 120° beam angle) and with the dome lens (at a 160° beam angle), respectively.

Figure 3.
(a) LED panel fabricated with a total size of 88 cm × 54 cm, formed with eight pieces of 22 cm × 27 cm PCBs. (b) 3D drawing of the LED panels with 15 cm high mirrors installed. (c) LED panel under characterization by the home-built LED luminaire characterization stage.
Figure 3.
(a) LED panel fabricated with a total size of 88 cm × 54 cm, formed with eight pieces of 22 cm × 27 cm PCBs. (b) 3D drawing of the LED panels with 15 cm high mirrors installed. (c) LED panel under characterization by the home-built LED luminaire characterization stage.

Figure 4.
Designed LED panel with 16 blue LEDs and 16 red LEDs as a 4 × 4 LED unit array, each unit comprising 1 blue LED and 1 red LED. The yellow frame represents reflectors (with 100% reflectance) at the sides of the LED panel.
Figure 4.
Designed LED panel with 16 blue LEDs and 16 red LEDs as a 4 × 4 LED unit array, each unit comprising 1 blue LED and 1 red LED. The yellow frame represents reflectors (with 100% reflectance) at the sides of the LED panel.

Figure 5.
(a) Light uniformities and (b) average PFDs of the 4 × 4 LED panel for blue and red LEDs with and without using our solution, when the LED panel is at distances of 3, 4, 5, 10 and 15 cm to plants, respectively. The LEDs are Luminus SST-10-B blue LEDs and Osram GH CSSRM4.24 red LEDs at a 120° beam angle. The results are based on simulations in Table 2.

Figure 6.
Light uniformities of blue and red LEDs for 2 × 2, 3 × 2, 4 × 4 and 5 × 5 LED arrays on a 48 cm × 48 cm LED panel. The light uniformity is analyzed on an illuminated area of 48 cm × 48 cm below the LED panel when the LED panel is 5, 10, and 15 cm from the plants. The LEDs are Luminus SST-10-B blue LEDs and Osram GH CSSRM4.24 red LEDs at a 120° beam angle.

Figure 7.
The LED panel’s PFDs at wavelengths of (a) 425, (b) 495, (c) 595, (d) 660 nm, and white LEDs at color temperatures of (e) 3000 K and (f) 5700 K. The LEDs are characterized within an area of 93 cm × 54 cm, 15 cm distance from the LEDs to the characterization plane when four 15 cm high mirrors are installed along the sides of the LED panel.


Figure 8.
(a) Characterized PFD output of 660 nm LEDs on the fabricated LED panel at various percentage settings. (b) Electric power taken of the 660 nm LEDs at different photon fluxes.
Figure 8.
(a) Characterized PFD output of 660 nm LEDs on the fabricated LED panel at various percentage settings. (b) Electric power taken of the 660 nm LEDs at different photon fluxes.


Table 1.
LEDs (all at a beam angle of 120°) arranged in a six-wavelength LED panel.
| LED Type | LED Manufacturer | Part Number | LED Driving Current (mA) | Voltage under the Driving Current at 25 °C Junction Temperature (V) | Photon Flux of Each LED (mol/s) | LEDs Arranged on Each 22 cm × 27 cm PCB | Designed Maximum PFD on an Illuminated Area at 25 °C Junction Temperature (mol/m/s) |
|---|---|---|---|---|---|---|---|
| 425 nm | Lumileds | L1CU-VLT1000000000 | 350 | 2.915 | 1.74 | 3 × 4 | 352.12 |
| 490 nm | Osram | GV QSSPA1.13-JZKZ-27-1 | 350 | 2.93 | 1.84 | 4 × 4 | 494.99 |
| 595 nm | Cree | XBDAMB-00-0000-000000703 | 350 | 2.17 | 0.70 | 4 × 4 | 189.43 |
| 660 nm | Osram | GH CSSRM4.24-V7V9-1-1-700-R33 | 350 | 1.87 | 2.93 | 3 × 3 | 444.17 |
| 3000 K | Luminus | SST-20-W30H-A120-J3302 | 350 | 2.812 | 2.12 | 3 × 4 | 429.19 |
| 5700 K | Luminus | SST-20-WDS-A120-L3572 | 350 | 2.83 | 2.48 | 3 × 3 | 376.40 |
Table 2.
Simulations of a 4 × 4 LED array on a 48 cm × 48 cm sized LED panel. (a) shows the light uniformities of blue LEDs and (b) shows the light uniformities of red LEDs, when the LED panel is at a distance of 3, 4, 5, 10, and 15 cm to a plant area of 48 cm × 48 cm, respectively. The LEDs are Luminus SST-10-B blue LEDs and Osram GH CSSRM4.24 red LEDs at a 120° beam angle. Our solution means there are four reflectors at the sides of the panel whose height equals the distance from the LED panel to the plants, and there is a dome lens for each LED.
| (a) | ||
|---|---|---|
| Condition | 16 Blue LEDs without Our Solution | 16 Blue LEDs with Our Solution |
| Lighting at 3 cm from LED panel |  Uniformity = 0.09 Uniformity = 0.09 |  Uniformity = 0.33 Uniformity = 0.33 |
| Lighting at 4 cm from LED panel |  Uniformity = 0.11 Uniformity = 0.11 |  Uniformity = 0.71 Uniformity = 0.71 |
| Lighting at 5 cm from LED panel |  Uniformity = 0.20 Uniformity = 0.20 |  Uniformity = 0.86 Uniformity = 0.86 |
| Lighting at 10 cm from LED panel |  Uniformity = 0.30 Uniformity = 0.30 |  Uniformity = 0.87 Uniformity = 0.87 |
| Lighting at 15 cm from LED panel |  Uniformity = 0.36 Uniformity = 0.36 |  Uniformity = 0.87 Uniformity = 0.87 |
| (b) | ||
| Condition | 16 Red LEDs without Our Solution | 16 Red LEDs with Our Solution |
| Lighting at 3 cm from LED panel |  Uniformity = 0.04 Uniformity = 0.04 |  Uniformity = 0.15 Uniformity = 0.15 |
| Lighting at 4 cm from LED panel |  Uniformity = 0.07 Uniformity = 0.07 |  Uniformity = 0.39 Uniformity = 0.39 |
| Lighting at 5 cm from LED panel |  Uniformity = 0.12 Uniformity = 0.12 |  Uniformity = 0.70 Uniformity = 0.70 |
| Lighting at 10 cm from LED panel |  Uniformity = 0.27 Uniformity = 0.27 |  Uniformity = 0.82 Uniformity = 0.82 |
| Lighting at 15 cm from LED panel |  Uniformity = 0.30 Uniformity = 0.30 |  Uniformity = 0.84 Uniformity = 0.84 |
Table 3.
Color images of the LED lighting on the plants 5 cm away from the 4 × 4 LED panel, when only blue LEDs are on, only red LEDs are on, and when both wavelengths of LEDs are on. This shows that with our solution, even at a 5 cm distance, the lighting on plants is uniform and the two wavelengths are well mixed. The LEDs are Luminus SST-10-B blue LEDs and Osram GH CSSRM4.24 red LEDs at a 120° beam angle.
| Condition | Blue LED Only | Red LED Only | Both Blue and Red LED Are on |
|---|---|---|---|
| Without our solution at 5 cm distance from LED panel to plants |  |  |  |
| With our solution at 5 cm distance from LED panel to plants |  |  |  |
Table 4.
Simulated irradiance distributions of the 4 × 4 LED panel, when blue and red LEDs are 20 cm distance away from the plants and the reflectors are 15 cm high. The LEDs are Luminus SST-10-B blue LEDs and Osram GH CSSRM4.24 red LEDs at a 120° beam angle. The whole illuminated area is 48 cm × 48 cm, and the area depicted by red line boxes is 35 cm × 35 cm.
| Blue Light at 20 cm Distance From | Red Light at 20 cm Distance From | |
|---|---|---|
| LED Panel to Plants | LED Panel to Plants | |
| Without our solution |  Uniformity = 0.39 Uniformity = 0.39 |  Uniformity = 0.36 Uniformity = 0.36 |
| Our solution with 15 cm reflectors |  Uniformity = 0.28 Uniformity = 0.28 |  Uniformity = 0.28 Uniformity = 0.28 |
Table 5.
Comparisons of characterized PFDs and uniformities between the LED panel’s design and simulations.
Table 5.
Comparisons of characterized PFDs and uniformities between the LED panel’s design and simulations.
| LED Type | Uniformity Simulated (Based on Beam Profile of 3000 K LED) | Uniformity Characterized | Deviation between Simulated and Characterized Uniformity (%) | Designed Maximum PFD on the Illuminated Area at 25 °C Junction Temperature (mol/m/s) | Characterized Maximum PFD on the Illuminated Area (mol/m/s) | Deviation between Designed and Characterized PFD (%) |
|---|---|---|---|---|---|---|
| 425 nm | 0.925 | 0.92 | −0.54 | 352.12 | 363.21 | 3.15 |
| 490 nm | 0.935 | 0.94 | 0.53 | 494.99 | 416.84 | −15.79 |
| 595 nm | 0.928 | 0.89 | −4.09 | 189.43 | 151.61 | −19.97 |
| 660 nm | 0.928 | 0.93 | 0.22 | 444.17 | 426.74 | −3.92 |
| 3000 K | 0.924 | 0.93 | 0.65 | 429.19 | 395.63 | −7.82 |
| 5700 K | 0.925 | 0.94 | 1.62 | 376.40 | 361.27 | −4.02 |
Disclaimer/Publisher’s Note: The statements, opinions and data contained in all publications are solely those of the individual author(s) and contributor(s) and not of MDPI and/or the editor(s). MDPI and/or the editor(s) disclaim responsibility for any injury to people or property resulting from any ideas, methods, instructions or products referred to in the content. |
© 2024 by the authors. Licensee MDPI, Basel, Switzerland. This article is an open access article distributed under the terms and conditions of the Creative Commons Attribution (CC BY) license (https://creativecommons.org/licenses/by/4.0/).
Share and Cite
MDPI and ACS Style
Wong, T.I.; Zhou, X. Uniform Lighting of High-Power LEDs at a Short Distance to Plants for Energy-Saving and High-Density Indoor Farming. Photonics 2024, 11, 394. https://doi.org/10.3390/photonics11050394
AMA Style
Wong TI, Zhou X. Uniform Lighting of High-Power LEDs at a Short Distance to Plants for Energy-Saving and High-Density Indoor Farming. Photonics. 2024; 11(5):394. https://doi.org/10.3390/photonics11050394
Chicago/Turabian StyleWong, Ten It, and Xiaodong Zhou. 2024. "Uniform Lighting of High-Power LEDs at a Short Distance to Plants for Energy-Saving and High-Density Indoor Farming" Photonics 11, no. 5: 394. https://doi.org/10.3390/photonics11050394
Note that from the first issue of 2016, this journal uses article numbers instead of page numbers. See further details here.