1. Introduction
UV wireless optical communication technology has garnered significant attention for its potential to offer large transmission bandwidths and resistance to electromagnetic interference. UV communication operates within the “blind to daylight” band (200–280 nm), demonstrating robust performance in environments with strong solar background radiation, overcoming challenges posed by background light noise in visible and infrared bands. Previous studies have explored NLOS visible light communication (VLC) [
1,
2,
3], but UV communication, with its shorter wavelength and stronger scattering capability, presents advantages for scatter communication, particularly in NLOS scenarios [
4,
5,
6].
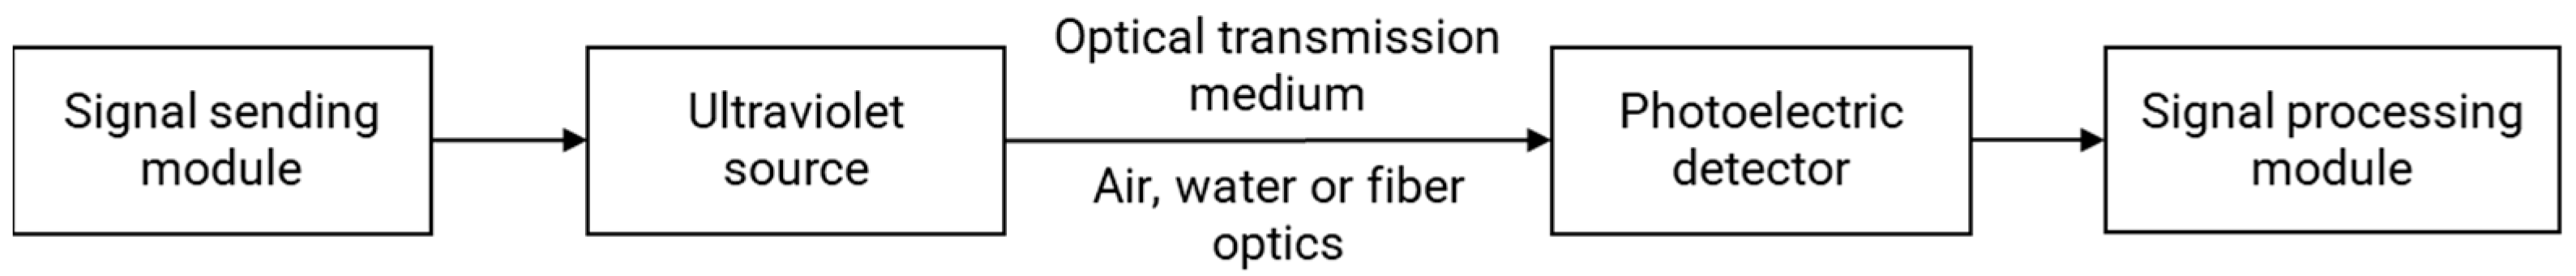
A typical UV communication system consists of several key components, including the signal transmission module, UV light source, optical transmission medium, photodetector, and signal processing module. In the signal transmission module, the signal to be transmitted is converted into UV light signals by the light source and transmitted through the optical transmission medium to the receiving end. The photodetector at the receiving end converts the UV light signals into electrical signals, which are then transmitted to the signal processing module. Finally, the information is recovered through processing.
Figure 1 shows a flow chart of the UV communication system.
In the study of ultraviolet communication, the analysis of scattering models is crucial. UV NLOS scatter UV primarily relies on single scattering, with the single scattering channel model being utilized to approximate the path loss of NLOS channels [
7]. Several studies have investigated link gain simulations of UV scattering channel models using random geometric frameworks and Monte Carlo methods [
7,
8,
9]. In recent years, researchers have conducted experimental studies on short-range NLOS scattering channel models [
10]. Additionally, experimental work on the characteristics of UV NLOS scattering channels includes turbulence channel analysis [
11,
12], UV photon counting detection [
13], and research on long-distance channel characteristics [
14].
In recent years, with the development of LEDs, there has been widespread attention towards the use of UV LEDs for ultraviolet NLOS scatter communication [
11,
15,
16]. Extensive research has been conducted on both the analysis and experimentation of UV NLOS optical channels [
15,
16,
17,
18,
19,
20]. Experimental communication systems have been published, demonstrating data transmission rates of 2 kbps over a distance of 100 m [
21]. Real-time systems based on Reed–Solomon (RS)/Low-Density Parity-Check (LDPC) codes have achieved data rates exceeding 2.4 kbps over LOS transmission links of over 90 m and experimental tests of over 500 kbps over NLOS transmission links of over 50 m [
22,
23,
24]. In the field of UV communication, challenges still exist regarding OOK modulation. OOK modulation, as a commonly used modulation technique, requires high optical energy to ensure reliable detection, making its performance susceptible to limitations in low signal-to-noise ratio environments. This leads to a system’s dependency on high detection power and transmission efficiency issues.
In addition to OOK being the primary modulation scheme, other modulation techniques such as PPM, BPSK, and DPIM are also employed in UV communication. The error rates of uncoded OOK and MPPM have been calculated. These models include Gaussian noise models, suitable for scenarios dominated by thermal noise, and Poisson noise models, applicable for detection based on photon counting [
25]. Furthermore, more robust variable symbol length modulation schemes, including DPIM, DH-PIM, and DPPM, have been investigated, and their BER performance has been analyzed and calculated [
26,
27]. The binary phase shift keying (BPSK) subcarrier intensity modulation technique has been proposed and compared with OOK and PPM modulation formats. Simulation results demonstrate that this method outperforms OOK and PPM significantly in terms of BER performance, data rate, and transmission power [
28]. In summary, PPM exhibits a higher energy efficiency than OOK, DPIM modulation performs better than OOK in terms of BER but not as well as PPM, and BPSK outperforms OOK and PPM in terms of BER performance and data rate. BFSK demonstrates stronger resistance to multipath interference and performs better in theoretical BER performance.
The UV communication system based on 4FSK modulation achieved a communication rate of 1.2 kbps. Under LOS conditions, communication was established up to 300 m, while under NLOS conditions, it reached 80 m. The optimal BER was less than 0.4 and 0.6 when the SNR exceeded 7, and less than 10
−5 when the SNR exceeded 20 [
29]. Existing UV communication systems employing frequency modulation often rely on detector waveform detection or pulse laser measurement for signal recovery. This imposes stringent requirements on the detection of light, limiting its performance in practical applications. Therefore, seeking a more efficient modulation and demodulation scheme, as well as one that can adapt to NLOS scenarios, has become an important direction in current research on UV communication systems. To address this, we propose a novel UV weak light communication scheme using fourth-order frequency-shift keying (4FSK) modulation and photon pulse decoding algorithms. This approach utilizes a low-pressure mercury lamp emitting light at 254 nm for transmission, modulated via 4FSK. A photomultiplier tube (PMT) acts as the detector, with signal processing algorithms based on discrete-time Poisson distribution channel models and signal correlation detection. These algorithms enable the demodulation and recovery of weak signals, reducing the required detection light energy. The adoption of 4FSK modulation enhances transmission rates, overcoming the low-rate issue associated with mercury lamps. Computational simulations evaluate system performance, followed by hardware system development using FPGA for implementing the frequency modulation photon decoding algorithm. Real-time outdoor communication experiments validate the approach’s effectiveness.
In the second section, we analyze the single-scattering model of ultraviolet NLOS communication, examine the probability density function of discrete Poisson channels, and present the structural diagram of the ultraviolet communication system. The third section delves into the principles governing signal transmission and processing within the transmitter–receiver setup. Computational simulations and experimental results of the hardware system are showcased in the fourth section. Finally, a comprehensive summary of this article is provided in the fifth section.
3. Principles of Signal Transmission and Processing
3.1. Carrier Frequency Analysis
In the present study, a 4FSK modulation scheme was employed. During the process of carrier frequency selection, comprehensive theoretical analysis and derivation were conducted by the researchers. The influence of carrier frequencies on system transmission performance and the relationship between frequency selection and symbol transmission rate were rigorously considered.
On the one hand, given the uneven modulation frequency characteristics of the mercury lamp, minimizing the interval between carrier frequencies for symbol modulation is desirable. This optimization ensures uniform emission flatness across different carrier frequencies, thereby maximizing spectral resource utilization.
On the other hand, the selected frequencies must satisfy orthogonality within symbol intervals. Assuming a single symbol transmission period of
Ts, orthogonality among sub-carriers within Ts is essential, with orthogonal carrier frequencies adhering to the following relationship:
Within the interval from 0 to
Ts, the frequencies
fi and
fj exhibit orthogonality. The derivation of the minimum sub-carrier spacing yields
Hence, in scenarios where the symbol period is Ts, ensuring carrier frequency differences are integer multiples of 1/Ts guarantees orthogonality within the Ts interval.
3.2. Analysis of Transmission Rate and Transmission Bandwidth
Based on the above orthogonality principle, the minimum frequency interval between frequencies is 1/
Ts. The emission frequency of the mercury lamp exhibits high flatness within the 40 to 60 kHz range, encompassing a bandwidth of 20 kHz. When the symbol rate is
R, adhering to the relationship
Ts = 1/
R, the maximum number of carrier frequencies within this band is limited to 20
k/
R. Therefore, the width of each symbol, denoted as
W, which represents the mean number of bits, can be expressed as
The system transmission rate, denoted as
S, can be represented as
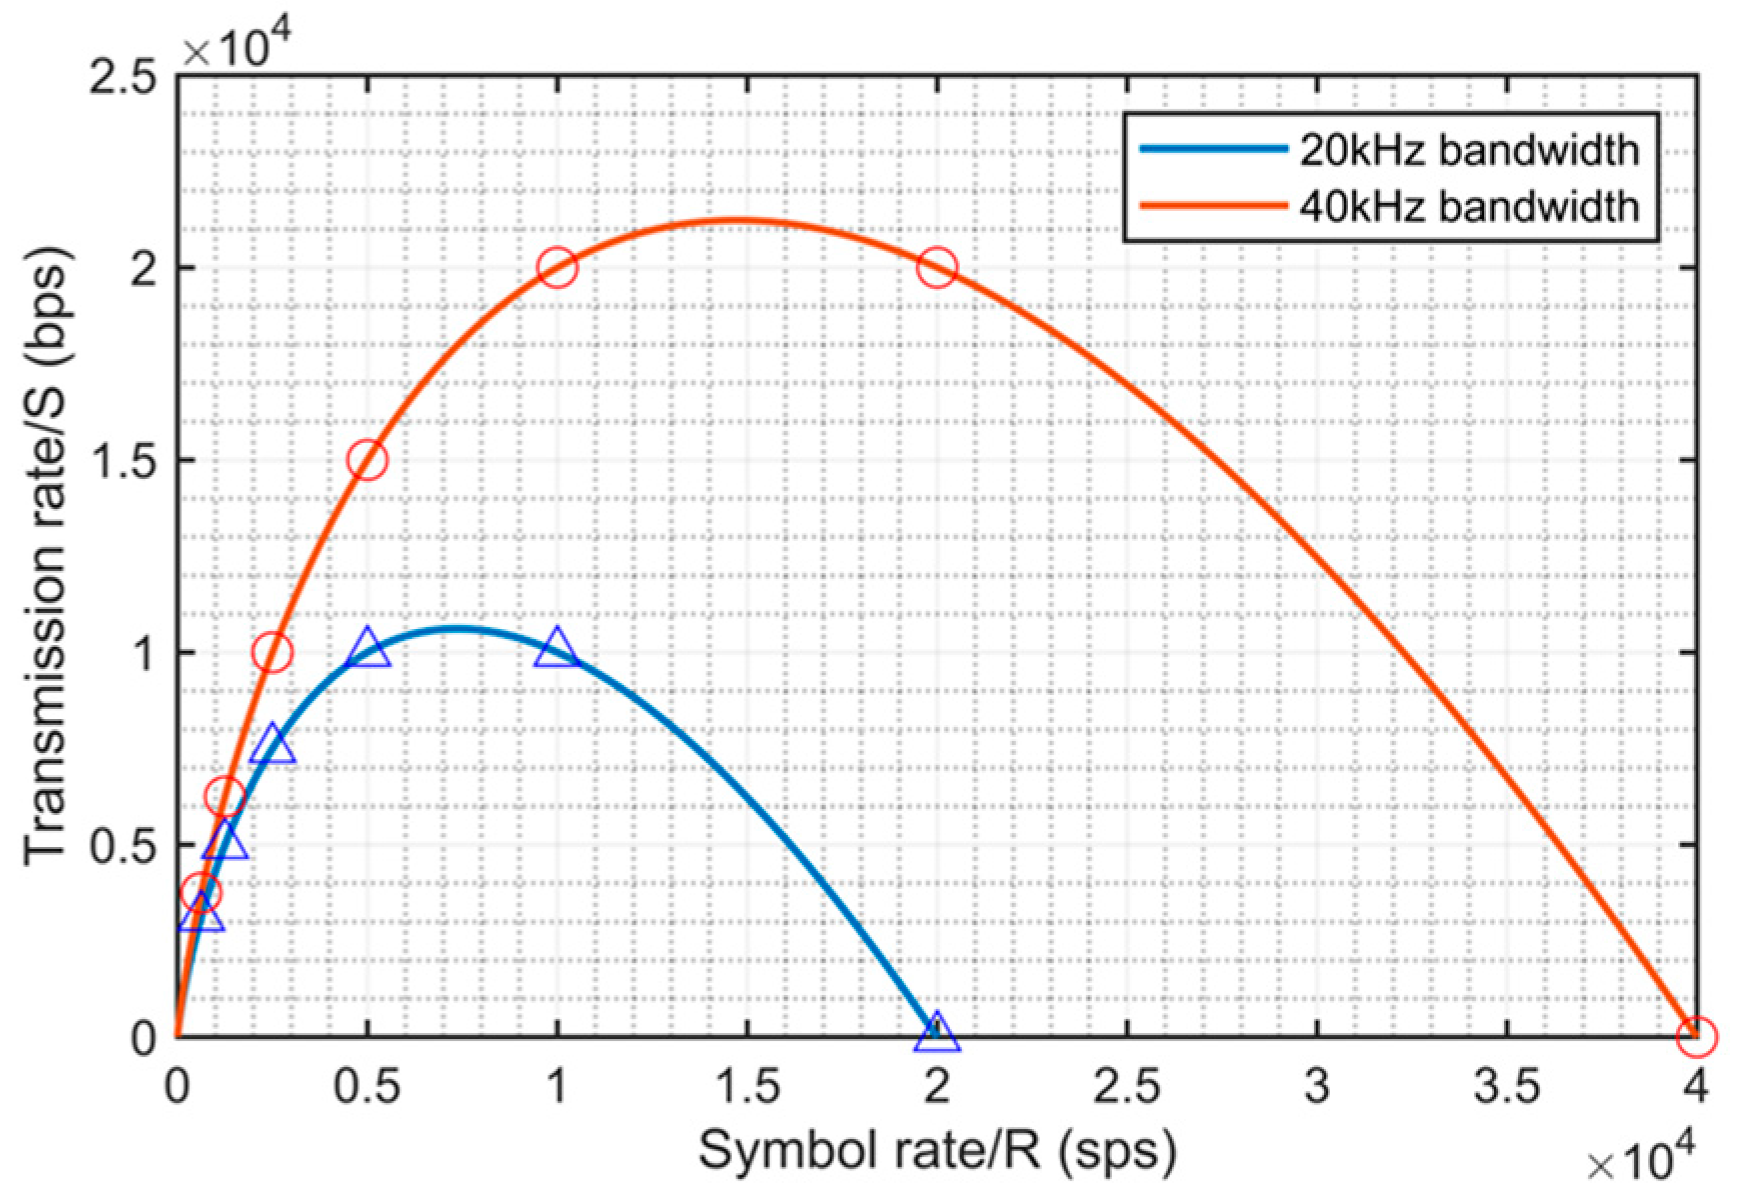
Figure 3 illustrates the correlation between symbol rate and transmission rate concerning bandwidths of 20 kHz and 40 kHz. The red circles and blue triangles signify admissible values of
R for integer symbol widths. It is observed that within a 20 kHz bandwidth, the maximal achievable transmission rate stands at 10 kbps, while a bandwidth of 40 kHz supports a maximum rate of 20 kbps. Larger symbol widths entail heightened computational demands for decoding and may induce waveform distortions during modulation, potentially augmenting the likelihood of decoding inaccuracies. To ensure the stability of signal transmission, critical parameters have been judiciously determined. Specifically, the communication system parameters encompass a symbol rate of 2.5 ksps alongside a symbol width of 2 bits, thereby yielding an effective transmission rate of 5 kbps. Concurrently, the research team has meticulously selected carrier frequencies set at 40 kHz, 45 kHz, 50 kHz, and 55 kHz to serve as the pivotal components of the system’s communication infrastructure.
3.3. Photon Pulse Counting
The investigation focused on the implementation of photon pulse counting algorithms using the voltage signals output by the ADC, which are processed from photon pulses by the PMT and secondary operational amplifier circuits. To accurately extract valid information and ensure a low bit error rate, comprehensive analyses were conducted to select a voltage threshold Vth in the FPGA program. The voltage threshold selection involved considering multiple factors, including ambient light noise and signal intensity, to optimize the identification of photon pulses. The selection of the threshold value is intricately linked to the bit width of the utilized ADC. Employing a 12-bit ADC with a typical voltage input of 2.2 V, we established 1100 as the baseline reference Vth. Additionally, opting for a threshold that is excessively high can lead to a diminished count of valid photons, thereby diminishing the synchronization probability. Conversely, selecting a threshold that is too low can exacerbate the influence of environmental optical noise, resulting in a discordance in the frequency characteristics of the receiving program. Experiments were conducted with Vth set at 900, 1000, 1100, 1200, and 1300, respectively. The findings revealed that for a Vth of 1200, the system attained the highest synchronization probability while concurrently maintaining a relatively low bit error rate. This threshold facilitated the assessment of signal strength, thereby discerning the presence or absence of photon pulses during the sampling time. Exceeding the threshold indicated the presence of one or more photons during that sampling period; conversely, its non-exceedance indicated their absence.
In order to effectively harness photon pulse information and ensure the precision of subsequent data decoding, a strategy was employed wherein the symbol slicing frequency was set at eight times the carrier frequency
fc. This configuration elevates data processing accuracy from a single symbol length to 1/8 of a symbol length, thereby facilitating more precise clock signal synchronization during decoding. The time for a single symbol slice can be mathematically expressed as
Count the number of pulses within each time slot and update the pulse summation term with
Tc as the time unit:
where
V(
t) represents the voltage value at time
t, and
Vth represents the decision voltage threshold.
N(
Tc) counts the number of pulses corresponding to the carrier frequency
fc within the symbol slicing time
Tc.
3.4. Frequency Correlation Detection
The approach to frequency correlation detection involves cross-correlating the data derived from photon pulse counting with the frequency characteristic values at the receiver end. Within the FPGA decoding program, a design consisting of four frequency detection channels, each corresponding to a carrier frequency, is implemented. The processed data from photon pulse counting form an array
sc, which comprises
k elements. The value of
k is determined by the equation
sc, which can be expressed as
where
sc represents an array composed of pulse counts
N at time
t, consisting of
k elements, and
c denotes the index of carrier frequency
f.
sc is cross-correlated with the carrier frequency
fc characteristic values to obtain the cross-correlation result
Pc(
t):
where
sc(
i,
t) represents the
ith element of the array
sc at time
t;
α(
i) denotes the
ith element of the frequency characteristic array
α;
k is the length of both arrays; and
Pc(
t) signifies the cross-correlation result between the pulse count of carrier frequency
fc at time
t and the frequency characteristic values.
3.5. Implementation of Multi-Threaded Clock Synchronization
To overcome the challenge of clock synchronization in weak light communication, a methodology is employed whereby the
Pc(
t) array from the preceding step undergoes low-pass filtering to generate the
yc(
t) data sequence. This sequence is then matched with the symbol synchronization header at the receiver, facilitating precise clock synchronization. Specifically, researchers utilize the local link header at the receiver end as the reference signal, conducting matching operations with the received data sequence. Through second-order correlation solving, accurate determination of the transmission frame’s starting position is achieved, effectively addressing timing synchronization issues during the transmission process.
The investigators integrate the envelope outputs
y1,
y2,
y3, and
y4 from the four frequency channels into a matrix
Y, where
L denotes the count of local link symbol synchronization headers. This methodology effectively harnesses the frequency characteristics of photon pulses, enabling precise control of clock synchronization in weak light communication. The local symbol synchronization header is represented as
where
β comprises four columns,
β1,
β2,
β3, and
β4, corresponding to the link frame headers of four carrier frequencies. Each column consists of L data points. Subsequently, the elements of the two matrices are calculated to obtain
z(
t):
Find the time
tmax corresponding to the maximum matching degree:
This formula represents the time point corresponding to the highest correlation degree, z(t), providing theoretical support for solving the frame synchronization problem in frequency-modulated communication systems.
3.6. Symbol Decision
After completing clock synchronization, the symbol decision is performed by comparing the data
yc from the four channels. The symbol start position is determined based on the clock synchronization time
t. The maximum
yc(
t) value is sampled and compared with a set threshold
B. When it exceeds
B, the output corresponds to the frequency
fc associated with the maximum value
yc(
t). The specific implementation is as follows:
The function fc(t) denotes the frequency value corresponding to the maximum processed data at time t, while fc(t) represents the frequency associated with y at time t. Acting as a step function, it yields 1 when exceeding 0. Leveraging the interplay between carrier frequencies and symbols, information transmission can be decoded, facilitating symbol decision making.
4. Computational Simulations and Experimental Results
4.1. Communication System Block Diagram
The FPGA-based functional board, developed by the research team, incorporates the XLINX xc7k325tffg676-2 chip as the FPGA and utilizes the ADS5463 chip as the ADC. Additionally, the system integrates a Hamamatsu H10720-210 PMT for ultraviolet light detection. To enhance the functionality and performance of the system, the research team has meticulously designed driver circuits and detection amplification circuits.
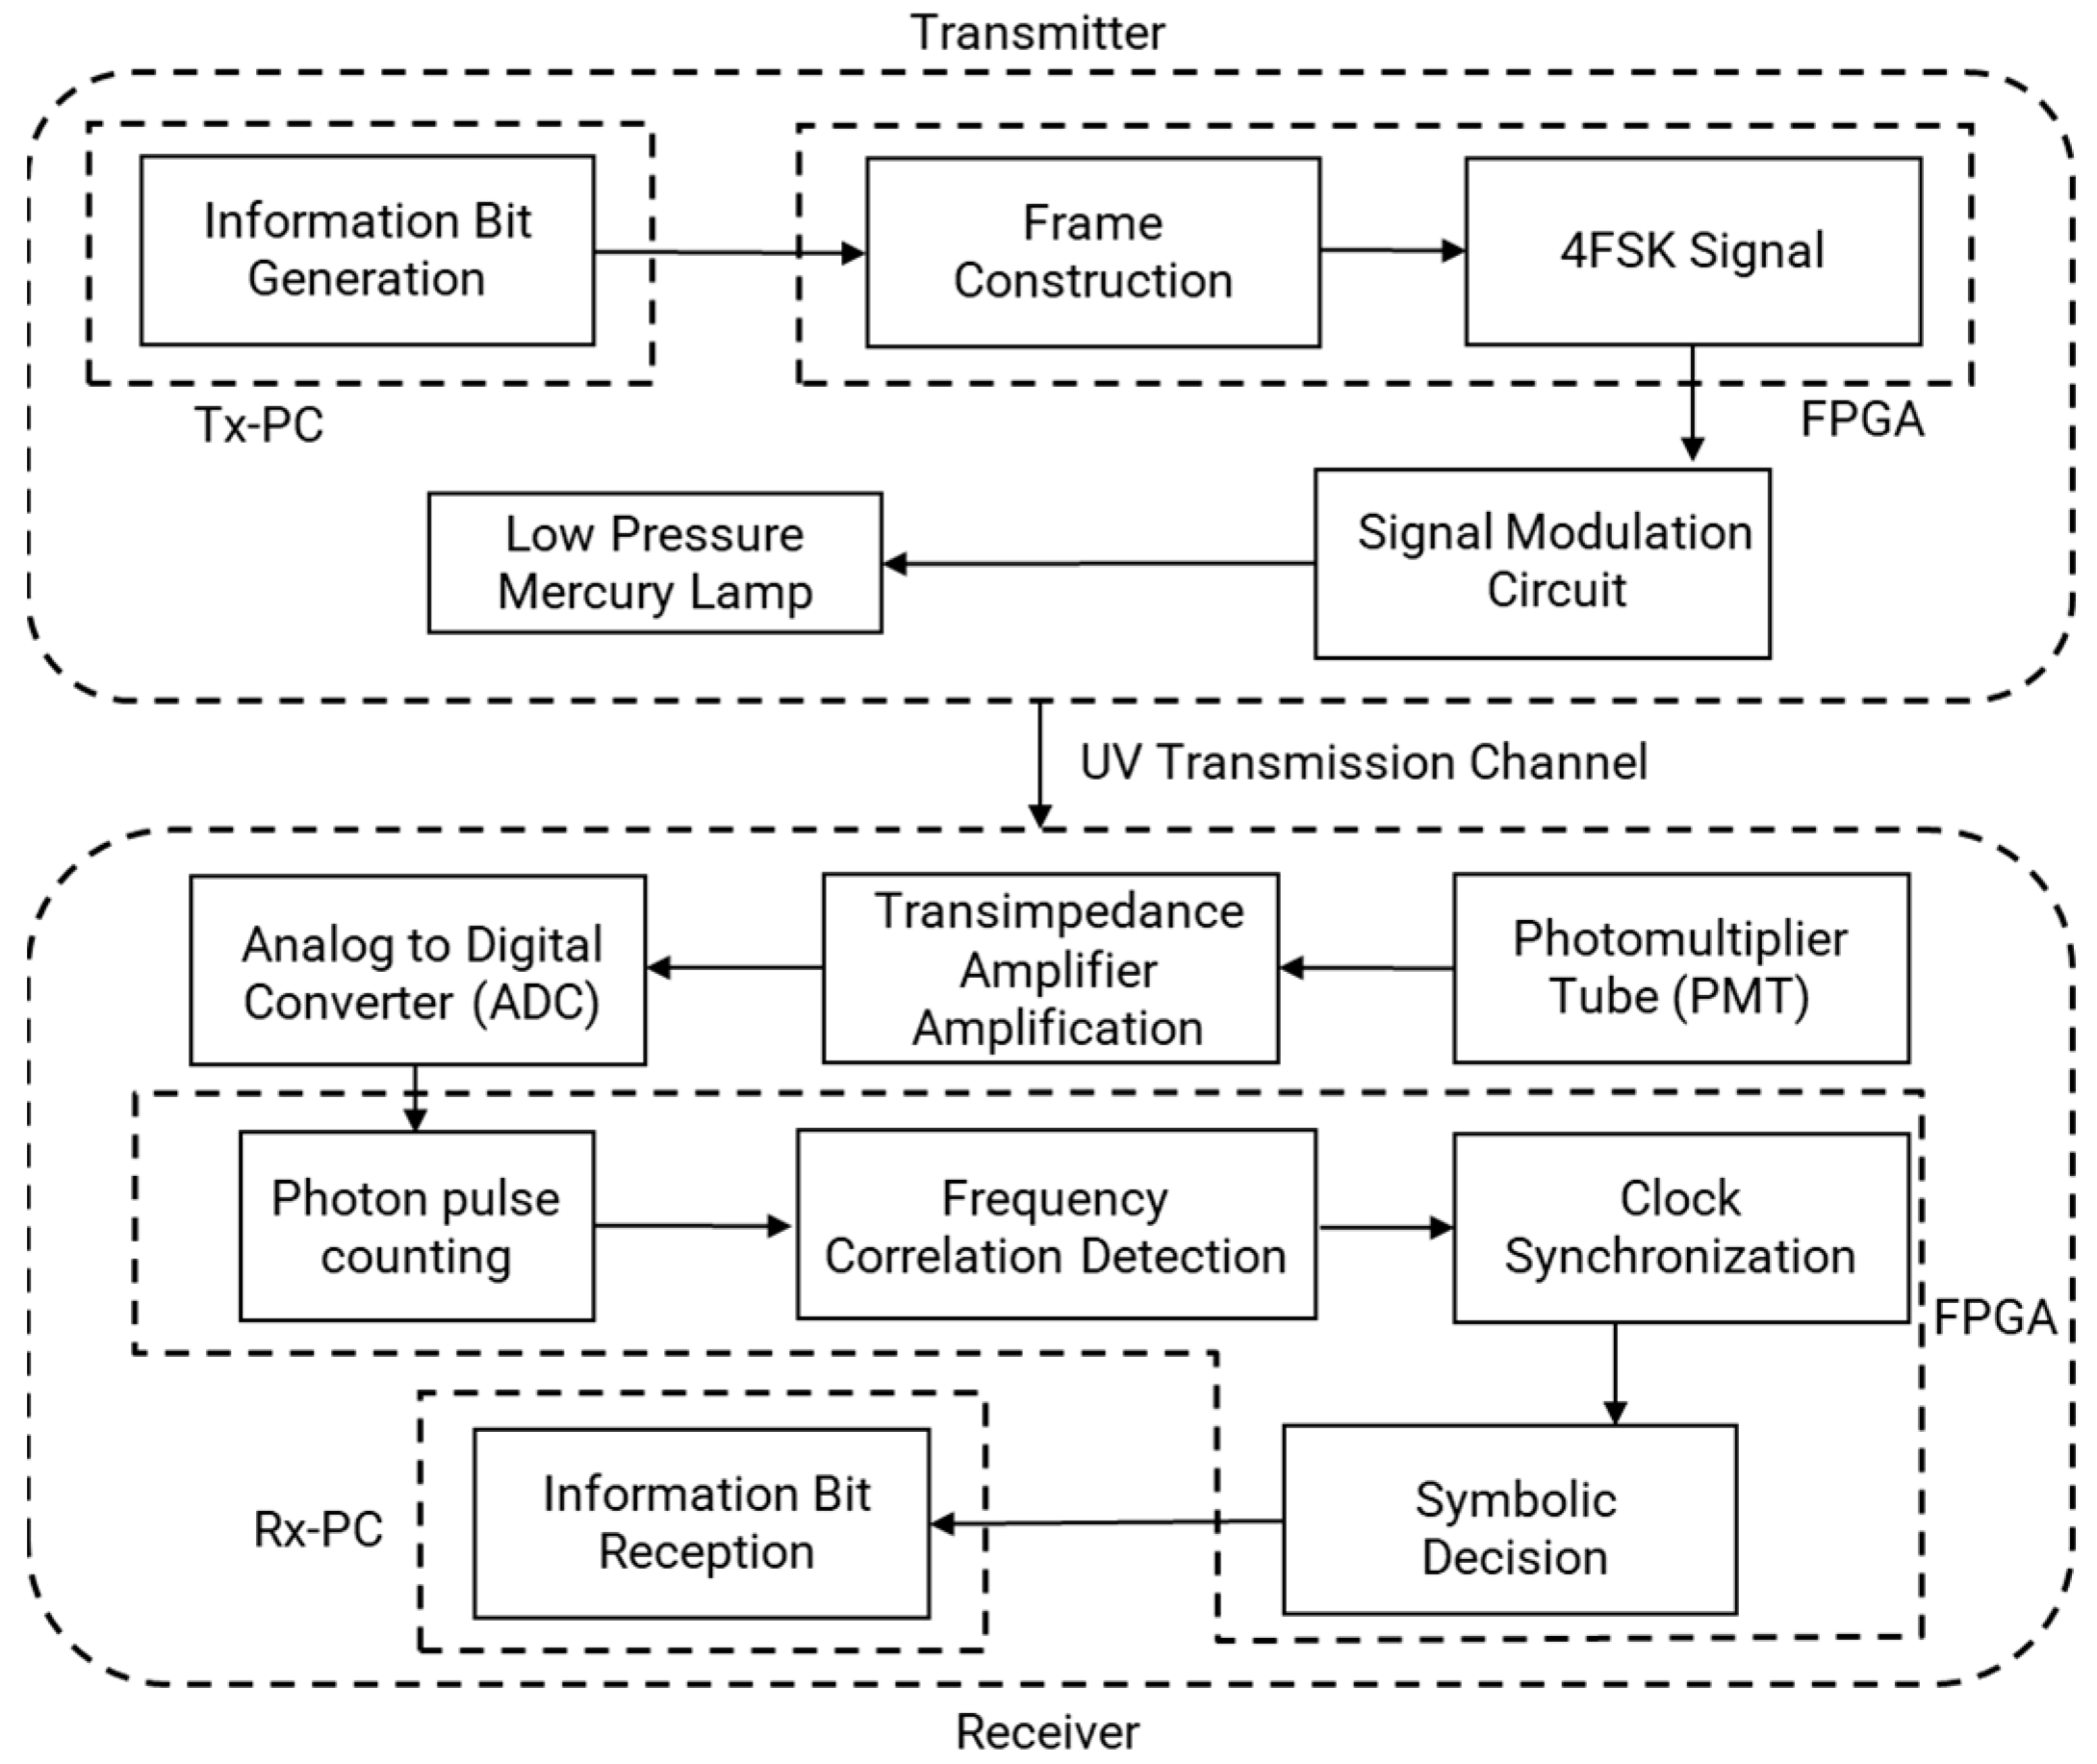
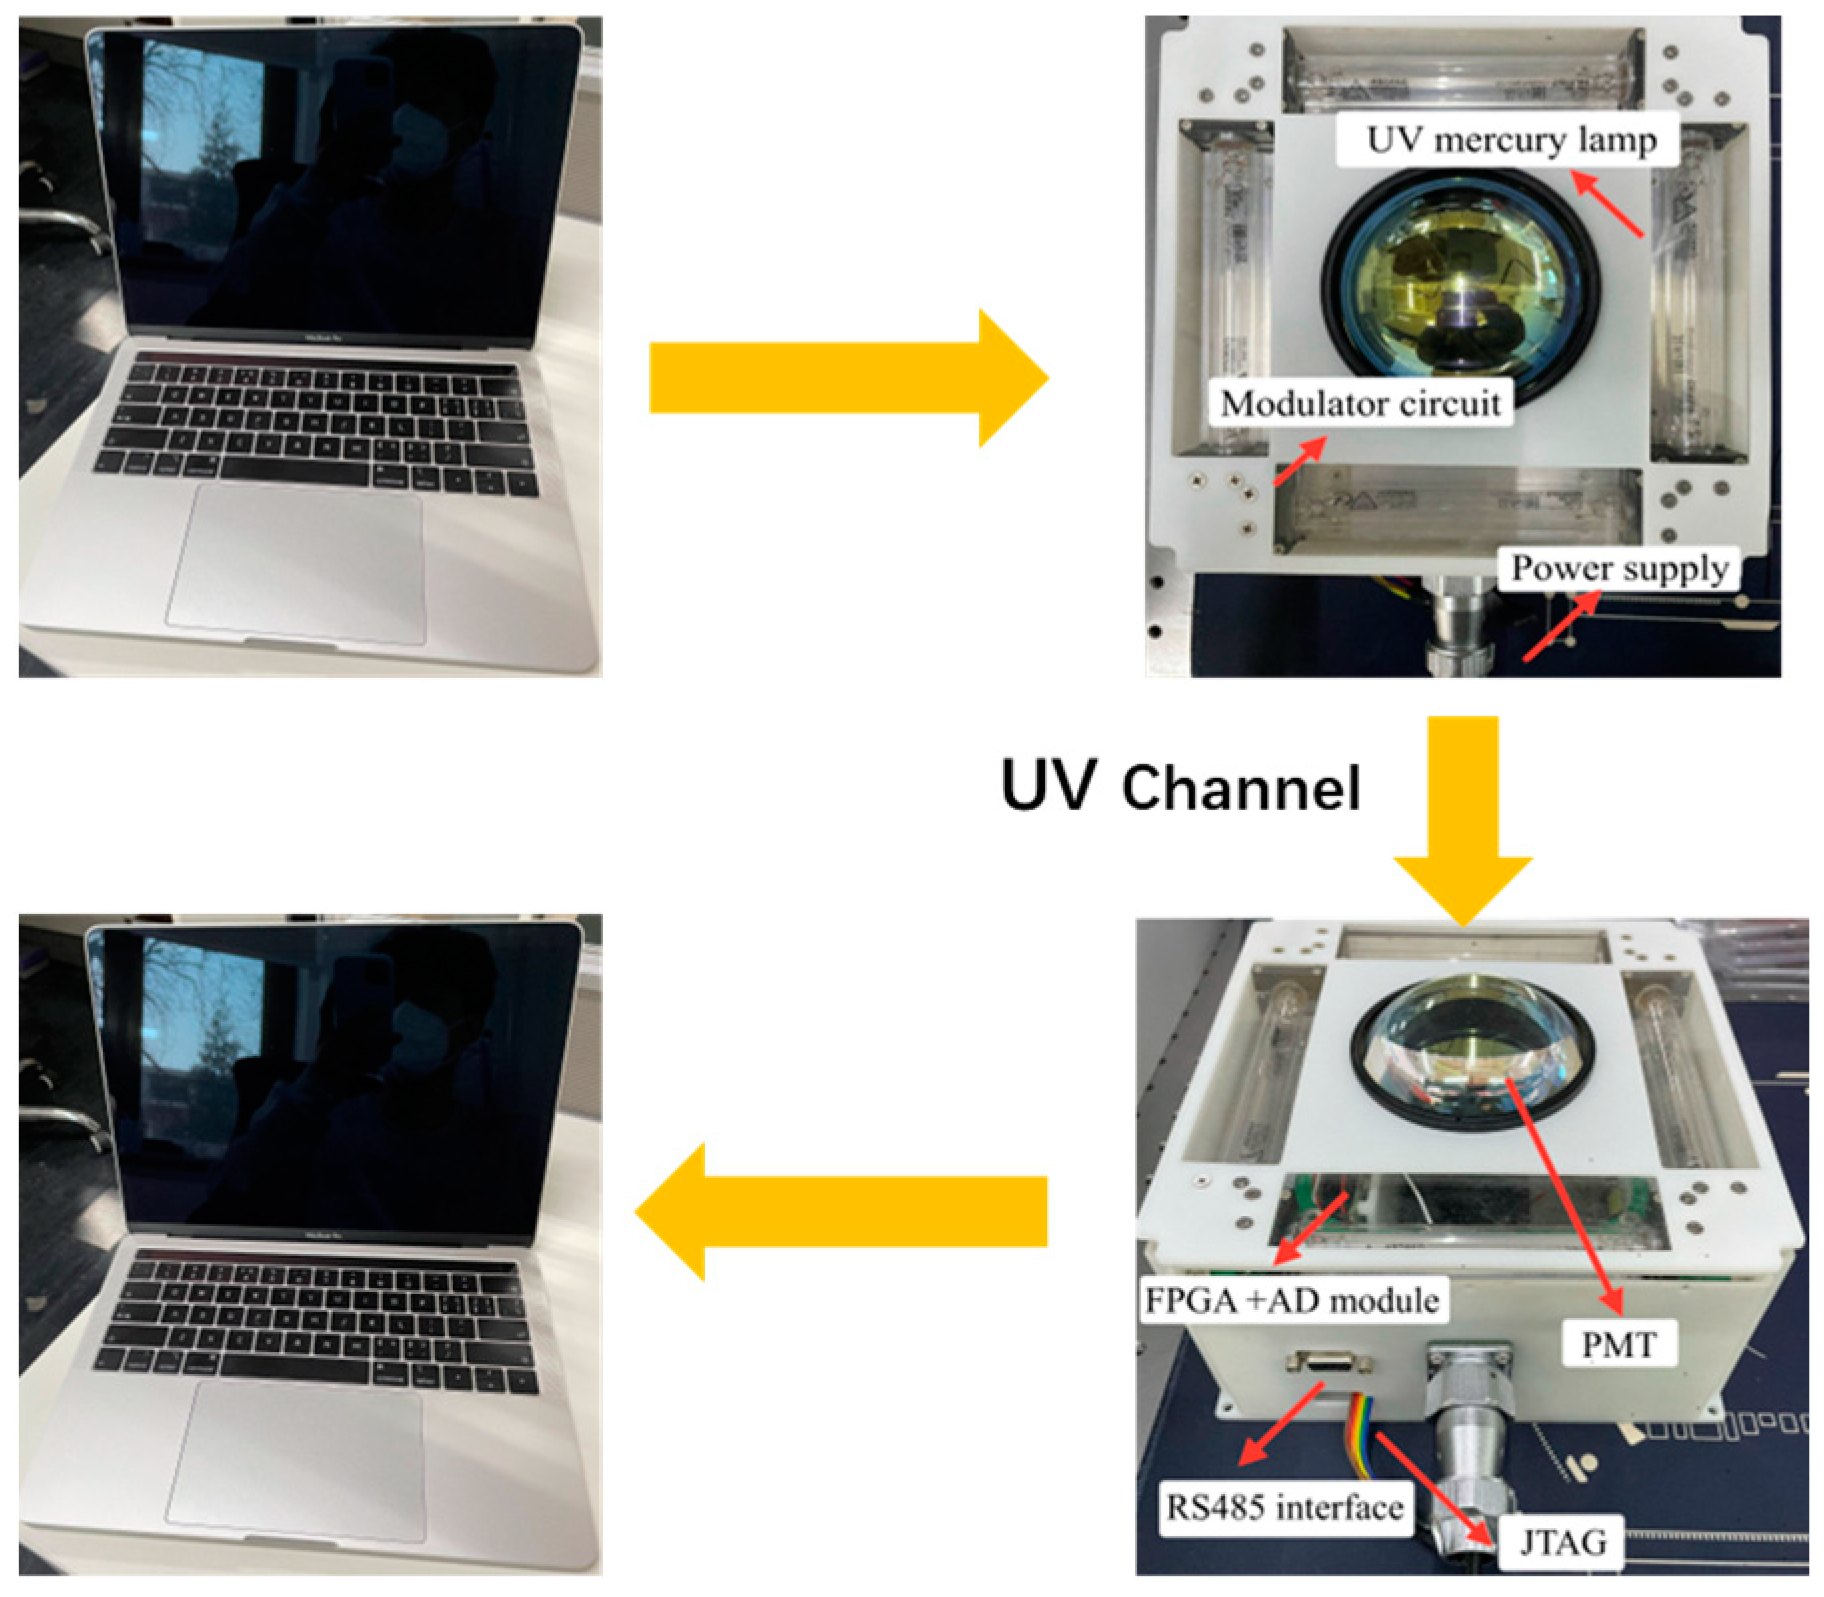
Figure 4 illustrates the ultraviolet weak signal communication system block diagram., while
Figure 5 depicts its hardware prototype, showcasing the integrated nature of the UV communication system.
At the transmitter end, data generated by PC-Tx are transmitted to the FPGA board, where they are organized into frames and synchronized with pseudo-random headers. These framed data are then conveyed through the FPGA’s pins to the half-bridge resonant drive circuit, which energizes the UV lamp. At the receiver end, a PMT functions as the UV light detector, converting received light into electrical pulses. Prior to processing, a UV optical filter is employed to attenuate environmental noise. The resulting electrical signals are then amplified by an op-amp current and sampled by an ADC. Subsequently, the FPGA undertakes various tasks such as photon counting, frequency detection, and clock synchronization on these digital signals, before relaying the reconstructed data to the Rx-PC.
4.2. System Simulation Design
The critical parameters of the communication system are defined. The system’s symbol rate (R) is set at 2.5 ksps, with each symbol characterized by a width (W) of 2 bits. Consequently, the system’s overall transmission rate (S) stands at 5 kbps. The symbol slicing frequency is established to be eight times the carrier frequency. In the 254 nm wavelength band of the mercury lamp emission, solar background light radiation ranges from approximately 1 × 10⁴ to 5 × 10⁴ photons per second. Therefore, the background radiation intensity is fixed at 2.5 × 10⁴ photons/s. In this context, the impact of electronic noise on the optical communication system is disregarded. Electronic noise primarily emanates from two sources: the dark current introduced by the PMT and the internal electronic noise introduced by the operational amplifier circuit. Testing both aspects of electronic noise using an oscilloscope revealed a magnitude ranging from 50 mV to 130 mV. In comparison, environmental light noise, tested between 1.1 V and 1.3 V, exhibits a magnitude difference of over tenfold.
Initially, the transmission of data through attenuated paths to the receiver is simulated. At the receiver end, a Poisson distribution is employed to model the probability distribution of photon reception by the PMT. Subsequently, a signal decoding algorithm based on 4FSK modulation is utilized to process the received data, followed by an analysis of the system’s communication capabilities.
4.2.1. Frequency Detection Performance Analysis
The analysis was conducted to evaluate the algorithm’s capacity for frequency identification of photon pulse signals.
Figure 6 illustrates the normalized spectral matching degree (NSM) against time
t, as the 00 codeword—corresponding to a carrier frequency of 40 kHz—enters distinct frequency detection windows at 40 kHz, 45 kHz, 50 kHz, and 55 kHz. Here,
λs and
λb maintain a 10:1 ratio, while the noise photons register at 2.5 × 10
4 photons/s.
It is evident that the spectral matching degree of the 40 kHz carrier signal, upon entering the 40 kHz frequency window, surpasses that of other frequency detection windows, peaking above 0.8. In contrast, the spectral matching degree of signals entering other frequency detection channels remains below 0.3. This substantiates the algorithm’s efficacy in frequency detection for photon pulses, underscoring the effectiveness of segmenting photon pulses and subjecting them to frequency feature computation within frequency detection windows for accurate carrier frequency discrimination.
4.2.2. Variations in Decoding Stability Index with Signal-to-Noise Ratio (SNR)
In this section, an analysis is conducted on the impact of variations in λs, λb, and the symbol rate R on frequency matching. The investigation focuses on the statistical assessment of the frequency matching ratio when 40 kHz carrier frequency signals are introduced into the 40 kHz and 45 kHz detection channels. This ratio serves as a metric to characterize the performance of decoding reliability, called the Decoding Stability Index.
A higher Decoding Stability Index signifies more pronounced disparities in frequency matching, which correlates with an enhanced decoding reliability and reduced probability of decoding errors. λs, intimately related to the sampling frequency and the intensity of the received signal, denotes the likelihood of photon detection within a single sampling period in the system design. Its Poisson distribution expression is intricately associated with the F(fc,t) sequence, and its integration yields the mean expression over the sampling period.
In
Figure 7a, the background light noise for each sampling period was configured into four intensity ranges, denoted as
λb (0.00015, 0.000075, 0.00003, 0.000015). At a symbol rate of 2.5 ksps, the relationship between the Decoding Stability Index and
λs is demonstrated. Four curves are plotted corresponding to different values of
λb. It is observed that with increasing
λs, the Decoding Stability Index also increases, indicating a higher decoding accuracy of the system. Moreover, at the same
λs value, lower
λb values representing lower environmental light noise correspond to a stronger Decoding Stability Index, resulting in a lower error probability.
Expanding upon this analysis,
Figure 7b explores the relationship between the Decoding Stability Index and
λs for four symbol rates
R, while keeping the environmental noise constant, setting
λb to 0.00015. It is observed that as
λs increases, the Decoding Stability Index also increases. At the same
λs value, with decreasing
R, higher changes in the Decoding Stability Index are observed, indicating a lower error probability. This suggests that lower rates can significantly improve the system’s error probability.
4.2.3. Variations in BER with SNR
Based on the aforementioned simulation results, a suitable selection of λs and λb was made for BER simulations. Across different optical noise environments, the response of BER to variations in λs was observed through simulations. Additionally, with a constant optical noise power density represented by λb, simulations were conducted to explore the effects of λs on BER for different symbol rates denoted by R.
In
Figure 8a, the relationship between
λs and BER is illustrated for a symbol rate of 2.5 ksps under different environmental noise levels. It is observed that as
λs increases, the BER decreases. When
λs exceeds 2.1 × 10
−3, the BER can drop below 10
−5. This phenomenon occurs due to the system receiving a greater number of effective photons, thereby accentuating different frequency characteristics. Consequently, the system can more readily discern the four carrier frequencies, resulting in a lower bit error rate. Higher noise levels correspond to higher BERs at the same
λs. This is attributed to an increased misinterpretation of ambient light noise as signal light, thereby compromising the system’s ability to distinguish the four carrier frequencies. To alleviate this issue, employing carrier frequencies that are more distinct can enhance the system’s resilience to ambient light interference.
Figure 8b depicts the relationship between
λs and BER for different symbol rates
R, with a noise level of 0.00015. It is evident that the symbol rate has a significant impact on the BER. Particularly, at a symbol rate of 2.5 ksps, the BER can decrease below 10
−6 when λ
s exceeds 2.4 × 10
−3. Reducing the rate by half means doubling the time for transmitting carrier frequencies. In terms of signal processing, this implies a doubling in the number of available signal photons. Consequently, within a single symbol time, twice as many signal photons enter the detector. This significantly reduces the system’s bit error rate, primarily due to the relationship between the effective photon intensities within a single symbol width. To address this situation, the following mitigation measures can be taken: in hardware design, increase the optical transmission power; for longer communication distances or higher path losses, opt for a lower rate communication.
Based on the aforementioned simulation results, the proposed signal processing algorithm under weak UV light signals using 4FSK modulation has been validated to effectively handle weak signals and recover data. Additionally, it offers guidance for hardware design parameters.
4.3. Hardware Experimental Testing
Experimental tests were conducted on the system both within laboratory settings and outdoors. To filter out ambient light noise mixed in the detection signal and minimize background noise, we have added a UV optical filter in front of the PMT with a transmittance of over 34% at 261 nm, with an FOV of 5°. The wavelength of the mercury lamp light source used in our system is 254 nm. It is imperative to acknowledge that owing to the physical constraints inherent to the ultraviolet optical filter utilized, there exists a marginal deviation between the wavelength of the ultraviolet light source and the peak wavelength of the optical filter. The variation in transmittance of the optical filter due to this difference leads to a slight change, resulting in signal loss and a decrease in received signal intensity, thereby reducing the system’s detection sensitivity and signal-to-noise ratio, and thereby impacting the performance of the system to some extent. Additionally, this deviation can also cause misalignment in the system’s frequency characteristics, thereby affecting the frequency response and signal processing capability of the system. Nevertheless, this disparity does not engender a significant deterioration in system performance, attributable to the bandwidth of the UV optical filter employed. Should the wavelength of the optical filter align with that of the UV light source, it would ostensibly augment communication efficacy.
4.3.1. Testing of Transmission Data, Modulated Carrier Signals, and Detection Signals
In the experiment, the signals from the transmitter and receiver were tested using an oscilloscope, as shown in
Figure 9:
The above represents the carrier frequency signal output by the FPGA (a), the frequency signal output by the modulation circuit (b), and the waveform signal of the photoelectron pulses detected by the PMT (c). Each photoelectron pulse corresponds to one or more photoelectrons detected by the PMT.
4.3.2. NLOS Communication BER Testing
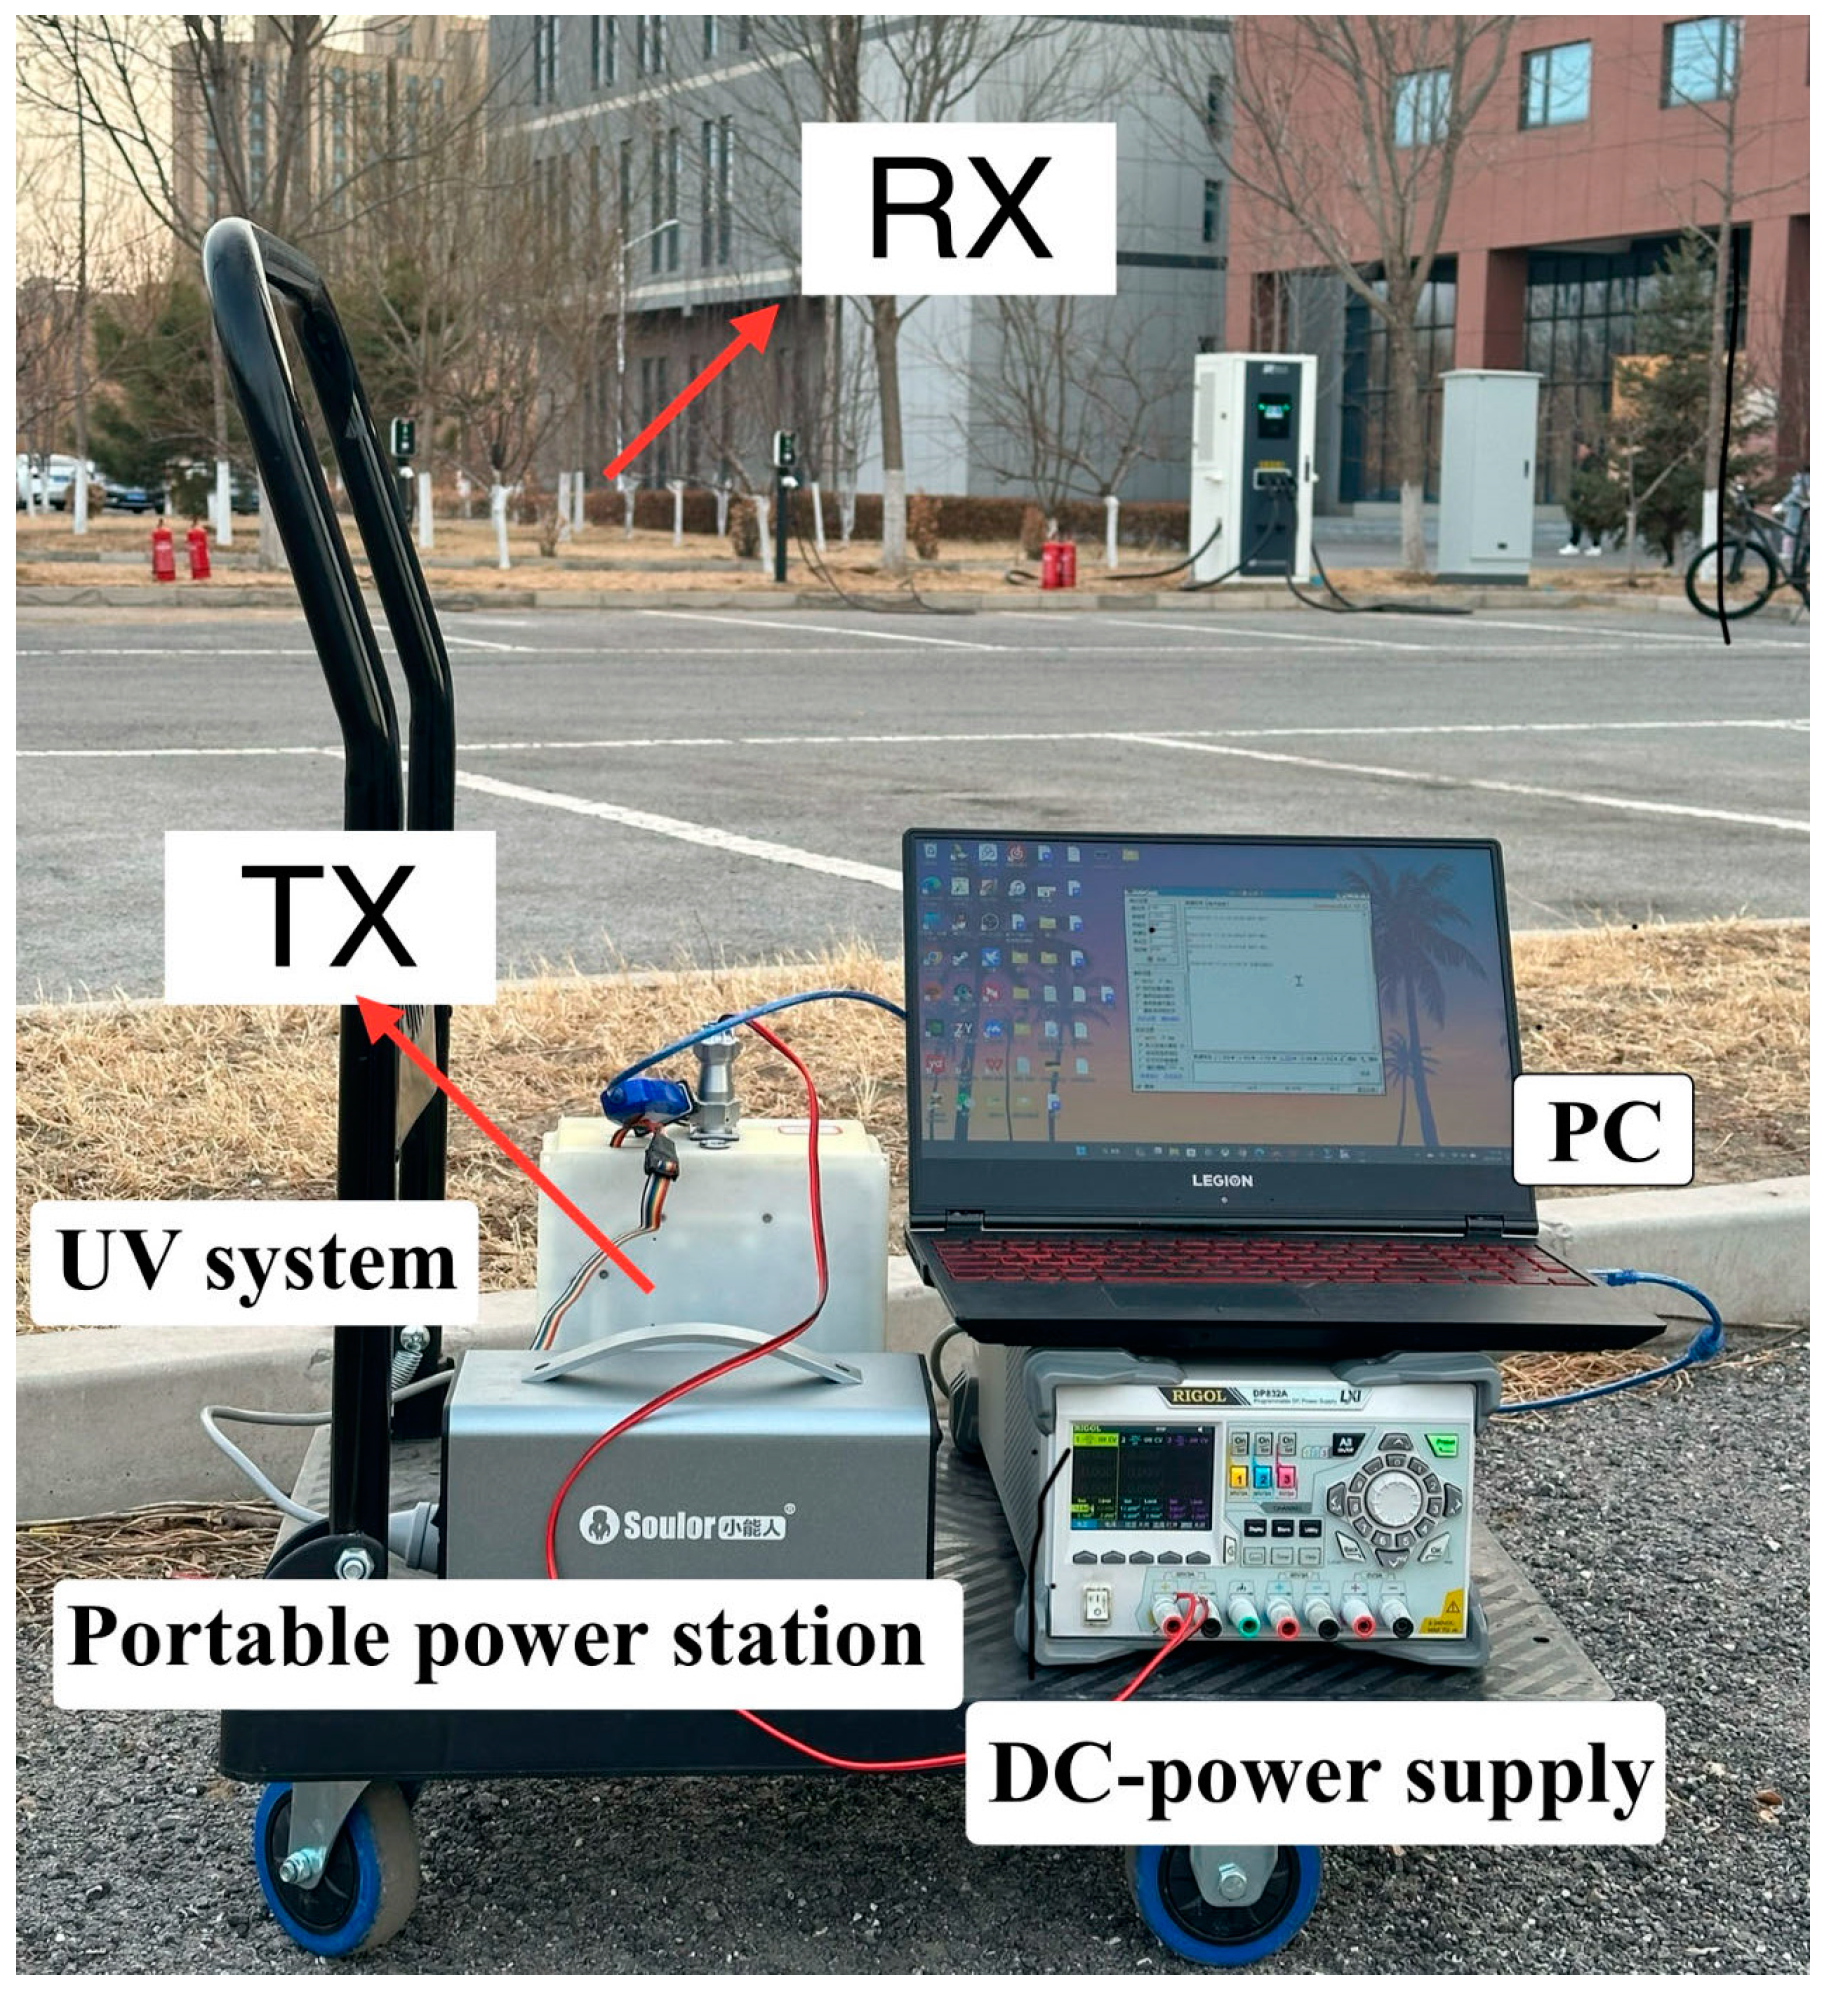
For the evaluation of NLOS scattering communication capabilities in UV communication, outdoor communication tests were conducted. During these tests, the transmitter and receiver were positioned on opposite sides of various obstructing elements such as trees and buildings. Due to the obstruction caused by these elements, communication between the transmitter and receiver relied on scattering. The linear distance between the two ends was 65 m, with obstacles reaching a maximum height of 4 m. Both the transmitter and receiver were set at a 20-degree offset angle.
Figure 10 illustrates the physical setup of the experimental equipment.
In
Figure 10, “TX” represents the transmitter location, and “RX” represents the receiver location. “PC” stands for the computer used for data transmission, “UV system” represents the prototype of the system, “DC-power supply” is the voltage source powering the prototype, and "Portable power station" is the outdoor power source supplying power to various electrical devices.
The results of the on-site tests, as presented in
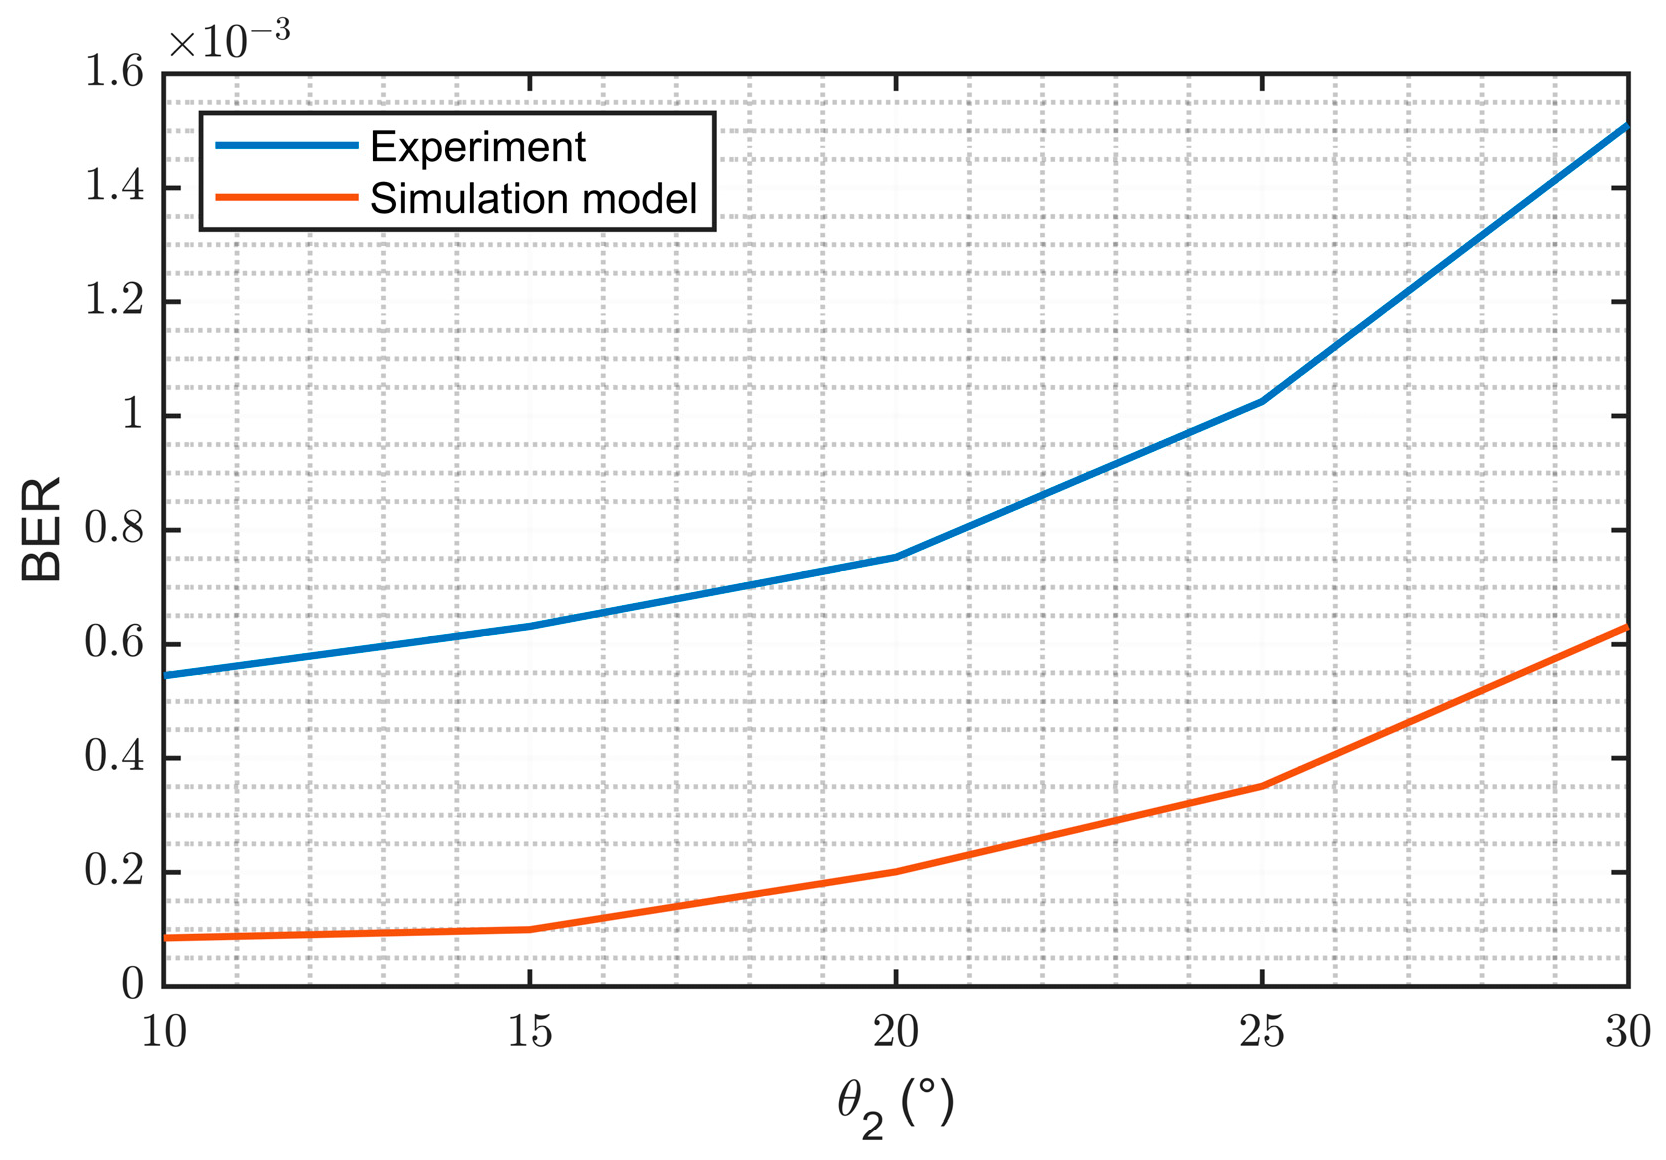
Table 1, revealed that out of a total of 131,072 transmitted data bits, 98 bits were found to be erroneous, resulting in a BER of 7.52 × 10
−4. The variation in the bit error rate was observed by altering the receiving angle while maintaining the transmission angle fixed at 20 degrees. This variation is illustrated in
Figure 11, where the receiving angle ranged from 10 degrees to 30 degrees. The simulated data were simultaneously incorporated into
Figure 11 to compare the simulated and actual experimental results.
Within the range of receiver angles from 10 degrees to 20 degrees, the BER exhibits a linear trend. However, beyond a receiver angle of 20 degrees, the BER shows a significant increase. It can be observed that the experimental and simulation results exhibit the same trend of variation, with the simulation BER generally outperforming the experimental BER. The simulated BER is relatively close to the experimental results at lower angles, but as the angle increases, the disparity gradually widens.
4.3.3. LOS Communication BER Testing
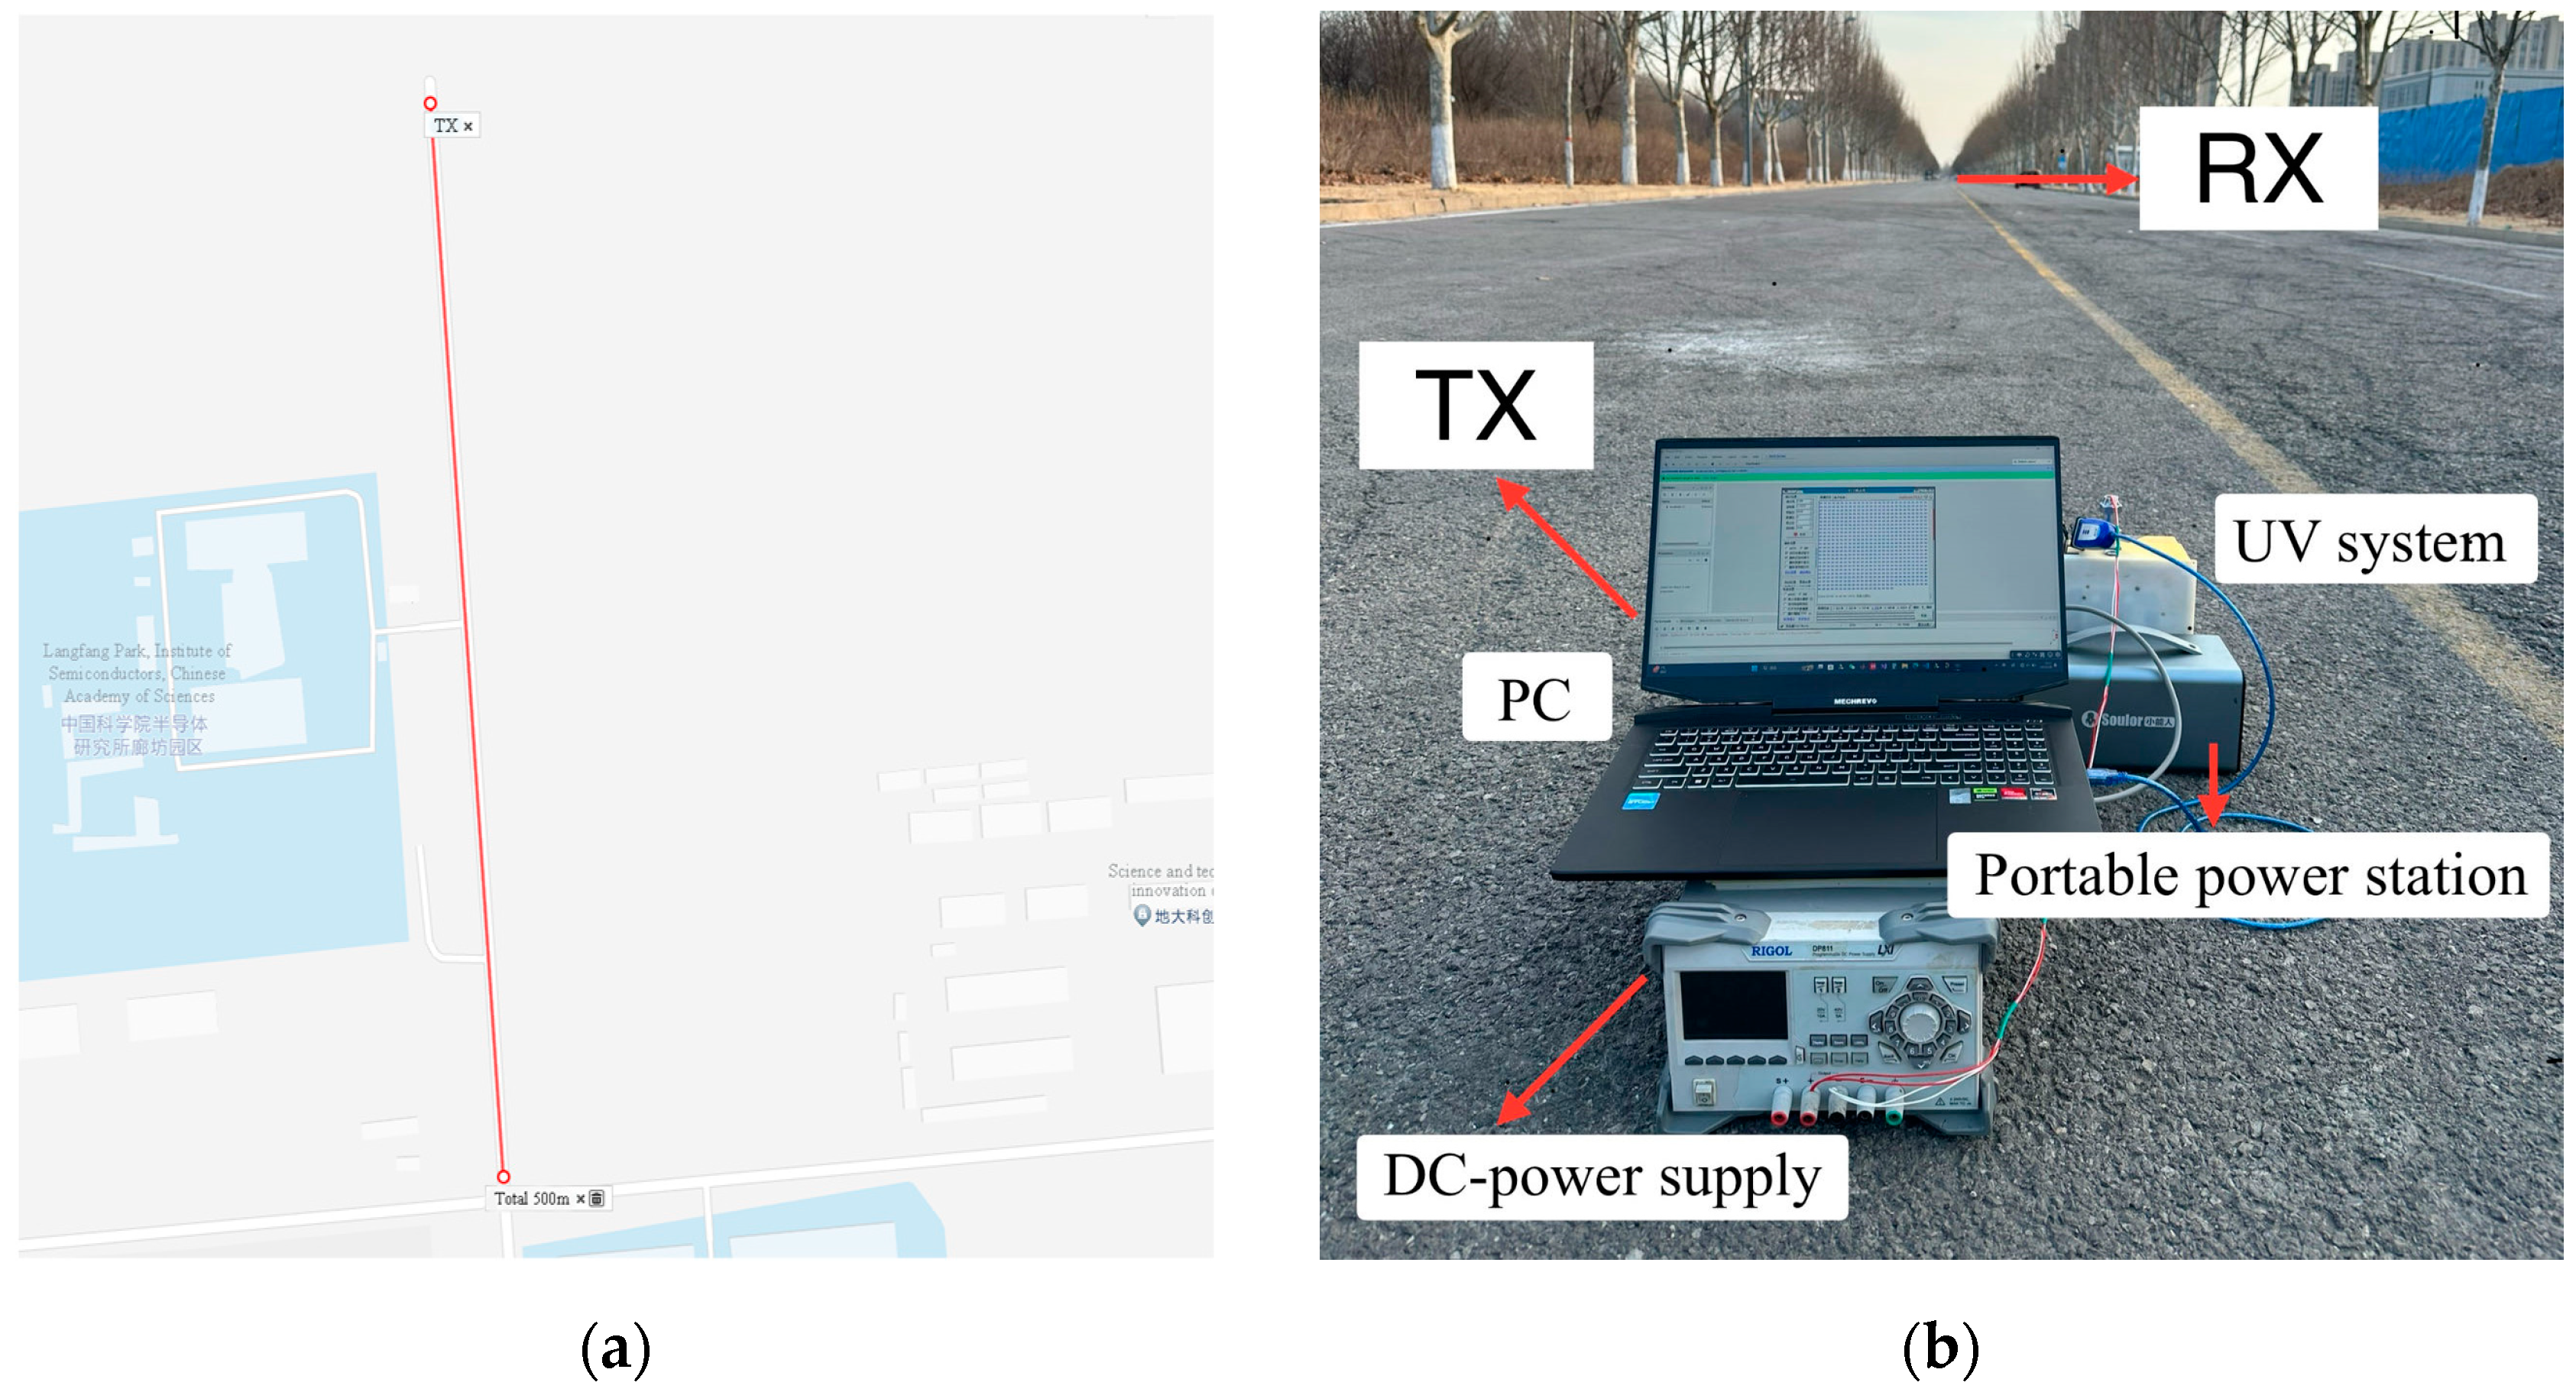
In addition to the NLOS scattering communication experiment, outdoor LOS communication experiments were conducted. The positions of the transmitter and receiver were located at the two points indicated in
Figure 12. The transmission distance was 500 m.
Figure 12a illustrates the positions of the transmitter and receiver, while
Figure 12b depicts the outdoor testing environment.
In
Figure 12a, “TX” represents the transmitter location, and “Total 500 m” indicates that the straight-line distance from the transmitter to the receiver is 500 meters. In
Figure 12b, “TX” stands for the transmitter, and “RX” stands for the receiver. “PC” refers to the computer used for data transmission, “UV system” represents the prototype of the experimental system, and “DC-power supply” is used to provide the voltage and current required for the prototype. “Portable power station” is an outdoor power source used to power various electrical devices.
The outdoor field test results are displayed in
Table 2. Out of a total of 241,664 transmitted data bits, 59 bits were found to be erroneous, resulting in a BER of 2.45 × 10
−4. Subsequently, the experimenter conducted BER tests for the communication system at different distances, ranging from 400 m to 700 m.
Based on
Figure 13, it is observed that within the range of 400 m to 500 m, the increase in BER is relatively slow. However, as the distance further increases, the BER exhibits a more significant upward trend. It can be observed that both experimental and simulation results exhibit similar trends of variation, with the simulated BER still outperforming the experimental BER. Moreover, as the distance increases, the gap between them tends to widen gradually.
The deviation between the simulation and experimental results can be primarily attributed to the following reasons:
When the particle density in the air is high, multiple scattering may occur. In the simulation, a single-scattering model was employed, which inevitably introduces certain deviations. UV photons interact with the abundant atmospheric molecules and aerosol particles. These two factors lead to increased path loss, resulting in poorer experimental BER data compared to the simulation results.
Due to the challenge of precisely matching the wavelength of the mercury lamp emission source with the filter, some photons are lost at the receiver, reducing reception efficiency and losing some signal photon energy. Prolonged operation of the emitter leads to a rapid local temperature rise, causing a decrease in the efficiency of mercury lamp emission. These two factors reduce reception efficiency, thereby affecting the experimental BER performance.
4.3.4. Comparative Analysis between NLOS and LOS Communication
Based on the experimental results of NLOS and LOS communication scenarios, we can evaluate and discuss the comprehensive communication capabilities of the ultraviolet communication system.
Error rate trend: In NLOS communication, when obstacles obstruct the path, the BER increases with the elevation angle at the receiver. Particularly beyond 20–25 degrees, there is a significant rise in the BER. This is due to the increased angle leading to a strong attenuation in communication path loss. For LOS communication, path loss increases significantly beyond 500 m, resulting in a higher error rate. Under certain conditions, NLOS and LOS may exhibit similar error rate trends. This suggests that despite different communication environments, both exhibit similar signal attenuations, resulting in consistent error rate values at the receiver.
Transmission distance: According to scattering model theory, as the elevation angle increases, the volume element intersected by the transmitter and receiver decreases, while the transmission path becomes longer, compounded by obstacles obstructing the path, leading to increased path loss. Therefore, for NLOS communication, this study achieved ultraviolet communication within a range of 10 to 30 degrees of elevation angle with obstacles, covering a distance of 65 m. For LOS communication, as the elevation angle is smaller, path loss depends only on changes in communication distance, enabling communication up to 700 m.
System stability: Our field tests revealed that in NLOS communication environments, due to the scattering characteristics of ultraviolet light, communication requirements can be met over a larger angle range, facilitating easier communication link establishment. For LOS communication, higher angle pointing requirements are necessary, and communication link establishment requires precise alignment between the transmitter and receiver.
5. Conclusions
This paper introduces a novel scheme for UV weak light communication, which relies on discrete Poisson channel distribution and optical pulse signal processing algorithms. The scheme undergoes analysis through theoretical derivation and computer simulation, with a focus on the performance evaluation of key decoding algorithms and hardware system implementation. Subsequently, experimental validations are conducted for both NLOS and LOS communication scenarios using the developed hardware system. The experimental findings demonstrate that the system achieves a transmission rate of 5 kbps under 4FSK modulation. In LOS communication, the BER remains below 10
−4 for a transmission distance of 400 m and stabilizes at 10
−4 for transmission distances ranging from 400 to 700 m. Moreover, as the transmission distance increases, the BER gradually rises. In NLOS experiments, conducted with a communication straight-line distance of 65 m and both transmitter and receiver angles set to 20 degrees, the BER is measured at 7.52 × 10
−4. Notably, with a receiver elevation angle between 10° and 25°, the BER stabilizes at 10
−4. However, increasing the receiver angle results in deterioration in the BER. These results were achieved with an SNR higher than 13. It is noteworthy that the UV communication system based on this research scheme surpasses the furthest transmission distance reported in the literature for UV frequency-modulated optical communication systems, exceeding the reported 1.2 kbps rate and 300 m communication range [
29].
In this study, a UV pulse weak signal communication system based on 4FSK modulation was established, with the following improvements summarized:
Modulation technique optimization: FSK modulation was adopted in place of OOK modulation to enhance the system’s resistance to interference and distance tolerance under similar environmental conditions.
UV communication frequency modulation scheme optimization: the proposal of the pulse photon detection and decoding algorithm has enhanced the system’s ability to detect and decode weak signals under frequency-modulated light communication, increasing the detection recovery capability to 30 photons per symbol, thereby effectively expanding its communication range.
Validation of theoretical derivations and simulations: the feasibility of the system design was confirmed through theoretical derivations and simulations of the scattering model to Poisson distribution and signal processing algorithms, guiding the design of system parameters.
System integration: Integration of the light source, PMT, optical structure, and circuit boards was performed, reducing the system’s volume and weight, and enhancing its stability and reliability. This integrated design can reduce the failure rate by minimizing connections and interfaces between different components.
These enhancements collectively contribute to the advancement in the UV communication system. Future endeavors will center on theoretical inquiries and system blueprints for UV scattering network communication models, aiming to introduce coding schemes proximal to the information transmission capacity limit, optimize optical path designs, and further refine system performance.


