Depth Measurement Error Analysis and Structural Parameter Correction of Structured Light Depth Imager
by
 , , and
Shuang Yu
1,2 ,
,
Haoran Guo
1,2,
Wenlong Yang
1,2,
Yanqiao Zhao
1,2,
Haibin Wu
1,2,
Xiaoming Sun
1,2 and
Xiaoyang Yu
1,2,* 1
Heilongjiang Province Key Laboratory of Laser Spectroscopy Technology and Application, Harbin University of Science and Technology, Harbin 150080, China
2
School of Measurement–Control Technology and Communications Engineering, Harbin University of Science and Technology, Harbin 150080, China
*
Author to whom correspondence should be addressed.
Photonics 2024, 11(5), 396; https://doi.org/10.3390/photonics11050396
Submission received: 17 February 2024
/
Revised: 1 April 2024
/
Accepted: 21 April 2024
/
Published: 24 April 2024
(This article belongs to the Special Issue Optical Devices/Components/Coatings for Ultra-Precision Equipment)
Abstract
:Considering that structured light depth imagers are difficult to use for precision measurements due to their limited measurement accuracy, we propose an innovative method for correcting structural parameters of structured light depth imagers to reduce the depth measurement error caused by structural parameter errors. For the structured light depth imager, the analytical imaging model is established, and the model of depth error caused by structural parameter errors is established based on the analysis of the depth measurement error analysis. Then, structural parameters are corrected according to the depth measurement error analysis and processing based on experimental depth imaging data of the standard reference plane at the maximum depth. As a result, the corrected analytical imaging model and corrected depth measurement values are obtained. Experimental results have demonstrated the success of this proposed method and its simplicity and convenience.
1. Introduction
The world is three dimensional, but traditional imaging projects the 3D world into 2D images, which cannot easily reflect the real world because of the loss of depth information. Therefore, 3D measurement technology that can obtain the 3D coordinates of a measured surface is highly valued and developing rapidly [1,2,3]. The structured light depth imager (SLDI) represents 3D visual measurement technology and obtains the surface 3D information in the form of a graphic or image, and it has the advantages of quickness, automation, non-contact, and high efficiency. Thus, it has been widely used in many production and life fields such as manufacturing, medical industry, entertainment industry, etc. [4,5,6].
At the same time, structured light depth imaging technology has attracted much attention from the precision manufacturing industry because of its full field, high efficiency, high precision, and the ability to detect complex structural components. The quality and accuracy of precision workpieces depend to a large extent on the form, position, and dimensional tolerance of parts. However, traditional measurements cannot meet the requirements because of low efficiency. Therefore, SLDI has become an efficient detection tool due to its excellent performances. The quality of precision products is directly determined by the quality of precision molds, and the mold mechanism required by products has become more and more complex and precise, making it difficult for traditional inspection methods to meet new demands. Therefore, structured light depth imaging technology provides a powerful means to meet new demands. In the face of the continuous emergence of large-size and/or small-size complex precision workpieces, the traditional detection methods often face the issue that it is difficult or even impossible to measure. Structured light depth imaging technology can have efficient enough detection to solve this issue. Precision manufacturing products are being developed, from spot inspection to full-size inspection or full-batch inspection, and structured light depth imaging technology provides an effective method that is significantly different from traditional testing methods. Moreover, structured light depth imaging technology plays an important role in the forward and reverse design of precision products, digitization, and intelligence of precision manufacturing enterprises.
Greater requirements are put forward for the structured light depth imaging technology, which is prominently reflected in reducing the depth measurement error to meet the needs of precision manufacturing. The work of the depth imager includes two processes in principle, obtaining the phase through the fringe image and calculating the depth value according to the imaging model. Therefore, the depth error is caused by the phase measurement error and structure parameter error. Among them, the phase error is affected by many factors, such as the geometric and physical characteristics of the measured surface. The depth measurement error is also comprehensively affected by these factors, and its influence law is complex and difficult to determine. In order to avoid this problem, the existing depth imagers use the projective geometric model for imaging, and accurate imaging is achieved by adjusting the parameters of the projective geometric model [7,8]. However, each of the many projective geometric parameters is difficult to adjust due to the comprehensive influence of the structural parameter error and phase measurement error at the same time, which limits the depth measurement accuracy of the depth imager. There is still a certain gap in the requirements of precision measurement, and there are difficulties in it being widely used in the precision manufacturing industry [9,10,11]. According to the working principle of SLDI, the depth image is obtained by the analytical imaging model. Therefore, the depth measurement error of the analytical imaging model caused by the structural parameter error and phase measurement error should be analyzed. The depth measurement error could be reduced by adjusting the structural parameters and phase measurement value, respectively, which is expected to be an effective way to improve the depth measurement accuracy of SLDI. Because the analytical imaging model of SLDI can directly express the influence of each structural parameter error on the depth measurement error, the structural parameters are expected to be adjusted more accurately. However, the obstacle lies in the complexity and coupling of the influence law of each structural parameter error on the depth error. The published works for reducing the measurement error caused by the assembly of the imager mainly focus on the analysis and compensation of the measurement error caused by the unsatisfactory device parameters in the imager [12,13,14]. However, for the depth measurement error caused by structural parameters, the existing research results either stop at the optimal selection of structural parameters [15,16,17] or stay at the level of qualitative error analysis [18,19]. It is rarely involved in using the analytical model and correcting structural parameters to reduce the error of depth measurement.
A structural parameter correction method of SLDI is proposed to reduce the depth measurement error caused by the structural parameter error (DMECSPE). Aiming at three structural parameters, an analytical imaging model and a model of the DMECSPE are established. The analytical imaging model quantitatively expresses the influence of structural parameters on the depth measurement value; the decoupling of the structural parameter error in the model of depth measurement error was achieved, and the depth error was found to be at a maximum at the maximal depth. Only one depth imaging of the standard plane is carried out at the maximum depth position, and the structural parameter correction is realized based on the analysis and processing of the experimental data of the depth measurement error. Moreover, the corrected analytical imaging model of SLDI is obtained, and the DMECSPE can be effectively reduced. The simulation results show that the proposed method is effective, and the actual measurement results show that the proposed method has a good depth imaging effect.
This paper is organized as follows: Section 2 establishes an analytical imaging model of the SLDI; Section 3 establishes a model of the DMECSPE and puts forward the correction method of structural parameters; Section 4 carries out experiments and provides the experimental results; Section 5 discusses the experimental results; Section 6 summarizes the research work.
2. Analytical Imaging Model
The SLDI mainly consists of a pattern projector, a camera, and a computer [20]. The coded patterns generated by the computer are projected onto the surface to be measured by the pattern projector. The camera acquires the surface images and then sends them to the computer for processing and decoding. Based on the decoding results, the computer calculates the 3D coordinate values x, y, and z of the surface in the world coordinate system via trigonometry.
The spatial position of the camera in the SLDI is shown in Figure 1. The point is the surface point to be measured in the world coordinate system , the point is an image point of point mapped to the imaging plane in the imaging coordinate system , and the coordinate plane is coplanar with the coordinate plane ; the point and the point are the lens centers of the pattern projector and the camera, and ; the point and point are the projection points on the coordinate plane and the coordinate plane of the point ; the point is the projection point on the coordinate plane of the point ; is the focal length of the camera lens, and ; the point and the point are the projection points on the axis and the axis of the image point .
According to Figure 1 and based on the triangulation method and the pinhole model, the analytical imaging model of the SLDI is derived as follows:
where , , and are the structural parameters in this paper, they are the constant in the SLDI, and their errors lead to the measurement error of the SLDI; and are the pixel numbers of the camera image, which are directly read from the image during the imaging process; the coordinate of the origin of the imaging coordinate system in the image coordinate system is ; is pixel width along direction ; and are pixel counts, respectively, along directions and ; the projection angle is an unknown parameter, which needs to be obtained by coding and decoding images in the SLDI [20]. It should be pointed out that there is no parameter in the analytical imaging model, and Equation (1) can be established regardless of whether there is the symbol on the left side of that. The left side of Equation (1) contains the symbol , which can directly express the meaning for a single pixel. This is convenient for the following theoretical analysis and mathematical expression in experimental data processing.
3. Depth Error Model and Structural Parameter Correction
Firstly, the model of the DMECSPE is established. In the SLDI, the design values and the truth values of structural parameters are denoted as , , and and , , and . As a result, there are the structural parameter errors of , , and . According to the analytical imaging model, the depth truth value is obtained using the truth values of the structural parameters, while the depth measurement value using the known design values because the truth values of the structural parameters are unknown. As a result, there is the depth measurement error , which can be written as follows:
According to the analytical imaging model, the higher order terms of can be ignored if , and can be described as follows:
Equation (3) is the model of the DMECSPE, where
It can be seen that the parameters , , , , and are constant, and increases as increases.
Next, the measurement error correction is discussed. The maximum depth to be measured is denoted as , whose error is denoted as , and according to Equations (3) and (4), we obtain
Then, the following method for correcting structural parameters is proposed.
Step 1: The standard reference plane is used as the surface to be measured and placed at , the depth true value of the plane is obtained through control or measurement, and the SLDI images the plane.
Step 2: The depth measurement value is calculated from Equation (1) when , , and are replaced with , , and ; , , and are additional errors of the structural parameters; , , and are designed constants and , , and ; .
Step 3: The depth measurement error is calculated when there are additional errors of the structural parameters, and then its average value along the direction is calculated as follows:
Step 4: Choose on one side of the camera imaging plane and on the other side, and calculate and from Equation (6).
Step 5: Let ; is obtained by linear fitting of data pairs according to using least squares regression analysis.
Step 6: Let ; and are obtained by linear fitting of data pairs and according to and using least squares regression analysis.
Step 7: Let ; and are obtained by linear fitting of data pairs and according to and using least squares regression analysis.
Step 8: Let ; the depth measurement value without additional errors of the structure parameters is obtained; after that, calculate its average value along the direction as follows:
and then calculate the average value of the depth measurement error without additional errors of the structure parameters from .
Step 9: Substitute and , respectively, into the left and right sides of Equation (3) to form a linear system of N equations as follows:
where , , , , , , and are known quantities; , , and are unknown quantities to be derived. Equation (8) is solved, and its least square solutions are denoted as , , and .
Step 10: In Equation (1), , , and are replaced with , , and . This corrects the structural parameters, and then gives the corrected analytical imaging model and the corrected depth measurement value as follows:
4. Experiment and Its Results
We used 3D Max and assembled a simulated SLDI to quantitatively verify the performance of our proposed method. Considering the existing commercially available devices, set , , mm, mm, mm, , ranging from to , the depth to be measured ranging from 1000.0000 mm to 1365.0000 mm, and . In a single imaging, the projector projected two sets with different frequencies of 10-step phase-shift cosine fringe patterns and 8-bit gray code stripe patterns; these fringe patterns were processed, and the wrapped phase, the absolute phase, and projection angle were drawn successively [20]; the depth measurement value was obtained from Equation (1).
In our quantitative simulation experiment, set mm, mm, , , , mm, mm, , , and mm. The experimental process and results were as follows.
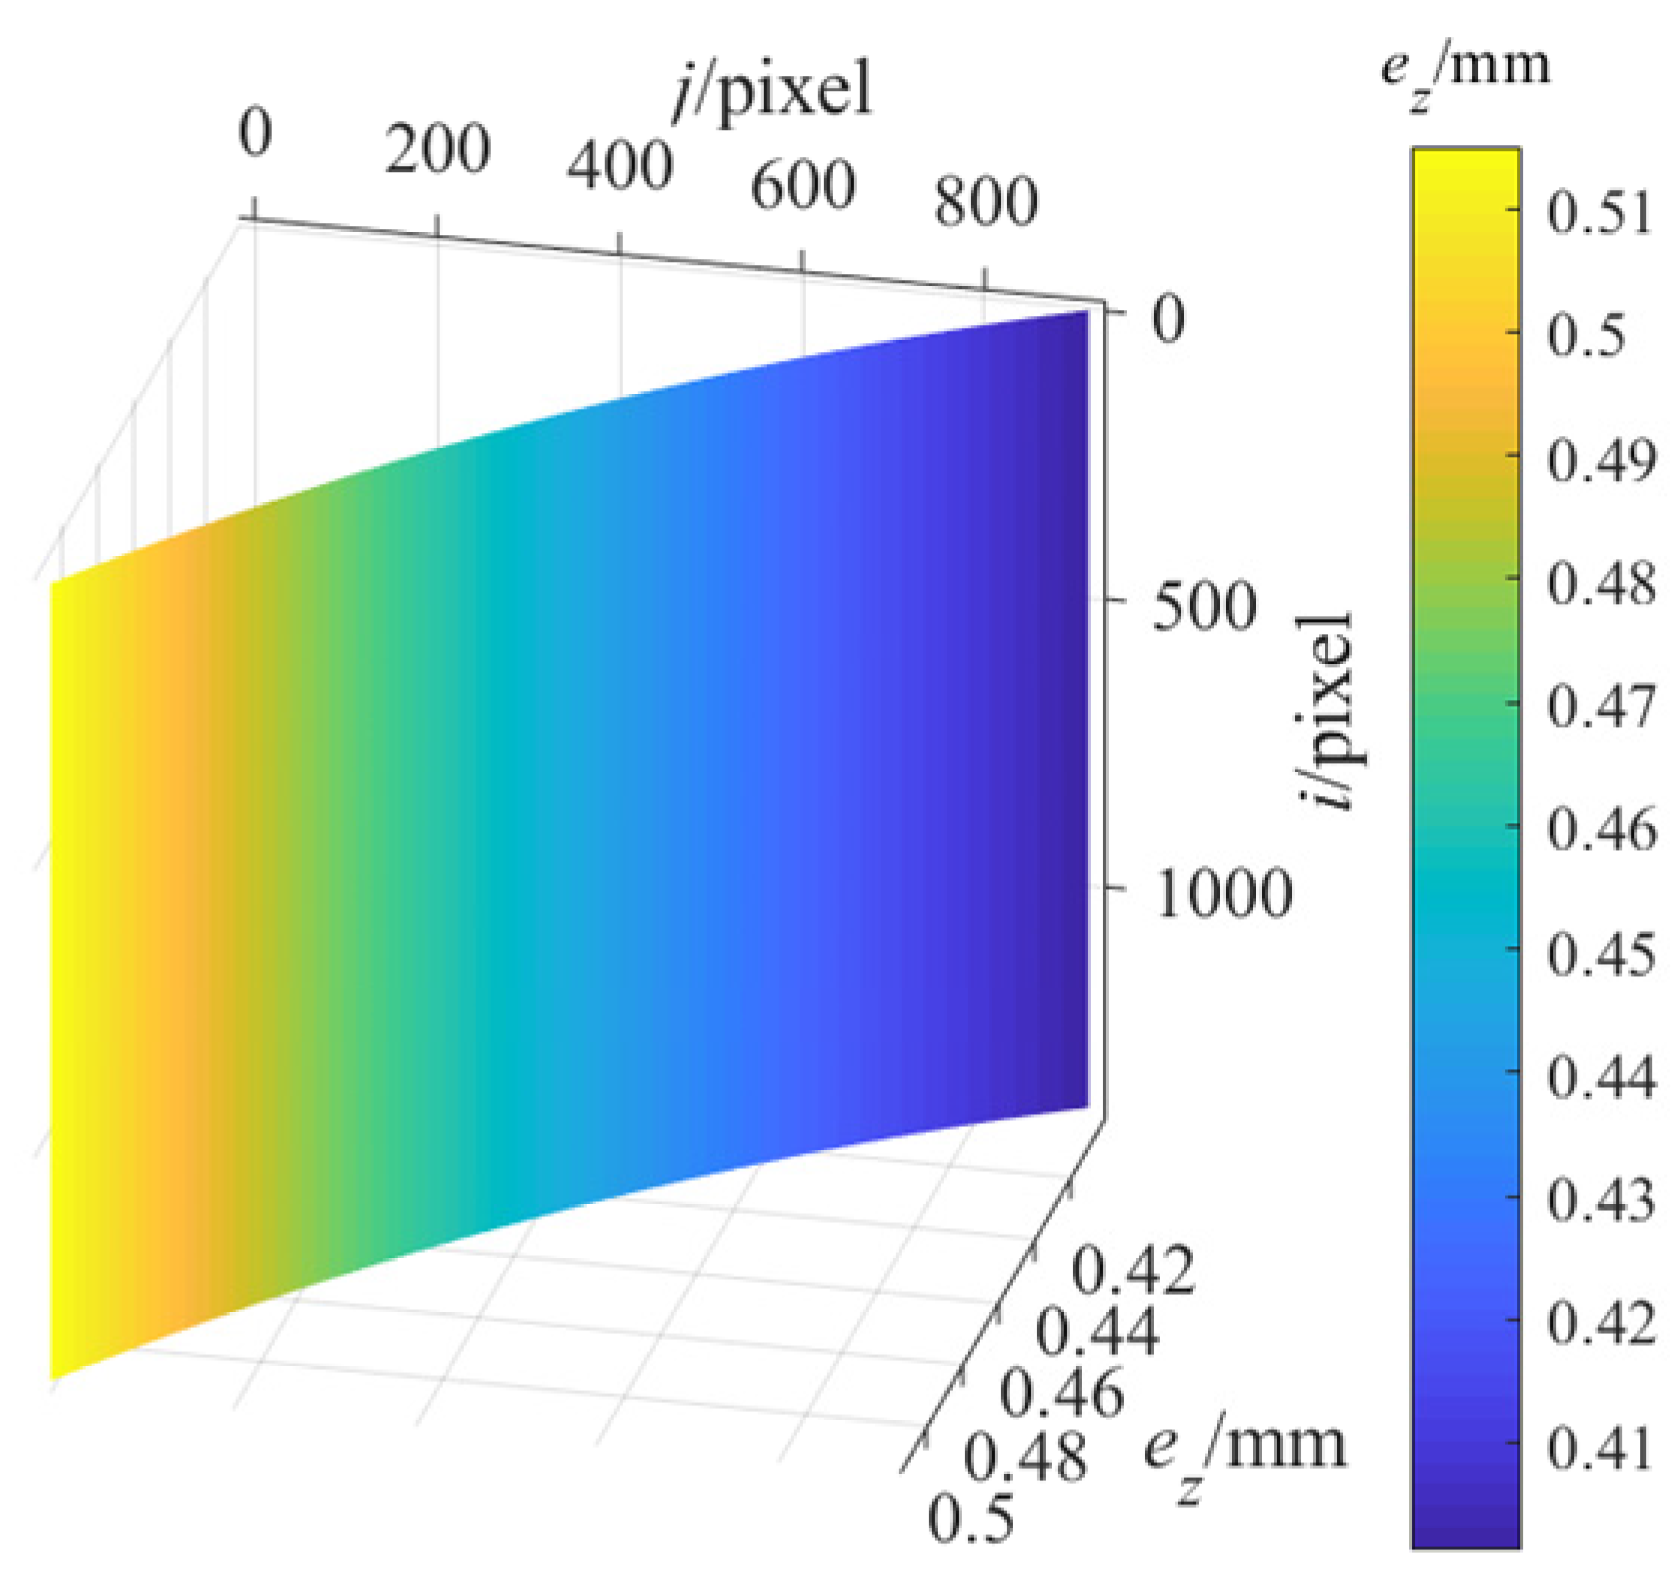
- Performed steps 1 to 7. Let , and is shown in Figure 2 where , , and , respectively, stands for , , and ; obviously, the spatial distribution deviation of is less than 1.0 × 10⁻⁴ mm and can be negligible; then, can be approximated as unchanged with ; at is tabulated in Table 1, was obtained by linear fitting of the experimental data in Table 1 using least squares regression analysis.
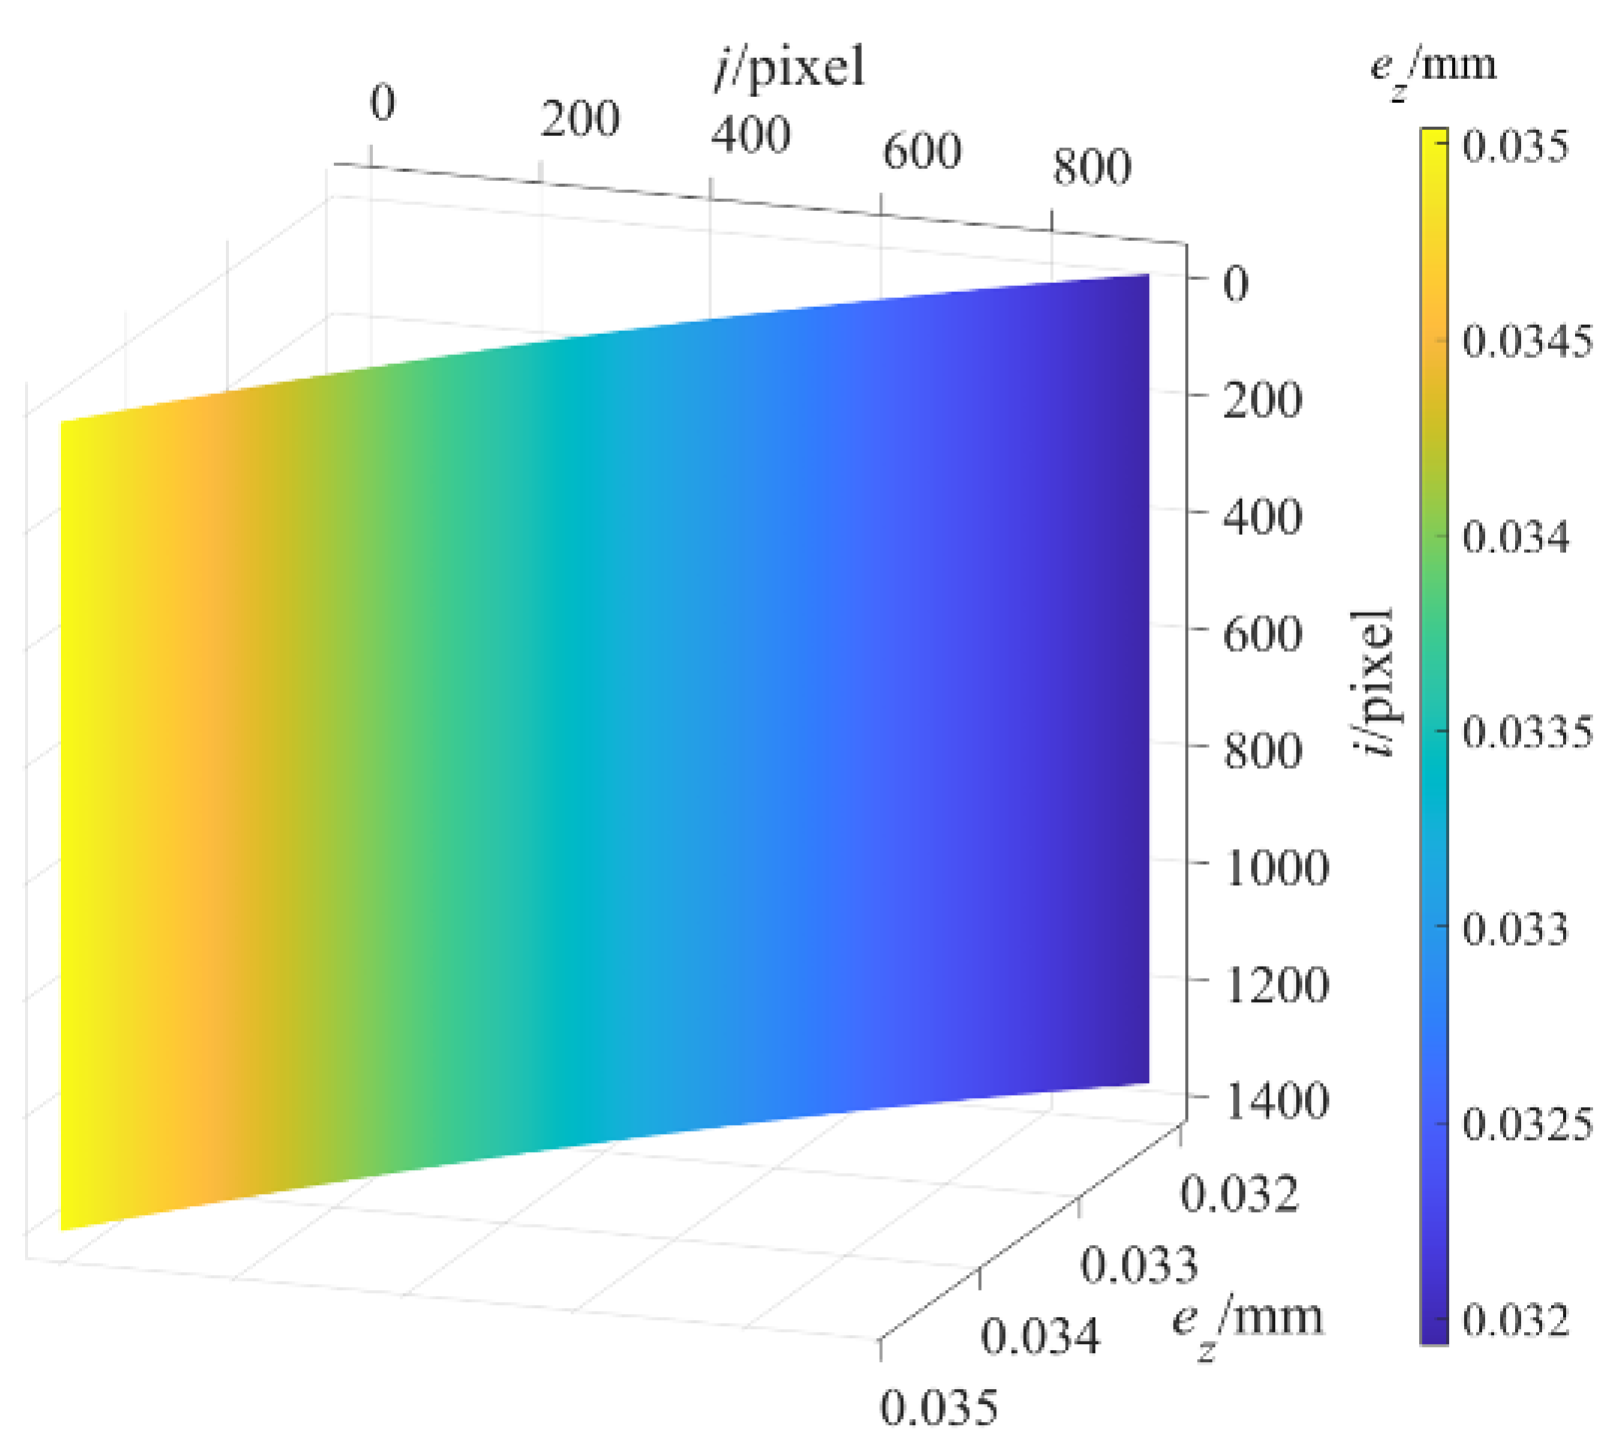
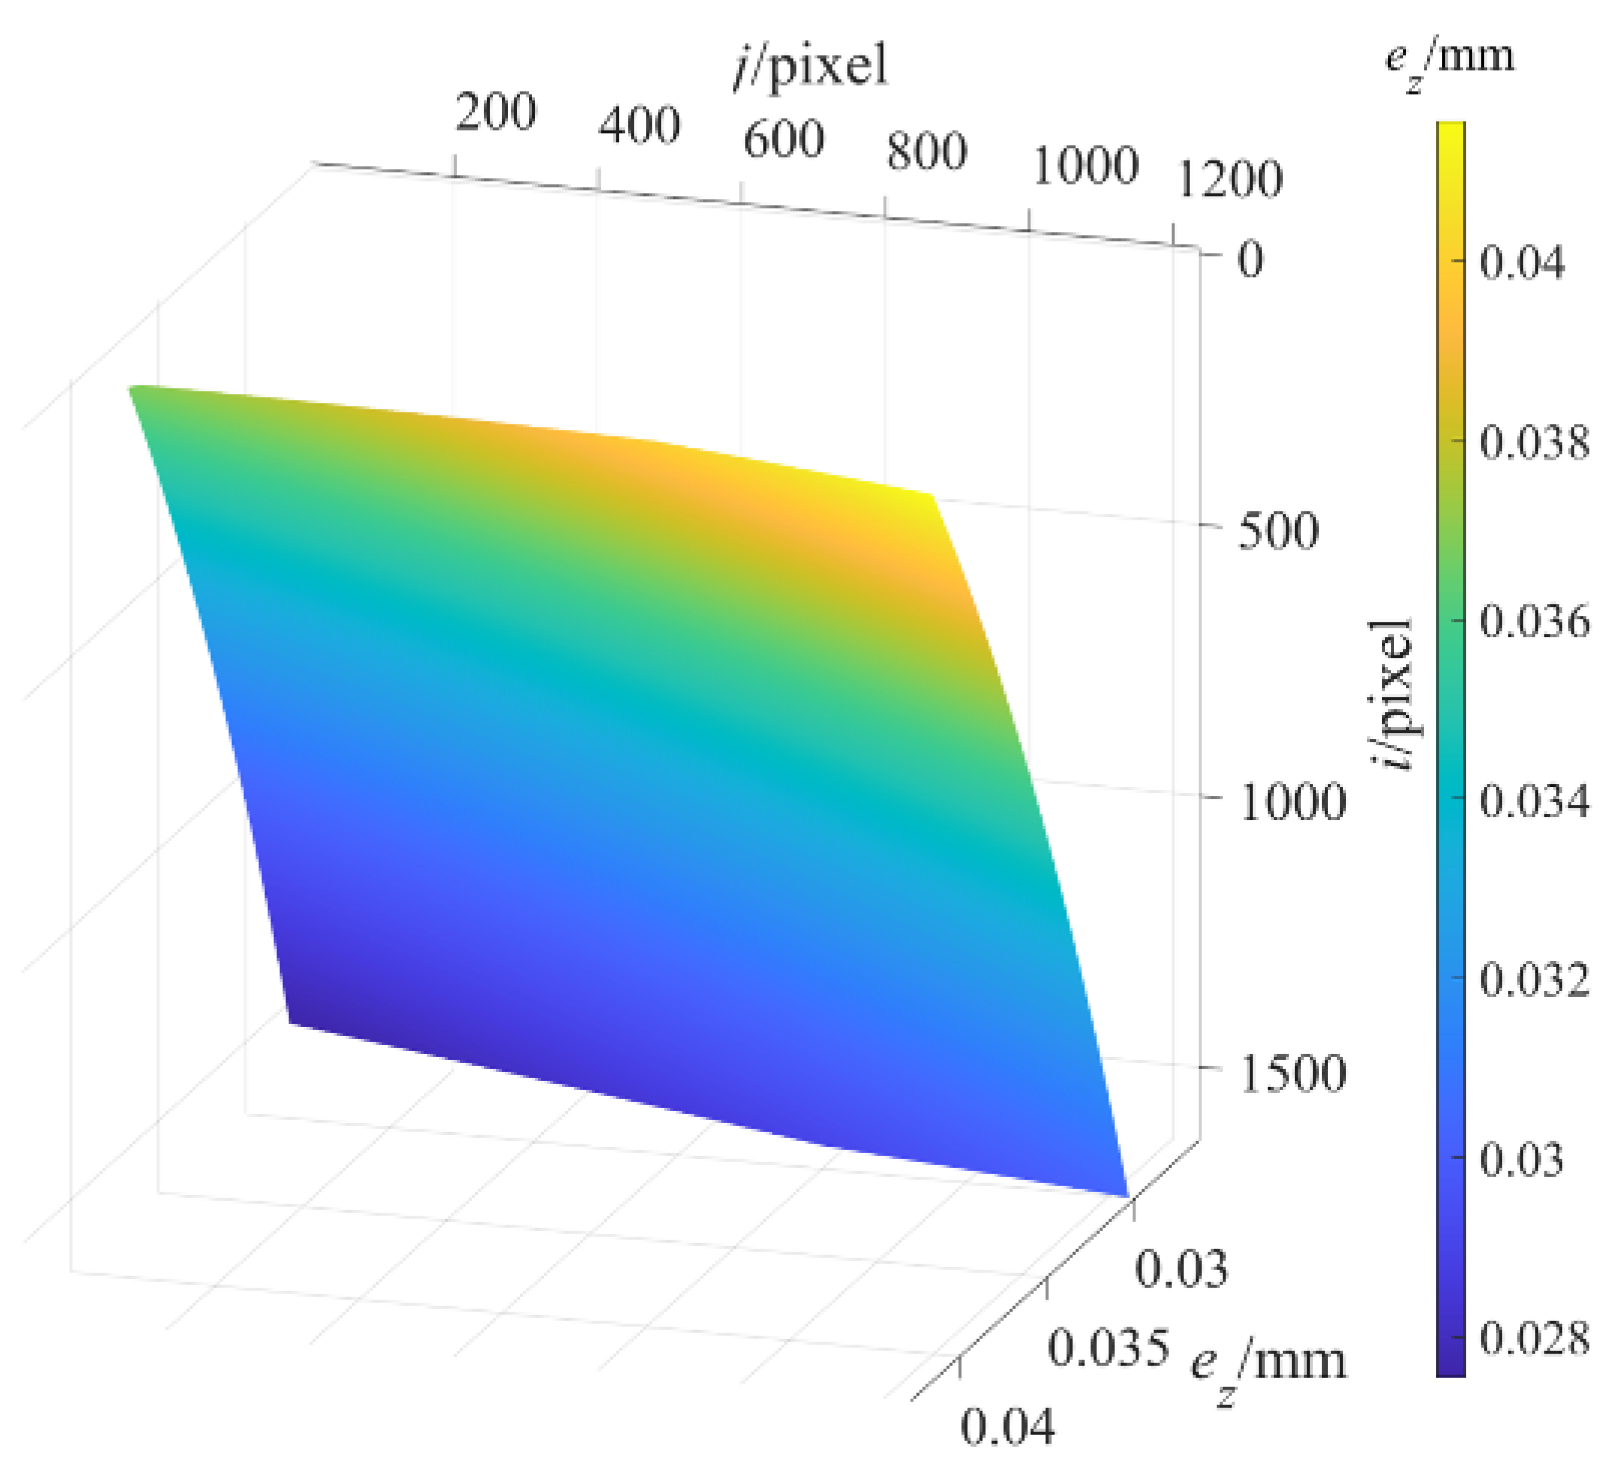
Let , and is shown in Figure 3; at and are tabulated in Table 2. Let , and is shown in Figure 4; at and are tabulated in Table 3. According to Figure 3 and Figure 4, are independent of , monotonically decrease with , and can be approximated as linear. , , , and were obtained via linear fitting of the experimental data in Table 2 and Table 3 using least squares regression analysis, respectively.
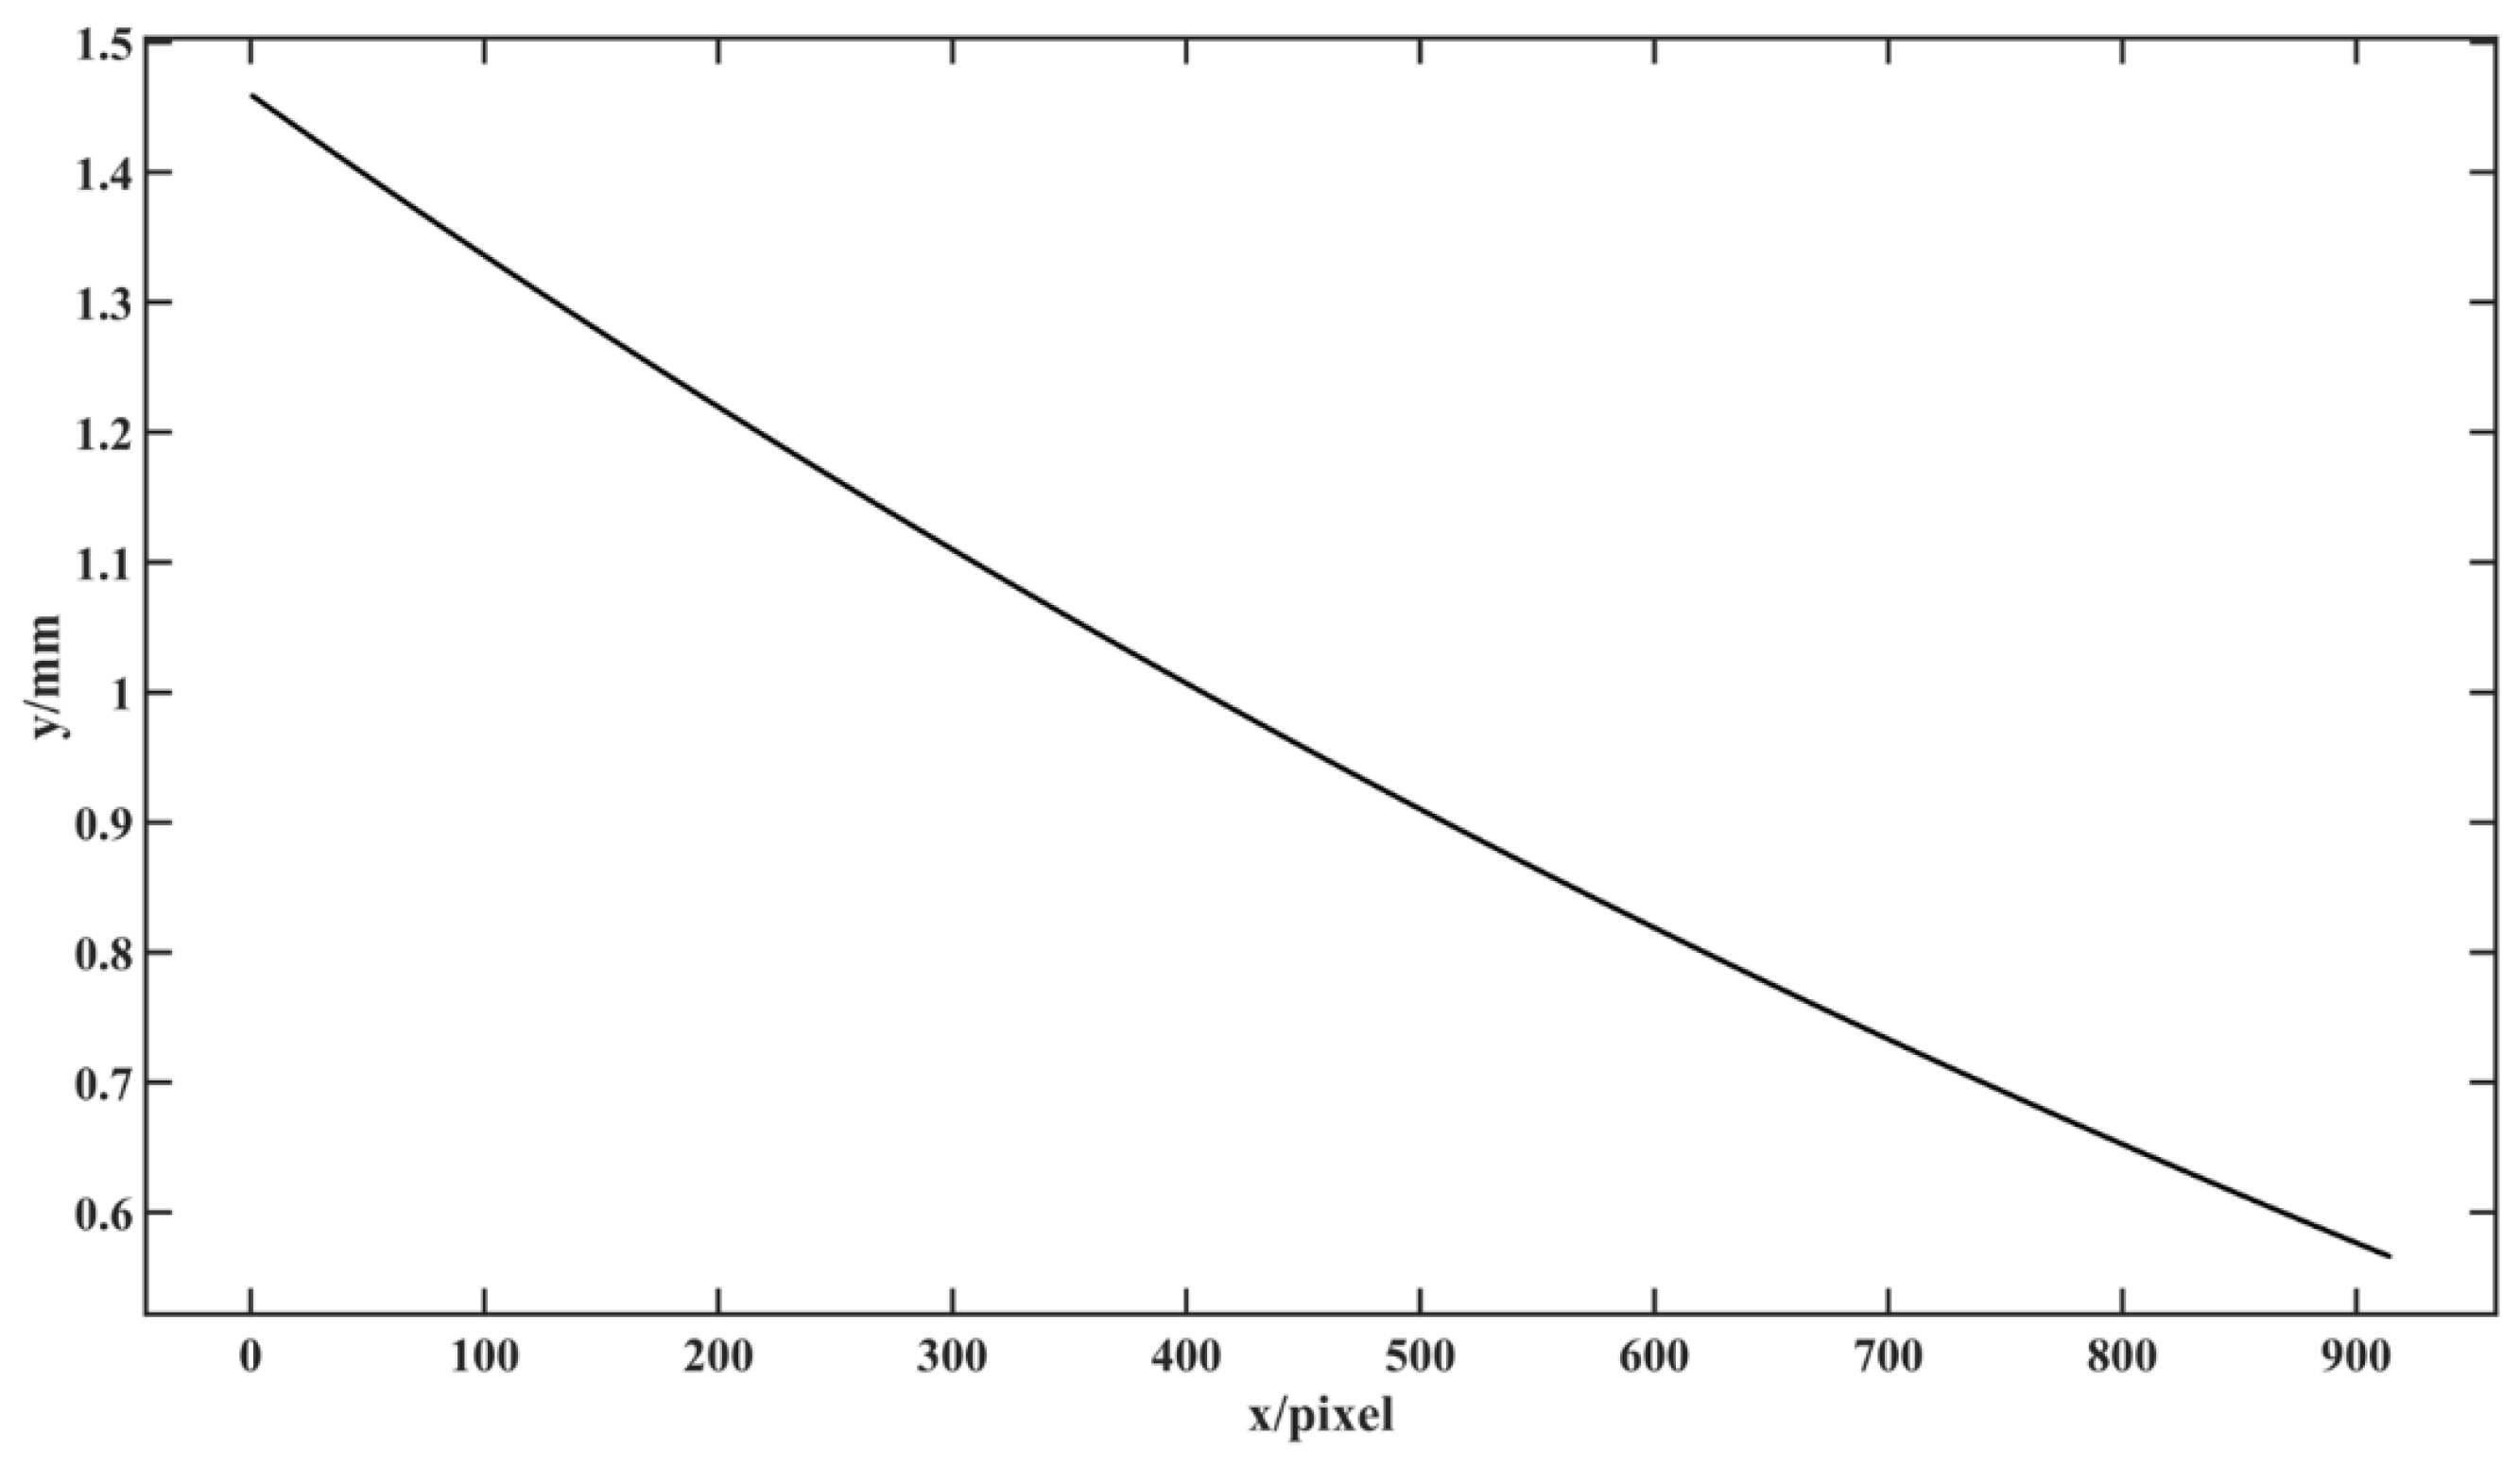
- Performed Step 8. The depth measurement error image of the standard plane at the maximum measured depth of 1365.0000 mm before structural parameter correction is obtained as shown in Figure 5, and further at are displayed as the black curve in Figure 6, where y and x represent and , respectively, and then the maximum value of is 1.4586 mm. Therefore, the depth measurement error mm before structural parameter correction.
- Performed Step 9. The result was that mm, mm, and .
- Performed Step 10. The structural parameters were corrected, and then the analytical imaging model and the depth measurement value were obtained after structural parameter correction.
Continued data processing for to verify the performance our proposed method. The experimental data processing of followed exactly the same experimental data processing of . The depth measurement error image of the standard plane at the maximum measured depth of 1365.0000 mm after structural parameter correction was obtained as shown in Figure 7, and further, of the average value of the depth measurement error after structural parameter correction are displayed as the black curve in Figure 8, and then the maximum value of is 0.0432 mm. Therefore, the depth measurement error is mm after structural parameter correction. In contrast, the depth measurement error after structural parameter correction is reduced to 3% of that before structural parameter correction. The results show that the proposed method significantly reduces the DMECSPE.
In order to verify the adaptability of the proposed correction method to different spatial positions and directions, quantitative comparative measurement experiments before and after structural parameter correction were carried out by using the SLDI for standard planes at different depths, standard inclined planes with different slopes, and standard hemispheres with different radii.
In the simulation measurement experiment of the standard plane, the comparative experimental measurement before and after structural parameter correction is carried out for the standard planes at each depth position with a spacing of 72.0000 mm in the depth measurement range from 1000.0000 mm to 1292.0000 mm. The maximum values of depth measurement error for the standard planes at different depths before and after structural parameter correction are shown in Table 4. Figure 9 and Figure 10 are, respectively, the depth measurement error images of the standard plane at a depth of 1146.0000 mm before and after structural parameter correction. Figure 11 and Figure 12 are, respectively, the average curves of the depth measurement errors before and after structural parameter correction at the plane depth of 1146.0000 mm and , where y represents the average value of the depth measurement errors and x represents . By comparing Figure 9 and Figure 10, as well as Figure 11 and Figure 12, we can see that the proposed method significantly reduces the depth measurement error of the plane caused by structural parameter errors. It can be seen from Table 4 that the depth measurement error of the plane after structural parameter correction is reduced to less than 3.5% of that before structural parameter correction.
In the simulation measurement experiment of the standard inclined plane, the standard plane at the depth of 1143.022 mm is rotated 15°, 30°, 45°, 60°, and 75° around the x-axis and y-axis of the world coordinate system , respectively, to form standard inclined planes with different slopes, and then the comparative experimental measurement before and after structural parameter correction is carried out for each standard inclined plane. The maximum values of depth measurement error for the standard inclined planes with different slopes before and after structural parameter correction are shown in Table 5. Figure 13 and Figure 14, respectively, show the depth measurement error images of the standard inclined plane formed by rotating the standard plane by 30° around the x-axis and y-axis before and after structural parameter correction. By comparing Figure 13 and Figure 14, we can see that the proposed method significantly reduces the depth measurement error of the inclined plane caused by structural parameter errors. It can be seen from Table 5 that the depth measurement errors of the inclined plane after structural parameter correction is reduced to less than 5% of that before structural parameter correction.
In the simulation measurement experiment of the standard hemispheres, the comparative experimental measurement before and after structural parameter correction is carried out for the standard hemispheres with spherical center coordinates (−92.4340 mm, 1365.0000 mm, 0 mm) and the radii of 90.0000 mm, 130.0000 mm, 170.0000 mm, 210.0000 mm, and 250.0000 mm, respectively. The maximum values of depth measurement error for the standard hemispheres with different radii before and after structural parameter correction are shown in Table 6. Figure 15 and Figure 16, respectively, show the depth measurement error images of the standard hemisphere with a radius of 250.0000 mm before and after structural parameter correction. By comparing Figure 15 and Figure 16, we can see that the proposed method significantly reduces the depth measurement error of the hemisphere caused by structural parameter errors. It can be seen from Table 6 that the depth measurement errors of the hemisphere after structural parameter correction is reduced to less than 4% of that before structural parameter correction.
We also assembled the experimental equipment of SLDI to qualitatively verify the performance of our proposed method. Our main equipment included a DLP projector (Texas Instruments, Dallas, Texas, USA, model: DLP4710EVM-LC) and a 3CCD camera (JAI, Miyazaki, Japan, model: AT-200GE) attached with a 20 mm lens (model: BV-L1020), and its parameters were exactly the same as those of our simulated SLDI except for the focal length of the camera lens, and the projection angle is obtained using Gray code plus fringe method [20]. The attitude position of the camera is adjusted according to the design value of the structural parameters in the process of device assembly, because the attitude position of the camera in the device is adjustable. However, it is difficult to accurately adjust the structural parameters to their design values in the assembly process because the central position and focal length of the camera lens are invisible. Therefore, the proposed method is used to correct the structural parameters.
We measured a more complex scene to visually demonstrate the success of our proposed method. Figure 17 shows the scene photograph, and the scene includes Statue A of Agrippa with complex morphology, Steel-plate B with bright feature points on dark surface, Shadow C, and Background D, and Figure 18 shows the 3D reconstructed result of the scene. This experiment demonstrated that the proposed method can reconstruct complex 3D surfaces with fine details, isolated surfaces, and surfaces with a sharp contrast between light and dark. It is important to point out that the experimental result is only a qualitative result, as shown in Figure 18, and a good depth imaging effect could be obtained by the method. The work does not provide the comparative analysis of the DMECSPE before and after correction. This is because in the actual measurement experiments, the depth measurement error of the SLDI includes the depth measurement error caused by both the phase measurement error and the structure parameter error. The depth measurement error caused by the latter is difficult to clearly observe because it is submerged by that caused by the former, and the former is complex and difficult to control in the actual measurement experiments. In addition, the depth measurement errors caused by the latter were only analyzed and corrected in this work, so it is difficult to quantitatively express the comparison of depth measurement errors before and after structural parameter correction.
5. Discussion
The projective geometric model was used in the existing SLDI to obtain the depth image, and all the parameters of the projective geometric model need to be adjusted to ensure the accuracy of the depth measurement. Each of these parameters is affected by many factors at the same time, such as structural parameter error and phase measurement error. Therefore, the influence law is complex. As a result, these parameters are difficult to adjust accurately. The depth measurement accuracy of the structured optical imager is limited, and it is difficult to be widely used in the field of precision manufacturing. The analytical imaging model is used to obtain the depth image, analyze the depth measurement error caused by the structure parameter error and phase measurement error, and reduce the depth measurement error by adjusting those errors, respectively. It is expected to be an effective way to improve the depth measurement accuracy of SLDI. Aiming at three structural parameters, an analytical imaging model and a model of DMECSPE are established. The adjustment method of structural parameters is proposed, which realizes the accurate adjustment of structural parameters and effectively reduces the depth measurement error caused by the error of structural parameters. Though many works were carried out about the depth measurement errors caused by structural parameters, the existing results either stop at the optimal selection of structural parameters [15,16,17] or stay at the level of qualitative error analysis [18,19], and there is nearly no work to quantitatively analyze and correct the DMECSPE.
The simulation quantitative measurement experiments were carried out in this paper, and for the measured surfaces in different positions and different directions, the results proved that the proposed method can reduce the DMECSPE to less than 5% of that before the structural parameter correction. In addition, the actual qualitative measurement experiments were also carried out, and the results verified that the proposed method has a good depth imaging effect. The work does not provide the quantitative measurement experimental results for the etalon, so it is difficult to fully show the comparison of the changes of depth measurement errors before and after structural parameter correction. This is because in the actual measurement experiments, the depth measurement error of the SLDI includes the depth measurement error caused by both the phase measurement error and the structure parameter error. The depth measurement error caused by the latter is difficult to clearly observe because it is submerged by that caused by the former, and the former is complex and difficult to control in the actual measurement experiments.
In this work, the depth measurement error caused by structural parameter error was analyzed and corrected. Therefore, the analysis and correction of depth measurement errors caused by phase measurement errors will be an interesting work. Decouple those factors that affect the phase measurement error and obtain the influence law of a single factor on the phase measurement error, so as to independently correct the phase measurement error caused by each influence factor, and then higher accuracy depth measurement can be achieved. Moreover, the verification experiments show that the proposed method is simple and easy to implement.
6. Conclusions
This paper has presented a method for correcting the structural parameters of SLDI, which significantly reduced the DMECSPE. According to the quantitative comparison of the simulation measurement results, the proposed method can reduce the DMECSPE to less than 5% of that before the structural parameter correction. The qualitative actual measurement experimental results show that the proposed method can obtain a depth image with good visual effect for isolated surfaces and surfaces with a sharp contrast between light and dark. Although the phase measurement error is not taken into account in this paper, our proposed method provides an effective way and a new technical means to improve the measurement accuracy of SLDI.
Author Contributions
Conceptualization, S.Y. and X.Y.; methodology, S.Y. and X.Y.; software, S.Y. and H.G.; validation, S.Y., H.G. and W.Y.; formal analysis, H.G., W.Y. and Y.Z.; investigation, S.Y., H.G. and X.S.; resources, H.W. and W.Y.; data curation, H.G. and Y.Z.; writing—original draft preparation, S.Y.; writing—review and editing, X.Y.; visualization, S.Y. and H.G.; supervision, X.Y. and H.W.; project administration, S.Y. and X.Y.; funding acquisition, S.Y., H.W. and X.Y. All authors have read and agreed to the published version of the manuscript.
Funding
This research was funded by the Heilongjiang Provincial Postdoctoral Science Foundation (grant number LBH-Z19071) and the Natural Science Foundation of Heilongjiang Province (grant number LH2023F034).
Institutional Review Board Statement
Not applicable.
Informed Consent Statement
Not applicable.
Data Availability Statement
The data underlying the results presented in this paper are not publicly available at this time but may be obtained from the authors upon reasonable request.
Conflicts of Interest
The authors declare no conflicts of interest.
References
- Cui, B.; Tao, W.; Zhao, H. High-precision 3D reconstruction for small-to-medium-sized objects utilizing line-structured light scanning: A review. Remote Sens. 2021, 13, 4457. [Google Scholar] [CrossRef]
- Nape, I.; Sephton, B.; Ornelas, P.; Moodley, C.; Forbes, A. Quantum structured light in high dimensions. APL Photonics 2023, 8, 051101. [Google Scholar] [CrossRef]
- Costantino, D.; Angelini, M.G.; Mazzone, F. Integrated survey methodology for the crime reconstruction. Imaging Sci. J. 2016, 64, 341–351. [Google Scholar] [CrossRef]
- Huang, J.; Qi, M.; Wang, Z.; Li, Z.; Gao, J. A high precision measurement method of large-size turbine blade based on structured light 3D measurement. In Proceedings of the SPIE’s 8th Symposium on Novel Photoelectronic Detection Technology and Applications, Kunming, China, 7–9 December 2021. [Google Scholar]
- You, K.; Zhang, N. Comparative study on the accuracy of five kinds of intraoral scanners and scanning quality evaluation based on scanning models. Chin. J. Prosthodont. 2023, 24, 259–265. [Google Scholar]
- Ye, Y.; Song, Z.; Zhao, J. High-fidelity 3D real-time facial animation using infrared structured light sensing system. Comput. Graph. 2022, 104, 46–58. [Google Scholar] [CrossRef]
- Lu, J.; Zhang, J.; Ye, M.; Mi, H. Review of the calibration of a structured light system. In Proceedings of the 46th Annual Conference of the IEEE Industrial Electronics Society, Singapore, 19–21 October 2020. [Google Scholar]
- Zhang, S. Flexible structured light system calibration method with all digital features. Opt. Express 2023, 31, 17076–17086. [Google Scholar] [CrossRef] [PubMed]
- Xu, J.; Zhang, S. Status, challenges, and future perspectives of fringe projection profilometry. Opt. Lasers Eng. 2020, 135, 106193. [Google Scholar] [CrossRef]
- Zhang, S. High-speed 3D shape measurement with structured light methods: A review. Opt. Laser. Eng. 2018, 106, 119–131. [Google Scholar] [CrossRef]
- Liu, Y.; Zhang, G.; Hu, P.; Deng, H.; Yang, S. High-precision structured-light 3D measurement method based on multi-view Scheimpflug imaging. Chin. J. Sci. Instrum. 2023, 44, 33–40. [Google Scholar]
- Chen, Z.; Wu, C.; Shen, P. Error model analysis of computer vision photogrammetry system. J. Comput.-Aided Des. Comput. Graph. 2002, 14, 389–393. [Google Scholar]
- Zheng, D.; Shen, Y.; Liu, C. 3D laser scanner and its effect factor analysis of surveying error. Eng. Surv. Mapp. 2005, 14, 32–34+56. [Google Scholar]
- Zhang, J.; Pan, X.; He, L.; Yang, Z.; Guo, X.; Kang, W. Error analysis of optical system for full-view and high-precision three-dimensional measuring instrument. J. Appl. Opt. 2018, 39, 392–399. [Google Scholar]
- Wang, Y.; Li, X.; Zhang, D.; Jia, S. Optimal design of structural parameters of binocular stereo visual sensor. J. Tianjin Uni. Sci. Tech. 2010, 25, 58–60+70. [Google Scholar]
- Ding, X.; Zhao, Q.; Wang, X.; Zhao, Y. Posture parameters optimization of a structured light 3D angle measuring system. J. Hebei Uni. Sci. Tech. 2015, 36, 467–473. [Google Scholar]
- Gerbino, S.; Del Giudice, D.M.; Staiano, G.; Lanzotti, A.; Martorelli, M. On the influence of scanning factors on the laser scanner-based 3D Inspection process. Int. J. Adv. Manuf. Technol. 2016, 84, 1787–1799. [Google Scholar] [CrossRef]
- Zhang, P.; Zhang, Z.; Hu, L.; Luan, S. Calibration error simulating analysis of binocular vision based on pinhole camera model. Electron. Opt. Control 2009, 12, 65–69. [Google Scholar]
- Lin, J.; Li, L.; Huang, X.; Jiang, Y.; Zhao, Z. Analysis of detecting error of laser scanning system based on T-Scan. Aeronaut. Manuf. Tech. 2019, 62, 95–100. [Google Scholar]
- Yu, S.; Gong, T.; Wu, H.; Sun, X.; Zhao, Y.; Wu, S.; Yu, X. 3D shape measurement based on the unequal-period combination of shifting Gray code and dual-frequency phase-shifting fringes. Opt. Commun. 2022, 516, 128236. [Google Scholar] [CrossRef]
Figure 1.
Spatial position diagram of the camera.

Figure 2.
Spatial distribution of when .

Figure 3.
Spatial distribution of when .

Figure 4.
Spatial distribution of when .

Figure 5.
The depth measurement error image of the standard plane before structural parameter correction.
Figure 5.
The depth measurement error image of the standard plane before structural parameter correction.

Figure 6.
Curve of before structural parameter correction.

Figure 7.
The depth measurement error image of the standard plane after structural parameter correction.
Figure 7.
The depth measurement error image of the standard plane after structural parameter correction.

Figure 8.
Curve of after structural parameter correction.

Figure 9.
The depth measurement error image of the standard plane at a depth of 1146.0000 mm before structural parameter correction.
Figure 9.
The depth measurement error image of the standard plane at a depth of 1146.0000 mm before structural parameter correction.

Figure 10.
The depth measurement error image of the standard plane at a depth of 1146.0000 mm after structural parameter correction.
Figure 10.
The depth measurement error image of the standard plane at a depth of 1146.0000 mm after structural parameter correction.

Figure 11.
Average curve of the depth measurement errors before structural parameter correction at the plane depth of 1146.0000 mm and .
Figure 11.
Average curve of the depth measurement errors before structural parameter correction at the plane depth of 1146.0000 mm and .

Figure 12.
Average curve of the depth measurement errors after structural parameter correction at the plane depth of 1146.0000 mm and .
Figure 12.
Average curve of the depth measurement errors after structural parameter correction at the plane depth of 1146.0000 mm and .

Figure 13.
The depth measurement error image of the standard inclined plane formed by rotating the standard plane by 30° around the x-axis and y-axis before structural parameter correction.
Figure 13.
The depth measurement error image of the standard inclined plane formed by rotating the standard plane by 30° around the x-axis and y-axis before structural parameter correction.

Figure 14.
The depth measurement error image of the standard inclined plane formed by rotating the standard plane by 30° around the x-axis and y-axis after structural parameter correction.
Figure 14.
The depth measurement error image of the standard inclined plane formed by rotating the standard plane by 30° around the x-axis and y-axis after structural parameter correction.

Figure 15.
The depth measurement error images of the standard hemisphere with a radius of 250.0000 mm before structural parameter correction.
Figure 15.
The depth measurement error images of the standard hemisphere with a radius of 250.0000 mm before structural parameter correction.

Figure 16.
The depth measurement error images of the standard hemisphere with a radius of 250.0000 mm after structural parameter correction.
Figure 16.
The depth measurement error images of the standard hemisphere with a radius of 250.0000 mm after structural parameter correction.

Figure 17.
Photograph of the scene.

Figure 18.
Reconstructed result of the scene.


Table 1.
Experimental data of when , /mm.
| 1a | 2a | 3a | 4a | 5a | 6a | 7a | 8a | 9a | 10a | |
| 0.05122 | 0.10244 | 0.15365 | 0.20488 | 0.25610 | 0.30732 | 0.35854 | 0.40976 | 0.46097 | 0.5122 |
Table 2.
Experimental data of when , /mm.
| 1b | 2b | 3b | 4b | 5b | 6b | 7b | 8b | 9b | 10b | |
|---|---|---|---|---|---|---|---|---|---|---|
| 1 | 0.04310 | 0.08619 | 0.12928 | 0.17237 | 0.21545 | 0.25853 | 0.30160 | 0.34468 | 0.38775 | 0.43081 |
| 914 | −0.03474 | −0.06948 | −0.10421 | −0.13894 | −0.17366 | −0.20837 | −0.24308 | −0.27778 | −0.31247 | −0.34716 |
Table 3.
Experimental data of when , /mm.
| 1c | 2c | 3c | 4c | 5c | 6c | 7c | 8c | 9c | 10c | |
|---|---|---|---|---|---|---|---|---|---|---|
| 1 | 0.05148 | 0.10296 | 0.15445 | 0.20594 | 0.25743 | 0.30893 | 0.36043 | 0.41193 | 0.46344 | 0.51495 |
| 914 | 0.04012 | 0.08025 | 0.12038 | 0.16051 | 0.20064 | 0.24078 | 0.28092 | 0.32105 | 0.36120 | 0.40134 |
Table 4.
The maximum values of depth measurement error for the standard planes at different depths before and after structural parameter correction, /mm.
Table 4.
The maximum values of depth measurement error for the standard planes at different depths before and after structural parameter correction, /mm.
| Depth | Maximum Values of Depth Measurement Error | |
|---|---|---|
| Before Correction | After Correction | |
| 1000.0000 | 0.8831 | 0.0298 |
| 1073.0000 | 0.9874 | 0.0324 |
| 1146.0000 | 1.0971 | 0.0350 |
| 1219.0000 | 1.2122 | 0.0377 |
| 1292.0000 | 1.3328 | 0.0405 |
Table 5.
The maximum values of depth measurement error for the standard inclined planes with different slopes before and after structural parameter correction.
Table 5.
The maximum values of depth measurement error for the standard inclined planes with different slopes before and after structural parameter correction.
| Rotation Angle around x-Axis | Rotation Angle around y-Axis | Maximum Values of Depth Measurement Error | |
|---|---|---|---|
| Before Correction | After Correction | ||
| 15° | 15° | 1.2646 mm | 0.0360 mm |
| 30° | 30° | 1.3016 mm | 0.0416 mm |
| 45° | 45° | 1.4016 mm | 0.0533 mm |
| 60° | 60° | 2.0327 mm | 0.0972 mm |
| 75° | 75° | 2.8968 mm | 0.1153 mm |
Table 6.
The maximum values of the depth measurement error for the standard hemispheres with different radii before and after structural parameter correction/mm.
Table 6.
The maximum values of the depth measurement error for the standard hemispheres with different radii before and after structural parameter correction/mm.
| Radius | Maximum Values of Depth Measurement Error | |
|---|---|---|
| Before Correction | After Correction | |
| 90.0000 | 1.0832 | 0.0409 |
| 130.0000 | 1.1586 | 0.0408 |
| 170.0000 | 1.2145 | 0.0414 |
| 210.0000 | 1.2806 | 0.0408 |
| 250.0000 | 1.3424 | 0.0400 |
Disclaimer/Publisher’s Note: The statements, opinions and data contained in all publications are solely those of the individual author(s) and contributor(s) and not of MDPI and/or the editor(s). MDPI and/or the editor(s) disclaim responsibility for any injury to people or property resulting from any ideas, methods, instructions or products referred to in the content. |
© 2024 by the authors. Licensee MDPI, Basel, Switzerland. This article is an open access article distributed under the terms and conditions of the Creative Commons Attribution (CC BY) license (https://creativecommons.org/licenses/by/4.0/).
Share and Cite
MDPI and ACS Style
Yu, S.; Guo, H.; Yang, W.; Zhao, Y.; Wu, H.; Sun, X.; Yu, X. Depth Measurement Error Analysis and Structural Parameter Correction of Structured Light Depth Imager. Photonics 2024, 11, 396. https://doi.org/10.3390/photonics11050396
AMA Style
Yu S, Guo H, Yang W, Zhao Y, Wu H, Sun X, Yu X. Depth Measurement Error Analysis and Structural Parameter Correction of Structured Light Depth Imager. Photonics. 2024; 11(5):396. https://doi.org/10.3390/photonics11050396
Chicago/Turabian StyleYu, Shuang, Haoran Guo, Wenlong Yang, Yanqiao Zhao, Haibin Wu, Xiaoming Sun, and Xiaoyang Yu. 2024. "Depth Measurement Error Analysis and Structural Parameter Correction of Structured Light Depth Imager" Photonics 11, no. 5: 396. https://doi.org/10.3390/photonics11050396
Note that from the first issue of 2016, this journal uses article numbers instead of page numbers. See further details here.