
Ti-Doped Co-Free Li1.2Mn0.6Ni0.2O2 Cathode Materials with Enhanced Electrochemical Performance for Lithium-Ion Batteries

 and
and
Abstract
:
1. Introduction
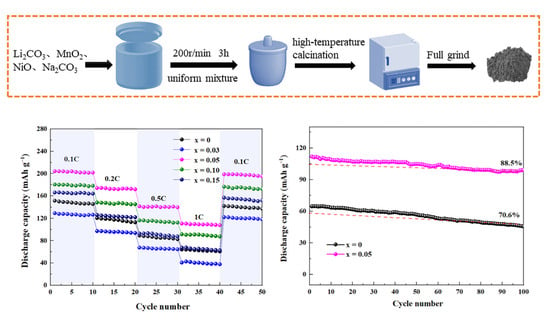
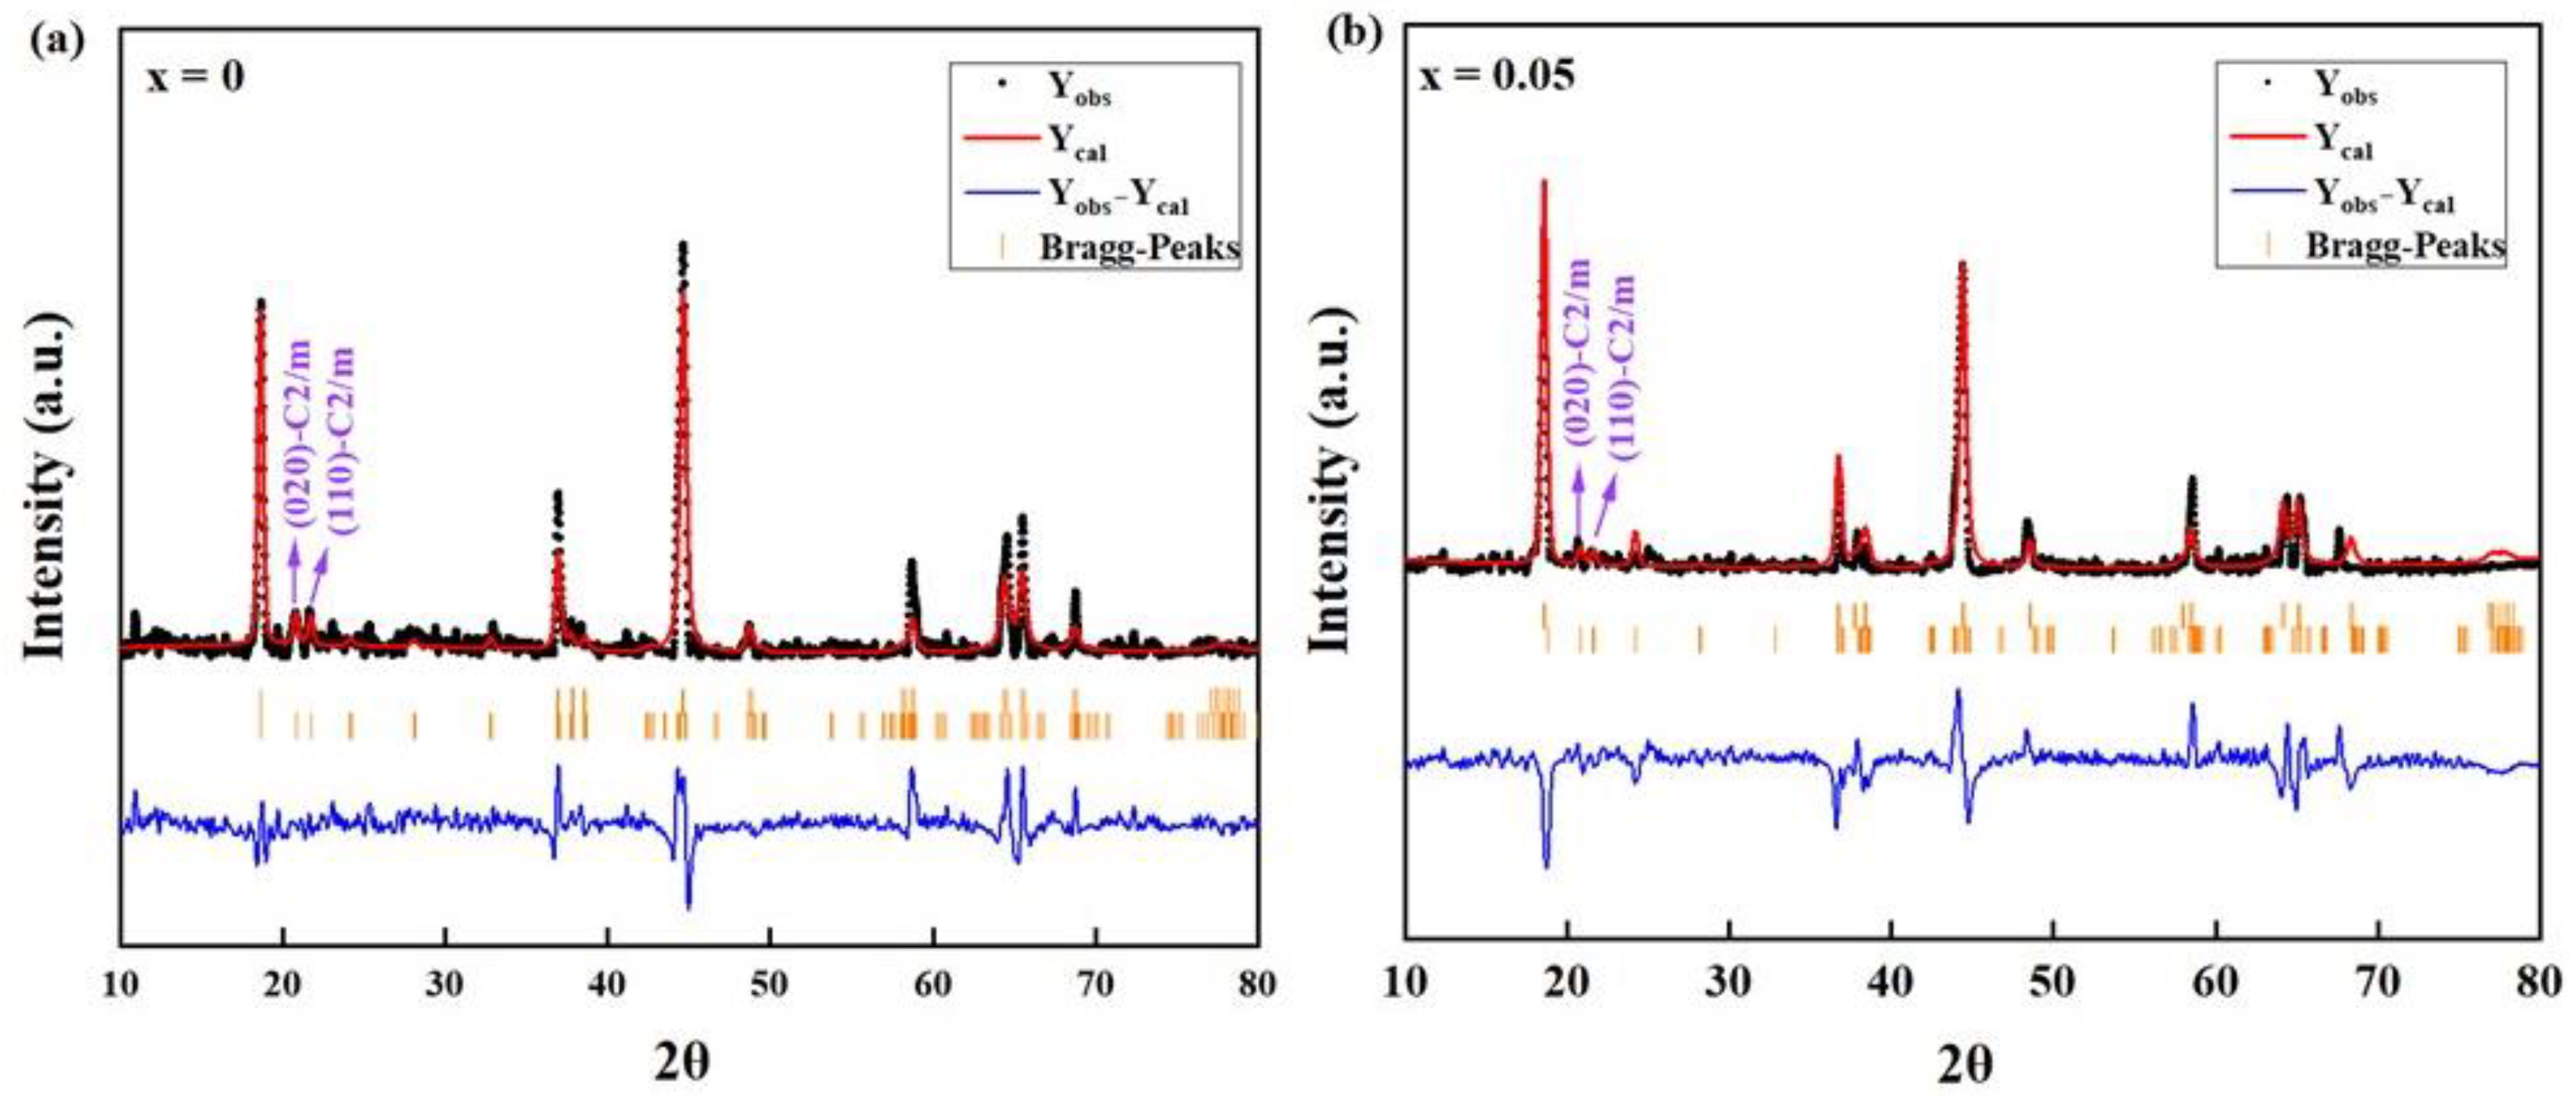
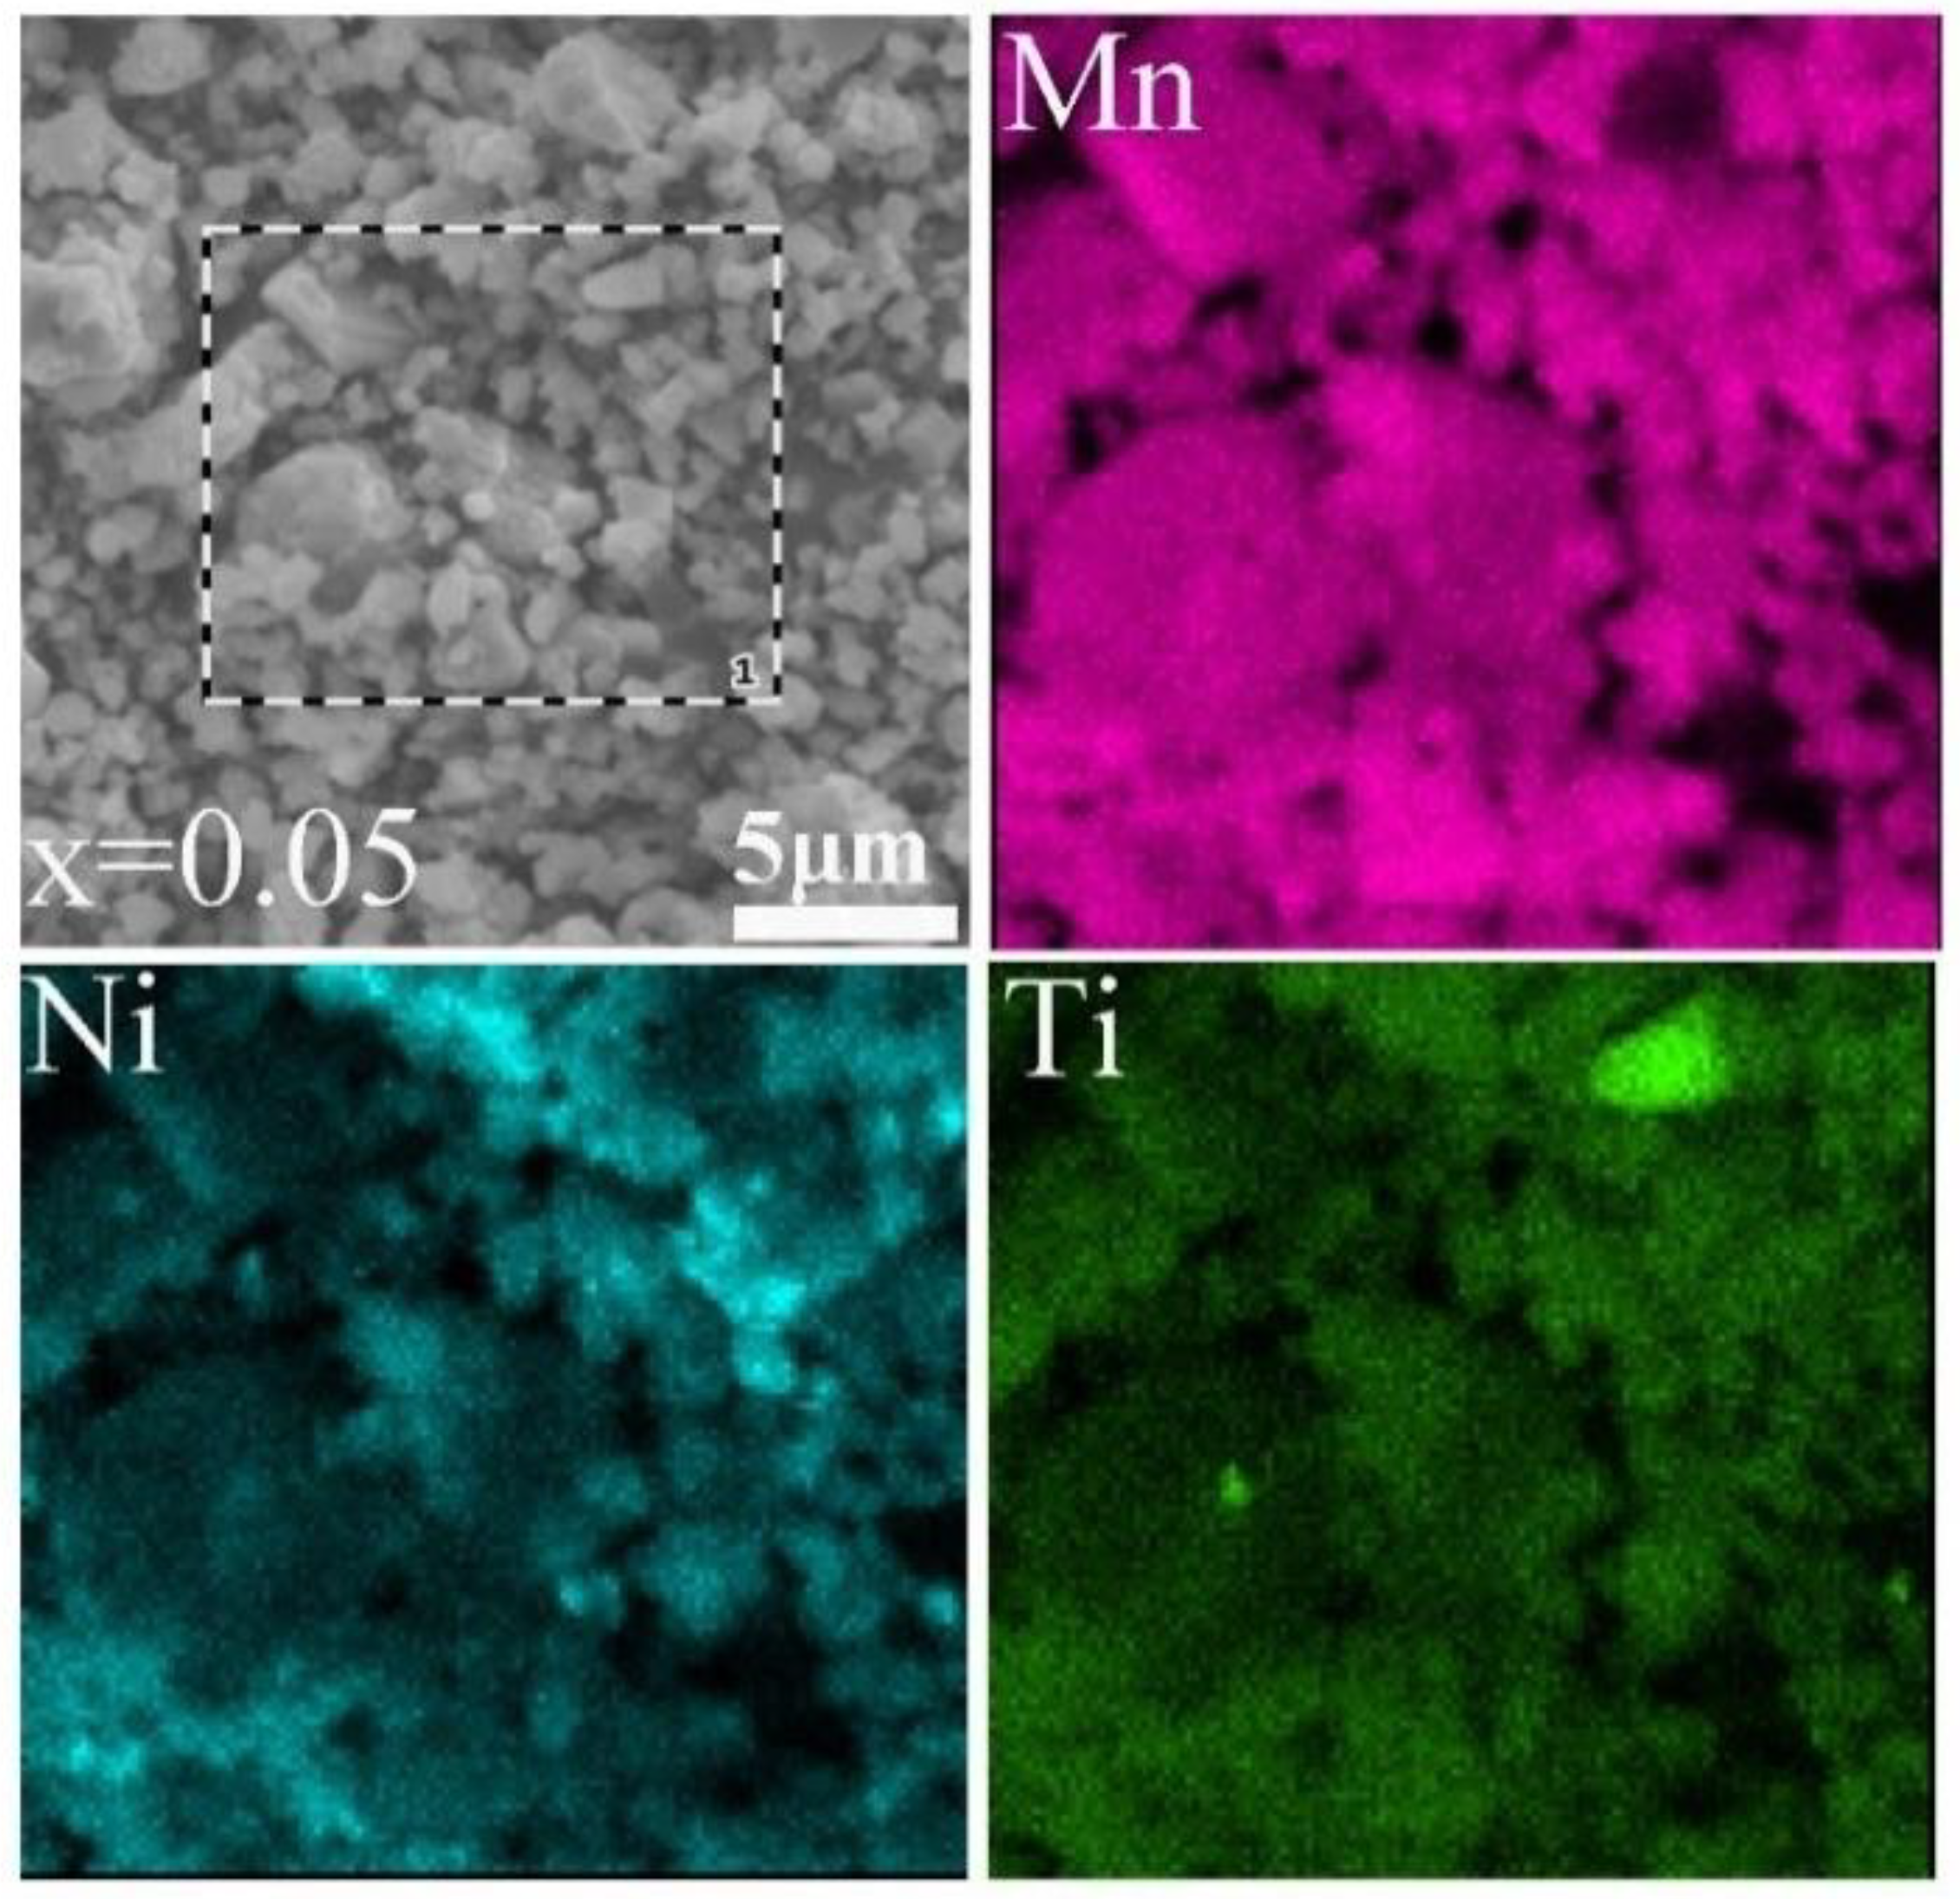
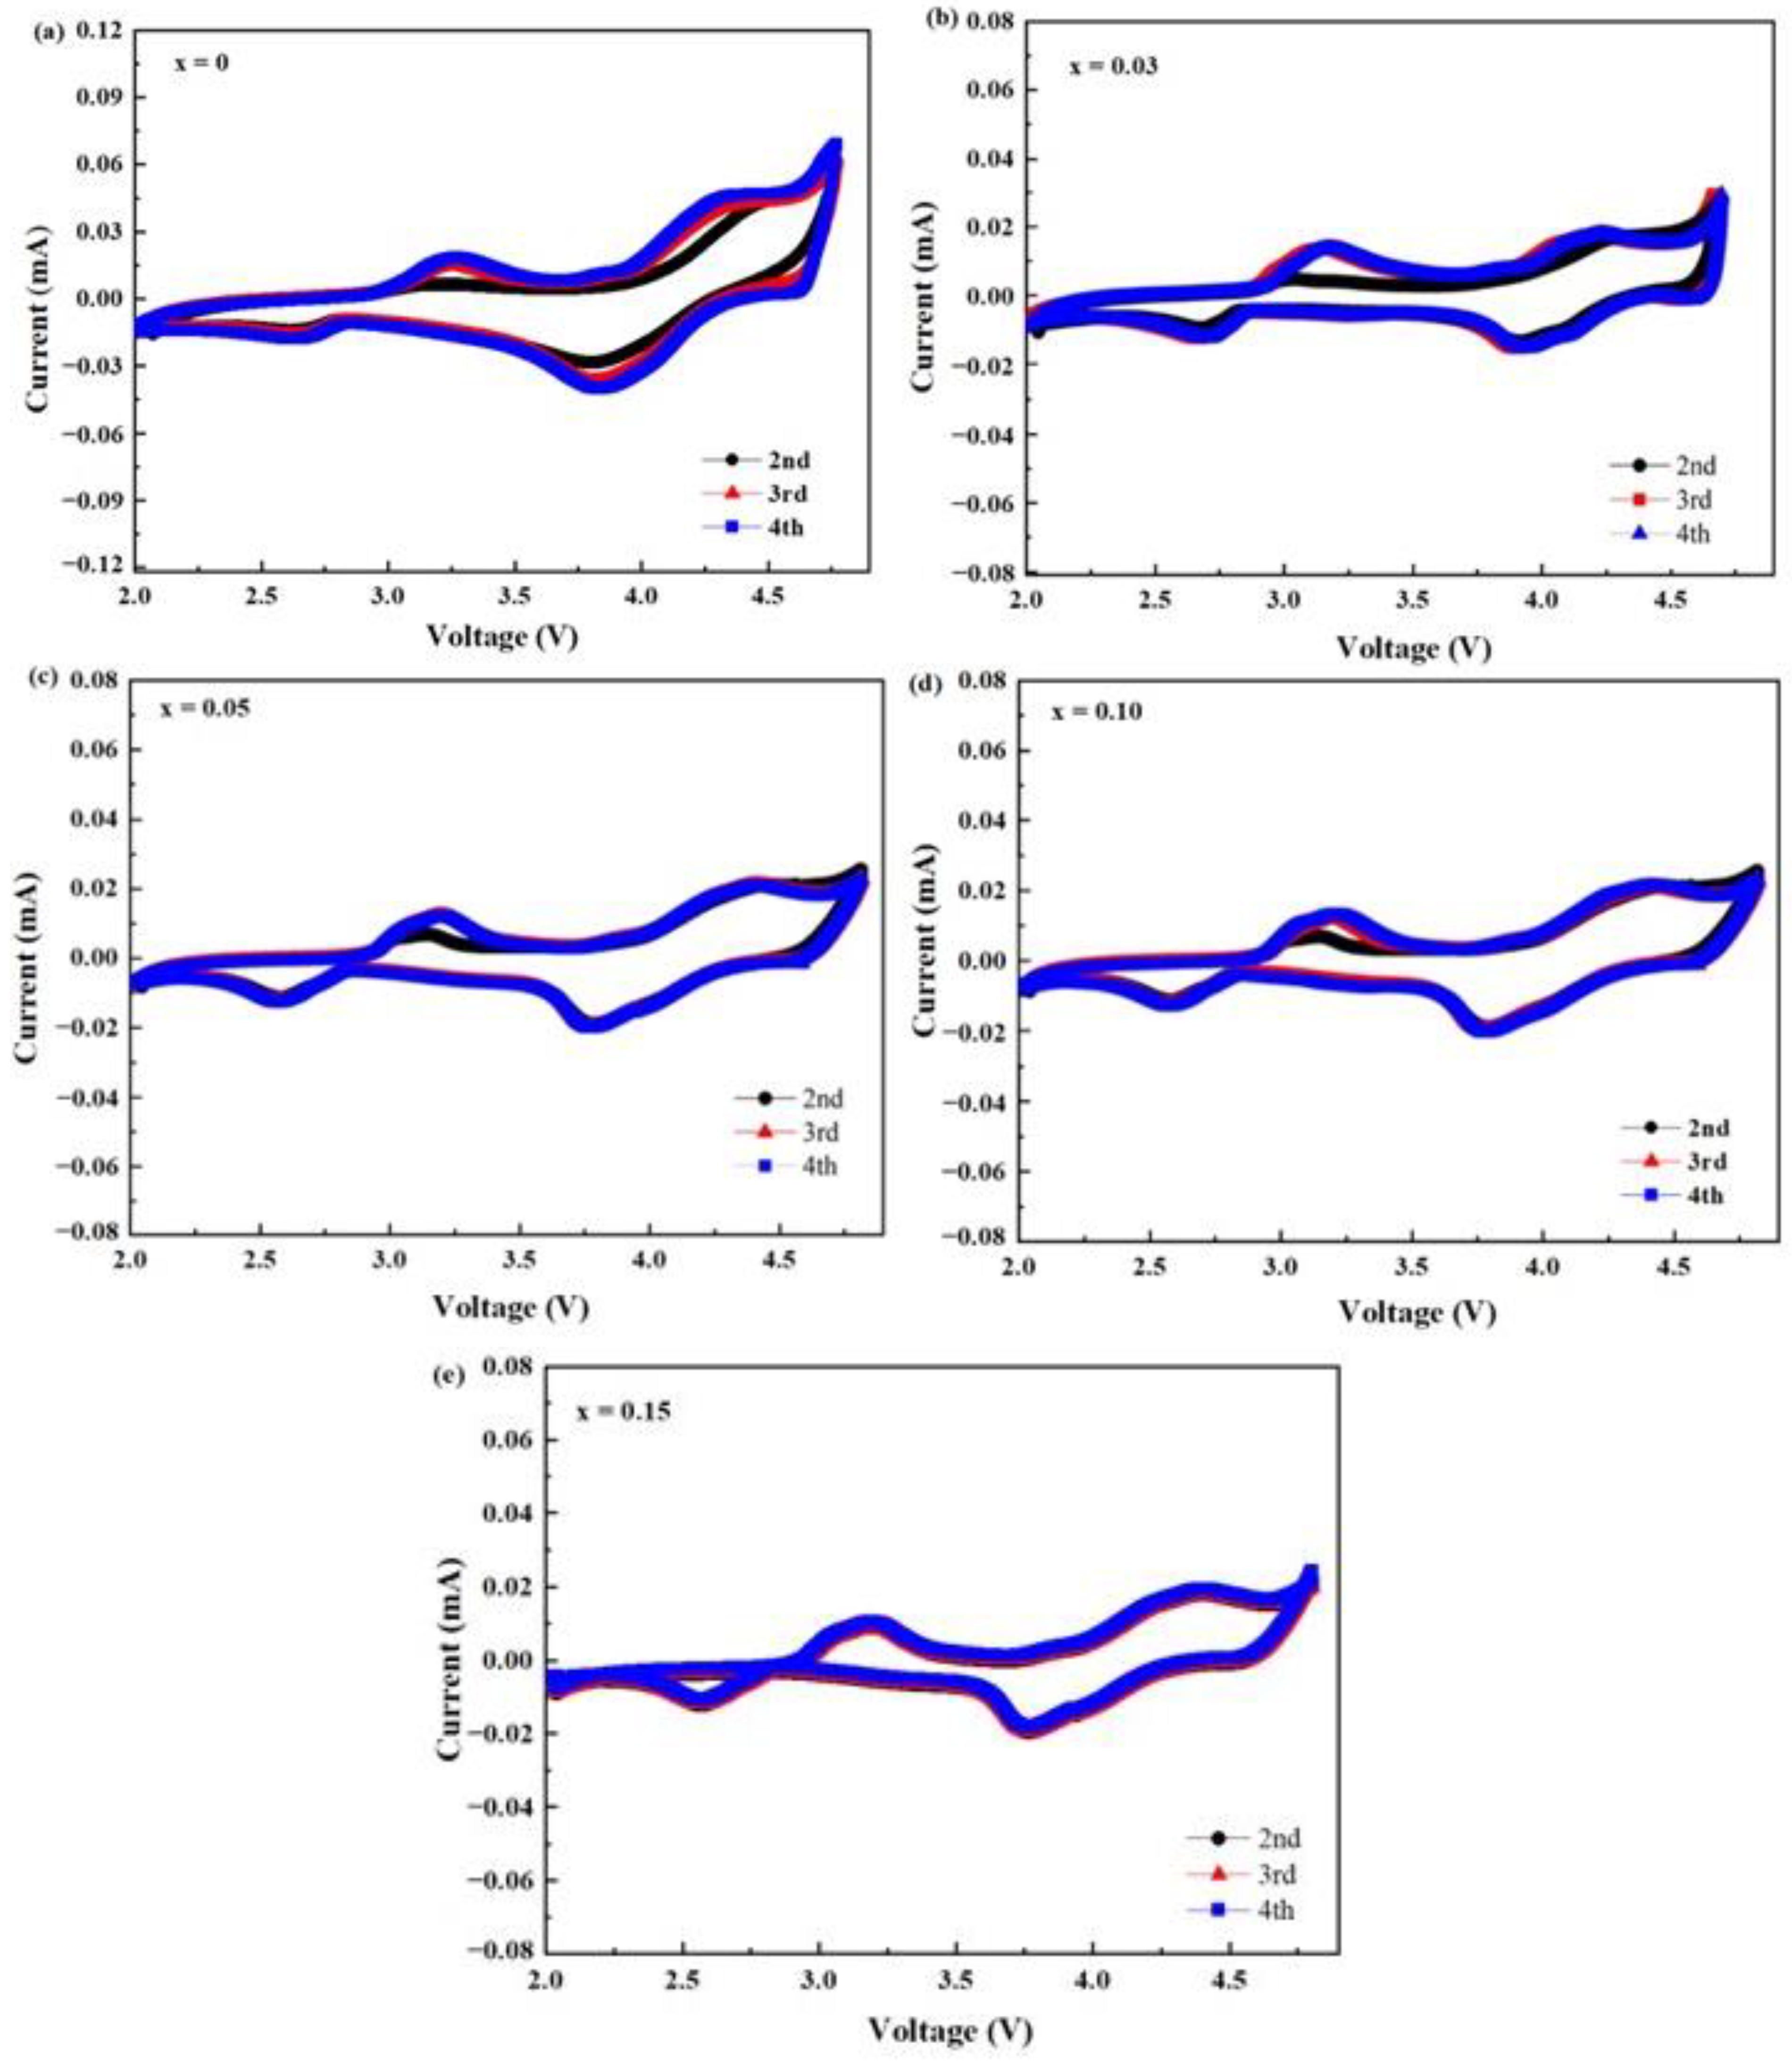
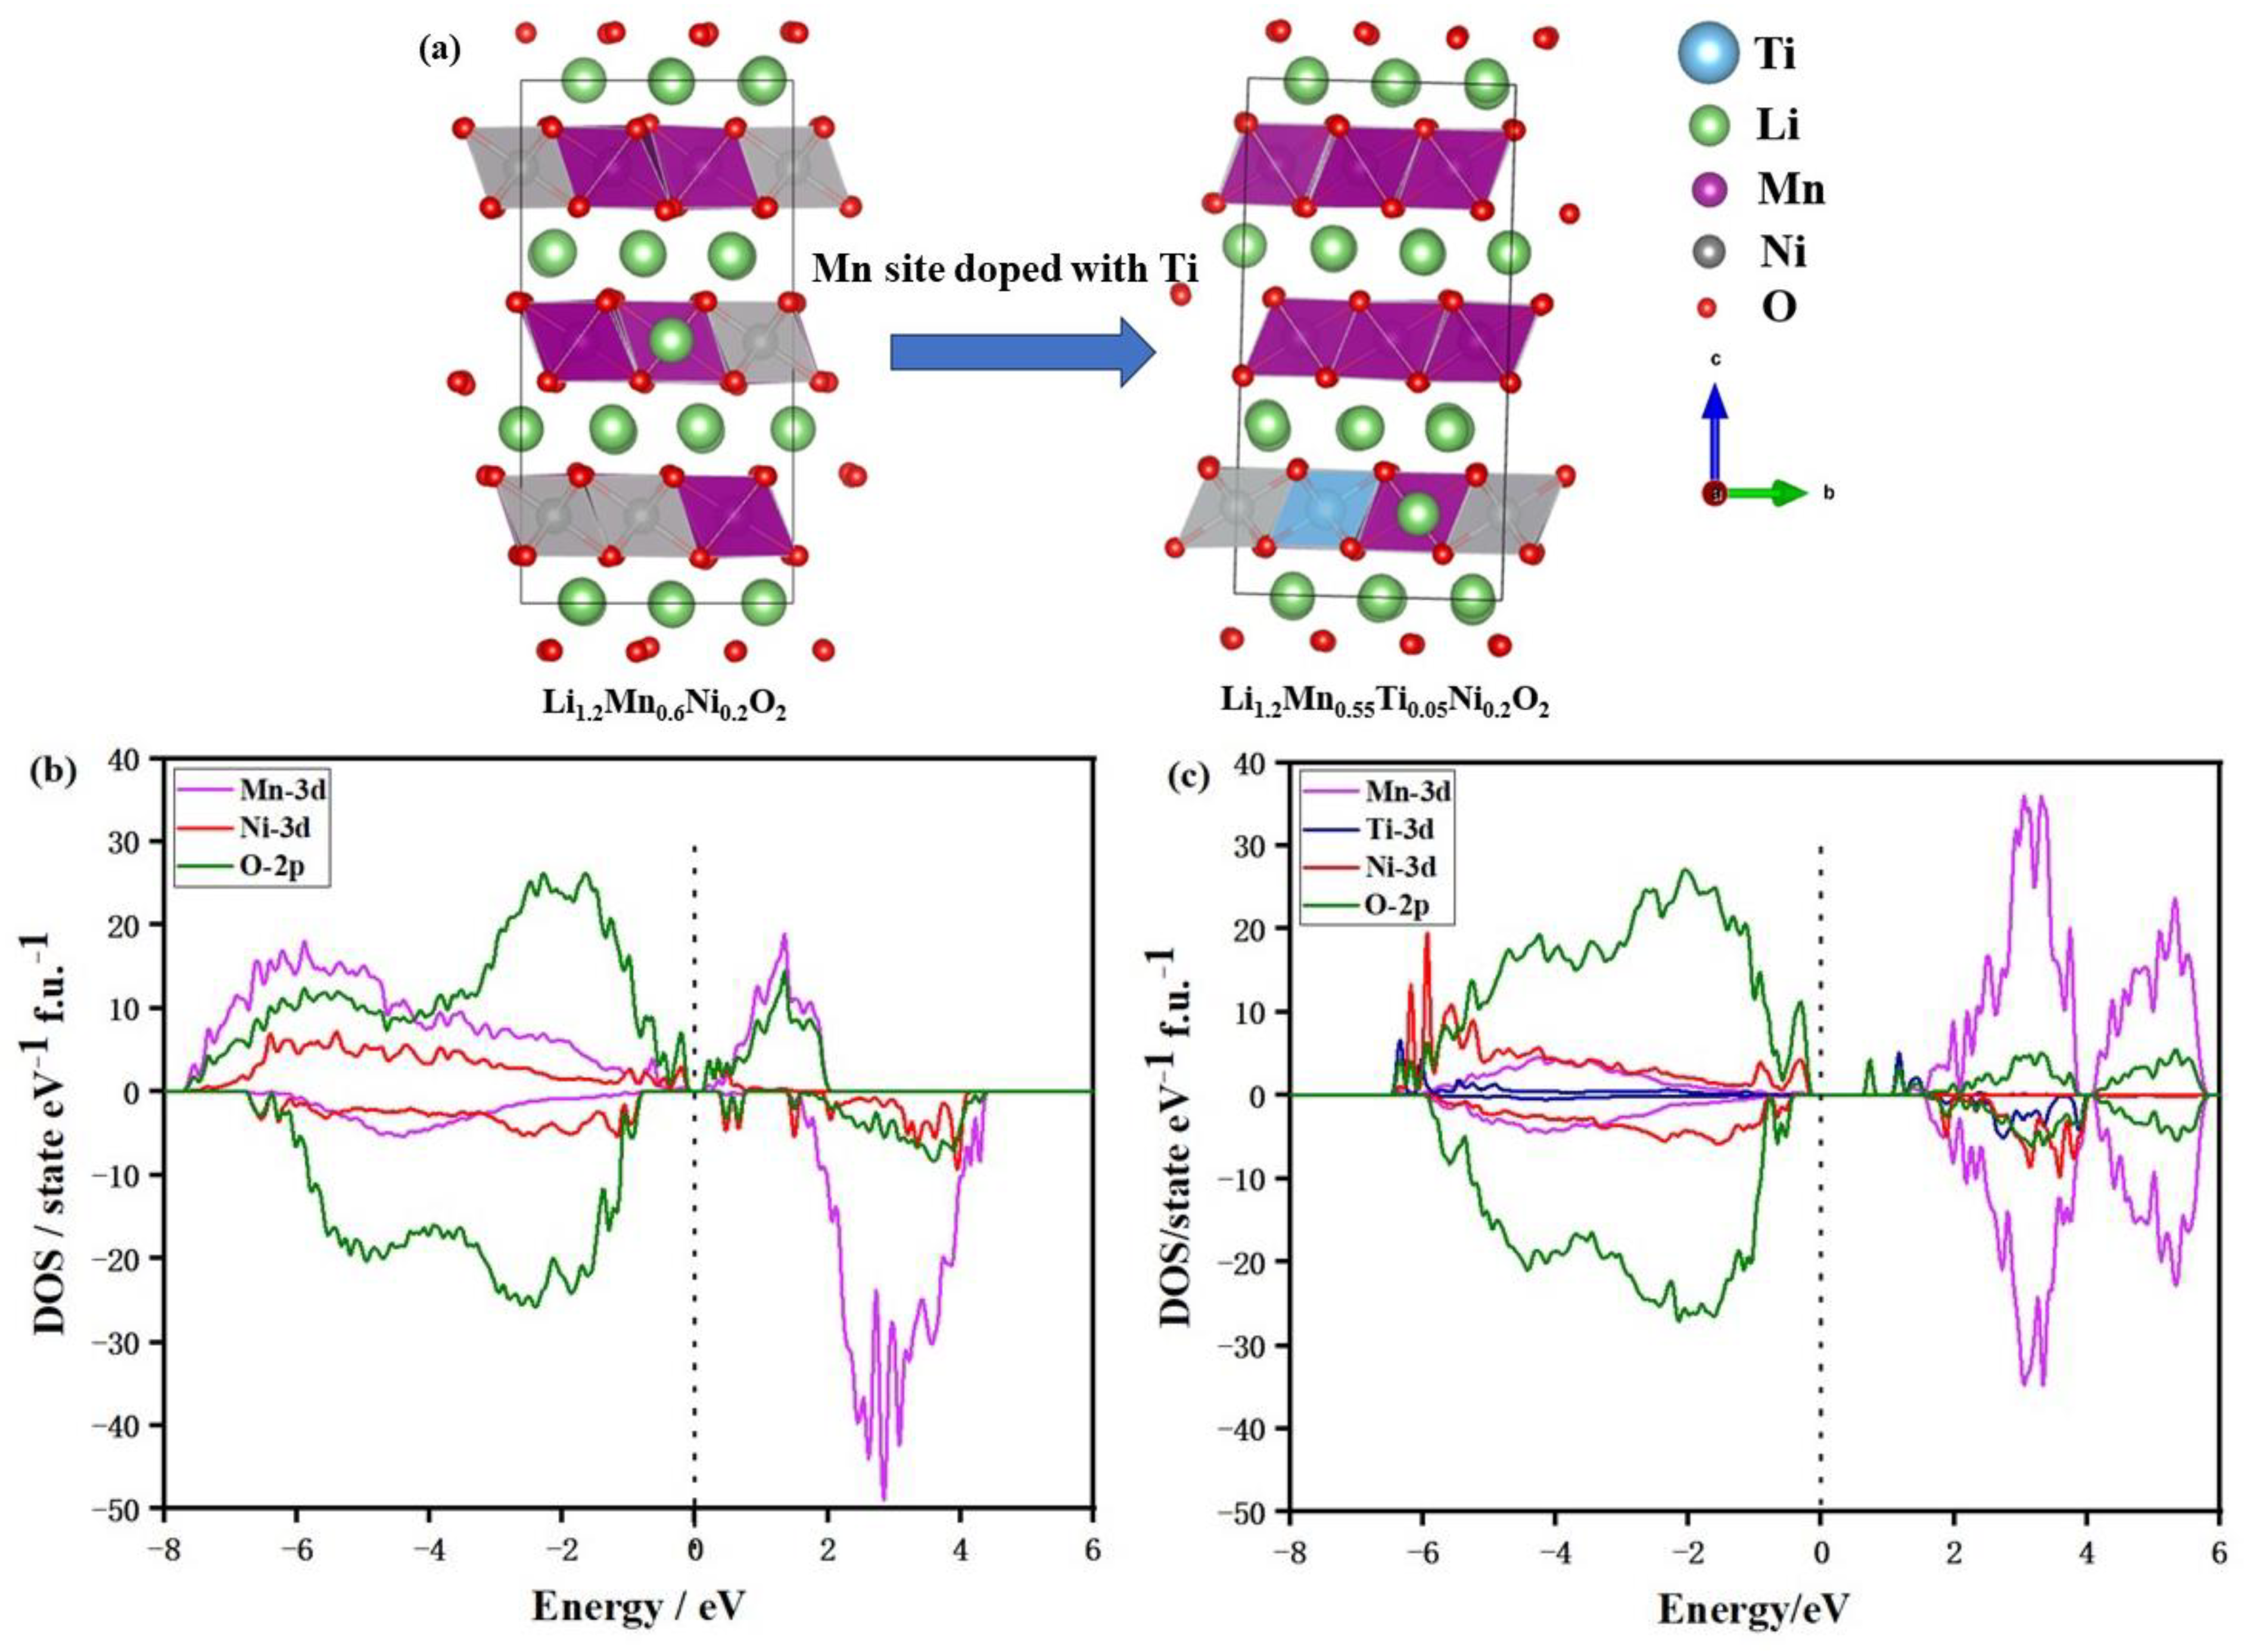
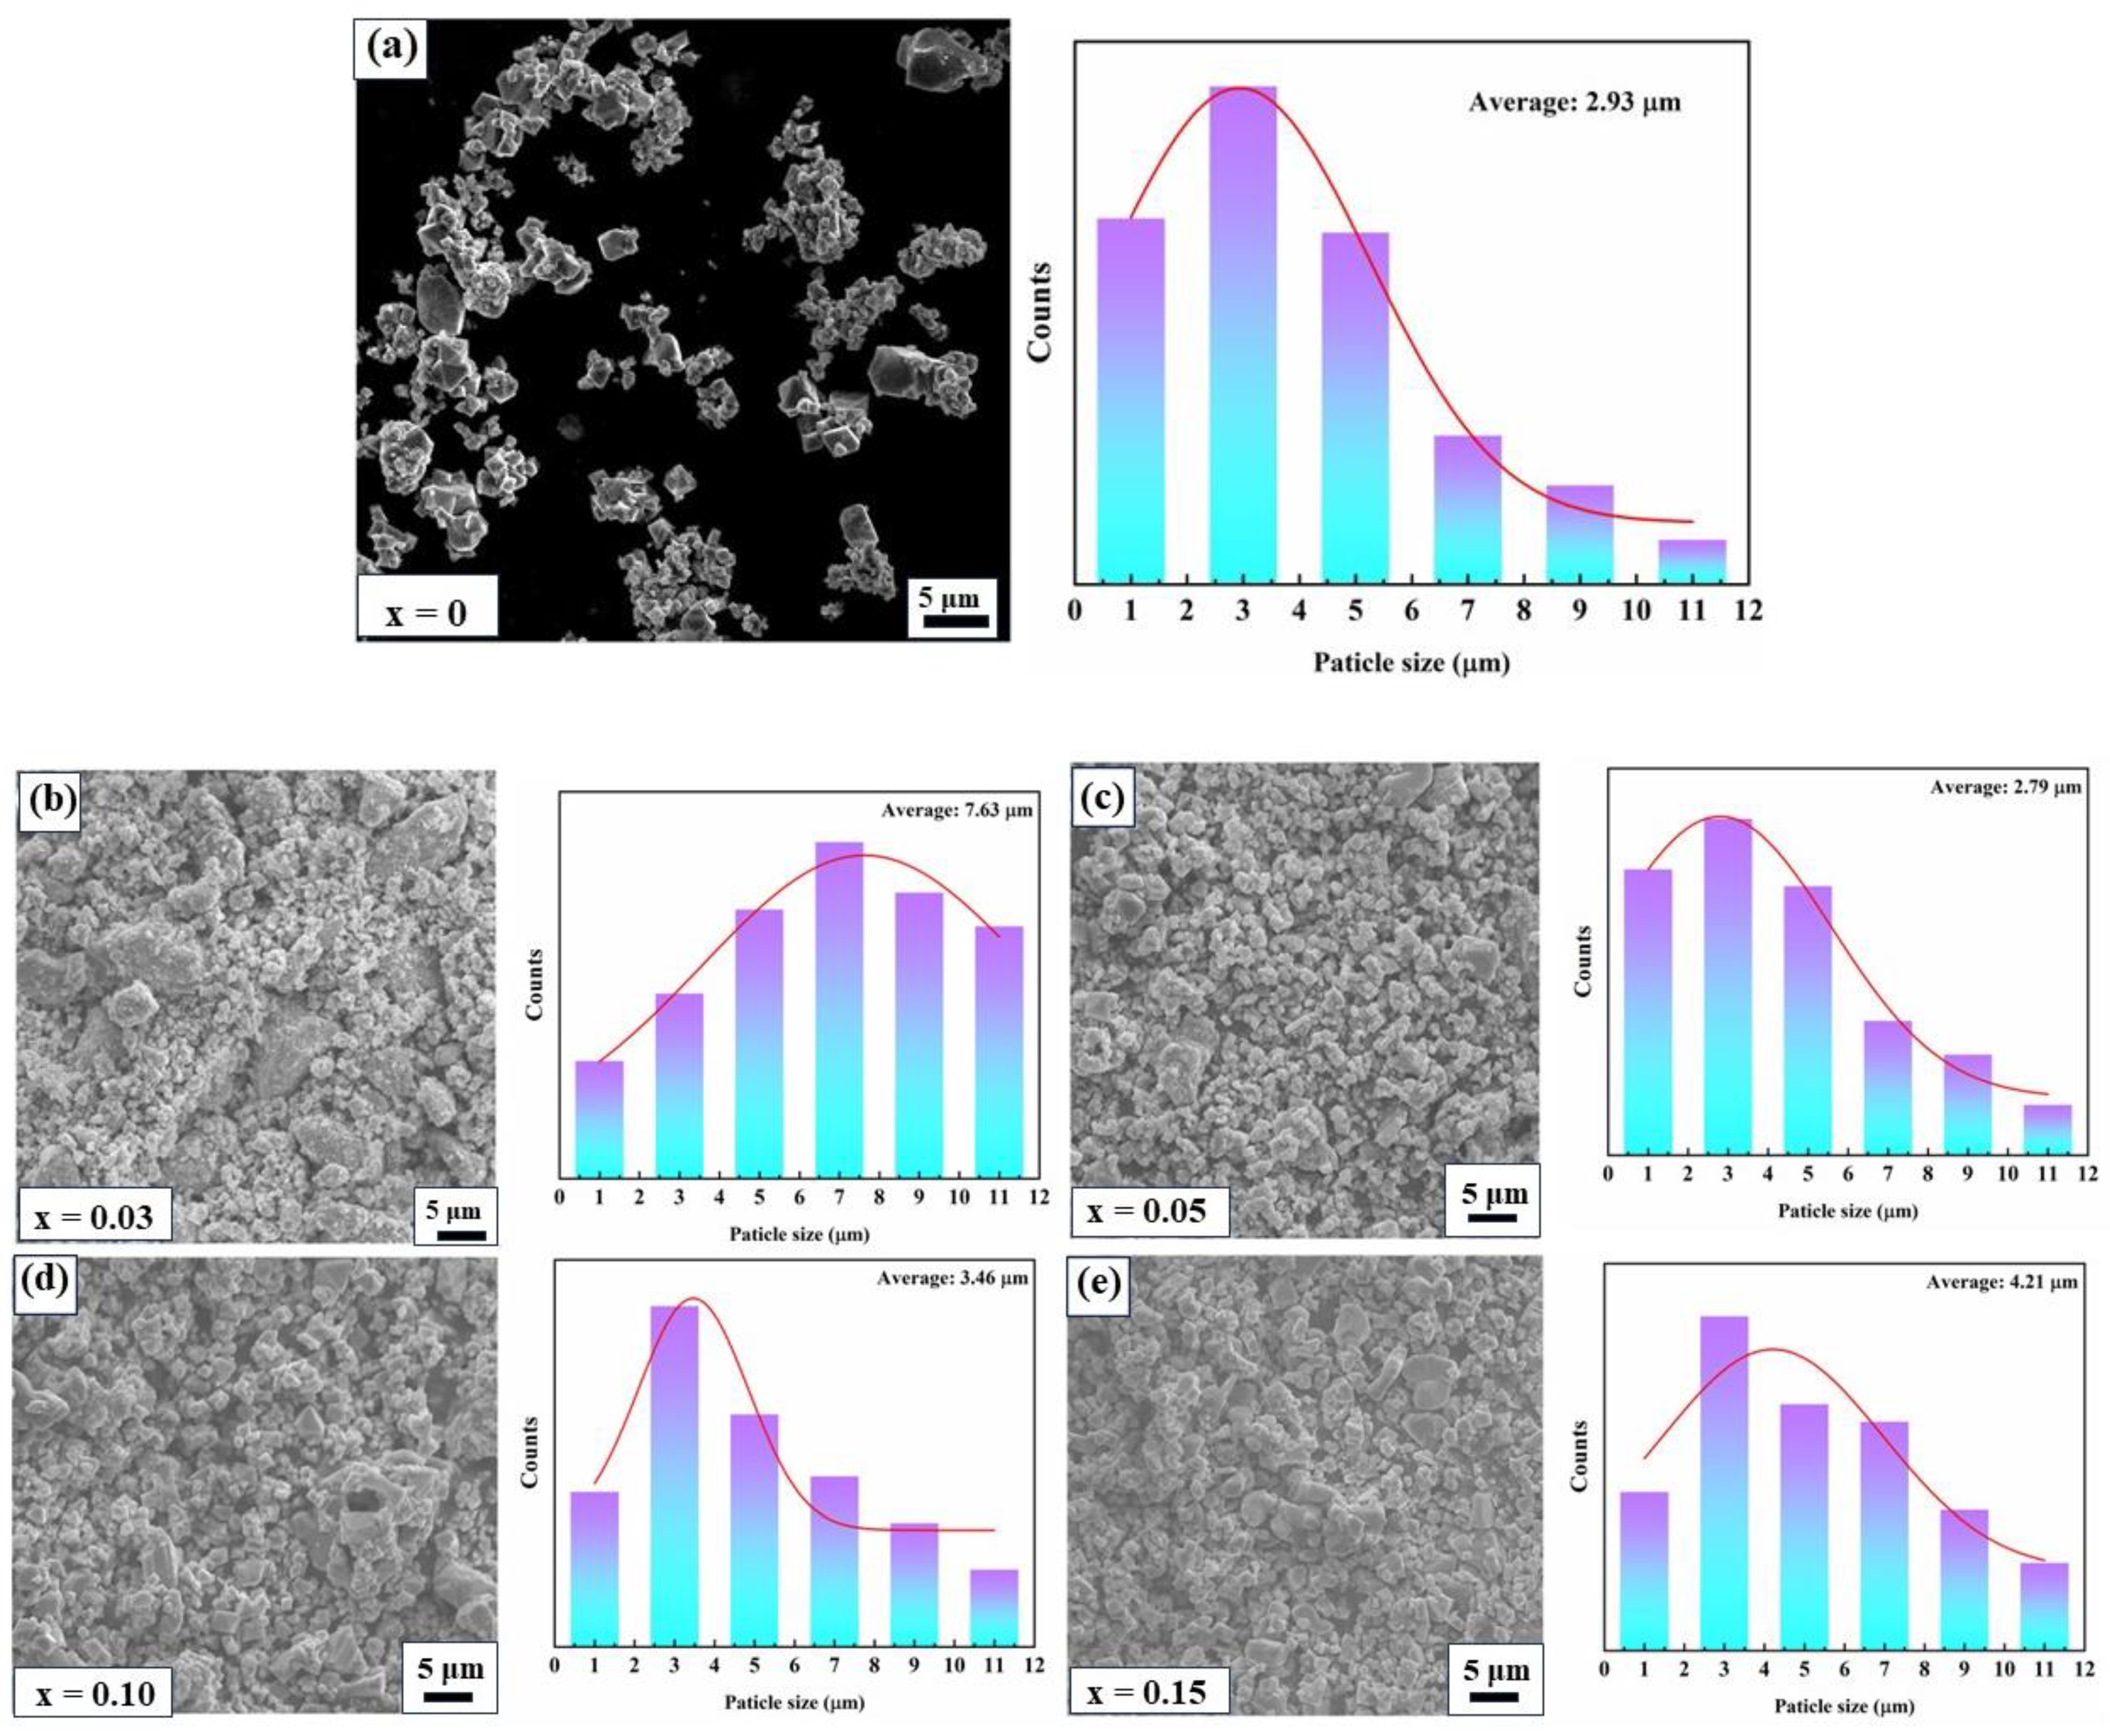
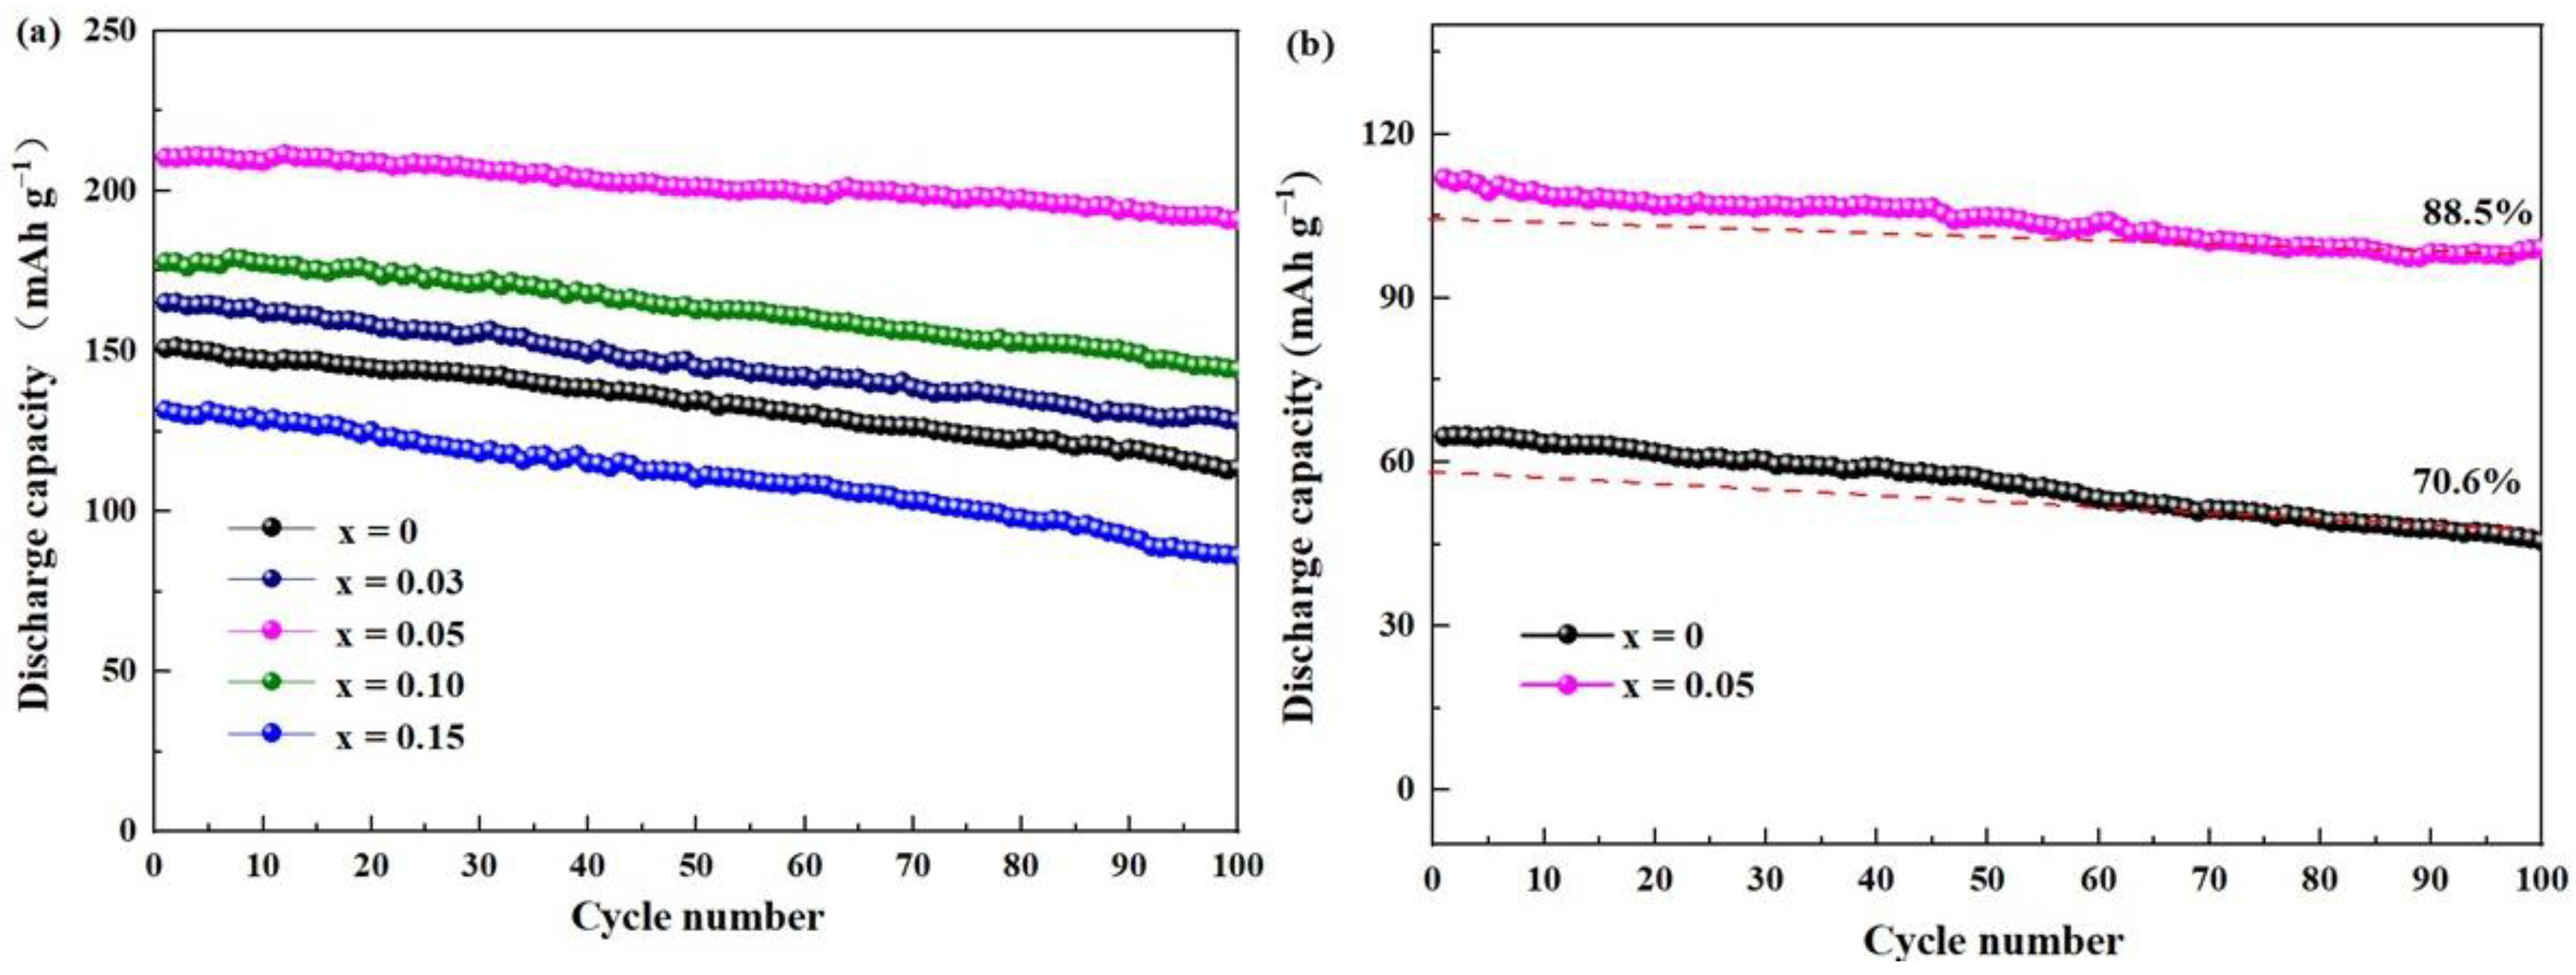
2. Results and Discussion
3. Experimental Methods
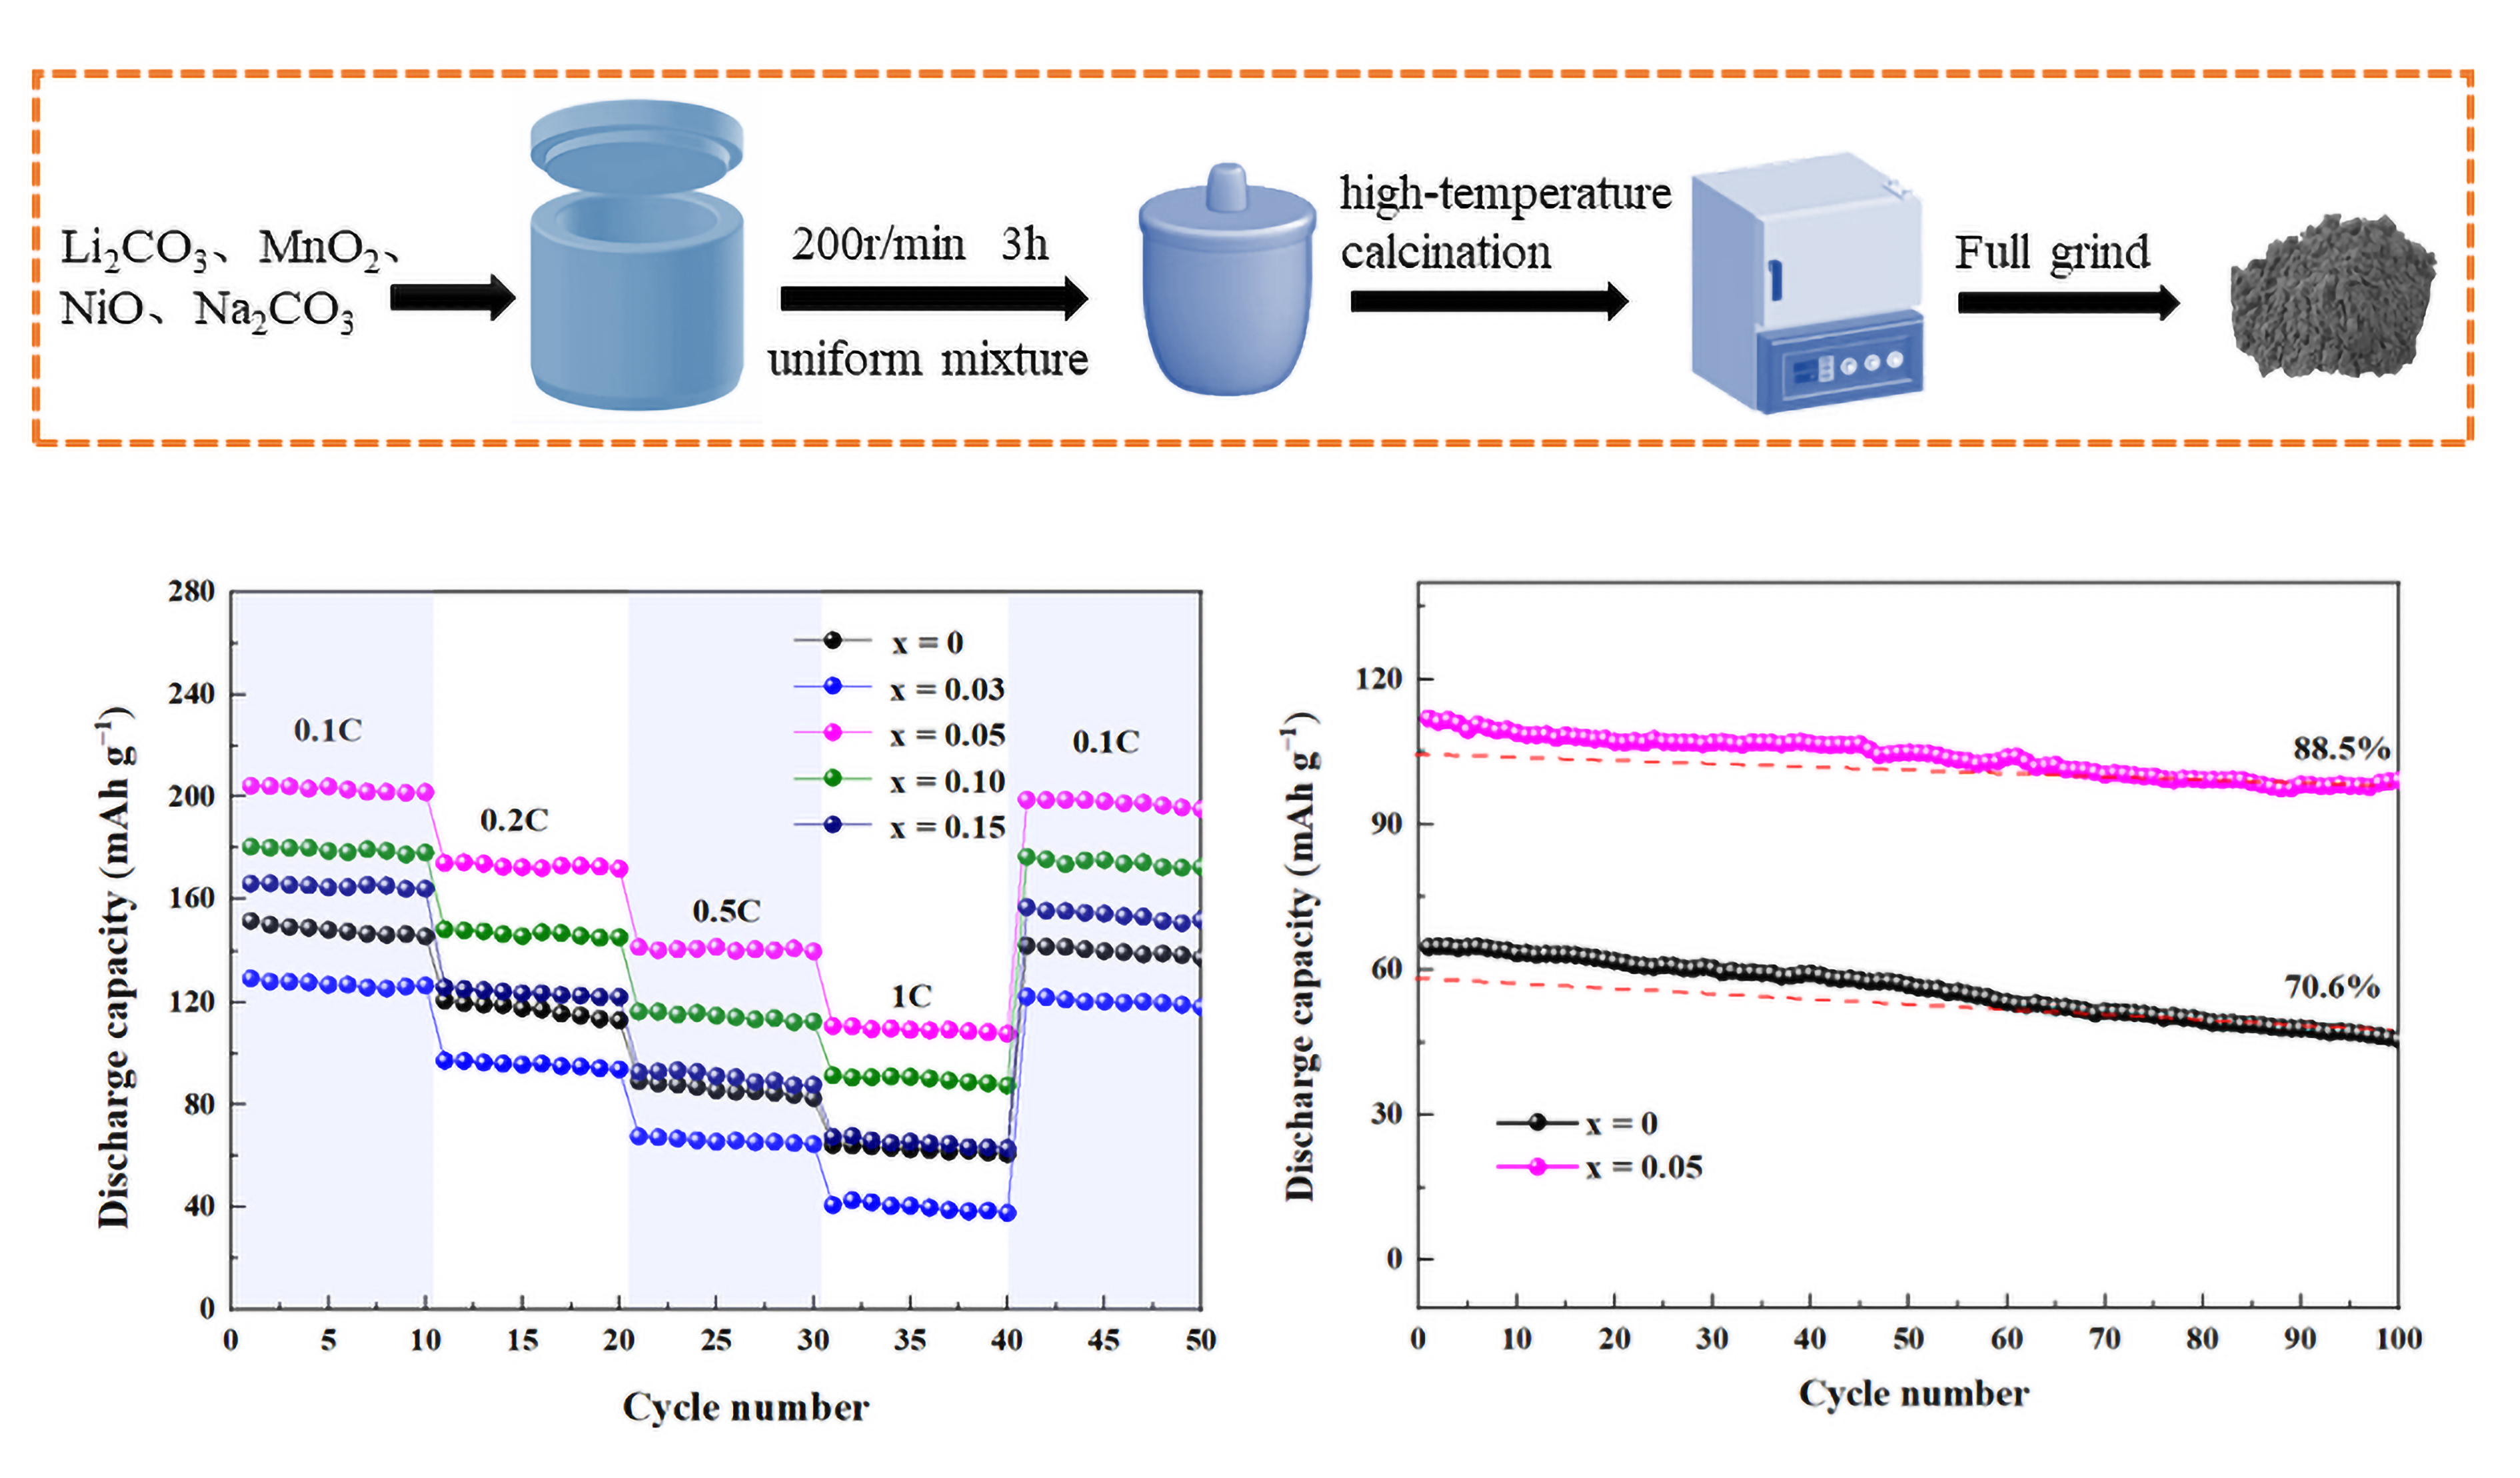
3.1. Preparation of Ti-Doped Li1.2Mn0.6Ni0.2O2 Cathode Material
3.2. Materials Characterization
3.3. Electrochemical Measurements
3.4. Computational Method
4. Conclusions
Author Contributions
Funding
Data Availability Statement
Conflicts of Interest
References
- Lu, J.; Chang, Y.L.; Song, B.; Xia, H.; Yang, J.R.; Lee, K.S.; Lu, L. High Energy Spinel-Structured Cathode Stabilized by Layered Materials for Advanced Lithium-Ion Batteries. J. Power Sources 2014, 271, 604–613. [Google Scholar] [CrossRef]
- Nitta, N.; Wu, F.; Lee, J.T.; Yushin, G. Li-Ion Battery Materials: Present and Future. Mater. Today 2015, 18, 252–264. [Google Scholar] [CrossRef]
- Li, P.; Luo, S.; Zhang, L.; Liu, Q.; Wang, Y.; Lin, Y.; Xu, C.; Guo, J.; Cheali, P.; Xia, X. Progress, Challenges, and Prospects of Spent Lithium-Ion Batteries Recycling: A Review. J. Energy Chem. 2024, 89, 144–171. [Google Scholar] [CrossRef]
- Sclar, H.; Maiti, S.; Sharma, R.; Erickson, E.M.; Grinblat, J.; Raman, R.; Talianker, M.; Noked, M.; Kondrakov, A.; Markovsky, B.; et al. Improved Electrochemical Behavior and Thermal Stability of Li and Mn-Rich Cathode Materials Modified by Lithium Sulfate Surface Treatment. Inorganics 2022, 10, 39. [Google Scholar] [CrossRef]
- Jung, Y.S.; Cavanagh, A.S.; Dillon, A.C.; Groner, M.D.; George, S.M.; Lee, S.-H. Enhanced Stability of LiCoO2 Cathodes in Lithium-Ion Batteries Using Surface Modification by Atomic Layer Deposition. J. Electrochem. Soc. 2009, 157, A75. [Google Scholar] [CrossRef]
- Yamada, A.; Hosoya, M.; Chung, S.-C.; Kudo, Y.; Hinokuma, K.; Liu, K.-Y.; Nishi, Y. Olivine-Type Cathodes: Achievements and Problems. J. Power Sources 2003, 119–121, 232–238. [Google Scholar] [CrossRef]
- Zhao, H.; Liu, S.; Liu, X.; Tan, M.; Wang, Z.; Cai, Y.; Komarneni, S. Orthorhombic LiMnO2 Nanorods as Cathode Materials for Lithium-Ion Batteries: Synthesis and Electrochemical Properties. Ceram. Int. 2016, 42, 9319–9322. [Google Scholar] [CrossRef]
- Niketic, S.; Yim, C.-H.; Zhou, J.; Wang, J.; Abu-Lebdeh, Y. Influence of Ti Substitution on Electrochemical Performance and Evolution of LiMn1.5−xNi0.5TixO4 (x = 0.05, 0.1, 0.3) as a High Voltage Cathode Material with a Very Long Cycle Life. Inorganics 2022, 10, 10. [Google Scholar] [CrossRef]
- Gyu Kim, M.; Jo, M.; Hong, Y.-S.; Cho, J. Template-Free Synthesis of Li[Ni0.25Li0.15Mn0.6]O2 Nanowires for High Performance Lithium Battery Cathode. Chem. Commun. 2009, 2, 218–220. [Google Scholar] [CrossRef]
- Wang, H.; Zhan, F.; Zhan, H.; Ming, X. Improve the Midpoint Voltage and Structural Stability of Li-Rich Manganese-Based Cathode Material by Increasing the Nickel Content. Catalysts 2022, 12, 584. [Google Scholar] [CrossRef]
- Gao, J.; Kim, J.; Manthiram, A. High Capacity Li[Li0.2Mn0.54Ni0.13Co0.13]O2–V2O5 Composite Cathodes with Low Irreversible Capacity Loss for Lithium Ion Batteries. Electrochem. Commun. 2009, 11, 84–86. [Google Scholar] [CrossRef]
- Lee, Y.; Kim, M.G.; Cho, J. Layered Li0.88[Li0.18Co0.33Mn0.49]O2 Nanowires for Fast and High Capacity Li-Ion Storage Material. Nano Lett. 2008, 8, 957–961. [Google Scholar] [CrossRef] [PubMed]
- Liu, J.; Reeja-Jayan, B.; Manthiram, A. Conductive Surface Modification with Aluminum of High Capacity Layered Li[Li0.2Mn0.54Ni0.13Co0.13]O2 Cathodes. J. Phys. Chem. C 2010, 114, 9528–9533. [Google Scholar] [CrossRef]
- Wang, Q.Y.; Liu, J.; Murugan, A.V.; Manthiram, A. High Capacity Double-Layer Surface Modified Li[Li0.2Mn0.54Ni0.13Co0.13]O2 Cathode with Improved Rate Capability. J. Mater. Chem. 2009, 19, 4965. [Google Scholar] [CrossRef]
- Li, Y.; Ben, L.; Yu, H.; Zhao, W.; Liu, X.; Huang, X. Stabilizing the (003) Facet of Micron-Sized LiNi0.6Co0.2Mn0.2O2 Cathode Material Using Tungsten Oxide as an Exemplar. Inorganics 2022, 10, 111. [Google Scholar] [CrossRef]
- Zhou, L.Z.; Xu, Q.J.; Liu, M.S.; Jin, X. Novel Solid-State Preparation and Electrochemical Properties of Li1.13[Ni0.2Co0.2Mn0.47]O2 Material with a High Capacity by Acetate Precursor for Li-Ion Batteries. Solid State Ion. 2013, 249–250, 134–138. [Google Scholar] [CrossRef]
- Lei, Y.; Ni, J.; Hu, Z.; Wang, Z.; Gui, F.; Li, B.; Ming, P.; Zhang, C.; Elias, Y.; Aurbach, D.; et al. Surface Modification of Li-Rich Mn-Based Layered Oxide Cathodes: Challenges, Materials, Methods, and Characterization. Adv. Energy Mater. 2020, 10, 2002506. [Google Scholar] [CrossRef]
- Guo, B.; Zhao, J.; Fan, X.; Zhang, W.; Li, S.; Yang, Z.; Chen, Z.; Zhang, W. Aluminum and Fluorine Co-Doping for Promotion of Stability and Safety of Lithium-Rich Layered Cathode Material. Electrochim. Acta 2017, 236, 171–179. [Google Scholar] [CrossRef]
- Dogan, F.; Croy, J.R.; Balasubramanian, M.; Slater, M.D.; Iddir, H.; Johnson, C.S.; Vaughey, J.T.; Key, B. Solid State NMR Studies of Li2MnO3 and Li-Rich Cathode Materials: Proton Insertion, Local Structure, and Voltage Fade. J. Electrochem. Soc. 2014, 162, A235. [Google Scholar] [CrossRef]
- Hu, E.; Yu, X.; Lin, R.; Bi, X.; Lu, J.; Bak, S.; Nam, K.-W.; Xin, H.L.; Jaye, C.; Fischer, D.A.; et al. Evolution of Redox Couples in Li- and Mn-Rich Cathode Materials and Mitigation of Voltage Fade by Reducing Oxygen Release. Nat. Energy 2018, 3, 690–698. [Google Scholar] [CrossRef]
- Xu, J.; Deshpande, R.D.; Pan, J.; Cheng, Y.-T.; Battaglia, V.S. Electrode Side Reactions, Capacity Loss and Mechanical Degradation in Lithium-Ion Batteries. J. Electrochem. Soc. 2015, 162, A2026–A2035. [Google Scholar] [CrossRef]
- He, W.; Yuan, D.; Qian, J.; Ai, X.; Yang, H.; Cao, Y. Enhanced High-Rate Capability and Cycling Stability of Na-Stabilized Layered Li1.2[Co0.13Ni0.13Mn0.54]O2 Cathode Material. J. Mater. Chem. A 2013, 1, 11397. [Google Scholar] [CrossRef]
- Venkatraman, S.; Choi, J.; Manthiram, A. Factors Influencing the Chemical Lithium Extraction Rate from Layered LiNi1−y−zCoyMnzO2 Cathodes. Electrochem. Commun. 2004, 6, 832–837. [Google Scholar] [CrossRef]
- Chen, Z.; Qin, Y.; Amine, K.; Sun, Y.-K. Role of Surface Coating on Cathode Materials for Lithium-Ion Batteries. J. Mater. Chem. 2010, 20, 7606. [Google Scholar] [CrossRef]
- Ding, Z.; Xu, M.; Liu, J.; Huang, Q.; Chen, L.; Wang, P.; Ivey, D.G.; Wei, W. Understanding the Enhanced Kinetics of Gradient-Chemical-Doped Lithium-Rich Cathode Material. ACS Appl. Mater. Interfaces 2017, 9, 20519–20526. [Google Scholar] [CrossRef]
- Li, Q.; Li, G.; Fu, C.; Luo, D.; Fan, J.; Li, L. K+-Doped Li1.2Mn0.54Co0.13Ni0.13O2: A Novel Cathode Material with an Enhanced Cycling Stability for Lithium-Ion Batteries. ACS Appl. Mater. Interfaces 2014, 6, 10330–10341. [Google Scholar] [CrossRef] [PubMed]
- Zheng, Z.; Guo, X.-D.; Zhong, Y.-J.; Hua, W.-B.; Shen, C.-H.; Chou, S.-L.; Yang, X.-S. Host Structural Stabilization of Li1.232Mn0.615Ni0.154O2 through K-Doping Attempt: Toward Superior Electrochemical Performances. Electrochim. Acta 2016, 188, 336–343. [Google Scholar] [CrossRef]
- He, W.; Liu, P.; Qu, B.; Zheng, Z.; Zheng, H.; Deng, P.; Li, P.; Li, S.; Huang, H.; Wang, L.; et al. Uniform Na+ Doping-Induced Defects in Li- and Mn-Rich Cathodes for High-Performance Lithium-Ion Batteries. Adv. Sci. 2019, 6, 1802114. [Google Scholar] [CrossRef] [PubMed]
- Lim, S.N.; Seo, J.Y.; Jung, D.S.; Ahn, W.; Song, H.S.; Yeon, S.-H.; Park, S.B. Rate Capability for Na-Doped Li1.167Ni0.18Mn0.548Co0.105O2 Cathode Material and Characterization of Li-Ion Diffusion Using Galvanostatic Intermittent Titration Technique. J. Alloys Compd. 2015, 623, 55–61. [Google Scholar] [CrossRef]
- Qing, R.; Shi, J.; Xiao, D.; Zhang, X.; Yin, Y.; Zhai, Y.; Gu, L.; Guo, Y. Enhancing the Kinetics of Li-Rich Cathode Materials through the Pinning Effects of Gradient Surface Na+ Doping. Adv. Energy Mater. 2016, 6, 1501914. [Google Scholar] [CrossRef]
- Makhonina, E.; Pechen, L.; Medvedeva, A.; Politov, Y.; Rumyantsev, A.; Koshtyal, Y.; Volkov, V.; Goloveshkin, A.; Eremenko, I. Effects of Mg Doping at Different Positions in Li-Rich Mn-Based Cathode Material on Electrochemical Performance. Nanomaterials 2022, 12, 156. [Google Scholar] [CrossRef]
- Xiang, Y.; Li, J.; Wu, X.; Liu, Z.; Xiong, L.; He, Z.; Yin, Z. Synthesis and Electrochemical Characterization of Mg-Doped Li-Rich Mn-Based Cathode Material. Ceram. Int. 2016, 42, 8833–8838. [Google Scholar] [CrossRef]
- Xu, H.; Deng, S.; Chen, G. Improved Electrochemical Performance of Li1.2Mn0.54Ni0.13Co0.13O2 by Mg Doping for Lithium Ion Battery Cathode Material. J. Mater. Chem. A 2014, 2, 15015–15021. [Google Scholar] [CrossRef]
- Jafta, C.J.; Ozoemena, K.I.; Mathe, M.K.; Roos, W.D. Synthesis, Characterisation and Electrochemical Intercalation Kinetics of Nanostructured Aluminium-Doped Li[Li0.2Mn0.54Ni0.13Co0.13]O2 Cathode Material for Lithium Ion Battery. Electrochim. Acta 2012, 85, 411–422. [Google Scholar] [CrossRef]
- Iftekhar, M.; Drewett, N.E.; Armstrong, A.R.; Hesp, D.; Braga, F.; Ahmed, S.; Hardwick, L.J. Characterization of Aluminum Doped Lithium-Manganese Rich Composites for Higher Rate Lithium-Ion Cathodes. J. Electrochem. Soc. 2014, 161, A2109–A2116. [Google Scholar] [CrossRef]
- Park, J.-H.; Lim, J.; Yoon, J.; Park, K.-S.; Gim, J.; Song, J.; Park, H.; Im, D.; Park, M.; Ahn, D.; et al. The Effects of Mo Doping on 0.3Li[Li0.33Mn0.67]O2·0.7Li[Ni0.5Co0.2Mn0.3]O2 Cathode Material. Dalton Trans. 2012, 41, 3053. [Google Scholar] [CrossRef]
- Ji, X.; Xu, Y.; Feng, H.; Wang, P.; Zhou, Y.; Song, J.; Xia, Q.; Tan, Q. Surface LiMn1.4Ni0.5Mo0.1O4 Coating and Bulk Mo Doping of Li-Rich Mn-Based Li1.2Mn0.54Ni0.13Co0.13O2 Cathode with Enhanced Electrochemical Performance for Lithium-Ion Batteries. ACS Appl. Mater. Interfaces 2021, 13, 47659–47670. [Google Scholar] [CrossRef]
- Lee, E.; Sun Park, J.; Wu, T.; Sun, C.-J.; Kim, H.; Stair, P.C.; Lu, J.; Zhou, D.; Johnson, C.S. Role of Cr3+/Cr6+ Redox in Chromium-Substituted Li2MnO3·LiNi1/2Mn1/2O2 Layered Composite Cathodes: Electrochemistry and Voltage Fade. J. Mater. Chem. A 2015, 3, 9915–9924. [Google Scholar] [CrossRef]
- Song, B.; Zhou, C.; Wang, H.; Liu, H.; Liu, Z.; Lai, M.O.; Lu, L. Advances in Sustain Stable Voltage of Cr-Doped Li-Rich Layered Cathodes for Lithium Ion Batteries. J. Electrochem. Soc. 2014, 161, A1723–A1730. [Google Scholar] [CrossRef]
- Kou, Y.; Han, E.; Zhu, L.; Liu, L.; Zhang, Z. The Effect of Ti Doping on Electrochemical Properties of Li1.167Ni0.4Mn0.383Co0.05O2 for Lithium-Ion Batteries. Solid State Ion. 2016, 296, 154–157. [Google Scholar] [CrossRef]
- Yamamoto, S.; Noguchi, H.; Zhao, W. Improvement of Cycling Performance in Ti Substituted 0.5Li2MnO3–0.5LiNi0.5Mn0.5O2 through Suppressing Metal Dissolution. J. Power Sources 2015, 278, 76–86. [Google Scholar] [CrossRef]
- Lu, Z.; MacNeil, D.D.; Dahn, J.R. Layered Cathode Materials Li[NixLi(1/3−2x/3)Mn(2/3−x/3)]O2 for Lithium-Ion Batteries. Electrochem. Solid-State Lett. 2001, 4, A191. [Google Scholar] [CrossRef]
- Zhu, H.; Li, J.; Chen, Z.; Li, Q.; Xie, T.; Li, L.; Lai, Y. Molten Salt Synthesis and Electrochemical Properties of LiNi1/3Co1/3Mn1/3O2 Cathode Materials. Synth. Met. 2014, 187, 123–129. [Google Scholar] [CrossRef]
- Santhanam, R.; Rambabu, B. High Rate Cycling Performance of Li1.05Ni1/3Co1/3Mn1/3O2 Materials Prepared by Sol–Gel and Co-Precipitation Methods for Lithium-Ion Batteries. J. Power Sources 2010, 195, 4313–4317. [Google Scholar] [CrossRef]
- Xu, B.; Fell, C.R.; Chi, M.; Meng, Y.S. Identifying Surface Structural Changes in Layered Li-Excess Nickel Manganese Oxides in High Voltage Lithium Ion Batteries: A Joint Experimental and Theoretical Study. Energy Environ. Sci. 2011, 4, 2223. [Google Scholar] [CrossRef]
- Gu, M.; Belharouak, I.; Zheng, J.; Wu, H.; Xiao, J.; Genc, A.; Amine, K.; Thevuthasan, S.; Baer, D.R.; Zhang, J.G.; et al. Formation of the Spinel Phase in the Layered Composite Cathode Used in Li-Ion Batteries. ACS Nano 2013, 7, 760–767. [Google Scholar] [CrossRef] [PubMed]
- Gao, Y.; Wang, X.; Ma, J.; Wang, Z.; Chen, L. Selecting Substituent Elements for Li-Rich Mn-Based Cathode Materials by Density Functional Theory (DFT) Calculations. Chem. Mater. 2015, 27, 3456–3461. [Google Scholar] [CrossRef]
- Qian, D.; Xu, B.; Chi, M.; Meng, Y.S. Uncovering the Roles of Oxygen Vacancies in Cation Migration in Lithium Excess Layered Oxides. Phys. Chem. Chem. Phys. 2014, 16, 14665–14668. [Google Scholar] [CrossRef]
- Okamoto, Y. Ambivalent Effect of Oxygen Vacancies on Li2MnO3: A First-Principles Study. J. Electrochem. Soc. 2011, 159, A152. [Google Scholar] [CrossRef]
- Kubota, K.; Kaneko, T.; Hirayama, M.; Yonemura, M.; Imanari, Y.; Nakane, K.; Kanno, R. Direct Synthesis of Oxygen-Deficient Li2MnO3−x for High Capacity Lithium Battery Electrodes. J. Power Sources 2012, 216, 249–255. [Google Scholar] [CrossRef]
- Zheng, J.; Yan, P.; Estevez, L.; Wang, C.; Zhang, J.-G. Effect of Calcination Temperature on the Electrochemical Properties of Nickel-Rich LiNi0.76Mn0.14Co0.10O2 Cathodes for Lithium-Ion Batteries. Nano Energy 2018, 49, 538–548. [Google Scholar] [CrossRef]


| Crystal Data | Li1.2Mn0.6Ni0.2O2 | Li1.2Mn0.55Ti0.05Ni0.2O2 |
|---|---|---|
| a (Å) | 2.85161 | 2.86661 |
| c (Å) | 14.27338 | 14.32345 |
| V (Å3) | 100.5166 | 101.9332 |
| c/a | 5.0054 | 4.9967 |
| Rwp (%) | 2.48 | 1.32 |
| Rp (%) | 1.54 | 0.77 |
| R-3m | 76.72 | 79.35 |
| C2/m | 23.28 | 20.65 |
| χ2(%) | 1.86 | 1.82 |
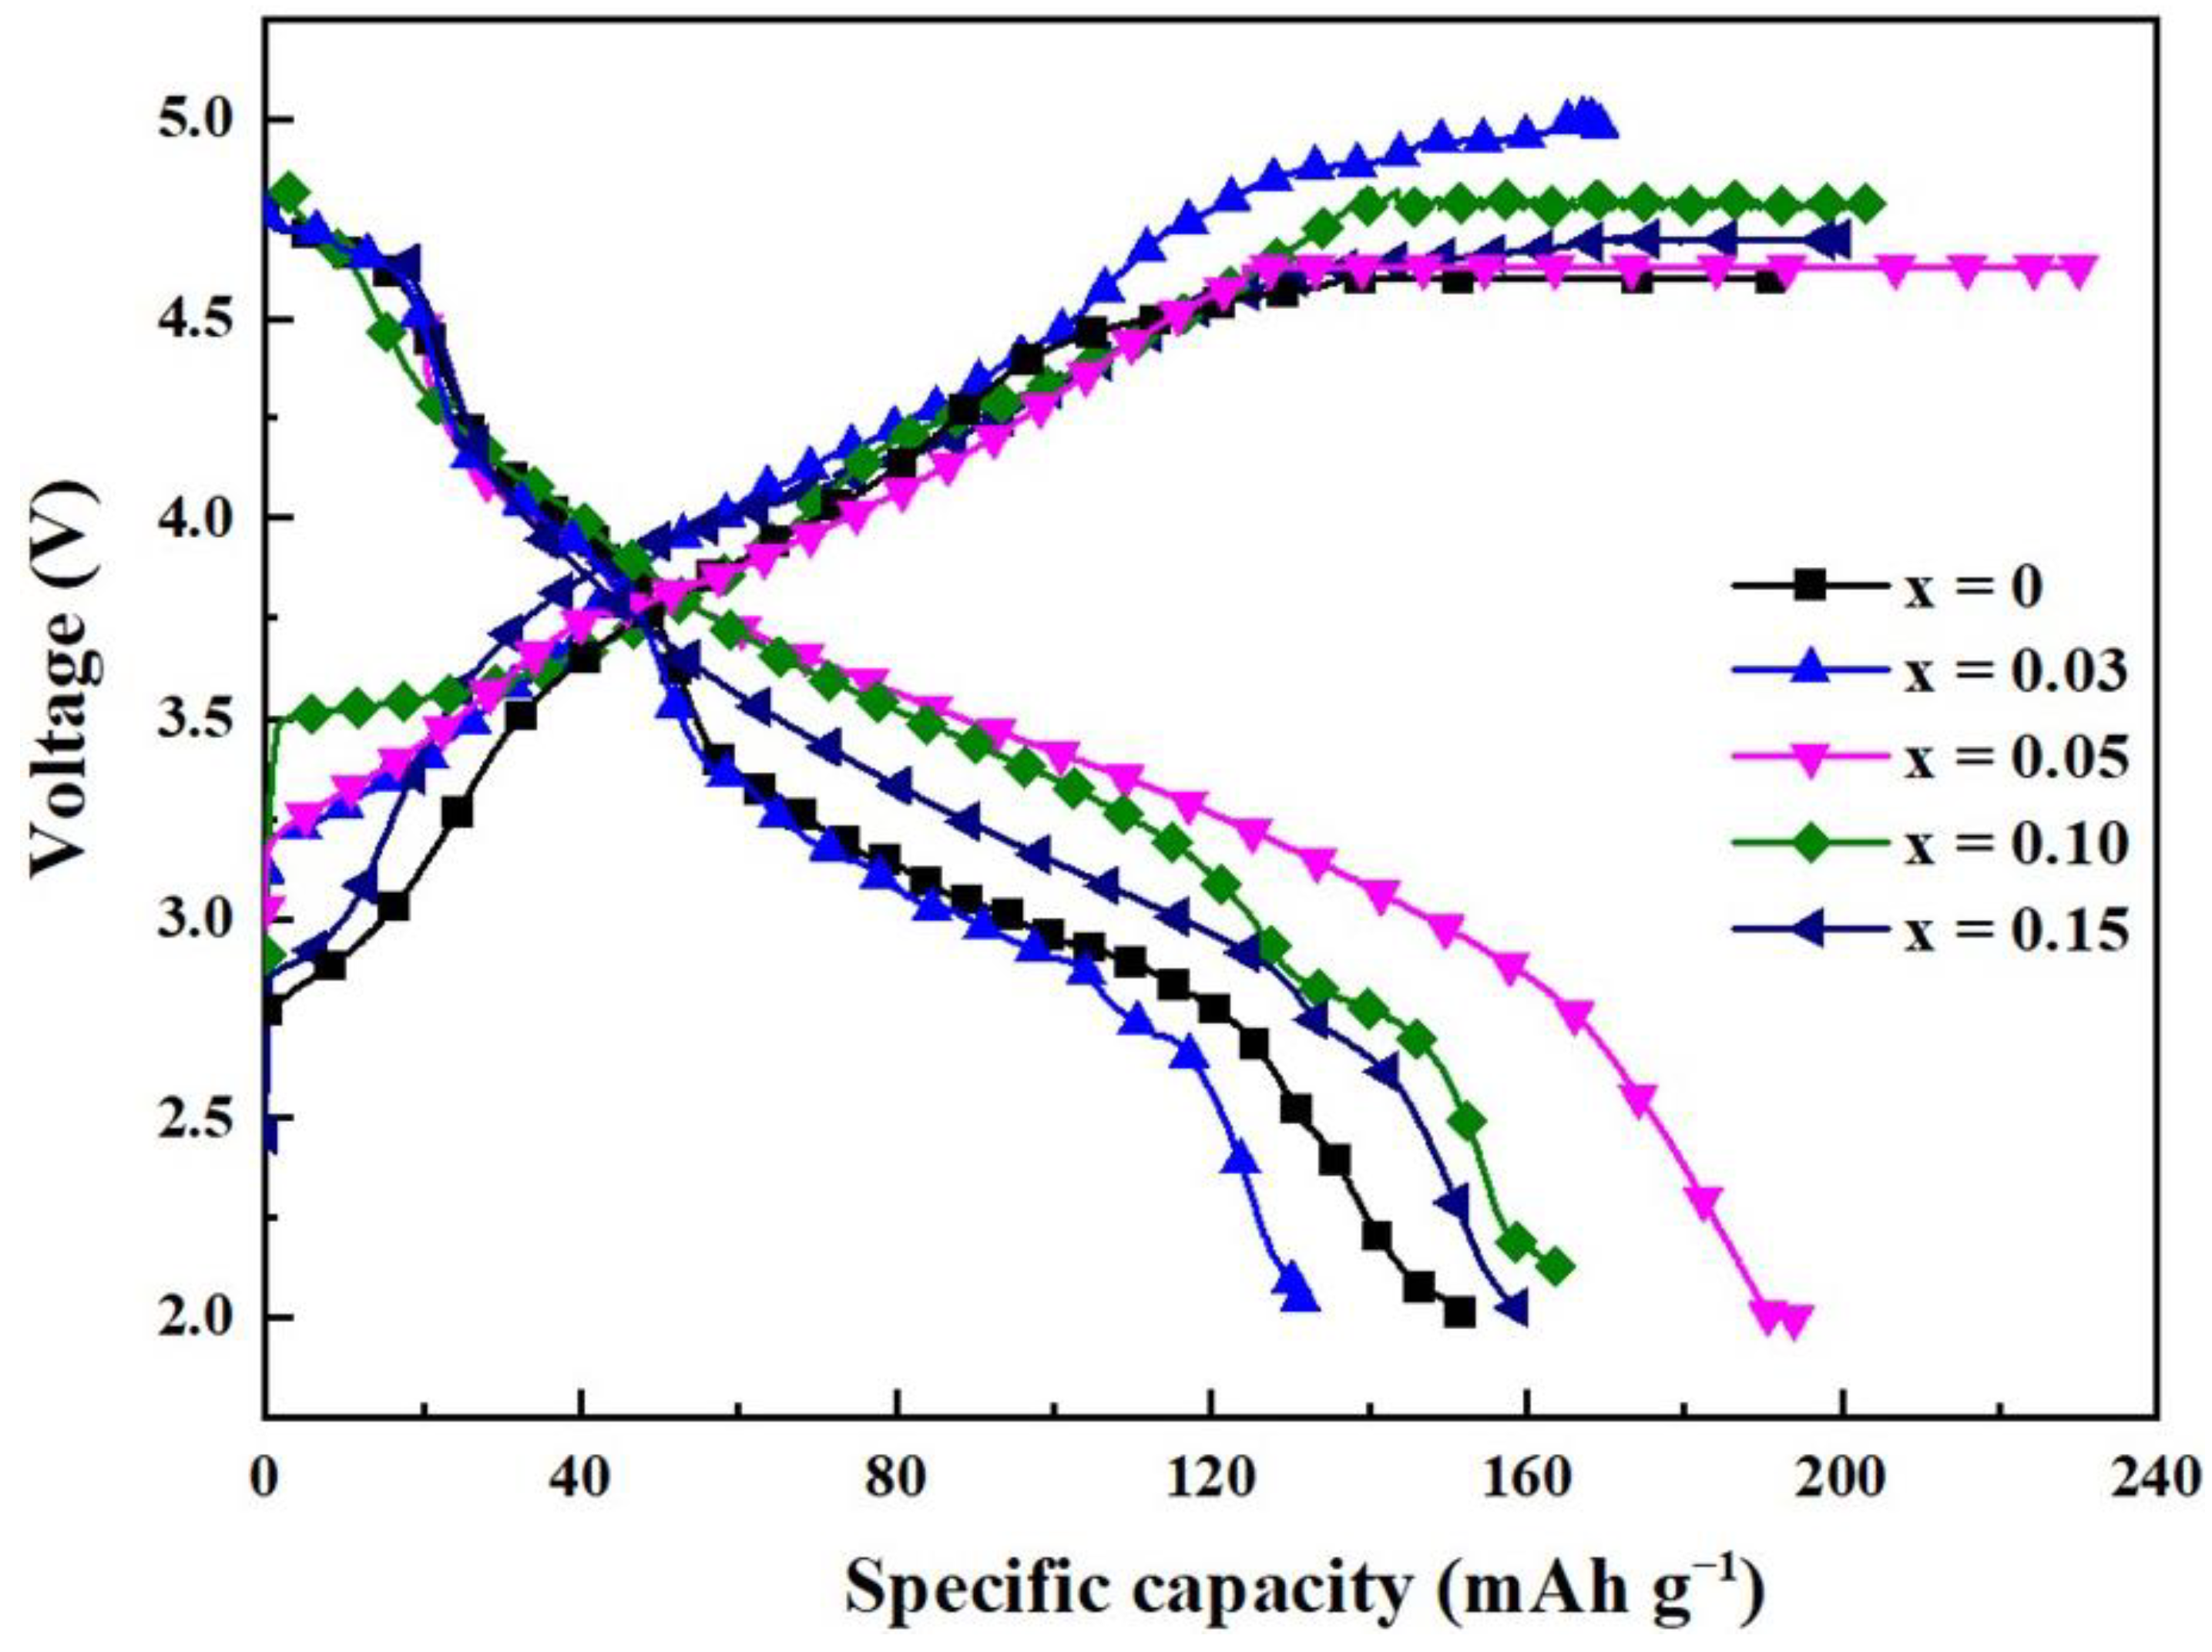
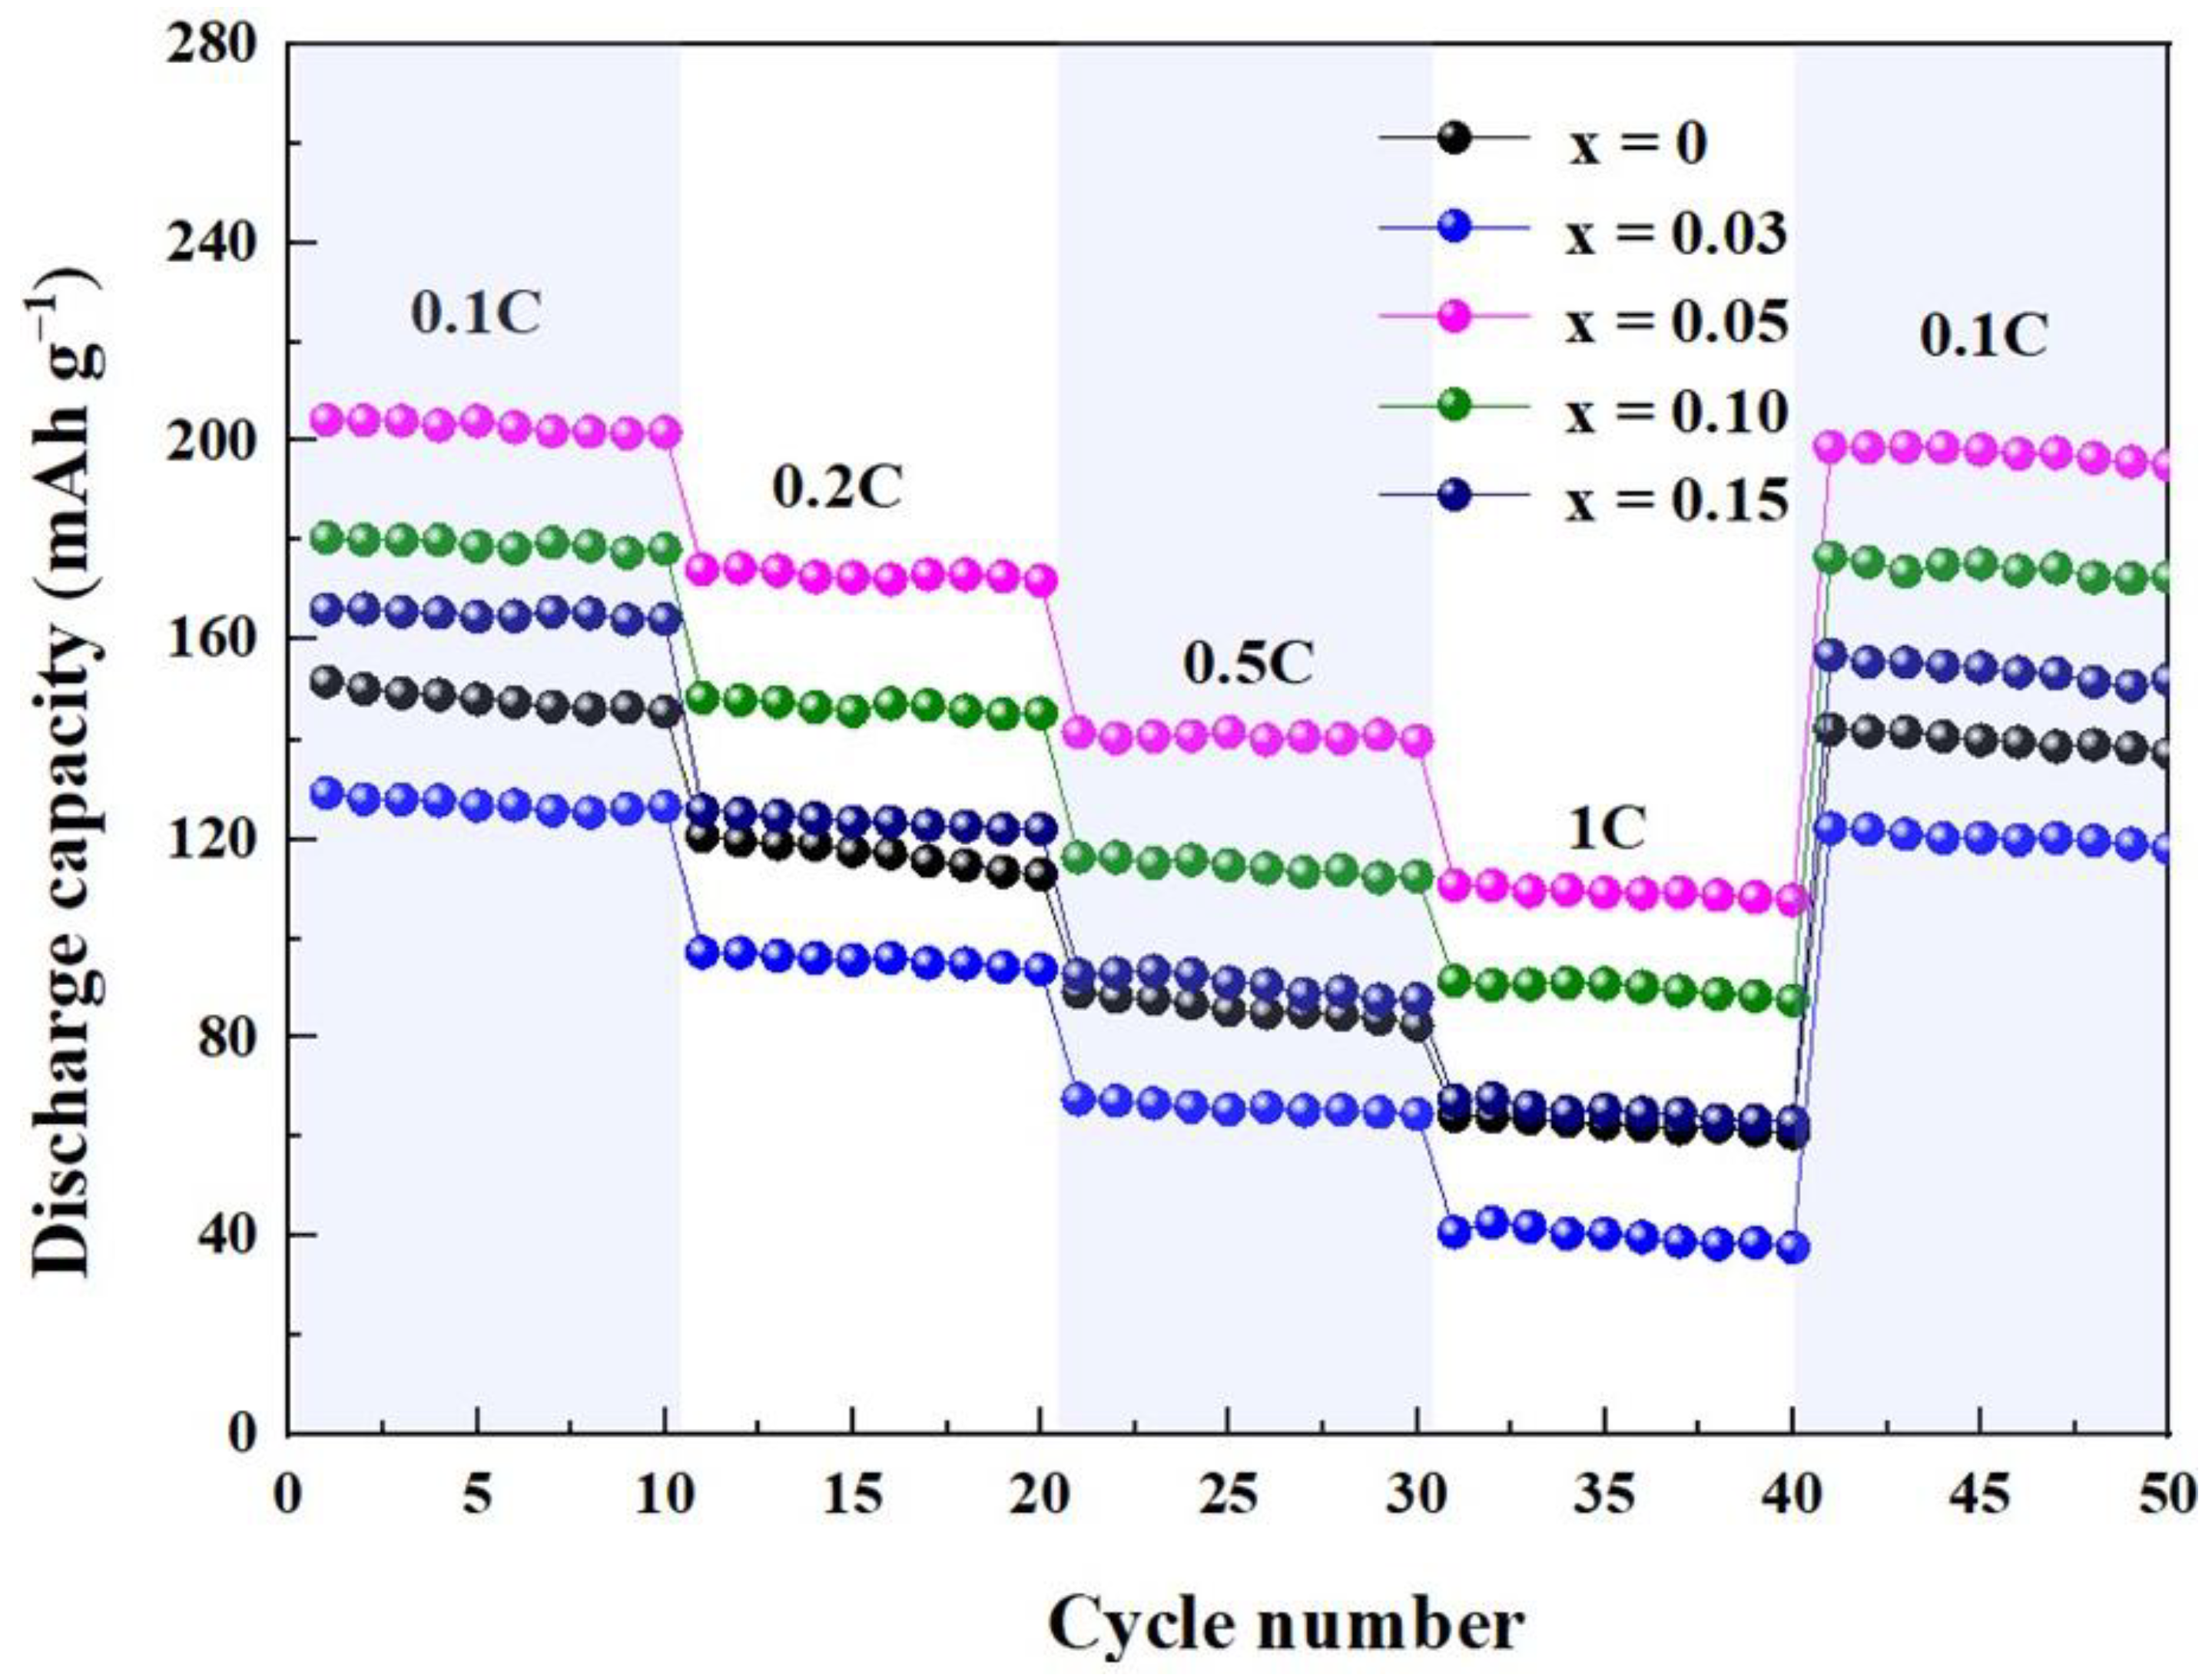
| Current Density Sample Specific Capacity/mAh·g−1 | 0.1C | 0.2C | 0.5C | 1C |
|---|---|---|---|---|
| Li1.2Mn0.6Ni0.2O2 | 151.7 | 120.6 | 89.2 | 64.3 |
| Li1.2Mn0.57Ti0.03Ni0.2O2 | 129.2 | 97.2 | 67.7 | 40.9 |
| Li1.2Mn0.55Ti0.05Ni0.2O2 | 204.3 | 174.2 | 141.4 | 110.7 |
| Li1.2Mn0.5Ti0.10Ni0.2O2 | 180.6 | 148.4 | 116.3 | 91.4 |
| Li1.2Mn0.45Ti0.15Ni0.2O2 | 166.2 | 125.8 | 92.7 | 67.5 |
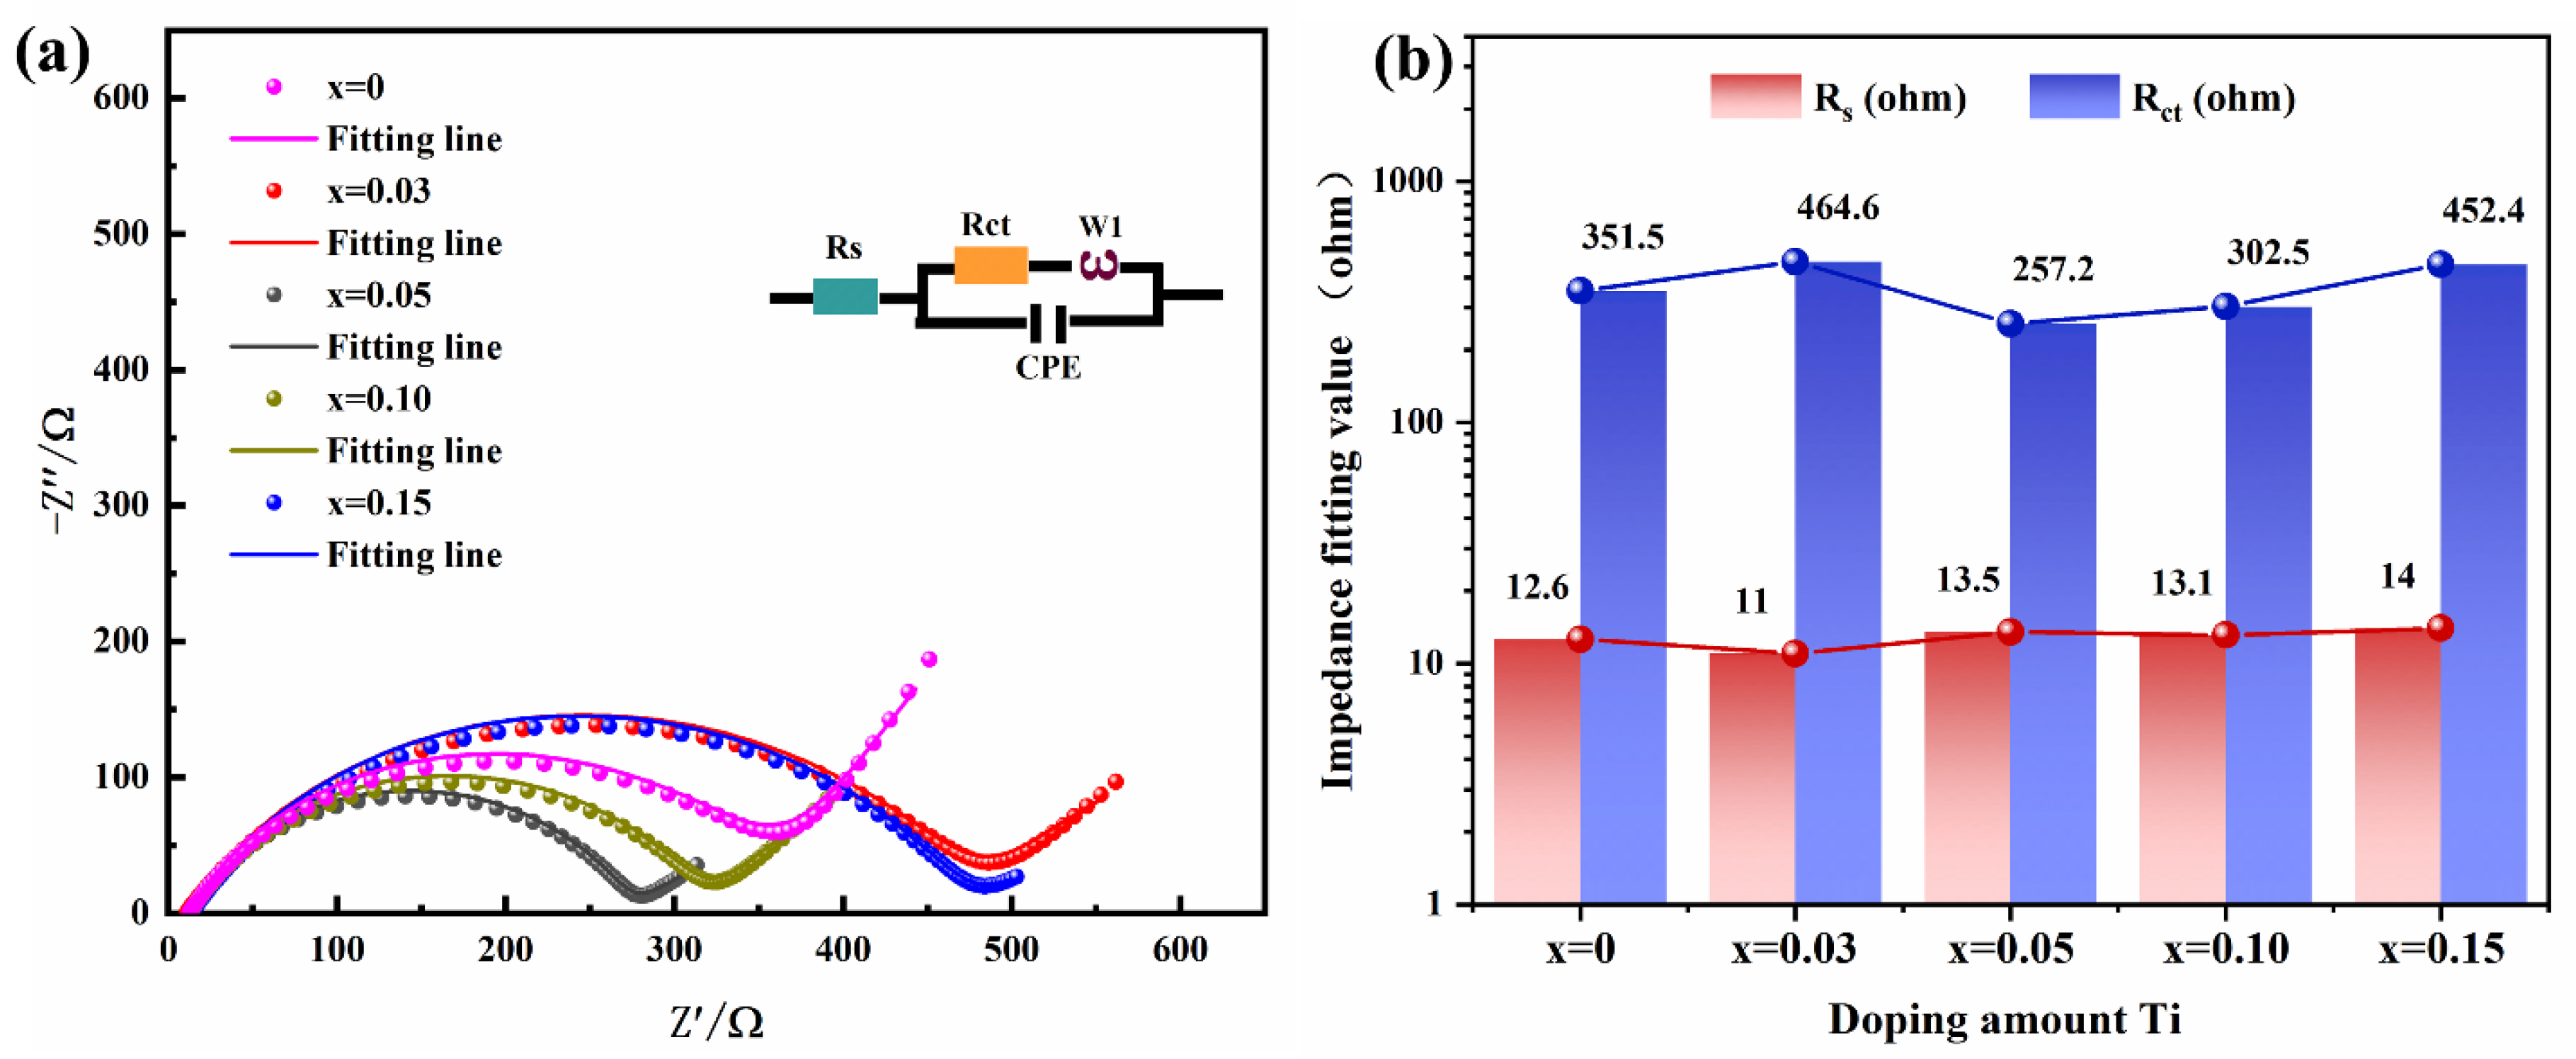
| Sample | x = 0 | x = 0.03 | x = 0.05 | x = 0.10 | x = 0.15 |
|---|---|---|---|---|---|
| σ (Ω s−1/2) | 23.00 | 20.22 | 9.08 | 18.09 | 12.01 |
| DLi+ (cm2s−1) | 2.72 × 10⁻¹⁰ | 3.52 × 10⁻¹⁰ | 1.74 × 10⁻¹⁰ | 4.39 × 10⁻¹⁰ | 9.96 × 10⁻¹⁰ |
Disclaimer/Publisher’s Note: The statements, opinions and data contained in all publications are solely those of the individual author(s) and contributor(s) and not of MDPI and/or the editor(s). MDPI and/or the editor(s) disclaim responsibility for any injury to people or property resulting from any ideas, methods, instructions or products referred to in the content. |
© 2024 by the authors. Licensee MDPI, Basel, Switzerland. This article is an open access article distributed under the terms and conditions of the Creative Commons Attribution (CC BY) license (https://creativecommons.org/licenses/by/4.0/).
Share and Cite
Liu, S.; Yan, X.; Li, P.; Tian, X.; Li, S.; Tao, Y.; Li, P.; Luo, S. Ti-Doped Co-Free Li1.2Mn0.6Ni0.2O2 Cathode Materials with Enhanced Electrochemical Performance for Lithium-Ion Batteries. Inorganics 2024, 12, 88. https://doi.org/10.3390/inorganics12030088
Liu S, Yan X, Li P, Tian X, Li S, Tao Y, Li P, Luo S. Ti-Doped Co-Free Li1.2Mn0.6Ni0.2O2 Cathode Materials with Enhanced Electrochemical Performance for Lithium-Ion Batteries. Inorganics. 2024; 12(3):88. https://doi.org/10.3390/inorganics12030088
Chicago/Turabian StyleLiu, Sining, Xin Yan, Pengyu Li, Xinru Tian, Sinan Li, Yunwen Tao, Pengwei Li, and Shaohua Luo. 2024. "Ti-Doped Co-Free Li1.2Mn0.6Ni0.2O2 Cathode Materials with Enhanced Electrochemical Performance for Lithium-Ion Batteries" Inorganics 12, no. 3: 88. https://doi.org/10.3390/inorganics12030088